Biochemical patterns of antibody polyreactivity revealed through a bioinformatics-based analysis of CDR loops
- Graduate Program in Biophysical Sciences, University of Chicago, United States
- Department of Biochemistry and Molecular Biology, University of Chicago, United States
- Department of Medicine, Section of Rheumatology, University of Chicago, United States
- Committee on Immunology, University of Chicago, United States
- Department of Pathology, University of Chicago, United States
Figures
Figure 1 with 5 supplements
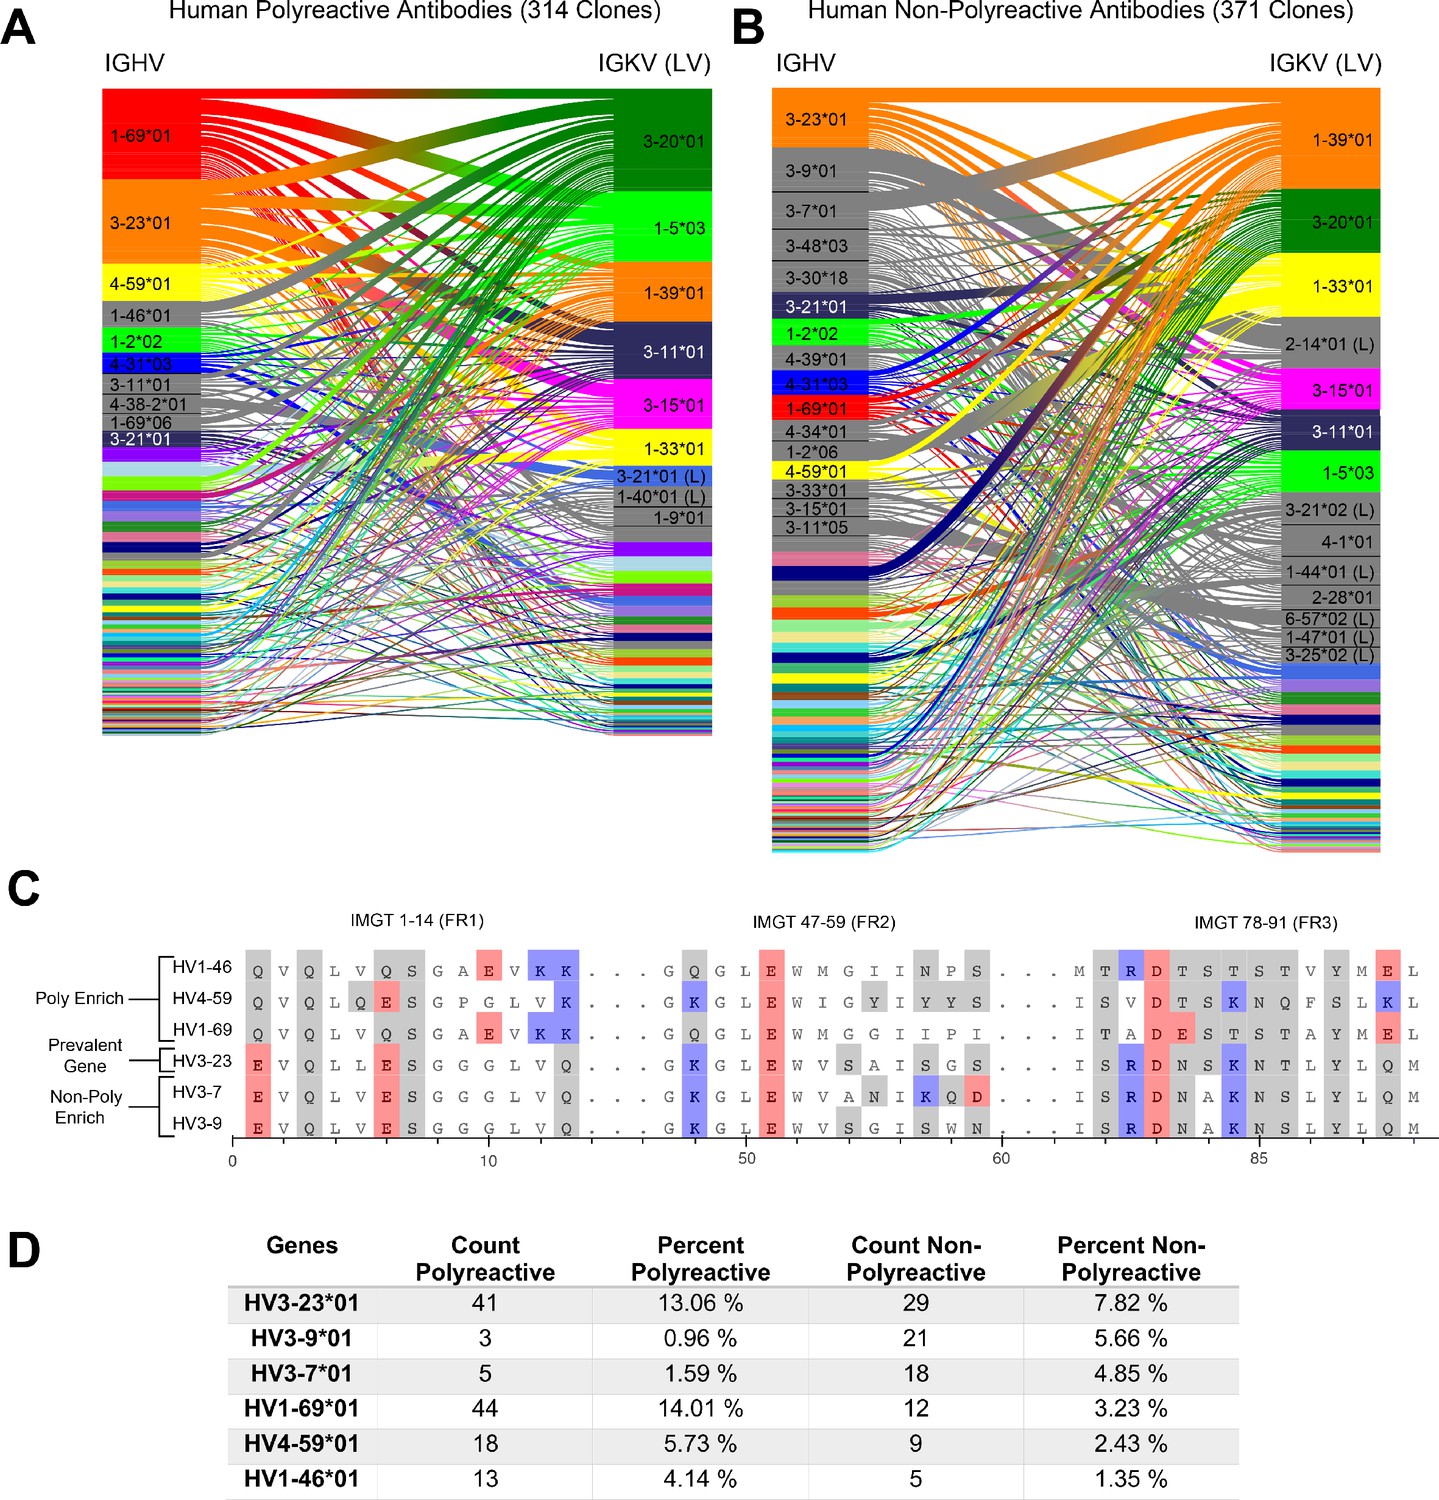
A comparative genetic analysis of human-derived polyreactive and non-polyreactive antibody sequences uncovers population level differences.
Gene usage diagrams comparing (A) human polyreactive and (B) non-polyreactive sequences show a qualitative difference in the VH gene usage. Shared colors indicate identical genes, gray indicates genes that are not seen in the other population at a level over 2%. Unlabeled genes are colored randomly to highlight genetic variation in the populations. (C) Sequence alignment of the most prevalent genes in the polyreactive and non-polyreactive populations compared to a reference gene common to each population. Hydrophobic amino acids are colored white, hydrophilic amino acids are colored gray, and positively or negatively charged amino acids are colored blue or red, respectively. (D) Percentage and raw count of observed gene usage for the polyreactive and non-polyreactive sequences.
Figure 1—figure supplement 1
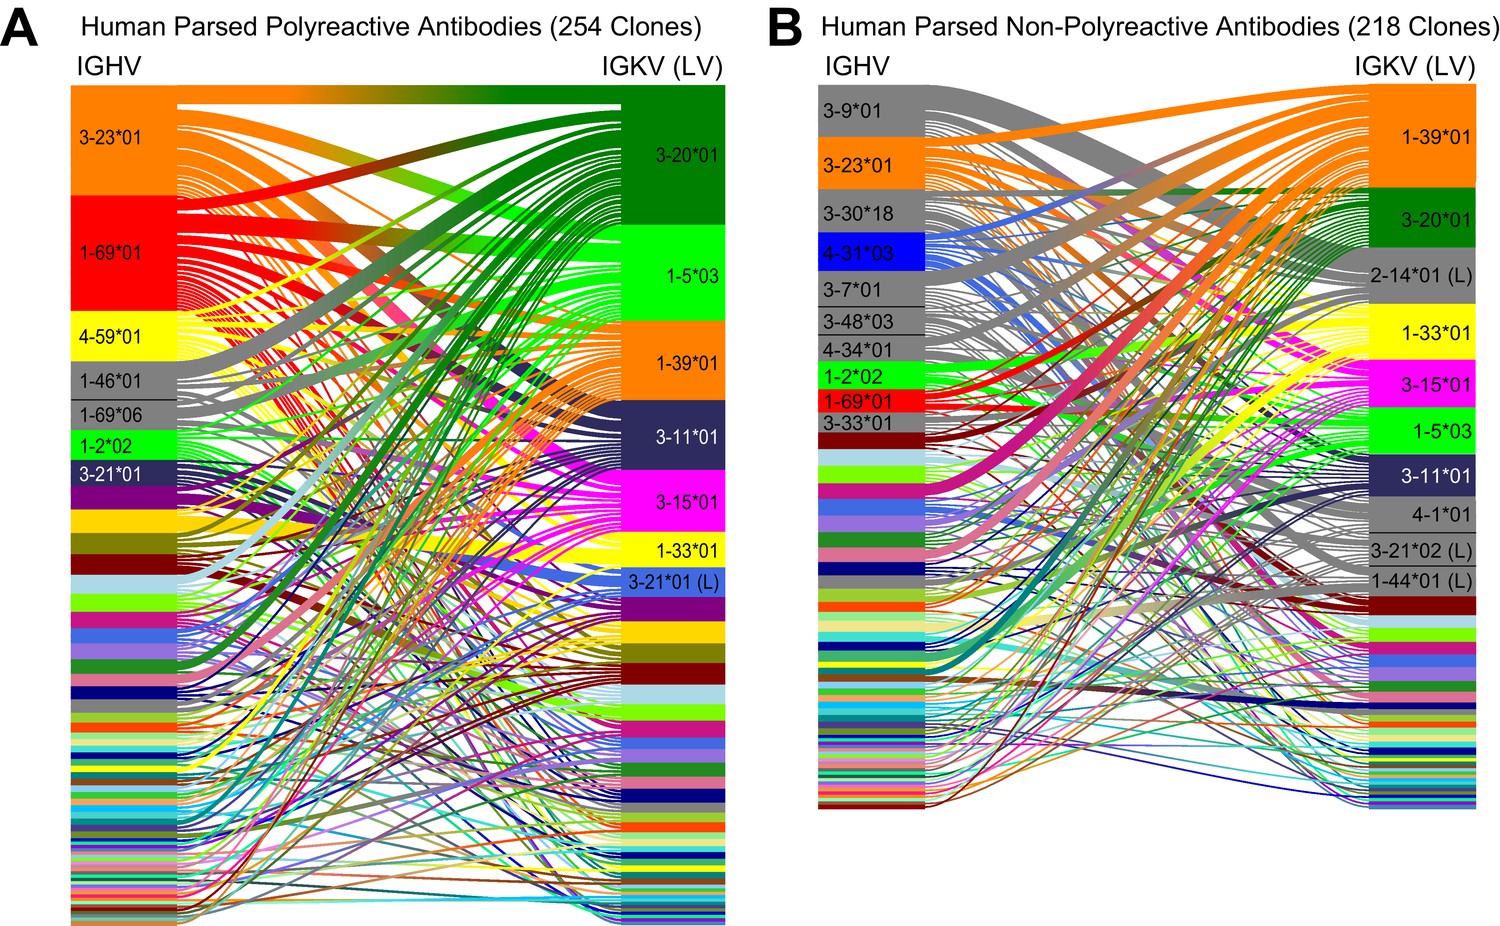
A comparative genetic analysis of the parsed human-derived polyreactive and non-polyreactive antibody sequences uncovers stronger population level differences.
Heavy chain gene usage plots comparing human polyreactive (A) and non-polyreactive (B) clones from the parsed dataset. Shared colors indicate identical genes, gray indicates genes that are not seen in the other population at a level over 2%. Unlabeled genes are colored randomly to highlight genetic variation in the populations.
Figure 1—figure supplement 2
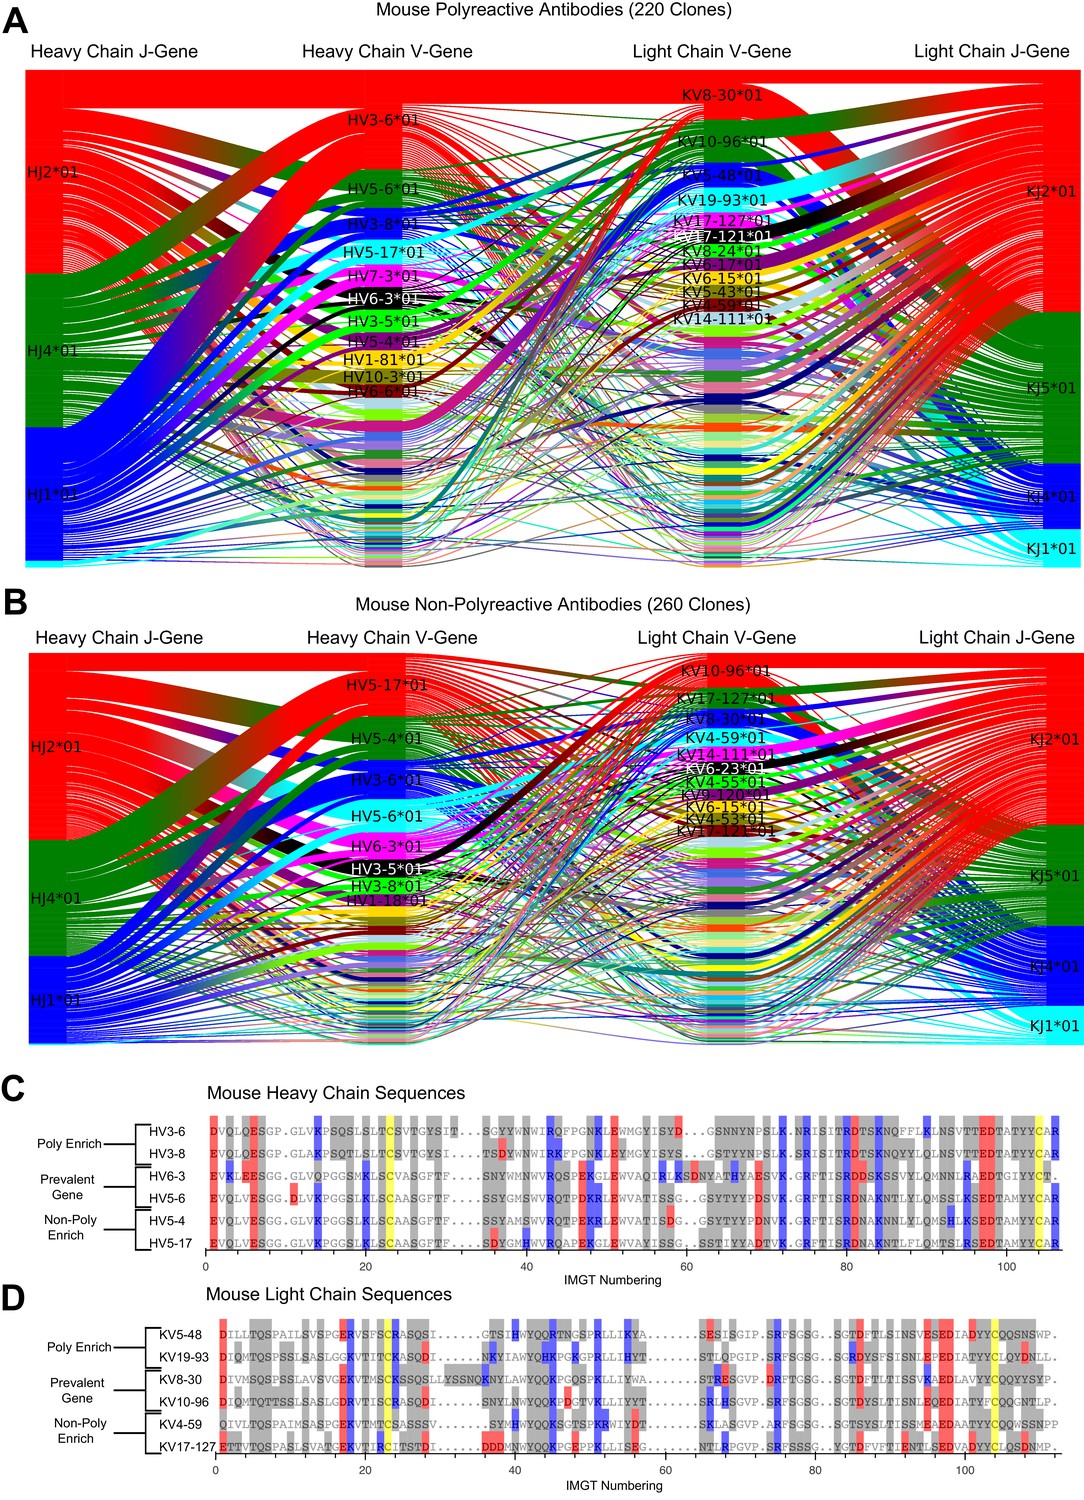
A comparative genetic analysis of the mouse-derived polyreactive and non-polyreactive antibody sequences uncovers population differences and a movement away from charged residues in heavy chain poly-enrich genes at IMGT positions 20, 47, 48, 69, and 95.
Gene usage plots comparing mouse polyreactive (A) and non-polyreactive clones (B) including J-gene usage. Colors represent the most commonly used genes in each individual dataset, with colors not necessarily consistent between panels. Sequence alignments comparing the amino acids of these most common genes for polyreactive and non-polyreactive mouse antibodies for the heavy chain (C) and the light chain (D). Prevalent genes are present in both populations. Cysteine is colored yellow, hydrophobic amino acids are colored white, hydrophilic amino acids are colored gray, and positively or negatively charged amino acids are colored blue or red, respectively.
Figure 1—figure supplement 3
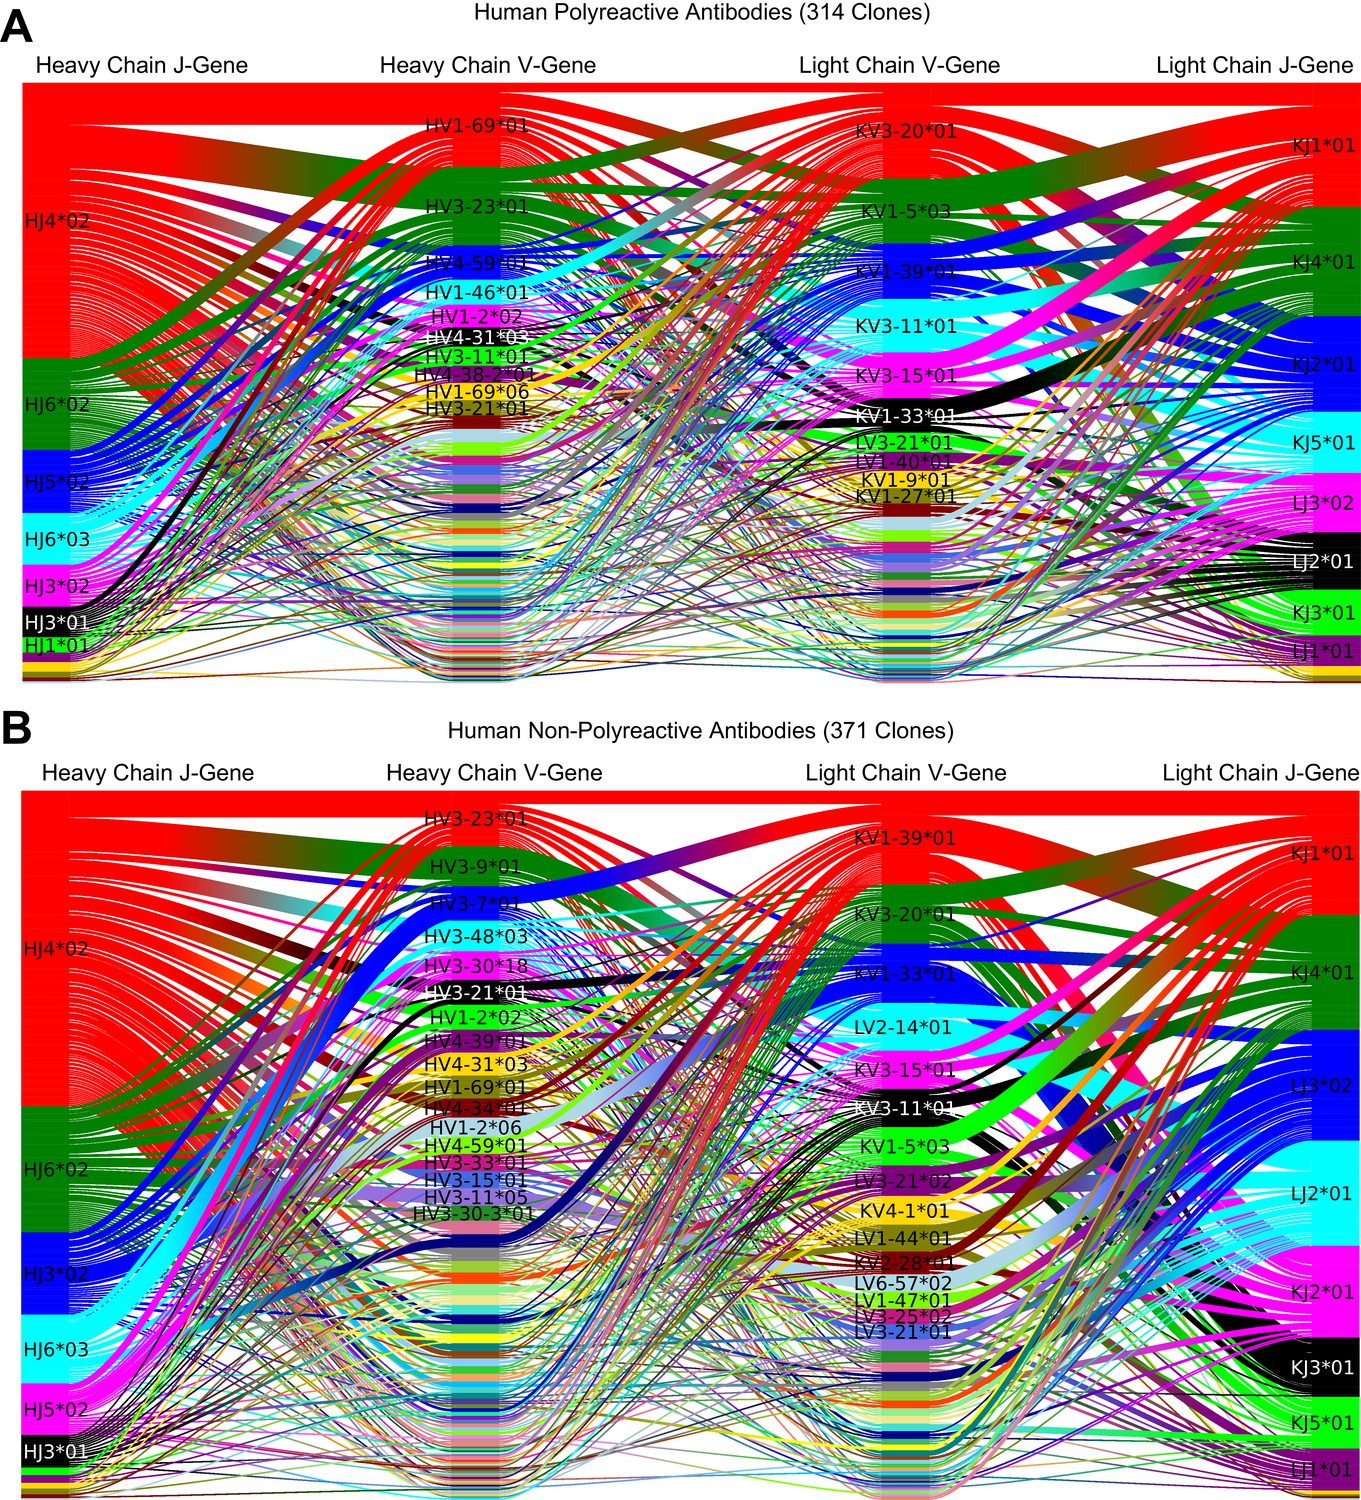
Data from Figure 1A and B including J-gene usage, using default TCRdist color scheme.
Gene usage plots comparing human polyreactive (A) and non-polyreactive clones (B). Colors represent the most commonly used genes in each individual dataset, with colors not necessarily consistent between panels.
Figure 1—figure supplement 4
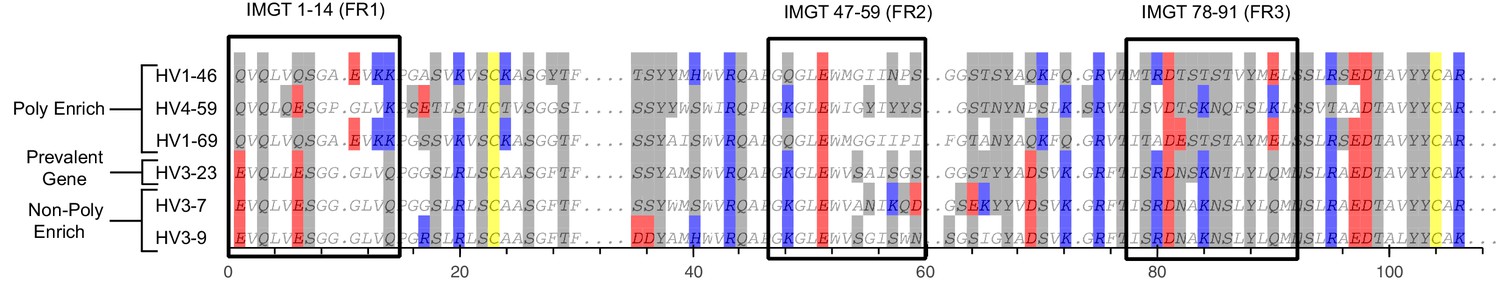
Sequence alignment from Figure 1C, including the full amino acid sequences of each heavy chain gene.
Alignment uses IMGT numbering scheme and displays the entirety of the heavy chain variable gene’s amino acid sequence. Boxes represent the sections highlighted in Figure 1C. Cysteine is colored yellow, hydrophobic amino acids are colored white, hydrophilic amino acids are colored gray, and positively or negatively charged amino acids are colored blue or red, respectively.
Figure 1—figure supplement 5

The raw count of amino acids found in polyreactive and non-polyreactive antibody sequences shows no notable differences.
Amino acid usage plot highlighting the occurrence of each amino acid in non-polyreactive (A) and polyreactive (B) CDR loops. Each line represents an individual clone, and each point along the line represents the count of each amino in that given clone. Black dots represent the average counts per clone.
Figure 2 with 1 supplement
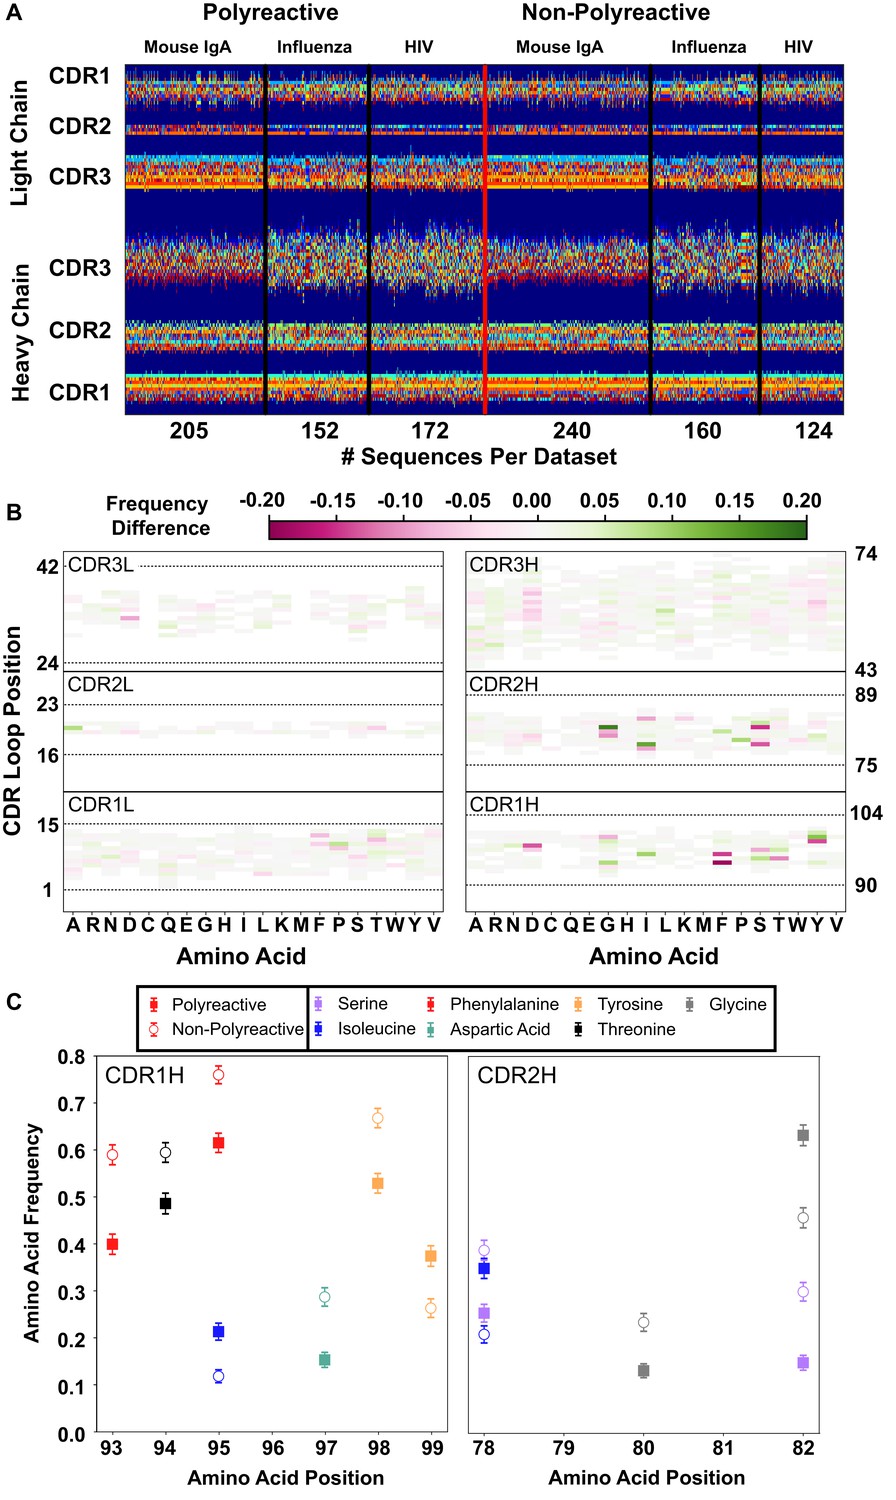
A new representation of CDR loop sequences improves the position-sensitivity of quantitative antibody analysis.
(A) Matrix representation of the amino acid sequences used in this study provides a framework for further analysis. Each amino acid is encoded as a number from 1 to 21, represented by a distinct color in the matrix. A 0-value is used as a buffer between loops and is represented by the dark blue regions. The red line separates polyreactive and non-polyreactive sequences. (B) Amino acid frequency difference between polyreactive and non-polyreactive sequences for all six CDR loops. Residues more common in polyreactive sequences are shown in green, while those more common in non-polyreactive sequences are shown in pink. Loop positions correspond to the numerical position within the matrix of panel (A). (C) An in-depth representation highlighting the amino acid frequencies used to create panel (B). Only frequency changes greater than 10% are shown for clarity.
Figure 2—figure supplement 1

Identical analysis to that in Figure 2 using the parsed dataset displays more pronounced differences between polyreactive and non-polyreactive antibodies.
(A) Matrix representation of the amino acid sequences used in this study provides a framework for further analysis. Each amino acid is encoded as a number from 1 to 21, represented by a distinct color in the matrix. A 0-value is used as a buffer between loops and is represented by the dark blue regions. The red line separates polyreactive and non-polyreactive sequences. (B) Amino acid frequency difference between polyreactive and non-polyreactive sequences for all six CDR loops. Residues more common in polyreactive sequences are shown in green, while those more common in non-polyreactive sequences are shown in pink. Loop positions correspond to the numerical position within the matrix of panel (A). (C) An in-depth representation highlighting the amino acid frequencies used to create panel (B). Only frequency changes greater than 10% are shown for clarity.
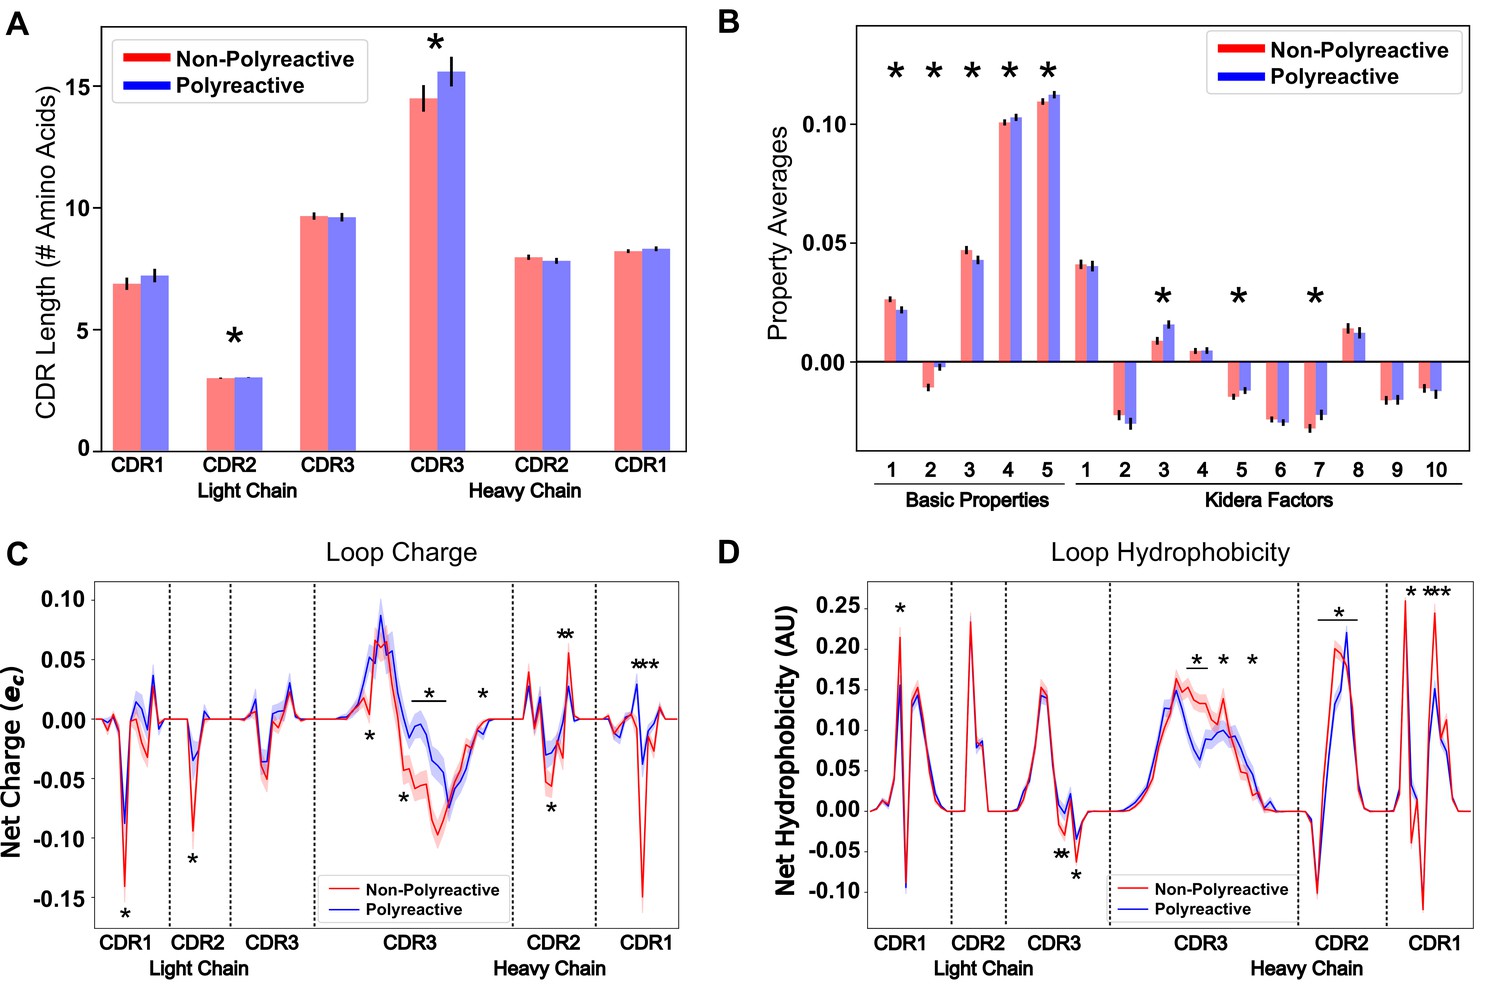
Figure 3 with 2 supplements

Position-sensitive quantification of CDR loop properties of mouse and human antibody sequences highlights differences between polyreactive and non-polyreactive populations.
Plotting the average CDR loop lengths (A) and net antibody biophysical properties (B) show small but significant differences when analyzed in bulk. Basic properties 1–5 are hydrophobicity1, charge, hydrophobicity2, side chain flexibility, and side chain bulk. Plotting the average net charge (C) and hydrophobicity (D) as a function of position of polyreactive and non-polyreactive sequences highlights significant differences in CDR3H. Light shadow around lines represent bootstrap standard errors. All uncertainties obtained via bootstrapping. Stars indicate p-value ≤ 0.05 calculated via nonparametric Studentized bootstrap test. Bars with a single star above represent contiguous regions of significance. p-values in panels (A) and (B) corrected for multiple tests using the Bonferroni correction.
Figure 3—figure supplement 1
Identical analysis to that in Figure 3 using the parsed dataset displays more pronounced differences between polyreactive and non-polyreactive antibodies.
Plotting the average CDR loop lengths (A) and net antibody biophysical properties (B) show small but significant differences when analyzed in bulk. Basic properties 1–5 are hydrophobicity1, charge, hydrophobicity2, side chain flexibility, and side chain bulk. Plotting the average net charge (C) and hydrophobicity (D) as a function of position of polyreactive and non-polyreactive sequences highlights significant differences in CDR3H. Light shadow around lines represent bootstrap standard errors. All uncertainties obtained via bootstrapping. Stars indicate p-value ≤ 0.05 calculated via nonparametric Studentized bootstrap test. Bars with a single star above represent contiguous regions of significance.
Figure 3—figure supplement 2
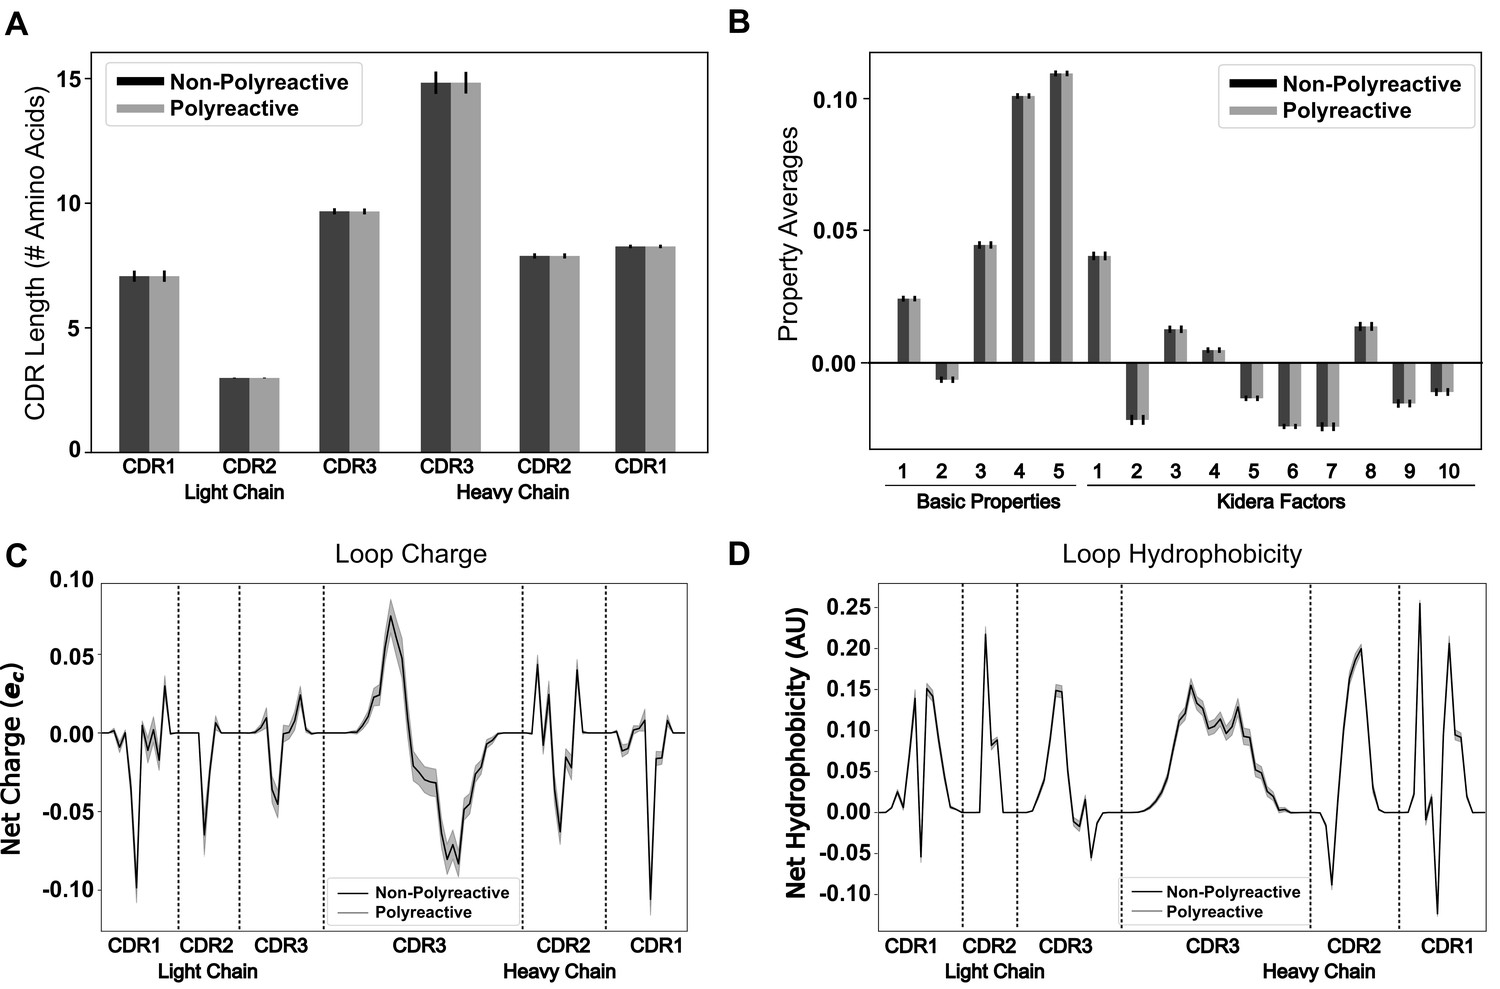
Identical analysis to that in Figure 3 using bootstrapped means drawn from the null distribution.
Labels are still provided as 'non-polyreactive' and 'polyreactive' due to conservation of the number of sequences in each class. Plotting the average CDR loop lengths (A) and net antibody biophysical properties (B) show no differences between the null classes. Basic properties 1–5 are hydrophobicity1, charge, hydrophobicity2, side chain flexibility, and side chain bulk. Plotting the average net charge (C) and hydrophobicity (D) as a function of position of polyreactive and non-polyreactive similarly shows expected similarity between two groups of null distributed data. Light shadow around lines represent bootstrap standard errors. All uncertainties obtained via bootstrapping.
Figure 4 with 3 supplements
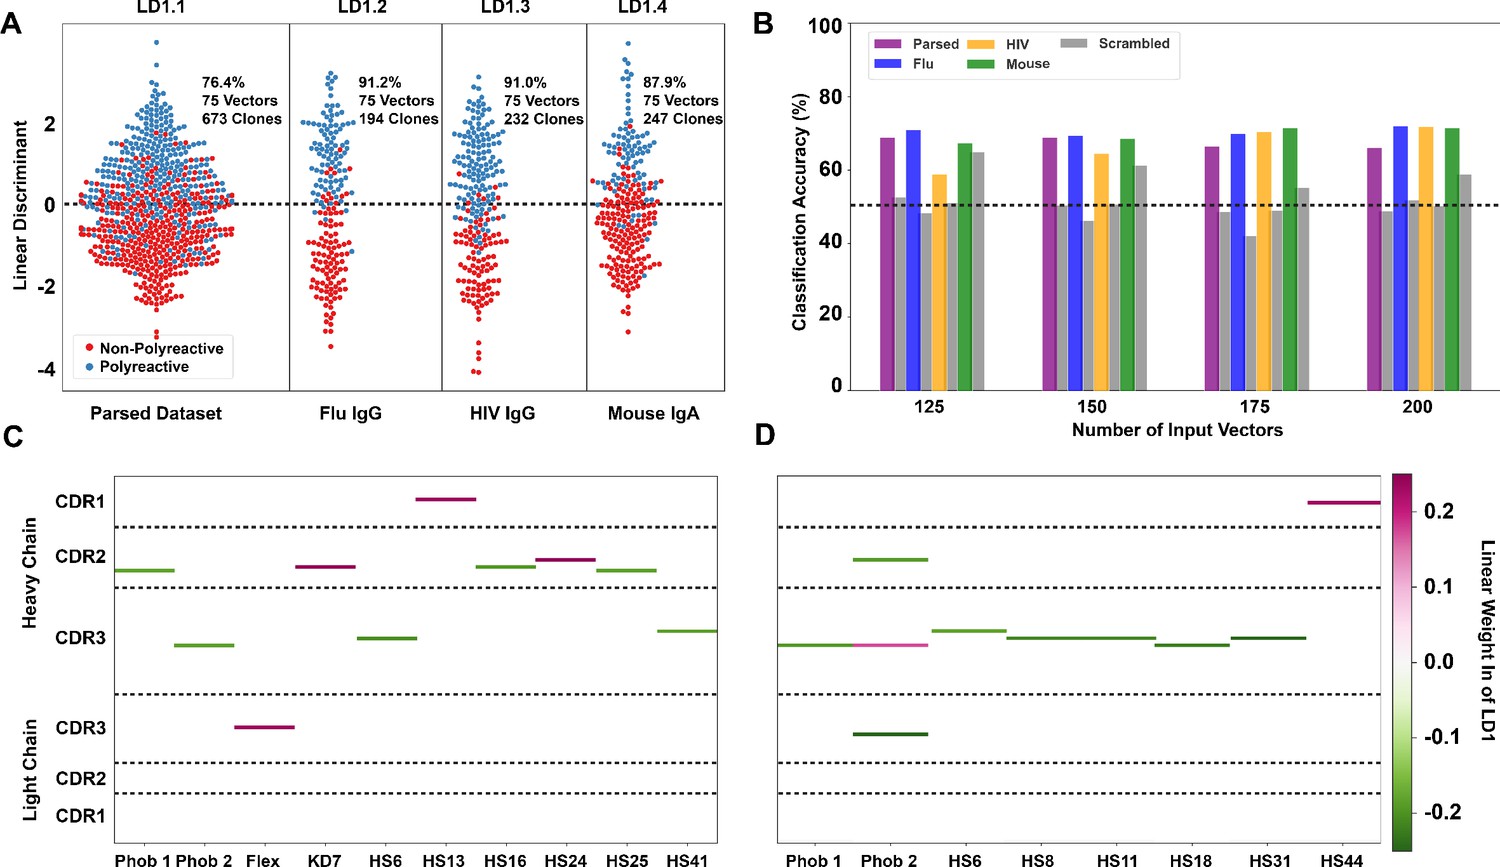
Linear discriminant analysis (LDA) can meaningfully separate the two populations and these meaningful differences can be used to generate a polyreactivity classifier.
(A) LDA applied individually to the complete parsed, Influenza, HIV, and mouse datasets. Percentages indicate the accuracy of the linear discriminant in labeling polyreactive and non-polyreactive antibodies. For these data, the plotted linear discriminants are comprised of different linear weights. (B) Accuracies of a polyreactivity classifier with a separate test and training dataset. Groupings in this figure are the same as those in panel (A). A support vector machine is generated for each individual population, and the reported values are accuracies calculated through leave one out cross validation. Shown are test data and a scrambled dataset where the labels of ‘polyreactive’ or ‘non-polyreactive’ are applied randomly (gray bars). The dotted line indicates 50% accuracy threshold. (C) Property matrices highlighting the top 10 weights of the linear discriminants in panel A for the parsed dataset with 75 vectors (C) and the HIV dataset with 75 vectors (D). Color bar represents the normalized weight of each property, where pink rectangles represent properties correlated with increased polyreactivity, and green rectangles represent properties correlated with decreased polyreactivity.
Figure 4—figure supplement 1
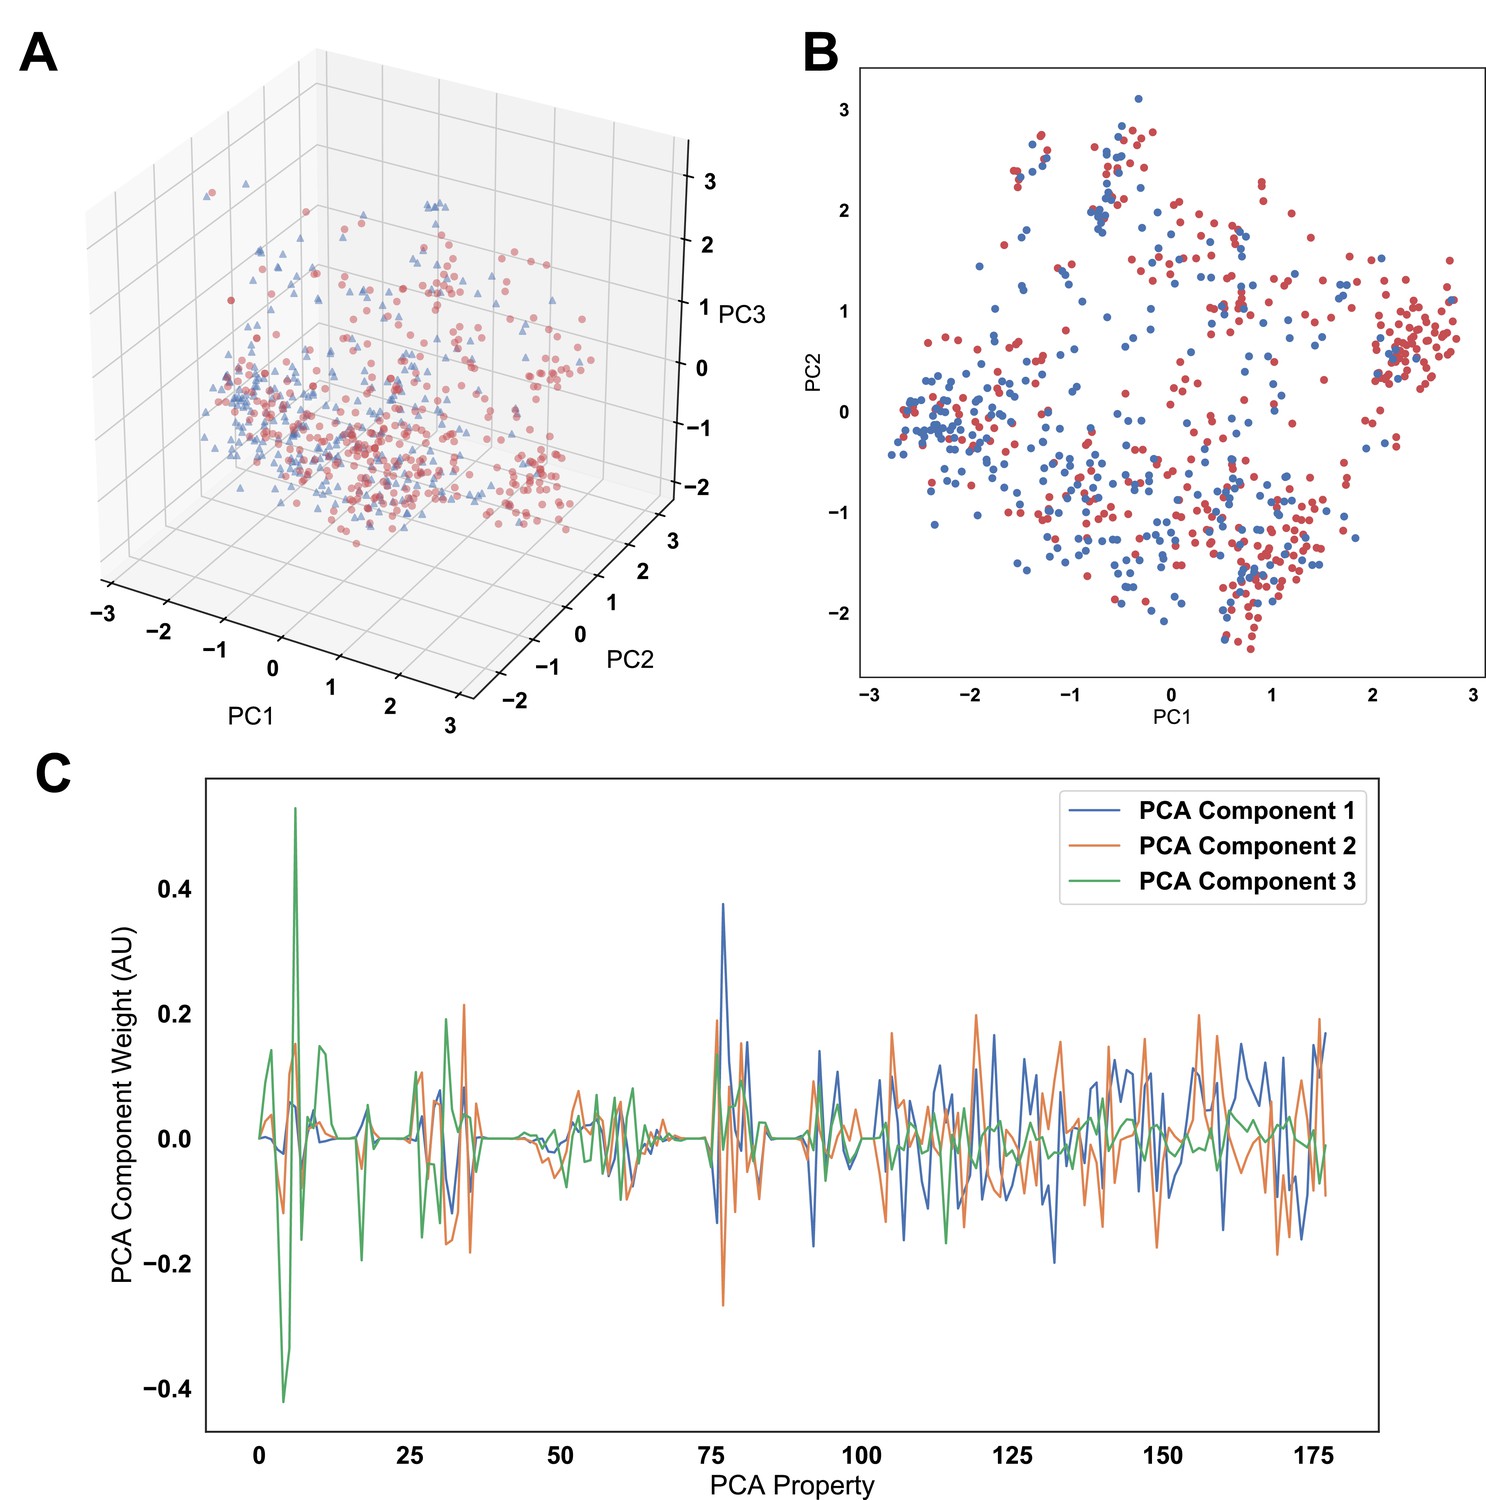
Principal component analysis (PCA) applied to the full amino acid usage matrix and the top 75 discriminating vectors used for linear discriminant analysis.
The analysis shows an inability to distinguish the two populations when showing the first three (A) and first two (B) principal components. (C) Examination of the weights of these first three components shows there is no one property disproportionately contributing to the variance in the dataset. The vector normal of each set of weights is equivalent to 1.
Figure 4—figure supplement 2
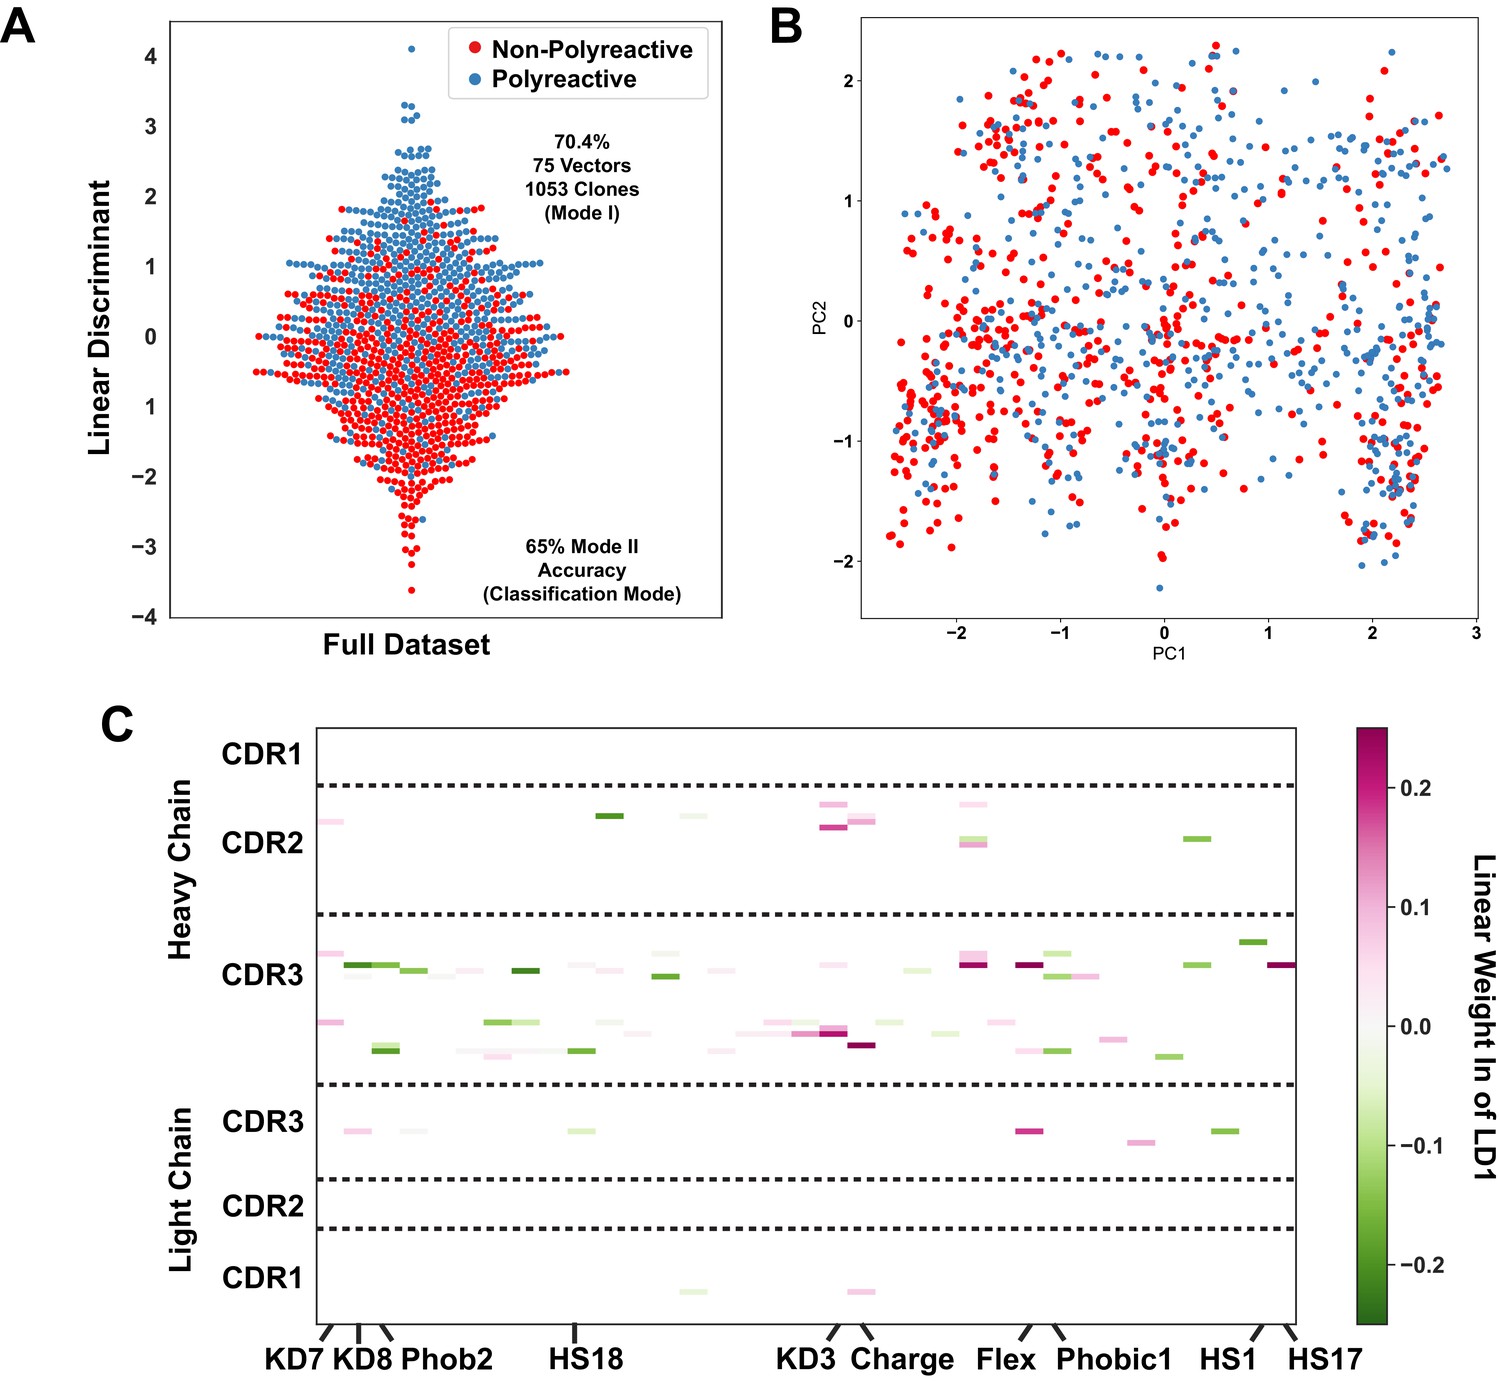
Analysis using the same approach as Figure 4 applied to the complete dataset of 1053 polyreactive and non-polyreactive antibodies highlights the expected decrease in classification accuracy when considering intermediate levels of polyreactivity.
(A) Linear discriminant analysis (LDA) applied to this full dataset is still capable of splitting the data with 70.4% accuracy in LDA mode I and 65% accuracy in the canonical classification LDA mode II. (B) A projection of the data in (A) on to the first two principal components rather than a linear discriminant highlights the shortcomings of PCA in its ability to effectively separate these two classes. (C) Plotting the linear weights from the linear discriminant in (A) shows the properties and CDR loops most important for discriminating polyreactive and non-polyreactive antibodies.
Figure 4—figure supplement 3

The complete representation of the 75 linear weights that most effectively separate polyreactive and non-polyreactive sequences in the parsed complete dataset (A) and the parsed HIV dataset (B).
The x-axes each represent a single biophysical property selected after parsing down the full feature list using a maximal difference algorithm and a correlation analysis.
Figure 5 with 2 supplements
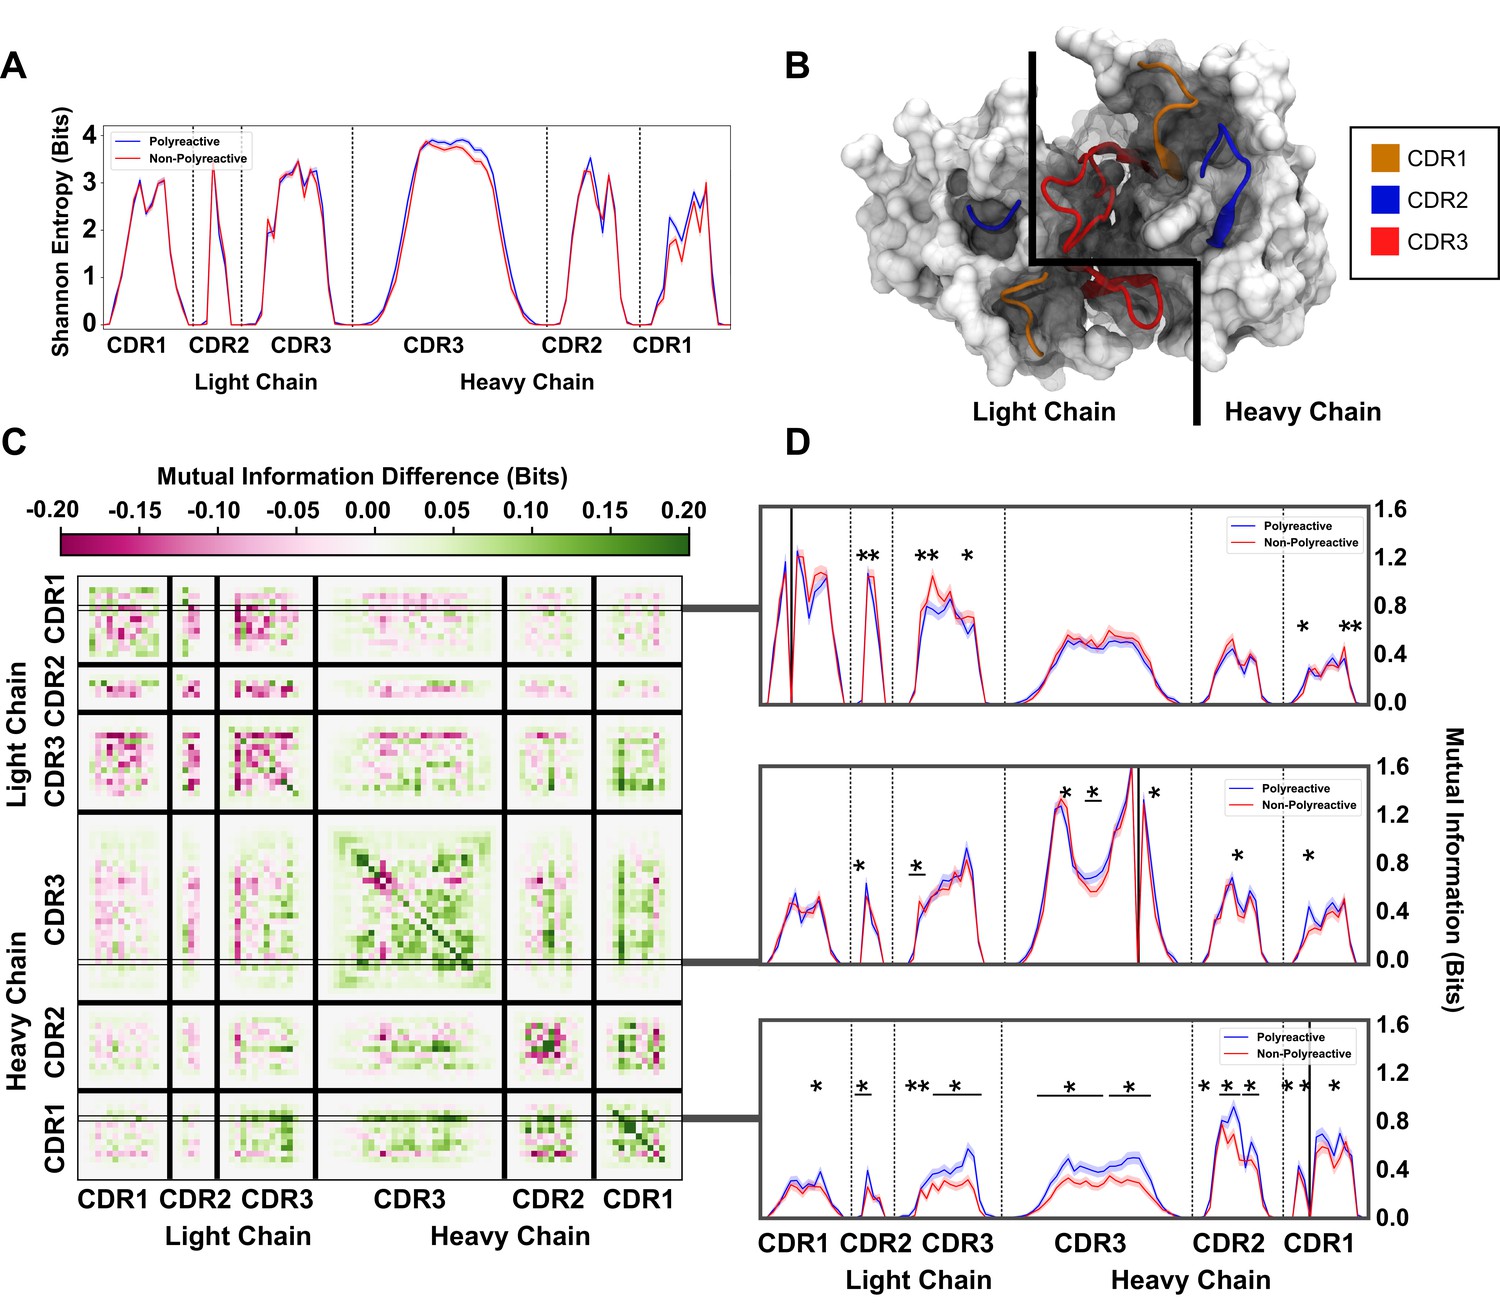
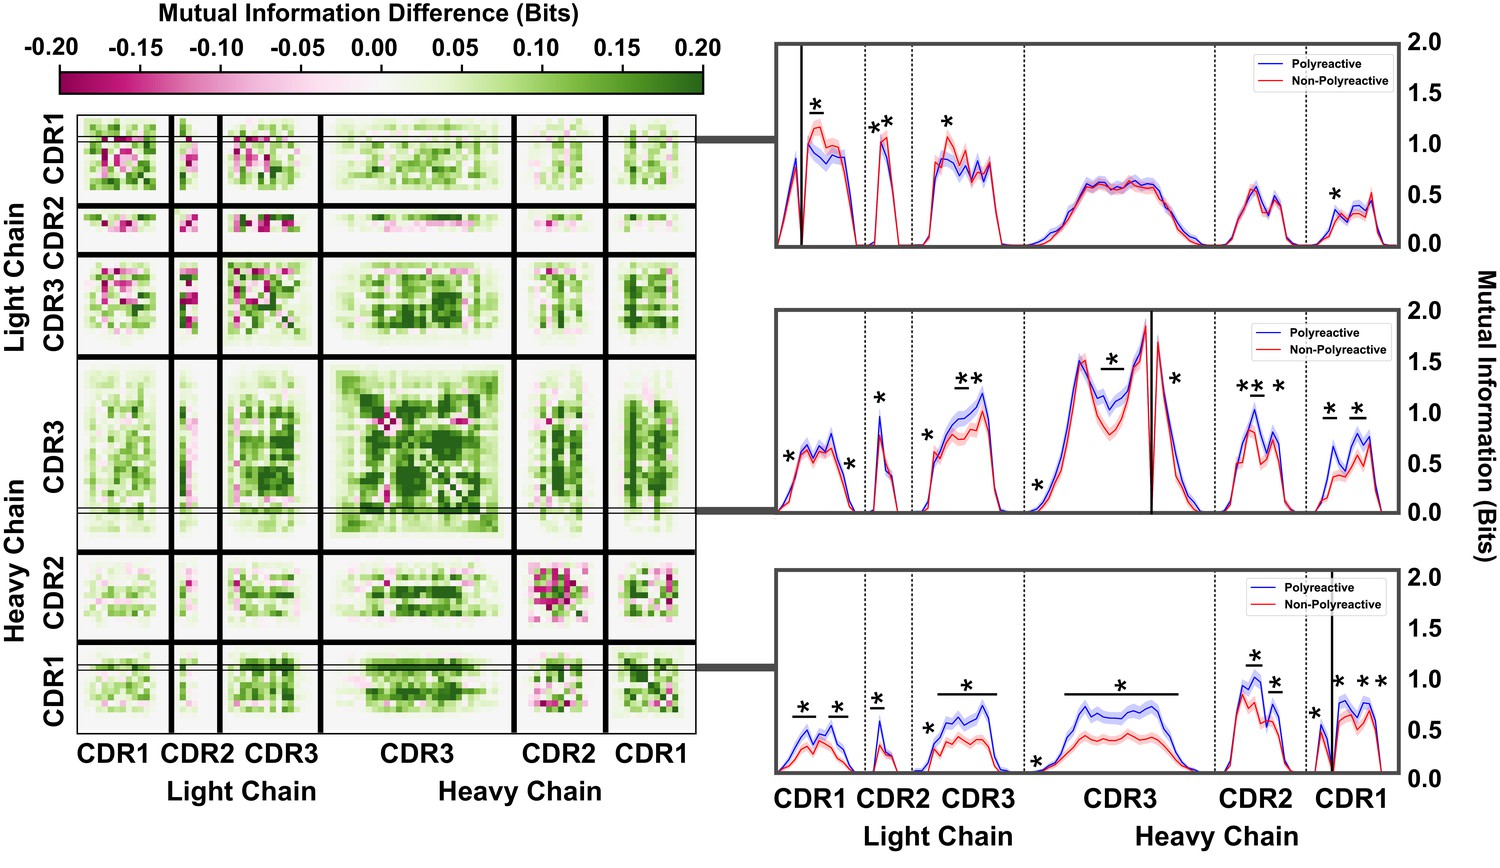
An information theoretic analysis of antibody sequences shows an increase in polyreactive antibody loop crosstalk.
(A) The sequence diversity of the polyreactive and non-polyreactive datasets, quantified using Shannon Entropy, highlight similar diversities between the two groups. (B) A crystal structure (PDB: 5UGY) provides a visual representation of the lateral organization of the CDR loops on the antibody binding surface. (C) The difference in mutual information between polyreactive and non-polyreactive sequences shows that CDR loops of the heavy chain have more crosstalk in polyreactive antibodies. Each individual row represents the given condition, whereas each column gives the location the mutual information is calculated. (D) Singular slices of the mutual information show the data in (C), projected from the matrix onto a line, highlighting the significance of the differences at these particular locations. The positions of the ‘given’ amino acid, that is the particular Y in , are highlighted by gray boxes in panel C. Solid black lines indicate where on the X-axis this ‘given’ amino acid is located. Stars indicate statistical significance (p ≤ 0.05) calculated through a nonparametric permutation test. Bars with a single star above represent contiguous regions of significance.
Figure 5—figure supplement 1
An information theoretic analysis of the parsed antibody sequences shows an increase in polyreactive antibody loop crosstalk that is more pronounced when compared to the full dataset.
The difference in mutual information between polyreactive and non-polyreactive sequences shows that CDR loops have more crosstalk in polyreactive antibodies. Each individual row represents the given condition, whereas each column gives the location the mutual information is calculated (left). Singular slices of the mutual information show the data projected from the matrix onto a line, highlighting the significance of the differences at these particular locations. The positions of the ‘given’ amino acid, that is the particular Y in , are highlighted by gray boxes (right). Solid black lines indicate where on the X-axis this ‘given’ amino acid is located. Stars indicate statistical significance (p ≤ 0.05) calculated through a nonparametric permutation test. Bars with a single star above represent contiguous regions of significance.
Figure 5—figure supplement 2
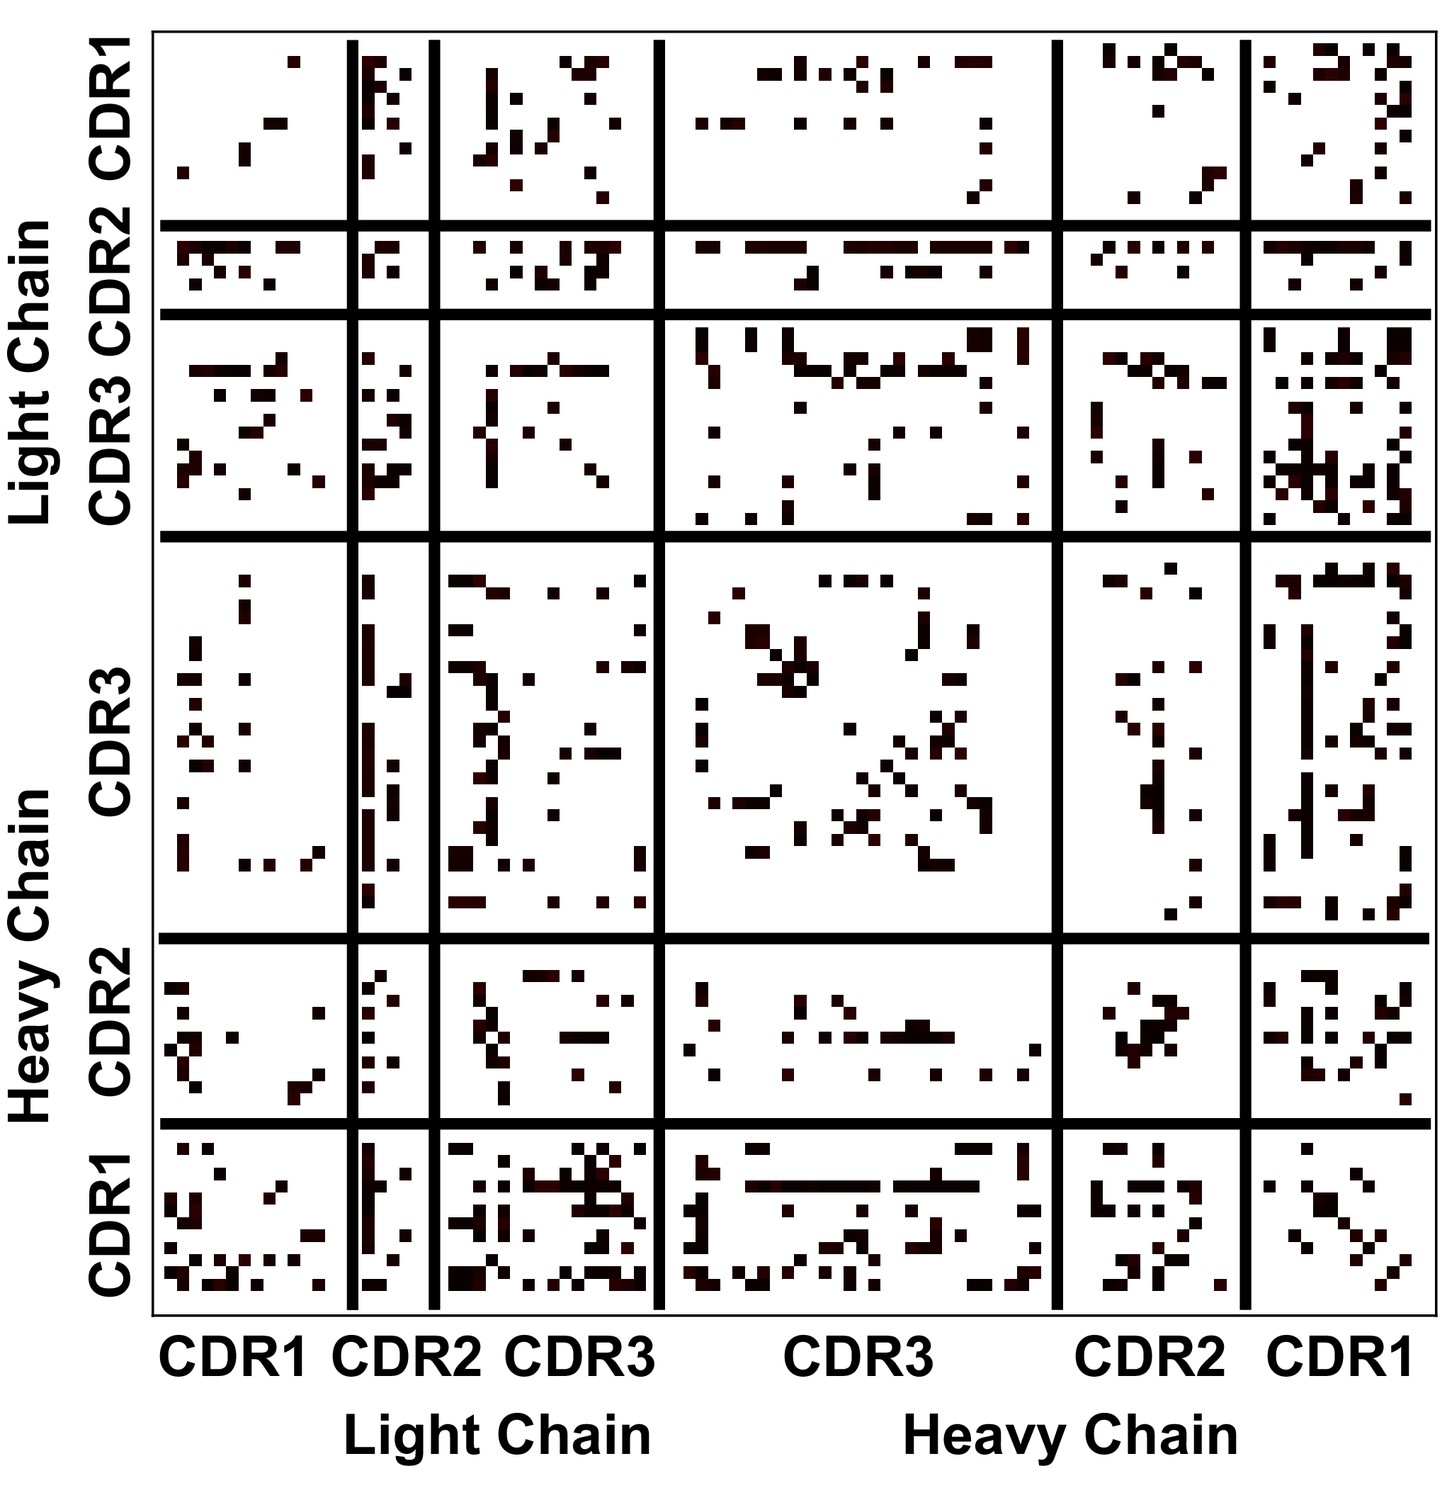
The statistical significance of the values reported in Figure 5C.
Each black dot represents statistical significance (p ≤ 0.05) at that given location. Significance was calculated using a non-parametric permutation test.
Figure 6
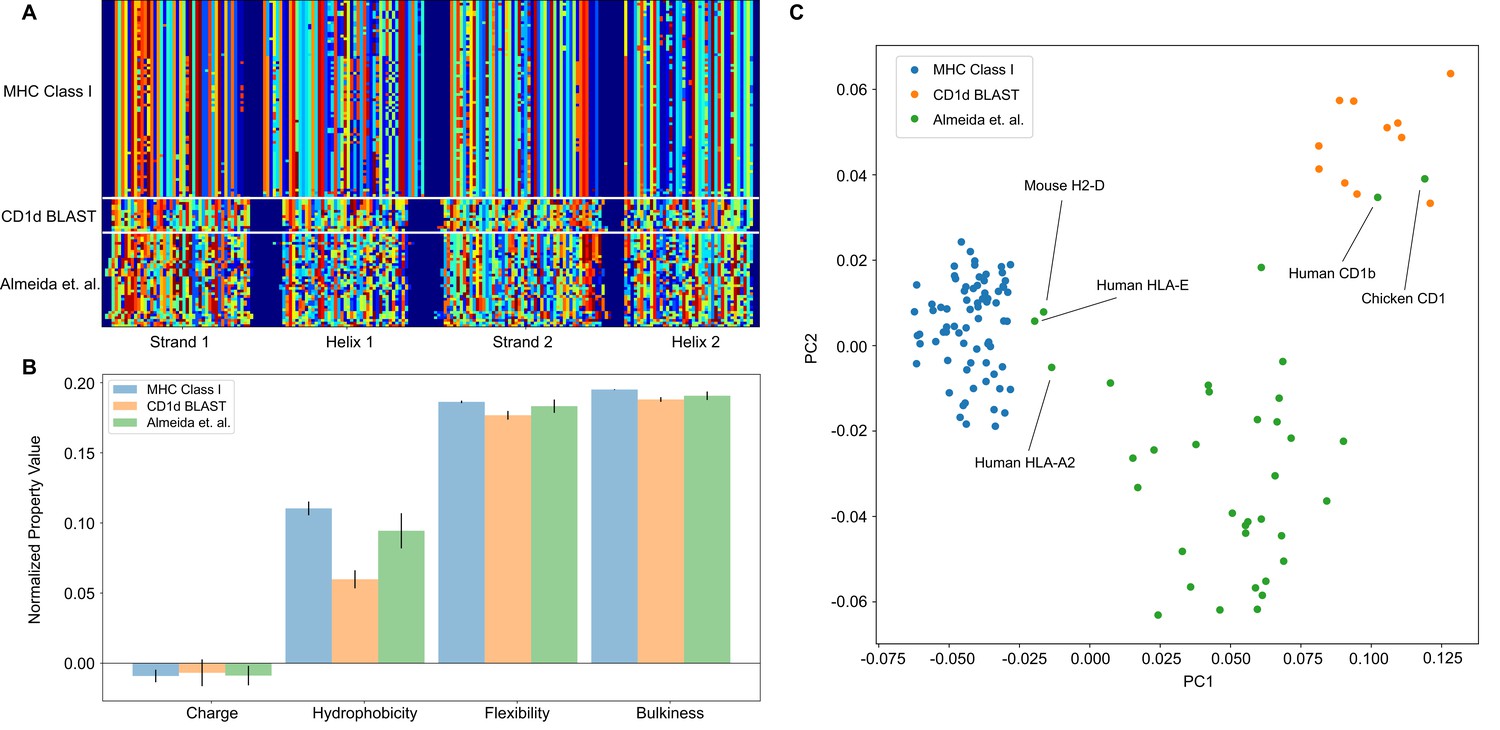
The analysis pipeline is flexible and sufficiently identifies differences between MHC Class I and CD1-like molecules, and has the potential to be used as a classifier moving forward.
(A) Similar to antibody sequences, the MHC and CD1 sequences can be encoded into a matrix. Here, we focus on human Class I MHC molecules and CD1 molecules from various organisms, and use these sequences as training data to classify sequences collected in Almeida et al., 2020.(B) Comparisons of simple biophysical properties across these molecular species highlight differences between classes. (C) Projection of the biophysical properties of each class on to the first two principal components can be used to classify MHC- and CD1-like molecules. Molecules present in Almeida et al., 2020 but absent from the training data are labeled.
Author response image 1

To address reviewer comment #2, we regenerated the analysis from Figure 4A using PCA rather than the maximum difference algorithm to reduce dimensionality.
While performance is modestly decreased across all datasets, we still see strong separation between polyreactive and non-polyreactive antibodies.
Tables
Table 1
A quantification of the antibodies used in this study.
| Dataset | # Polyreactive | # Non-Polyreactive | Total |
|---|---|---|---|
| Mouse IgA | 205 | 240 | 445 |
| HIV reactive | 172 | 124 | 296 |
| Influenza reactive | 152 | 160 | 312 |
| Complete dataset | 529 | 524 | 1053 |
Key resources table
Appendix 1—table 1
List of all biophysical properties used for this study.
For hotspot detecting variables (HS) a simplified form of the description is used. For more in-depth descriptions, the original reference should be used.
| Property shorthand | Description |
|---|---|
| Phob1 | Hydrophobicity scale [−1,1] |
| Charge | Charge [ec] |
| Phob2 | Octanol-interface hydrophobicity scale |
| Bulk | Side-chain bulkiness |
| Flex | Side-chain flexibility |
| KD1 | Helix/bend preference |
| KD2 | Side-chain size |
| KD3 | Extended structure preference |
| KD4 | Hydrophobicity |
| KD5 | Double-bend preference |
| KD6 | Flat extended preference |
| KD7 | Partial specific volume |
| KD8 | Occurrence in alpha-region |
| KD9 | pK-C |
| KD10 | Surrounding hydrophobicity |
| HS1 | Normalized positional residue Freq at helix C-term |
| HS2 | Normalized positional residue Freq at helix C4-term |
| HS3 | Spin-spin coupling constants |
| HS4 | Random parameter |
| HS5 | pK-N |
| HS6 | Alpha-helix indices for beta-proteins |
| HS7 | Linker propensity from 2-linker dataset |
| HS8 | Linker propensity from long dataset |
| HS9 | Normalized relative Freq of helix end |
| HS10 | Normalized relative Freq of double bend |
| HS11 | pK-COOH |
| HS12 | Relative mutability |
| HS13 | Kerr-constant increments |
| HS14 | Net charge |
| HS15 | Norm Freq Zeta-R |
| HS16 | Hydropathy scale |
| HS17 | Ratio of average computed composition |
| HS18 | Intercept in regression analysis |
| HS19 | Correlation coefficient in Reg Anal |
| HS20 | Weights for alpha-helix at window pos |
| HS21 | Weights for beta-sheet at window pos −3 |
| HS22 | Weights for beta-sheet at window pos 3 |
| HS23 | Weights for coil at win pos −5 |
| HS24 | Weights coil win pos −4 |
| HS25 | Weights coil win pos 6 |
| HS26 | Avg Rel Frac occur in AL |
| HS27 | Avg Rel Frac occur in EL |
| HS28 | Avg Rel Frac occur in A0 |
| HS29 | Rel Pref at N |
| HS30 | Rel Pref at N1 |
| HS31 | Rel Pref at N2 |
| HS32 | Rel Pref at C1 |
| HS33 | Rel Pref at C |
| HS34 | Information measure for extended without H-bond |
| HS35 | Information measure for C-term turn |
| HS36 | Loss of SC hydropathy by helix formation |
| HS37 | Principal component 4 (Sneath, 1966) |
| HS38 | Zimm-Bragg parameter |
| HS39 | Normalized Freq of ZetaR |
| HS40 | Rel Pop conformational state A |
| HS41 | Rel Pop conformational state C |
| HS42 | Electron-ion interaction potential |
| HS43 | Free energy change of epsI to epsEx |
| HS44 | Free energy change of alphaRI to alphaRH |
| HS45 | Hydrophobicity coeff |
| HS46 | Principal property value z3 (Hellberg et al., 1987) |
Additional files
Download links
A two-part list of links to download the article, or parts of the article, in various formats.
Downloads (link to download the article as PDF)
Open citations (links to open the citations from this article in various online reference manager services)
Cite this article (links to download the citations from this article in formats compatible with various reference manager tools)
Biochemical patterns of antibody polyreactivity revealed through a bioinformatics-based analysis of CDR loops
eLife 9:e61393.
https://doi.org/10.7554/eLife.61393


