Exceptional stability of a perilipin on lipid droplets depends on its polar residues, suggesting multimeric assembly
- Institut Jacques Monod, CNRS, Université de Paris, France
- Université Paris-Saclay, France
- Institute of Biophysics, Faculty of Medicine, University of Ljubljana, Slovenia
- CRBM, University of Montpellier and CNRS, France
- Université Côte d’Azur, CNRS, IPMC, France
- Chair of Microprocess Engineering and Technology – COMPETE, University of Ljubljana, Slovenia
Figures
Figure 1 with 1 supplement
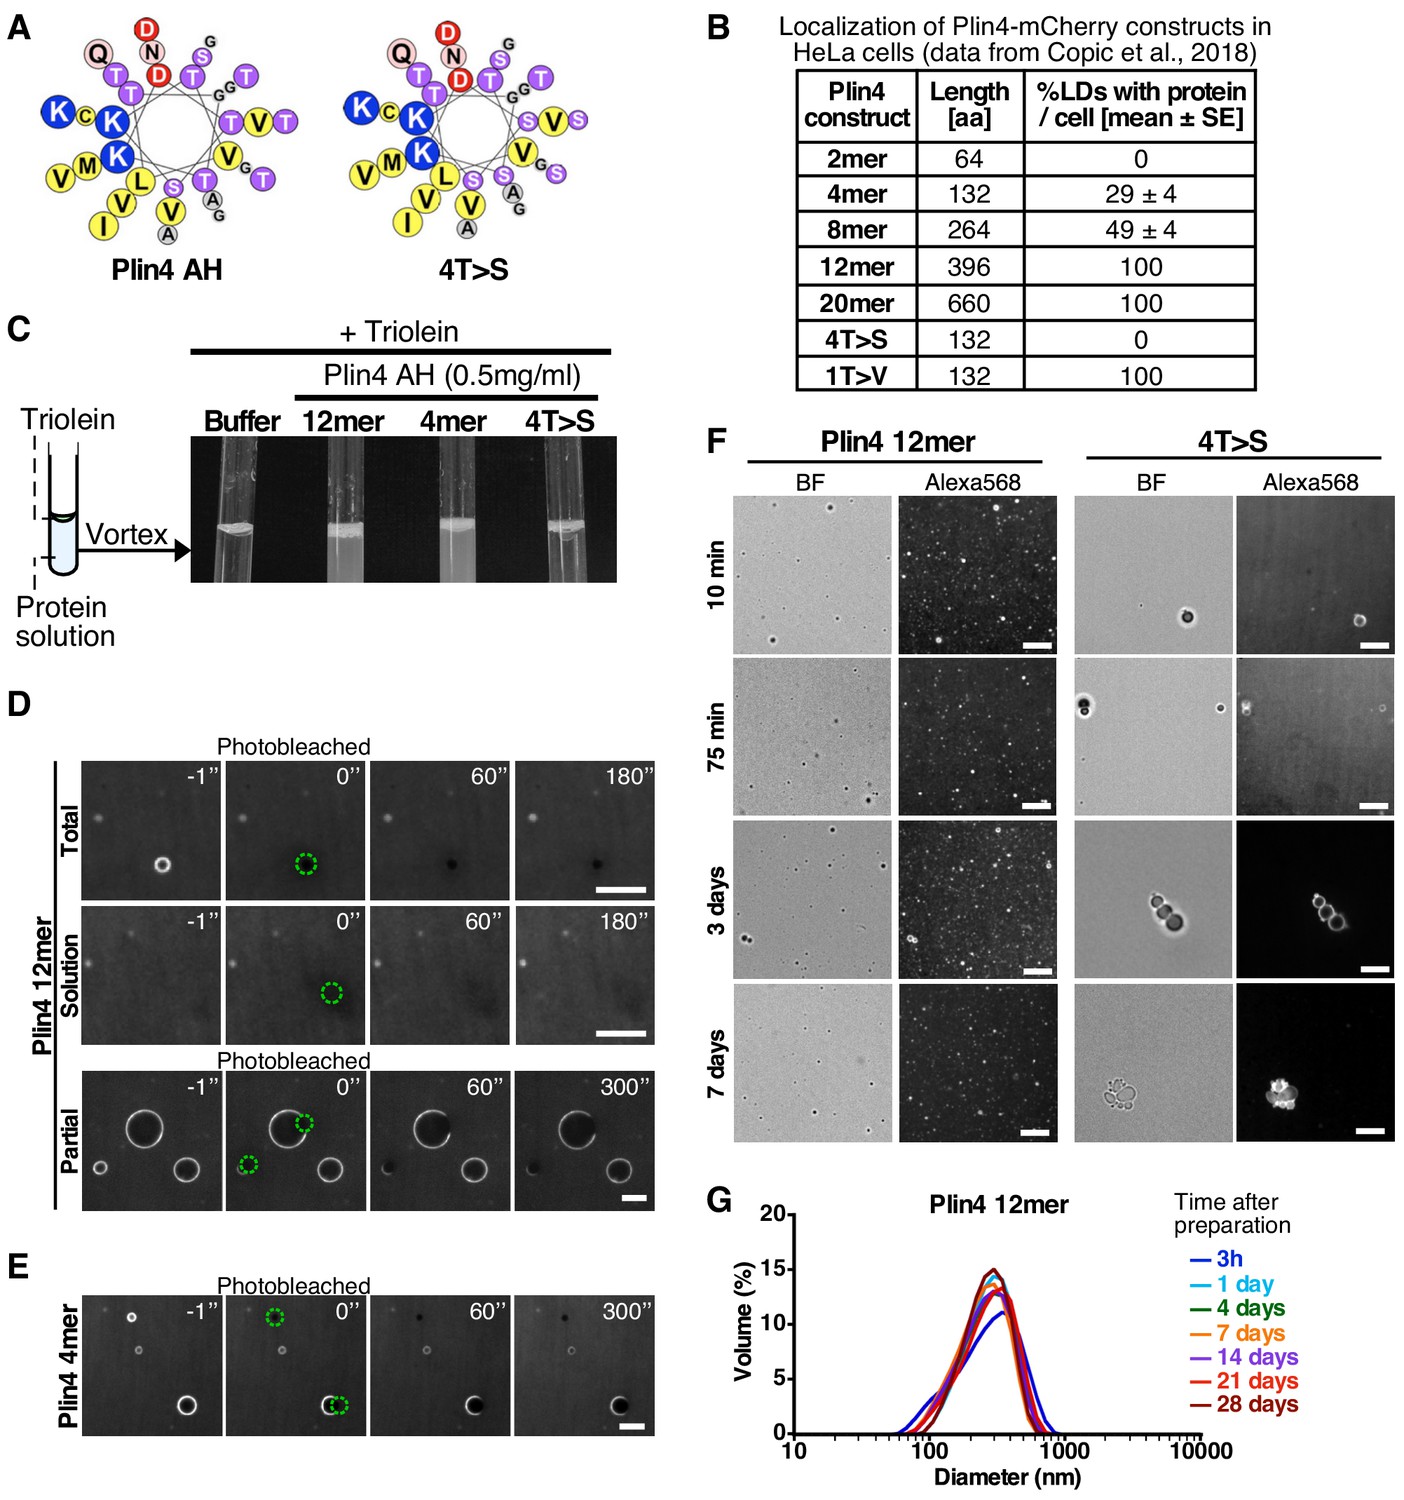
Plin4 AH forms very stable oil particles.
(A) Helical wheel representations of Plin4 and Plin4 4T > S AHs. (B) Summary of LD localization of Plin4 AH and mutants (Čopič et al., 2018). (C) A 10 µl drop of triolein was added to 190 μl of HK buffer containing the indicated proteins (Plin4 12mer, Plin4 4mer or 4T > S, all at 0.5 mg/ml). After vigorous vortexing, the samples were photographed. (D) Dynamics of Plin4 12mer interaction with oil as assessed by FRAP assays. Emulsions of triolein with unlabeled Plin4 12mer (0.5 mg/ml) and Alexa488-labeled Plin4 12mer (0.025 mg/ml) 12mer were prepared as in C and visualized by fluorescence microscopy. FRAP was performed on large droplets, which were entirely bleached (top row), or in the bulk as a control (middle row). The lower row shows a FRAP experiment performed on a limited region of the droplet. A summary of all FRAP experiments is shown in Figure 1—figure supplement 1B. (E) FRAP of Plin4 4mer (0.5 mg/ml) mixed with Alexa488-labeled Plin4 4mer (0.01 mg/ml). (F) Light microscopy images of Plin4 12mer and 4T > S emulsions at different time points after preparation by vortexing. (G) Size distribution as assessed by dynamic light scattering (DLS) of a Plin4 12mer/triolein emulsion from 3 hr to 28 days after the vortexing reaction. Experiment was repeated two times. Scale bars: 5 µm.
Figure 1—figure supplement 1
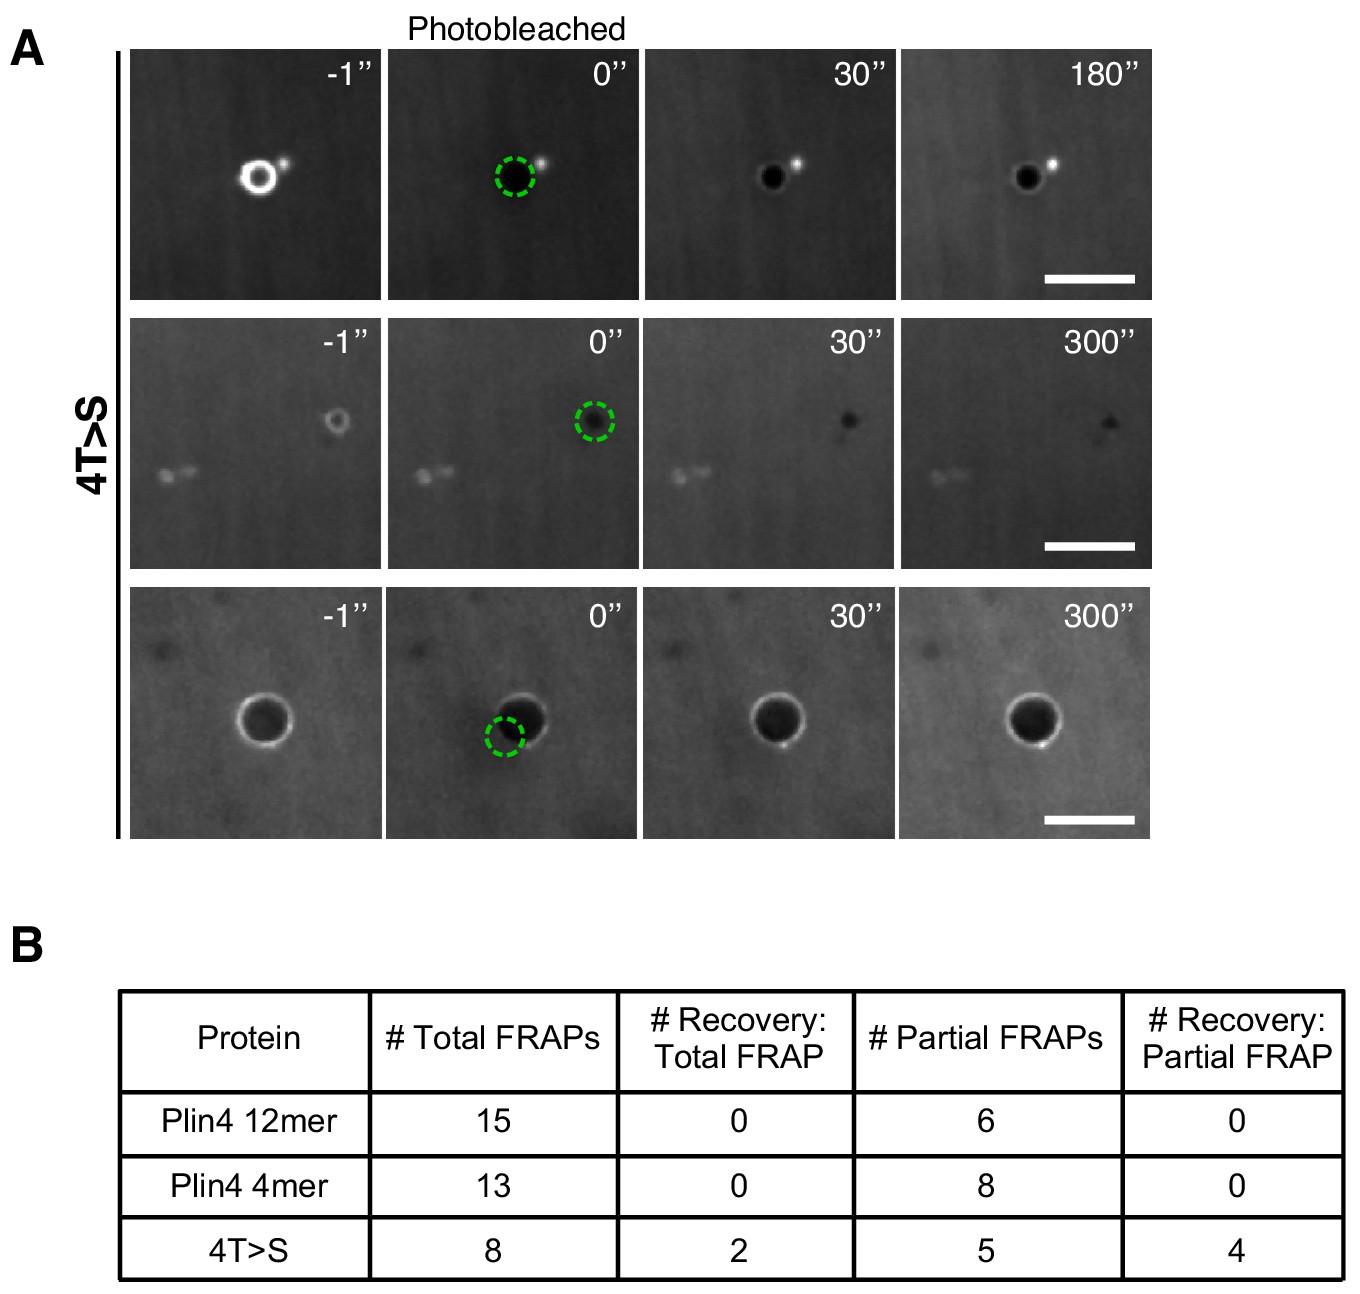
Summary of FRAP experiments on oil droplets.
(A) Examples of FRAP experiments on oil droplets formed with Plin4 4T > S mutant. Emulsions of triolein were prepared with a solution of 4T > S (0.5 mg/ml) and Alexa488-4T > S (0.025 mg/ml). FRAP was performed using the same protocol as for Plin4 12mer. Note that there were very few droplets present in this suspension. Scale bar: 5 µm. (B) Summary of the results of all FRAP experiments on oil droplets formed with Plin4 12mer, Plin4 4mer or 4T > S (4mer) mutant.
Figure 2 with 2 supplements

Real-time monitoring of protein–oil interaction in a microfluidic system shows irreversible adsorption of Plin4 12mer-A488 on triolein.
(A) Scheme of the microfluidics experimental set-up. (B) Top row: confocal images of the triolein-buffer interface as formed in the microfluidic system after adsorption of Alexa488-labeled Plin4 12mer on the triolein surface and after rinsing with buffer. Bottom row: control experiment with the free fluorophore Alexa488. The intensity profile along the channel center is shown below each confocal image. The protein adsorbs irreversibly at the oil surface, whereas Alexa488 conjugated to free cysteine (A488) does not. See also Videos 1–4. A representative of three independent experiments is shown. (C) Time course of the signal of Alexa488-labeled Plin4 12mer or of free Alexa-488 in the side channel as quantified from the experiment shown in B. A representative of three independent experiments is shown.
Figure 2—figure supplement 1
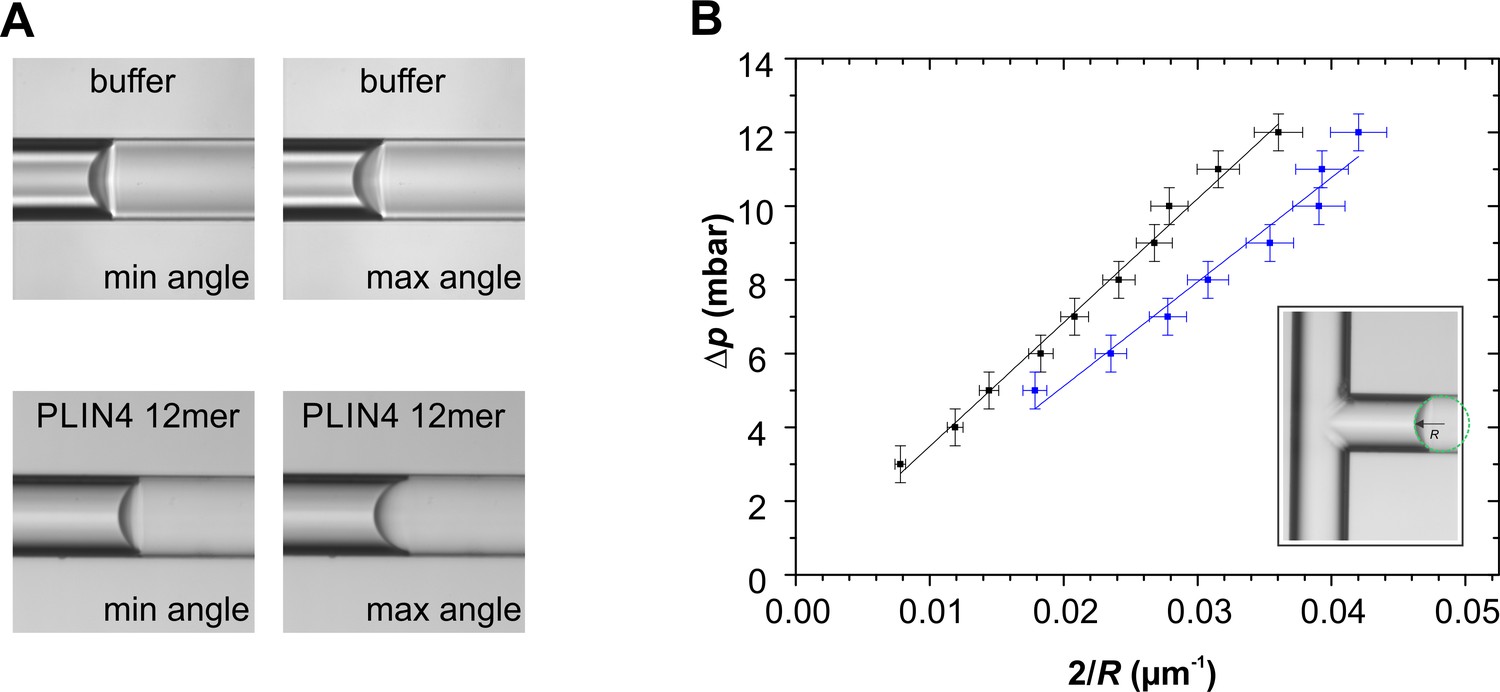
Microfluidic experiments demonstrate that Plin4 12mer lowers the surface tension of oil.
(A) Plin4 12mer readily adsorbed to both oil and glass surfaces and even intercalated into the oil-glass interface, making the glass surface visibly heterogeneous (Videos 1 and 2). In this way, it induced a marked hysteresis in the oil-glass contact angle. The range of equilibrium contact angles spanned from 69° to 75° for buffer, and from 58° to 84° for Plin4 12mer. This hysteresis can result from chemical heterogeneities on a flat glass substrate (Joanny and de Gennes, 1984). (B) Equilibrium pressure difference vs curvature for buffer (black points) and Plin4 12mer (blue points). The slope of the lines represents the surface tension of the interface. In the case of oil-buffer interface the surface tension was 36 ± 3 mN/m (N = 5), and for PLIN4-12mer, the surface tension decreased to 25 ± 1 mN/m (N = 5).
Figure 2—figure supplement 2
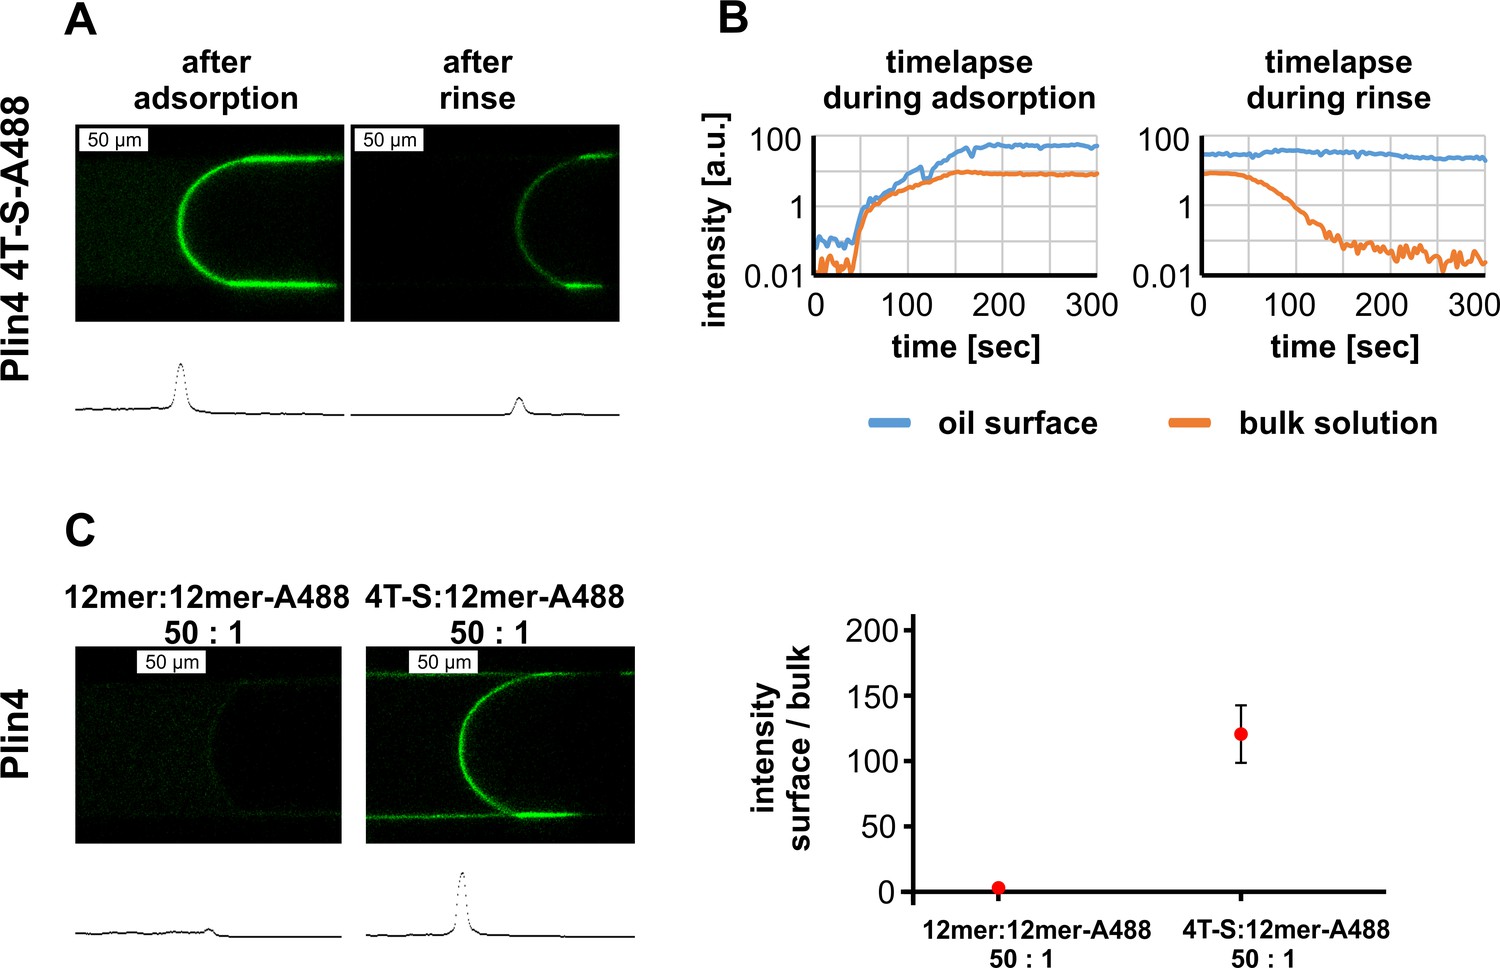
Plin4 mutant 4T > S-A488 also adsorbs to the oil surface, but is outcompeted by Plin4 12mer-A488.
(A) Confocal images of the oil-buffer interface in the microfluidic system after adsorption of Plin4 4mer mutant 4T > S-A488 (0.1 mg/ml) on the oil surface and after rinsing with buffer. The intensity profile along the channel center is shown below each confocal image. (B) Time evolution of signal intensity on the oil surface and in the bulk solution during adsorption and rinsing. A representative of three independent experiments is shown. (C) Competition between Plin4 12mer and 4T > S mutant. The ratio between the intensity on the oil surface and in the bulk solution for a mixture of unlabeled Plin4 12mer: Plin4 12mer-A488 (50:1) and a mixture of unlabeled 4T > S: Plin4 12mer-A488 (50:1). Mean ± SD of the fluorescence intensity of surface/bulk solution is shown.
Figure 3 with 1 supplement

Comparison of the LD-binding properties of perilipin AHs in yeast.
(A) Helical wheel representation of the AHs of Plin1 (aa 110–189 aa), Plin2 (aa 101–191 aa), Plin3 (aa 114–204), and Plin4 (aa 246–377, corresponding to the Plin4 4mer construct). In the case of Plin1, Plin2, and Plin3, the predicted AH regions are interspersed by short aa linkers, which are also indicated. Diagrams above the helical wheels show the full-length proteins, with AH regions shown in orange and the four-helix bundle in dark gray. (B) AA composition of the AH of Plin1, 2, 3, and 4 (in %) in comparison with the average aa composition of vertebrate proteins (av. vert). The blue and red backgrounds indicate lower or higher % as compared to vertebrate values, respectively. (C) Localization of GFP fusions with the AH region of Plin1, Plin2, Plin3, or Plin4 in S. cerevisiae cells. The experiment was performed with wild-type yeast cells (upper row), with pet10Δ cells (medium row) grown for 24 hr to stationary phase, or with pet10Δ cells grown to stationary phase and then transferred for 24 hr to oleic acid (OA) medium (lower row). Scale bar: 5 µm. (D) Bar plots of the percentage of cells showing intracellular puncta for the different proteins expressed. Sixty cells per each condition were counted in one of at least two representative experiments. (E) Quantification of the size distribution of fluorescent LDs (labeled with GFP-fusion proteins) in pet10Δ + OA cells. The plots show representative measurements from two independent experiments, where the following number of LDs was counted: Plin1 AH, 141; Plin2 AH, 143; Plin3 AH, 136; Plin4 6mer, 148; Plin4 12mer, 159. Pixel size: 0.091 μm x 0.091 μm.
-
Figure 3—source data 1
Comparison of the LD-binding properties of perilipin AHs in yeast and their effect on LD size.
- https://cdn.elifesciences.org/articles/61401/elife-61401-fig3-data1-v2.xlsx
Figure 3—figure supplement 1
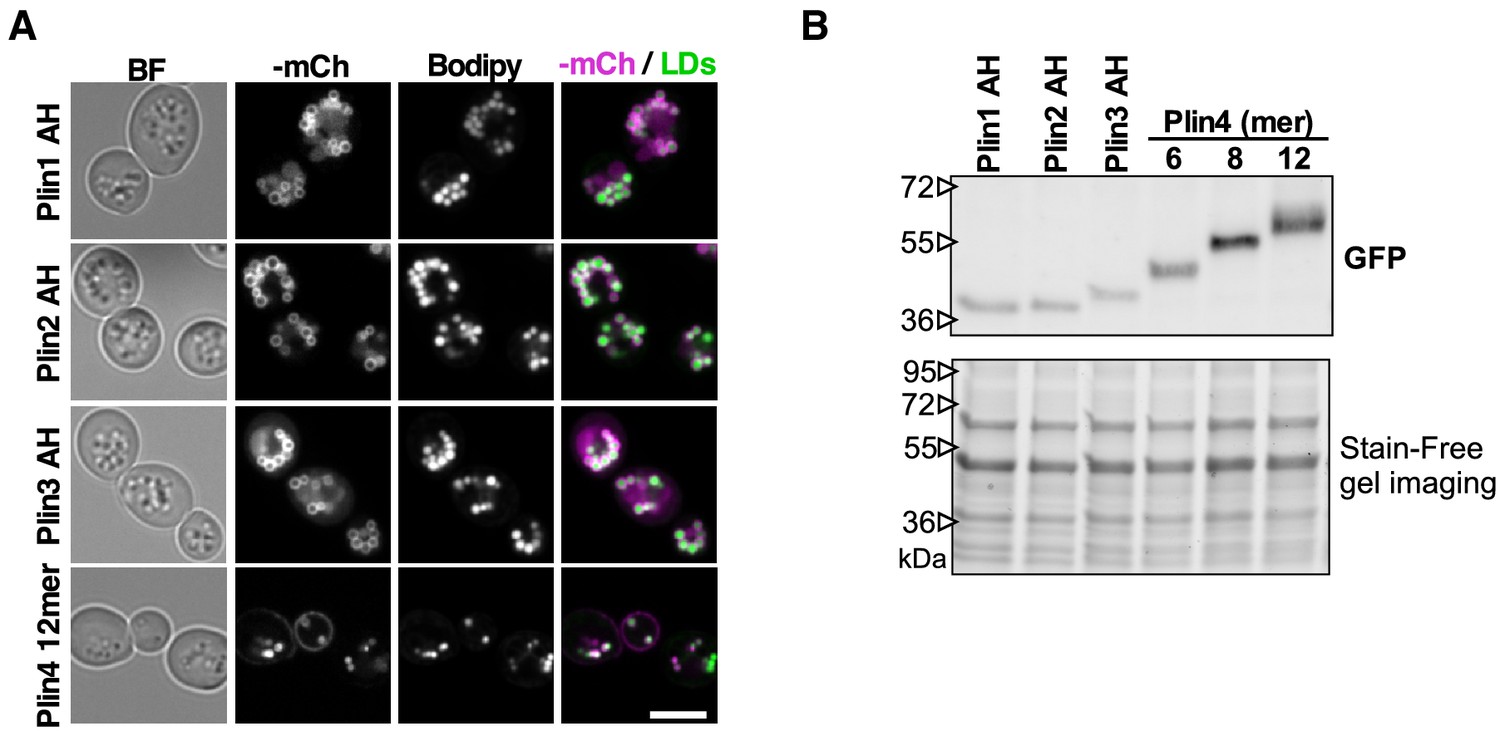
Plin AH fusion proteins co-localize with LDs in yeast and are expressed at similar levels.
(A) Co-localization of Plin1 AH, Plin2 AH, Plin3 AH, and Plin4 12mer mCherry fusions and LDs, stained with Bodipy in pet10Δ cells grown in oleic acid. Scale bar: 5 µm. (B) Western blot analysis of yeast protein lysates from pet10Δ cells expressing Plin AH-GFP fusions as indicated. Experiment was repeated three times using different extraction methods.
Figure 4 with 1 supplement
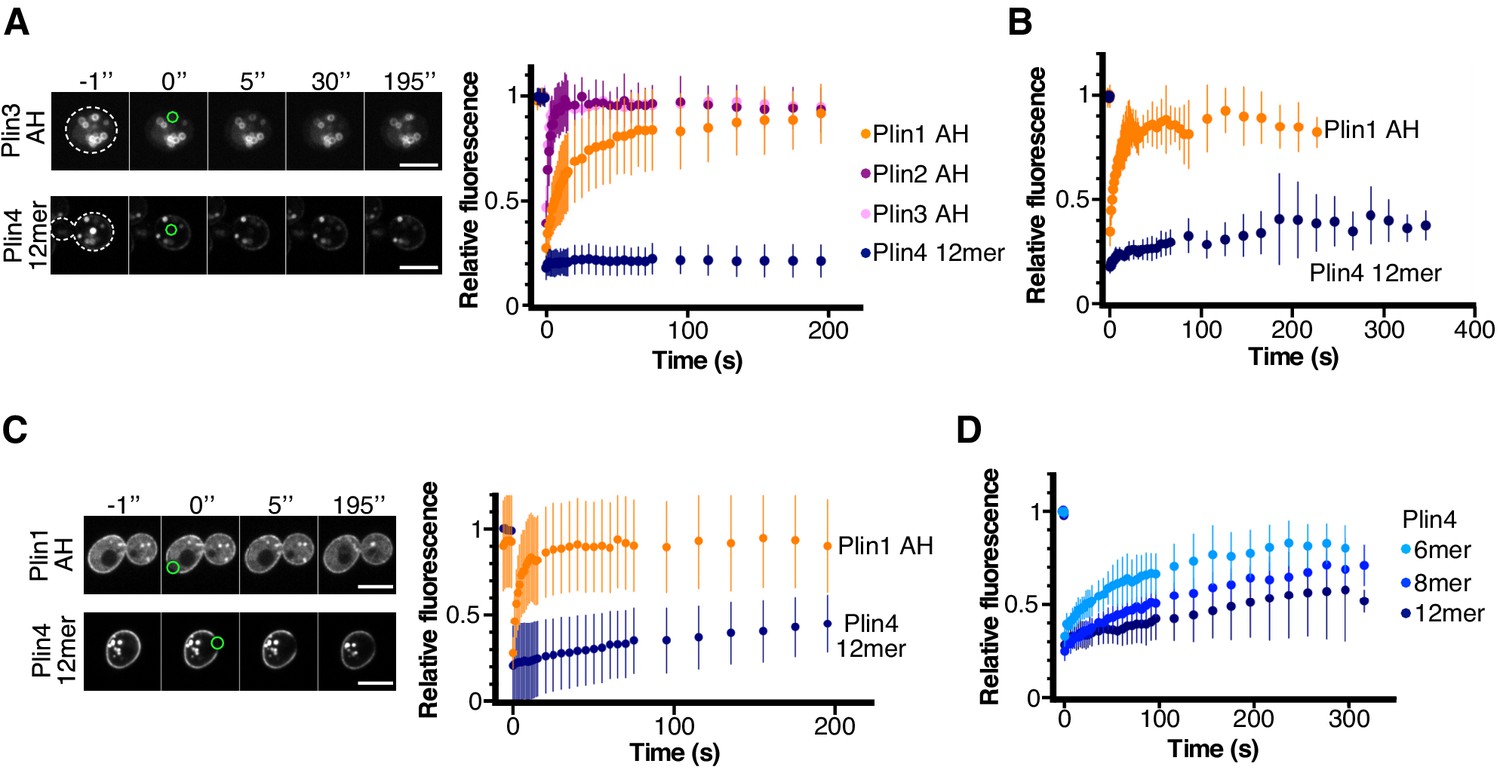
Dynamics of perilipin AH-GFP fusions on LDs or at the plasma membrane in yeast.
(A) Dynamics of AH-GFP fusions on LDs in pet10Δ cells grown for 48 hr in oleic acid. Images show two representative FRAP time-courses in cells expressing Plin3 AH-GFP (top panels) or Plin4 12mer-GFP (bottom panels); time (in seconds) is indicated on top. Cells are outlined in white and the bleached areas containing one LD are outlined in green. Graph shows recovery curves for Plin1 AH-GFP (n = 29), Plin2 AH-GFP (n = 14), Plin3 AH-GFP (n = 16), or Plin4 12mer-GFP (n = 24). (B) Recovery curves for Plin1 AH-GFP (n = 11) or Plin4 12mer-GFP (n = 5) on LDs in pet10Δ cells in late exponential phase (small LDs). (C) FRAP of Plin1 AH (n = 14) and Plin4 12mer (n = 15) at the PM in exponentially growing pet10Δ cells. Images show two representative time-courses for Plin1 AH (top) and Plin4 12mer (bottom). Bleached areas are outlined in green. (D) FRAP of Plin4 6mer-GFP (n = 12), Plin4 8mer-GFP (n = 7) and Plin4 12mer-GFP (n = 7) at the PM in exponentially growing wild-type cells. All graphs show the mean ± SD of the fluorescence recovery curves from n FRAP measurements on different LDs or different regions of the PM, as shown in the images. Scale bar: 5 µm.
-
Figure 4—source data 1
Dynamics of perilipin AH-GFP fusions on LDs or at the plasma membrane in yeast assessed by FRAP.
- https://cdn.elifesciences.org/articles/61401/elife-61401-fig4-data1-v2.xlsx
Figure 4—figure supplement 1

Cell-to-cell variability in the recovery of Plin4 12mer-GFP after photobleaching of LDs in Drosophila S2 cells.
FRAP was performed on oleic acid-induced LDs in S2 cells stably transfected with Plin4 12mer-GFP. (A) Fluorescence recovery curves from individual cells in the same experiment performed in control cells (RNAi against luciferase). Each curve represents mean ± SD from FRAP on three LDs in the same cell, as exemplified in the two images below the graph, showing two cells before bleaching. Areas that were bleached are marked with green circles. Fast fluorescence recovery was observed in the cell on the left, slow in the cell on the right. The fluorescence signal in the two images was acquired under the same settings, showing that the total Plin4-GFP expression level in the two cells was similar. However, note the difference in the amount of cytosolic signal. Scale bar: 5 μm. (B) Same as A, except that FRAP was performed on cells in which CCT1 has been depleted by RNAi. (C) Correlation between the ratio of LD/cytosolic Plin4 12mer-GFP signal and the half-time of recovery, as determined from the curves shown in A and B. Each dot represents one cell, data is from two independent experiments. Asterisks denote cells which had very slow recovery kinetics (half-time >100 s; in this case the value was set to 100 s).
Figure 5 with 1 supplement
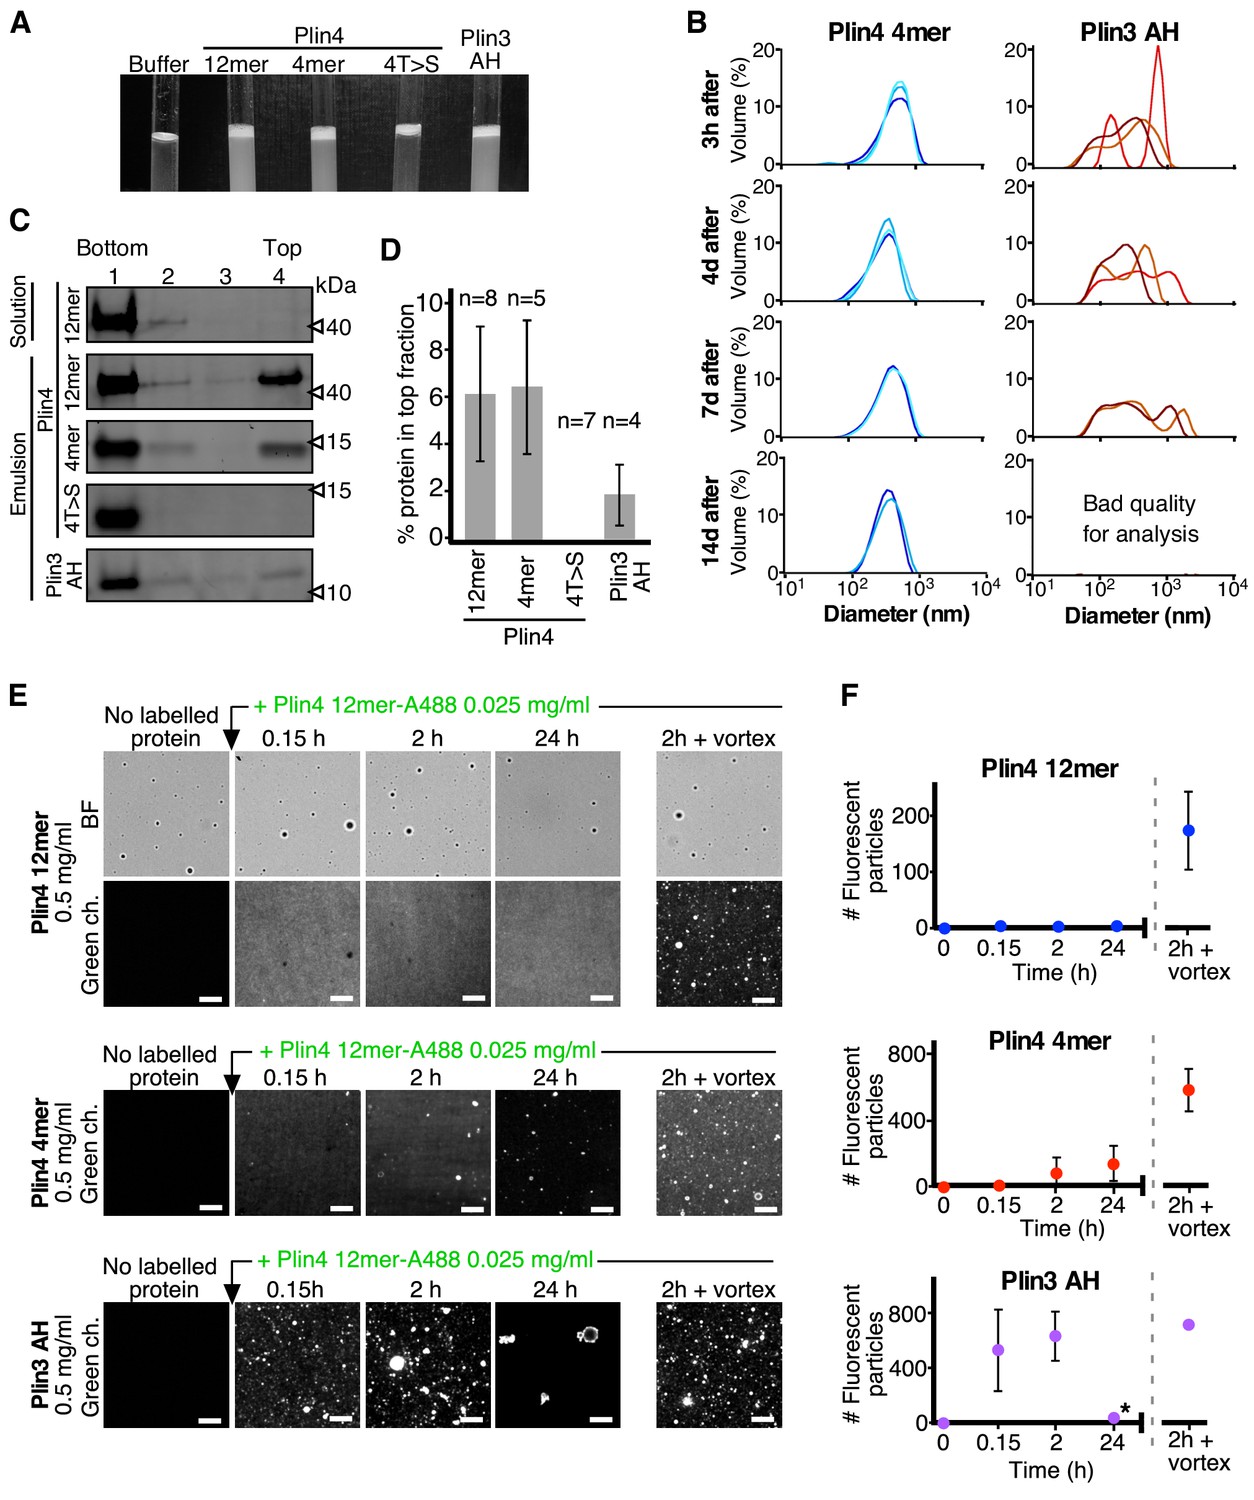
Plin3 AH interacts much less strongly with oil than Plin4 AH.
(A) Turbidity assays with 0.5 mg/ml protein solutions of Plin4 12 mer, Plin4 4mer, Plin4 4mer mutant [4T > S], or Plin3 AH after vigorous vortexing with triolein (15 µl for 285 µl of protein solution). (B) Size distribution of the droplets in triolein emulsions formed with Plin4 4mer or Plin3 AH at various times after vortexing was determined by DLS. Particle size is shown by volume weighted distributions. One of three independent experiments is shown. (C) Protein/oil emulsions or protein solutions of the indicated variants of Plin4 or Plin3 AH were mixed with sucrose and loaded on the bottom of a sucrose step gradient. After centrifugation, four fractions were collected from the bottom and equal volumes were analyzed by protein gels with Sypro Orange staining. (D) Quantification (mean ± SD) of the experiment in C. The number of repeats for each experiment is indicated above the bar graphs. (E) Protein exchange assay in LD emulsions. Top panel: a Plin4 12mer (0.5 mg/ml)/triolein emulsion was prepared by vortexing. Thereafter, 0.025 mg/ml Alexa-488-labeled Plin4-12 mer was gently added. The emulsion was imaged at the indicated time points by light microscopy in bright field (BF) to see all particles and by fluorescence to detect coverage by Alexa-488-labeled Plin4 12 mer. Finally, the suspension was vortexed again to promote maximum incorporation of Alexa488-labeled Plin4 12mer in the emulsion. The middle and lower rows show similar experiments performed with Plin4 4mer and Plin3 AH emulsions, respectively. Scale bars: 5 μm. (F) Quantification (mean ± SD) of the experiments shown in E as determined from four separate fields (73 × 100 μm) in the same experiment. The graphs are representative of at least two independent experiments. Time on the x-axis is plotted using logarithmic scale. Asterisks indicates clustering of particles, which resulted a in low total number of fluorescent puncta, as seen in the image.
-
Figure 5—source data 1
Analysis of protein content and protein exchange in oil emulsions.
- https://cdn.elifesciences.org/articles/61401/elife-61401-fig5-data1-v2.xlsx
Figure 5—figure supplement 1

Plin3 AH purification and CD analysis.
(A) Tricine SDS-PAGE showing the purification of Plin3 AH after expression in E. coli. The lanes show the proteins present in the total bacteria extract (total) and after a four-step protocol, which includes centrifugation to separate the soluble and the precipitated fractions, boiling and centrifugation of the soluble fraction to get the heat-resistant fraction, dialysis of the heat resistant fraction (boiled and dialyzed) and anion exchange chromatography with a gradient of NaCl from 10 to 1000 mM. Gel stained with SyproOrange. Molecular weight standards are indicated (in kDa). (B) CD spectra showing ellipticity of Plin3 AH (25 μM) in Tris buffer (blue line) or in buffer with 50% TFE (green line).
Figure 6 with 2 supplements
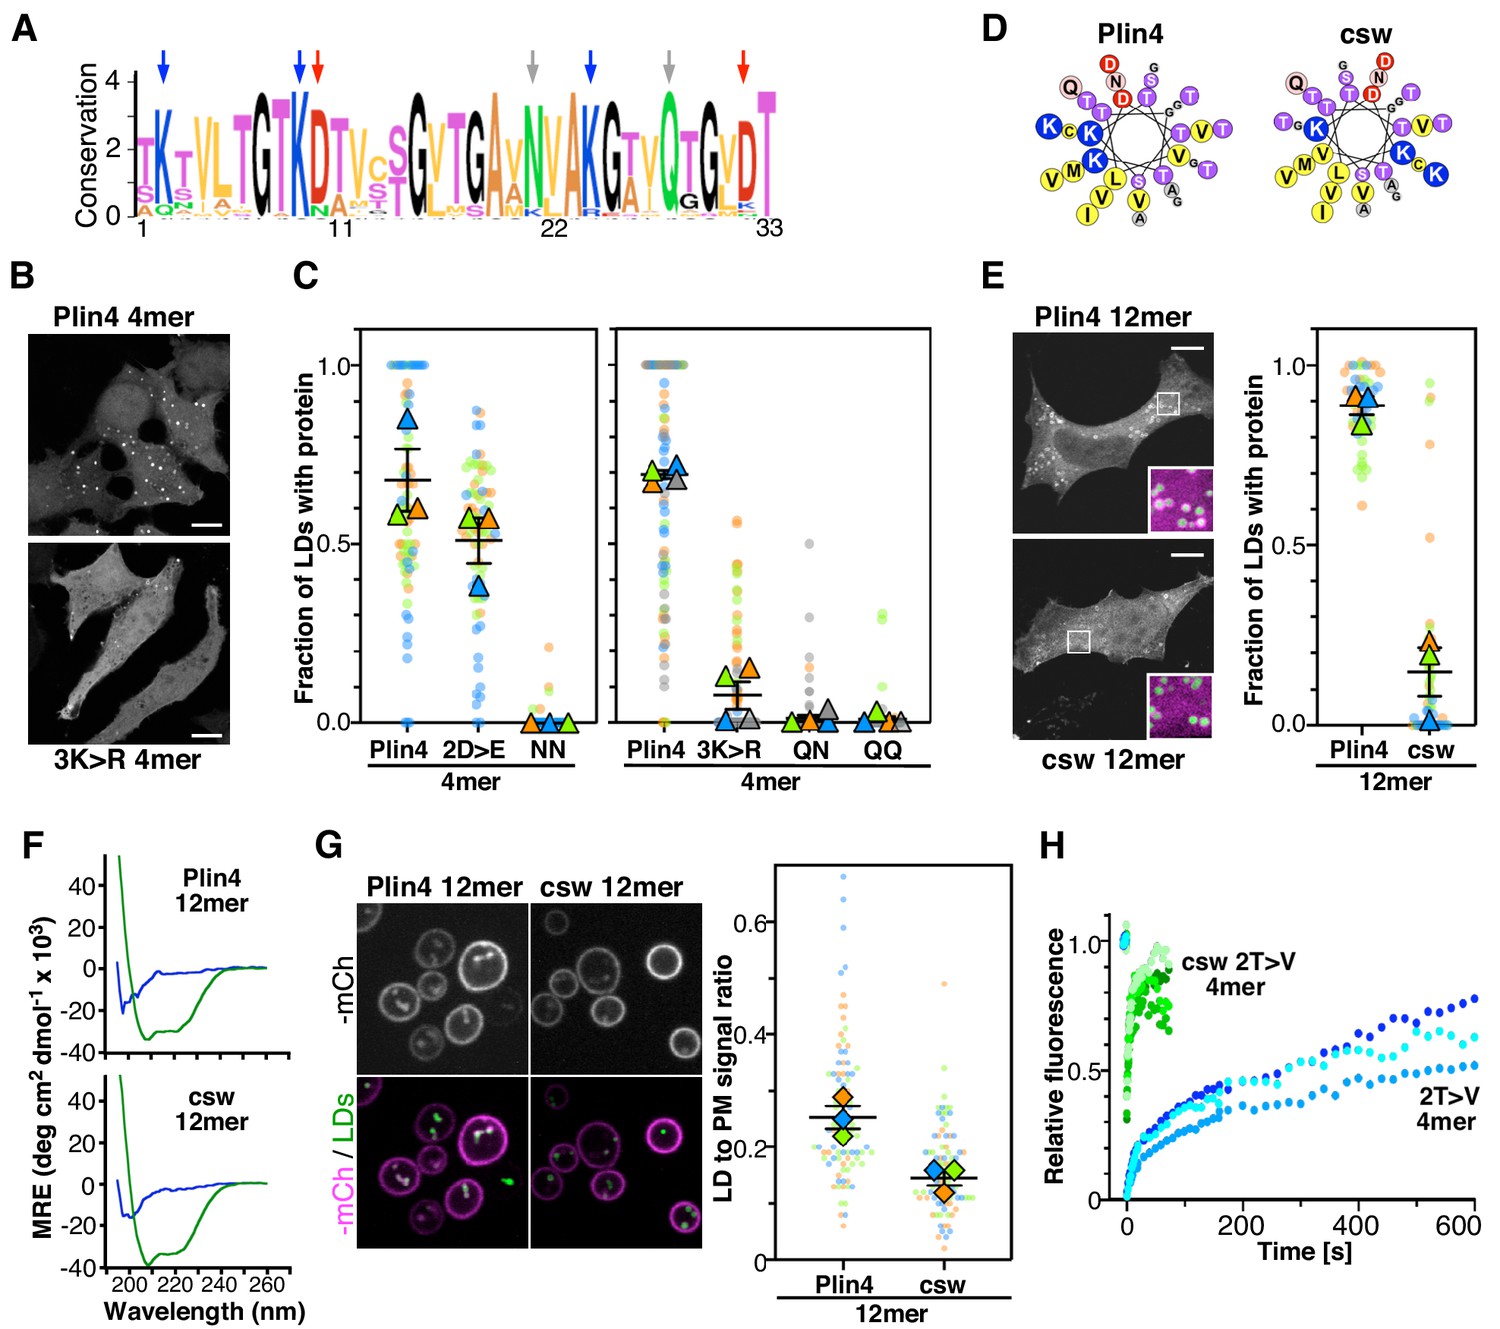
The polar face of Plin4 AH is key for specific and stable coating of LDs in cells.
(A) Weblogo plot of the AH region of human Plin4 as determined by aligning its 29 33-mer repeats. The vertical arrows indicate the mutated aa: the NQ pair (gray), which was mutated into NN, QQ or QN; the three K (blue), which were mutated into R, and the two D (red), which were mutated into E. (B) Co-localization of GFP-Plin4 4mer wild-type and 3K > R (in white) with LDs (purple) in HeLa cells. (C) Quantification of the percentage of LDs stained with the indicated protein per cell. These ‘SuperPlots’ (Lord et al., 2020) show all data fom three to four independent experiments, each with a different color; each light dot represents one cell, whereas each triangle shows the mean from one experiment. The black bars show the mean ± SE of three to four independent experiments. (D) Helical wheels of Plin4 WT and csw mutant. (E) Localization of Plin4 12mer wild-type or csw mutant in HeLa cells. The insets show extended views with the protein in purple and LDs in green (stained with Bodipy). The super plots show the mean ± SE of the % of LDs positive for the indicated protein per HeLa cell as determined from three independent experiments. (F) CD spectra of Plin4 12mer (5 μM) and csw 12mer (7.5 μM) in solution (blue) or in an equal volume of buffer and TFE (green). (G) Light microscopy images of mCherry fusions of Plin4 12mer wild-type or csw mutant in yeast. Top: mCherry fluorescence (mCh); bottom co-localization of mCherry (purple) with LDs stained with bodipy (green). The relative fluorescence signal of mCherry fusions of Plin4 12mer wild-type or csw mutant on LDs and at the PM in PET10-GFP yeast strain was used to build the SuperPlots shown on the right. Data are from three independent experiments, with n ≥ 25 for each condition in each assay. (H) Fluorescence recovery curves of mCherry fusions of Plin4 4mer 2T > V (green points) and 2T > V csw mutants (blue points) on LDs in HeLa cells. Each curve represents FRAP of a single LD in one cell.
-
Figure 6—source data 1
The polar face of Plin4 AH is key for specific and stable coating of LDs in cells.
- https://cdn.elifesciences.org/articles/61401/elife-61401-fig6-data1-v2.xlsx
Figure 6—figure supplement 1
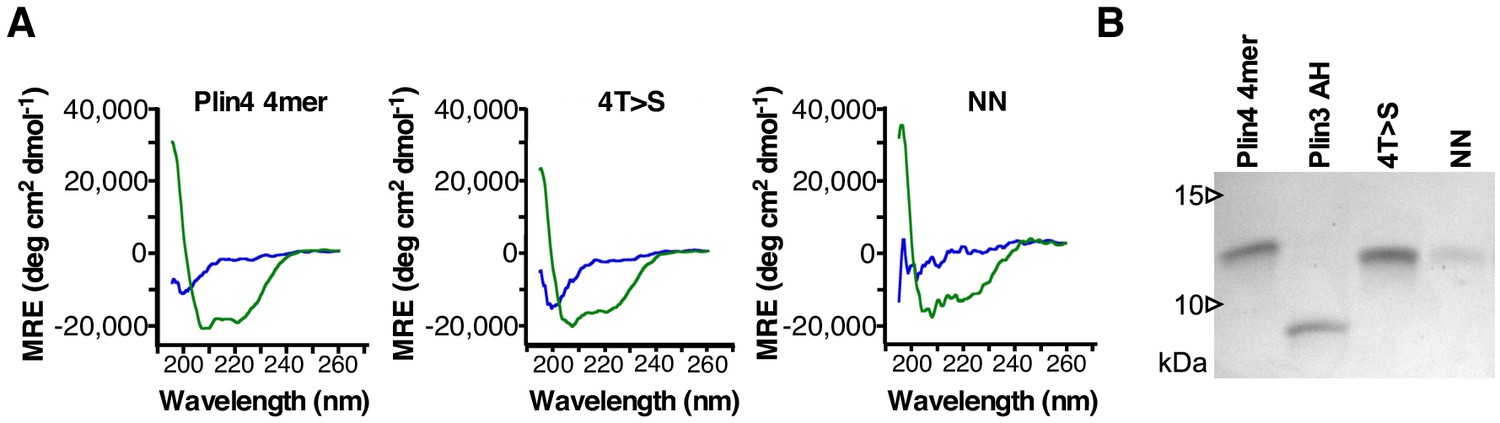
Plin4 4mer mutants are not affected in their helical folding.
(A) CD spectra showing mean residue ellipticity (MRE) of purified Plin4 4mer (19 μM), 4T > S (19 μM) and NN (6 μM) mutants in Tris buffer (blue lines) or in buffer with 50% TFE (green lines). (B) Tricine SDS-PAGE analysis of the relative concentrations of the purified proteins. Gel was stained with Coomassie Blue.
Figure 6—figure supplement 2
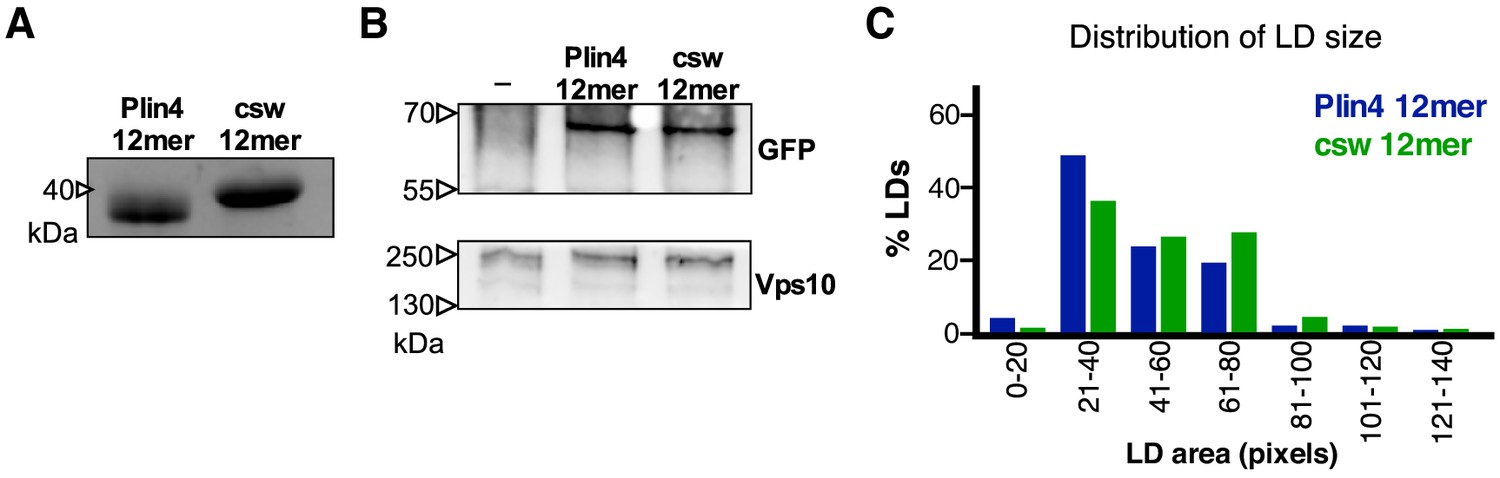
Additional data for Plin4 charge-swap mutant.
(A) SDS-PAGE analysis of purified Plin4 12mer and csw 12mer. Gel stained with Coomassie Blue. (B) Western-blot analysis of Plin4 12mer-GFP and csw 12mer-GFP expression in WT yeasts, showing similar expression levels. Vps10 was used as loading control. (C) Influence of redistribution of charge in Plin4 12mer on LD size in yeast. Plot shows distribution of LD size in pet10Δ cells incubated with OA for 24 hr and expressing GFP fusions of Plin4 12mer or csw 12mer mutant. Graph shows a representative of three independent experiments, with 270 LDs measured for each construct. Pixel size: 0.091 μm x 0.091 μm.
Figure 7
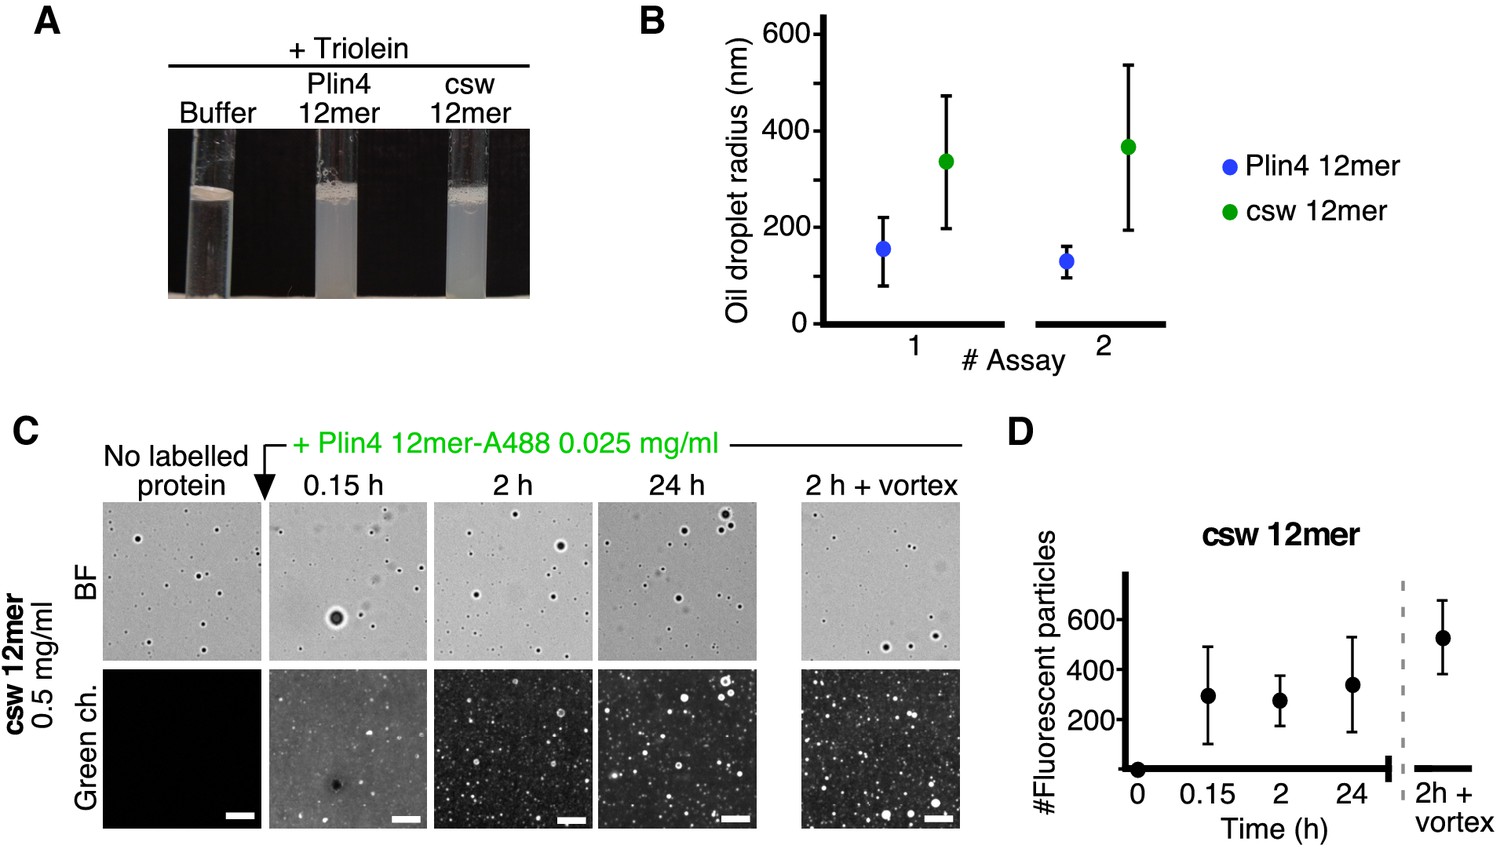
The distribution of charged residues in the polar face of Plin4 AH is key for stable coating of triolein in vitro.
(A) Fifteen µl triolein was added to 285 µl of HK buffer containing Plin4 12mer wild-type or the csw mutant (0.5 mg/ml each). After vigorous vortexing, the samples were photographed. (B) DLS measurements of the hydrodynamic radius of particles in emulsions shown in (A), from two independent experiments (note that data in assay #1 for Plin4 12mer is the same as in Figure 1G at 3 hr). Dots represent peak maxima and vertical bars represent polydispersity from one representative measurement. (C) A triolein emulsion was prepared with Plin4 12mer or csw 12mer mutant (0.5 mg/ml). At the indicated time, fluorescent Plin4 12mer-Alexa488 (0.025 mg/ml) was gently added. The emulsions were imaged in the bright field mode (BF) and by fluorescence to detect the incorporation of Plin4 12mer-Alexa488 into the proteolipid particles. Finally, the suspension was vortexed again to promote maximum incorporation of Plin4 12mer-Alexa488 in the emulsion. Scale bars: 5 μm. (D) Quantification (mean ± SD) of the experiment shown in B, as determined from four separate fields (73 × 100 μm) in the same experiment. The graphs are representative of at least two independent experiments. Time on the x-axis is plotted using logarithmic scale.
-
Figure 7—source data 1
Redistribution of charged residues of Plin4 AH affects particle size in oil emulsions and dynamics of protein-oil interaction.
- https://cdn.elifesciences.org/articles/61401/elife-61401-fig7-data1-v2.xlsx
Figure 8

Plin4 adopts a helical conformation at the surface of oil and forms a dense monolayer.
(A) CD analysis of three independent samples of Plin4 12mer-oil emulsion purified by sucrose step gradients (left panel), compared with CD spectra Plin4 12mer in a similar concentration range in Tris buffer (blue lines) or in buffer with 50% TFE (green lines) (B–D). Measurement of Plin4 12mer density at the oil surface. (B) A mixture of Alexa488-labeled and unlabeled Plin4 12mer (1:20) was vortexed with oil and mean droplet surface fluorescence from two independent experiments was quantified. Each data point represents one droplet. (C) Fluorescent Plin4 12mer mixtures at the indicated ratio and concentration were incubated with bead-supported diphytanoyl bilayers. Scale bar: 5 µm. (D) Graph shows mean surface bead fluorescence from five experiments (A to F) with varying Plin4 12mer concentration, Alexa488- to unlabeled Plin4 ratio and number of beads (1x = 1.7×10⁶ ± 20% in 30 µl), as indicated below the graph. Each data point represents one bead; lines indicate mean values for each experiment. Bottom row: Surface area of Plin4 12mer on oil was calculated in each experiment by dividing surface fluorescence on beads per Plin4 surface density with surface fluorescence on oil (panel B); see Supplementary file 2 for details. (E) Model of Plin4 AH binding to oil. 1: Plin4 AH is unfolded in solution and folds in contact with a hydrophobic surface. 2: Plin4 AH binds as a monomeric helix to the lipid surface, using its weakly-hydrophobic face. The interaction is stabilized by the length of the AH. Steps 1–2 are common for all perilipin AHs. 3: Plin4 AHs interact laterally via charged residues, forming a dense and highly stable coat-like lattice.
-
Figure 8—source data 1
Estimate of Plin4 12mer density on oil surface.
- https://cdn.elifesciences.org/articles/61401/elife-61401-fig8-data1-v2.xlsx
Author response image 1
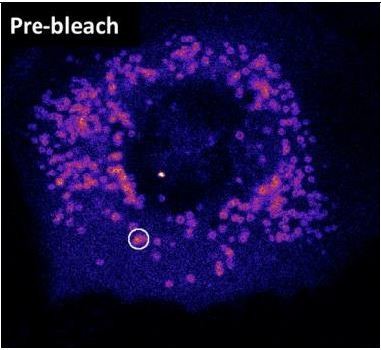
Image showing a HeLa cell expressing Plin4 AH before FRAP.
The area that was bleached is marked.
Videos
Video 1
Adsorption of Plin4 onto the triolein interface.
A confocal time-lapse recording of diffusion of Alexa-488-labeled Plin4 12mer into the side microfluidic channel and its adsorption onto the triolein interface. The relative fluorescence intensity profile along the channel center is shown at the bottom. Scale bar: 100 µm.
Video 2
Plin4 remains bound onto the triolein interface after rinsing.
A confocal time-lapse recording of rinsing the side microfluidic channel with buffer after Alexa-488-labeled Plin4 12mer adsorbed to the triolein interface (see Video 1). The fluorescence intensity profile along the channel center is shown at the bottom. Scale bar: 100 µm.
Video 3
Alexa-488 dye does not adsorb onto the triolein interface.
A confocal time-lapse recording of Alexa-488 dye diffusion into the side microfluidic channel toward the triolein meniscus. The relative fluorescence intensity profile along the channel center is shown at the bottom. Scale bar: 100 µm.
Video 4
Rinsing completely removes Alexa-488.
A confocal time-lapse recording of rinsing Alexa-488 dye out of the side microfluidic channel. The fluorescence intensity profile along the channel center is shown at the bottom. Scale bar: 100 µm.
Tables
Key resources table
| Reagent type (species) or resource | Designation | Source or reference | Identifiers | Additional information |
|---|---|---|---|---|
| Gene (Homo sapiens) | PLIN1 | Jacquier et al., 2013 | PLIN1_HUMAN AAH31084.1 | Supplementary file 1 |
| Gene (Homo sapiens) | PLIN2 | Jacquier et al., 2013 | PLIN2_HUMAN AAH05127.1 | Supplementary file 1 |
| Gene (Homo sapiens) | PLIN3 | Jacquier et al., 2013 | PLIN3_HUMAN AAC39751.1 | Supplementary file 1 |
| Strain, strain background (Escherichia coli) | BL21(DE3) | ThermoFisher | C600003 | Chemically competent cells |
| Strain, strain background (Saccharomyces cerevisiae) | BY4742 | Euroscarf | MATα his3Δ1 leu2Δ0 lys2Δ0 ura3Δ0 | |
| Strain, strain background (S. cerevisiae) | pet10Δ | Euroscarf | MATα his3Δ1 leu2Δ0 lys2Δ0 ura3Δ0 pet10Δ::KANMX4 | |
| Strain, strain background (S. cerevisiae) | Pet10-GFP | Huh et al., 2003 | MATα his3Δ1 leu2Δ0 lys2Δ0 ura3Δ0 PET10-GFP::HisMX | |
| Cell line (D. melanogaster) | S2 | ThermoFisher | R69007 | |
| Cell line (Homo sapiens) | HeLa | ATCC | CCL-2 | |
| Antibody | Anti-GFP (rabbit polyclonal) | Thermo Fisher Scientific | A11122 | (1:5000) |
| Antibody | Anti-rabbit (goat polyclonal, HRP conjugate) | Sigma-Aldrich | A6154 | (1:5000) |
| Antibody | Anti-Vps10 (mouse monoclonal) | Molecular probes | A-21274 | (1:100) |
| Antibody | Anti-mouse (donkey, HRP conjugate) | GE Healthcare | NA934V | (1:10000) |
| Peptide, recombinant protein | Plin4 12mer | Čopič et al., 2018 | Human Plin4 (aa510-905) | Supplementary file 2 |
| Peptide, recombinant protein | Plin4 4mer | Čopič et al., 2018 | Human Plin4 (aa246-377) | Supplementary file 2 |
| Peptide, recombinant protein | Plin4(4T > S) (4mer) | This study | Supplementary file 2 | |
| Peptide, recombinant protein | Plin4(NN) (4mer) | This study | Supplementary file 2 | |
| Peptide, recombinant protein | Plin4 csw (12mer) | This study | Supplementary file 2 | |
| Peptide, recombinant protein | Plin3 AH | This study | Human Plin3 (aa113 – 205) | Supplementary file 2 |
| Chemical compound, drug | SyproOrange | ThermoFisher | S6651 | |
| Chemical compound, drug | Alexa488 C5 maleimide | ThermoFisher | A10254 | |
| Chemical compound, drug | Alexa568 C5 maleimide | ThermoFisher | A20341 | |
| Chemical compound, drug | Bodipy 493/503 | ThermoFisher | 11540326 | |
| Chemical compound, drug | Diphytanoyl-phosphatidylserine | Avanti Lipids | AVA-850408C-25Mg | |
| Chemical compound, drug | Diphytanoyl-phosphatidylcholine | Avanti Lipids | AVA-850356C-200Mg | |
| Other | Glass microfluidic chip with a T-junction | Dolomite | part # 3000086 | |
| Other | Glass microfluidic chip with a T-junction | Dolomite | part # 3000024 | |
| Other | Silica Microspheres,5.00 μm, SS05N | Bang laboratories | SS05003-0.5 |
Table 1
Plasmids used in this study.
| Name | Insert | Region (aa) * | Vector | Host † | Source |
|---|---|---|---|---|---|
| pCLG03 | Plin4 4mer | hPlin4(246-377) | pET21b | E. coli | Čopič et al., 2018 |
| pKE23 | Plin4 12mer | hPlin4(510-905) | pET21b | E. coli | Čopič et al., 2018 |
| pSB49 | 4T > S (4mer) | 4x[246–278 M5t] ‡ | pmCherry-N1 | Mamm | Čopič et al., 2018 |
| pMGA9 | 4T > S (4mer) | 4x[246–278 M5t] ‡ | pET21b | E. coli | This study |
| pGFP-Plin1 | Human Plin1 | Full cDNA | pGREG576 (ADH1pr, GFP) | Yeast | Jacquier et al., 2013 |
| pGFP-Plin2 | Human Plin2 | Full cDNA | pGREG576 (ADH1pr, GFP) | Yeast | Jacquier et al., 2013 |
| pGFP-Plin3 | Human Plin3 | Full cDNA | pGREG576 (ADH1pr, GFP) | Yeast | Jacquier et al., 2013 |
| pRHT140 | ADHpr-mcs-GFP | pRS416 (CEN-URA3) | Yeast | S. Leon | |
| pMGA4 | ADHpr-mcs-mCherry (swap of GFP in pRHT140) | pRS416 (CEN-URA3) | Yeast | This study | |
| pMGA11 | Plin1 AH-GFP | hPlin1(aa108-194) | pRHT140 | Yeast | This study |
| pMGA10 | Plin1 AH-mChe | hPlin1(aa108-194) | pMGA4 | Yeast | This study |
| pMGA6 | Plin2 AH-GFP | hPlin2(aa100-192) | pRHT140 | Yeast | This study |
| pMGA5 | Plin2 AH-mCherry | hPlin2(aa100-192) | pMGA4 | Yeast | This study |
| pMGA7 | Plin3 AH-GFP | hPlin3(aa113-205) | pRHT140 | Yeast | This study |
| pMGA29 | Plin3(87-205)-GFP | hPlin3(aa87-205) | pRHT140 | Yeast | This study |
| pMGA28 | Plin3(87-205)-mCherry | hPlin3(aa87-205) | pMGA4 | Yeast | This study |
| pMGA19 | Plin3 AH | hPlin3(aa113 – 205) | pET21b | E. coli | This study |
| pKE31 | Plin4 4mer-GFP | hPlin4(aa246-377) | pRHT140 | Yeast | Čopič et al., 2018 |
| pKE33 | Plin4 12mer-GFP | hPlin4(aa510-905) | pRHT140 | Yeast | Čopič et al., 2018 |
| pMGA16 | Plin4 12mer-mCherry | hPlin4(aa510-905) | pMGA4 | Yeast | This study |
| pCLG26 | Plin4 8mer | hPlin4(aa246-509) | pmCherry-N1 | Mamm | Čopič et al., 2018 |
| pMGA31 | Plin4 6mer-GFP | hPlin4(aa246-433) | pRHT140 | Yeast | This study |
| pMGA23 | Plin4 8mer-GFP | hPlin4(aa246-509) | pRHT140 | Yeast | This study |
| pACJ22 | Plin4 4mer | hPlin4(aa246-377) | pmCherry-N1 | Mamm | Čopič et al., 2018 |
| pSB58 | 2D > E (4mer) | 4x[246–278 M17e] ‡ | pmCherry-N1 | Mamm | This study |
| pSB60 | NN (4mer) | 4x[246–278 M18q] ‡ | pmCherry-N1 | Mamm | This study |
| pMGA32 | NN (4mer) | 4x[246–278 M18q] ‡ | pET21b | E. coli | This study |
| pSB83 | QN (4mer) | 4x[246–278 M19qn] ‡ | pmCherry-N1 | Mamm | This study |
| pSB65 | QQ (4mer) | 4x[246–278 M20q2] ‡ | pmCherry-N1 | Mamm | This study |
| pSB86 | 3K > R | 4x[246–278 M21r] ‡ | pmCherry-N1 | Mamm | This study |
| pCLG62 | Plin4 12mer | hPlin4(aa510-905) | pmCherry-N1 | Mamm | Čopič et al., 2018 |
| pSB06 | csw 12mer | Charge swap of hPlin4(aa510-905) | pmCherry-N1 | Mamm | This study |
| pCLG36 | Plin4 2T > V 4mer | 4x[246–278 M10t2] ‡ | pmCherry-N1 | Mamm | Čopič et al., 2018 |
| pACJ41 | Plin4 csw 2T > V 4mer | Charge swap and 2T > V of 4x[246–278 M7kt] ‡ | pmCherry-N1 | Mamm | Čopič et al., 2018 |
| pSB41 | Plin4 12mer-GFP | hPlin4(aa510-905) | pMTWG | Dros. | Čopič et al., 2018 |
| pMGA3 | csw 12mer | Charge swap of hPlin4(aa510-905)-GFP | pRHT140 | Yeast | This study |
| pMGA17 | csw 12mer | Charge swap of hPlin4(aa510-905)-mCherry | pMGA4 | Yeast | This study |
| pMGA1 | csw 12mer | Charge swap of hPlin4(aa510-905) | pET21b | E. coli | This study |
-
* Position of amino acids (aa) in human perilipin sequences.
† Mamm: mammalian cells, Dros.: Drosophila cells.
-
‡ All mutants are four repeats of the same amino acid sequence.
Additional files
-
Supplementary file 1
Summary of synthetic gene sequences and protein sequences used in this study.
- https://cdn.elifesciences.org/articles/61401/elife-61401-supp1-v2.xlsx
-
Supplementary file 2
Calculation of Plin4 12mer density on oil, related to Figure 8B–D.
Table summarizes input values and calculations for five experimental conditions (A-E) used to standardize the fluorescence of Alexa488 labeled Plin4 12mer on lipid surface, using bead-supported diphytanoyl bilayers as standards.
- https://cdn.elifesciences.org/articles/61401/elife-61401-supp2-v2.docx
-
Transparent reporting form
- https://cdn.elifesciences.org/articles/61401/elife-61401-transrepform-v2.docx
Download links
A two-part list of links to download the article, or parts of the article, in various formats.
Downloads (link to download the article as PDF)
Open citations (links to open the citations from this article in various online reference manager services)
Cite this article (links to download the citations from this article in formats compatible with various reference manager tools)
Exceptional stability of a perilipin on lipid droplets depends on its polar residues, suggesting multimeric assembly
eLife 10:e61401.
https://doi.org/10.7554/eLife.61401


