Cytoneme delivery of Sonic Hedgehog from ligand-producing cells requires Myosin 10 and a Dispatched-BOC/CDON co-receptor complex
- Department of Cell and Molecular Biology, St. Jude Children’s Research Hospital, United States
- Cell and Tissue Imaging Center, St. Jude Children’s Research Hospital, United States
- Center for Advanced Genome Engineering, St. Jude Children’s Research Hospital, United States
- Department of Biostatistics, St. Jude Children’s Research Hospital, United States
- Department of Cell Biology and Physiology, University of North Carolina School of Medicine, United States
Figures
Figure 1 with 1 supplement
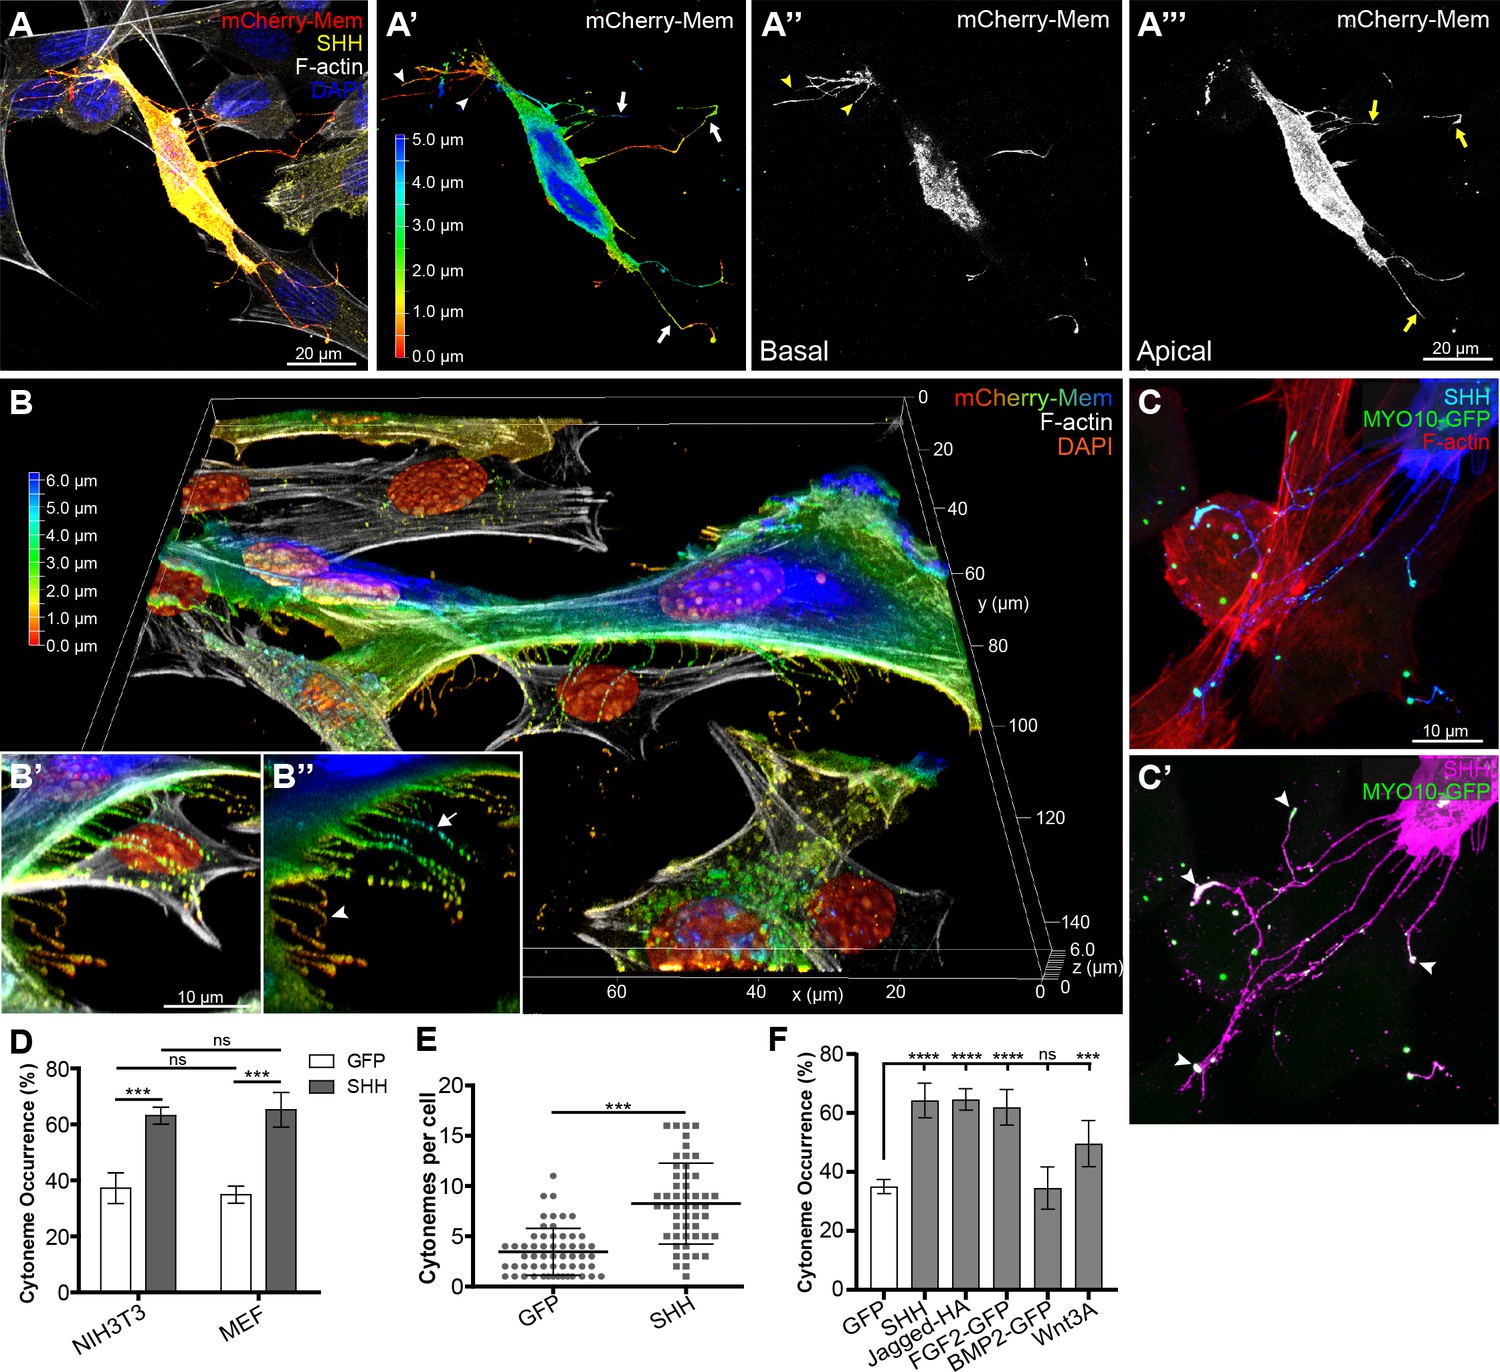
SHH promotes cytoneme occurrence.
(A–A’’’) Cytonemes of a SHH (yellow) and mCherry-Mem (red) expressing NIH3T3 cell contacting neighboring cells is shown. (A’) mCherry-Mem signal represented as a Z-axis depth colored projection showing filopodia (arrowheads) and cytonemes (arrows). (A’’) An image of cell membrane protrusions that maintain contact with the culture coverslip shows that coverslip-adjacent projections are shorter (arrowheads). (A’’’) A projection of the cell membrane not in contact with the coverslip shows cytonemes (arrows). (B–B’’) A 3D render of an MEF cell expressing SHH and mCherry-Mem colored for Z-axis depth shows cytonemes reaching around a neighboring cell (zoom in and rotation B’,B’’). Coverslip-adjacent projecting filopodia are orange (arrowhead), with a cytoneme example indicated by an arrow in B’’ (green). (C) An NIH3T3 cell expressing MYO10-GFP and SHH (blue). F-actin is shown in red. SHH signal is saturated in C’ (magenta) to visualize cytonemes. MYO10-GFP accumulates in puncta at cytoneme tips with SHH (C’ arrowheads). (D) Cytoneme occurrence rates were calculated in MEM-fixed NIH3T3 and MEF cells in the absence and presence of SHH. (E) The number of cytonemes per NIH3T3 cell were counted in the presence of either GFP (n = 57) or SHH expression (n = 51). (F) Cytoneme occurrence rates in NIH3T3 cells expressing GFP, SHH, Jagged-HA, FGF2-GFP, BMP2-GFP, or Wnt3A were quantified. Data are represented as mean ± SD. ns = not significant, ***p<0.001, ****p<0.0001.
Figure 1—figure supplement 1
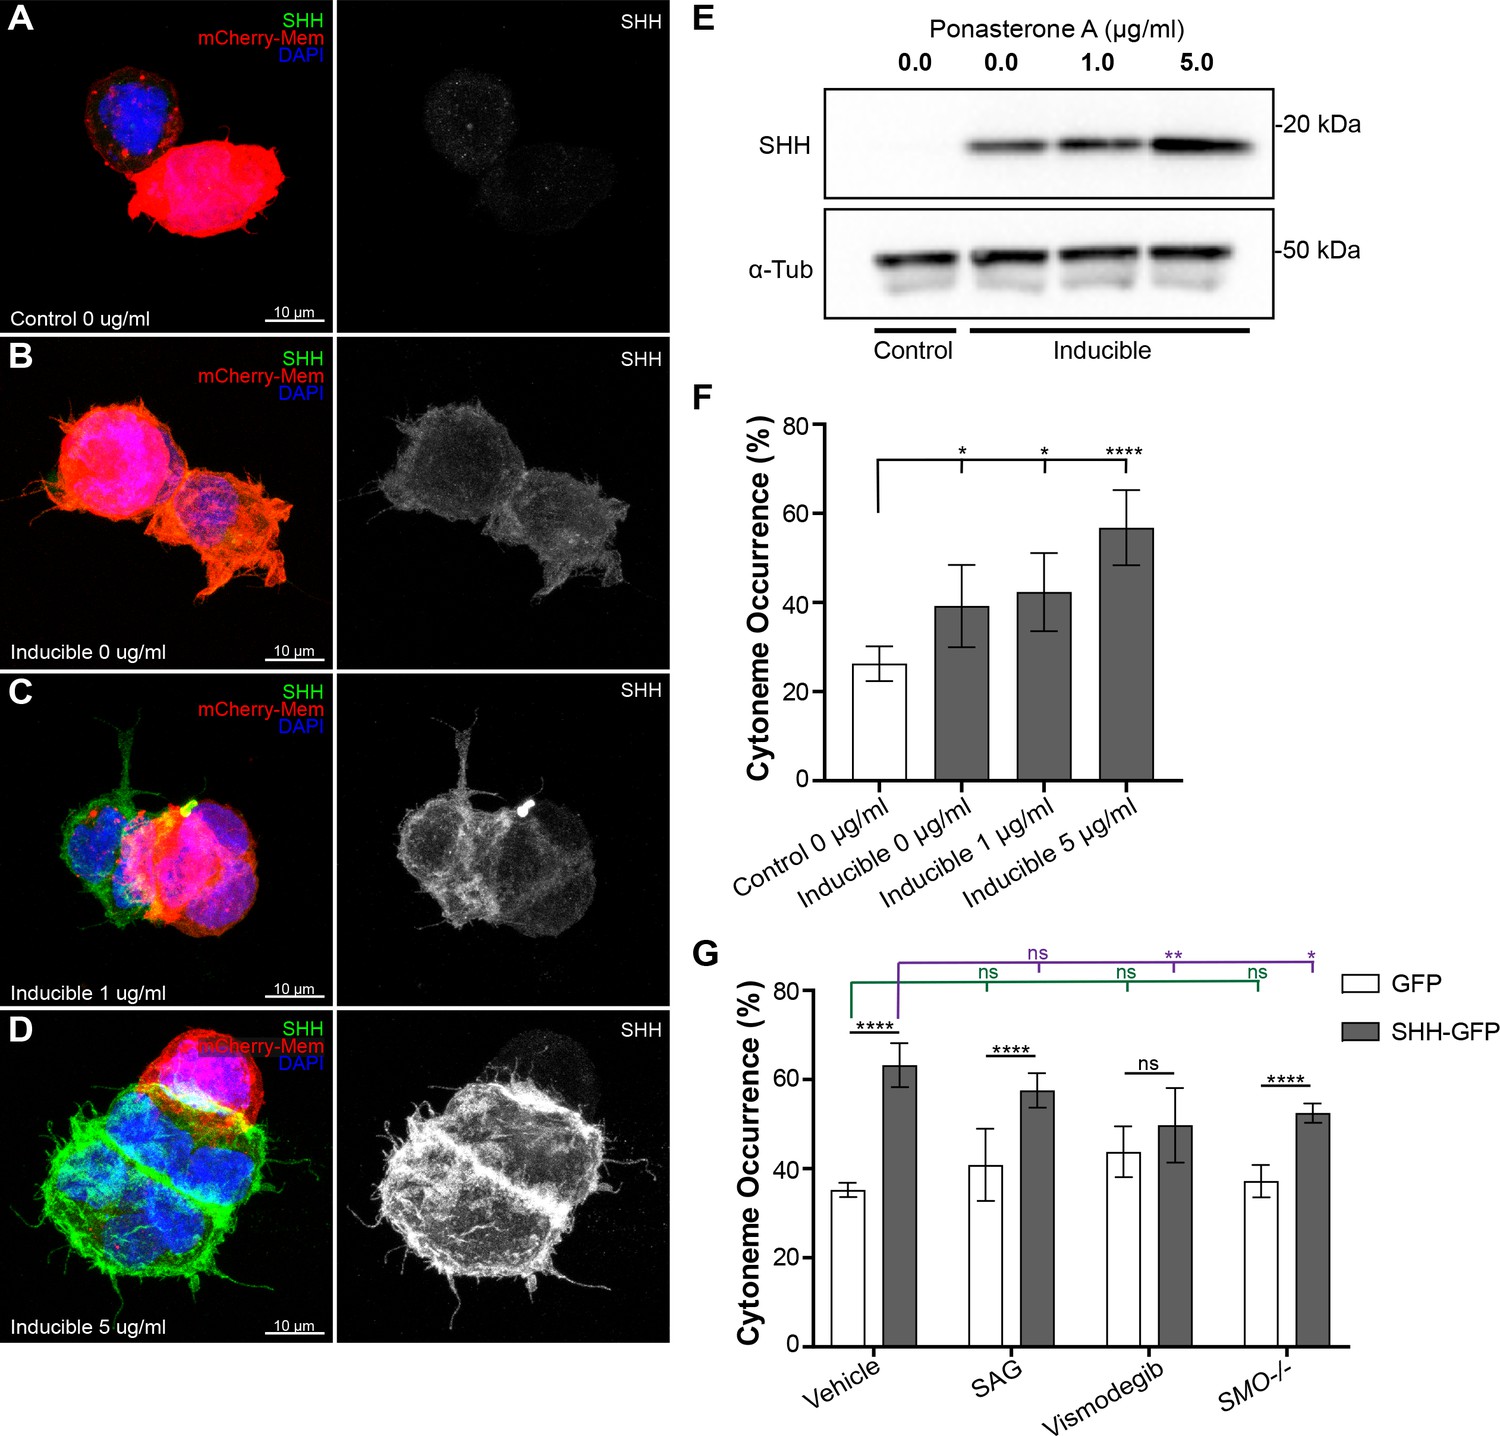
SHH promotes cytoneme formation in a concentration dependent manner.
(A–F) Immunofluorescence of mCherry-Mem (red) expressing control (A) and SHH (green) inducible HEK cells (B–D) incubated with increasing concentrations ponasterone A (A–D). (E) Immunoblots of lysates from corresponding cells. (F) Cytoneme occurrence rates were quantified in ponasterone A-treated cells. (G) Cytoneme occurrence rates were calculated in MEM-fixed wild-type and Smo-/- NIH3T3 cells expressing GFP or SHH-GFP treated with SMO agonist SAG, or antagonist vismodegib. All data are presented as mean ± SD. ns = not significant, *p<0.05, **p<0.01, ****p<0.0001.
Figure 2 with 1 supplement
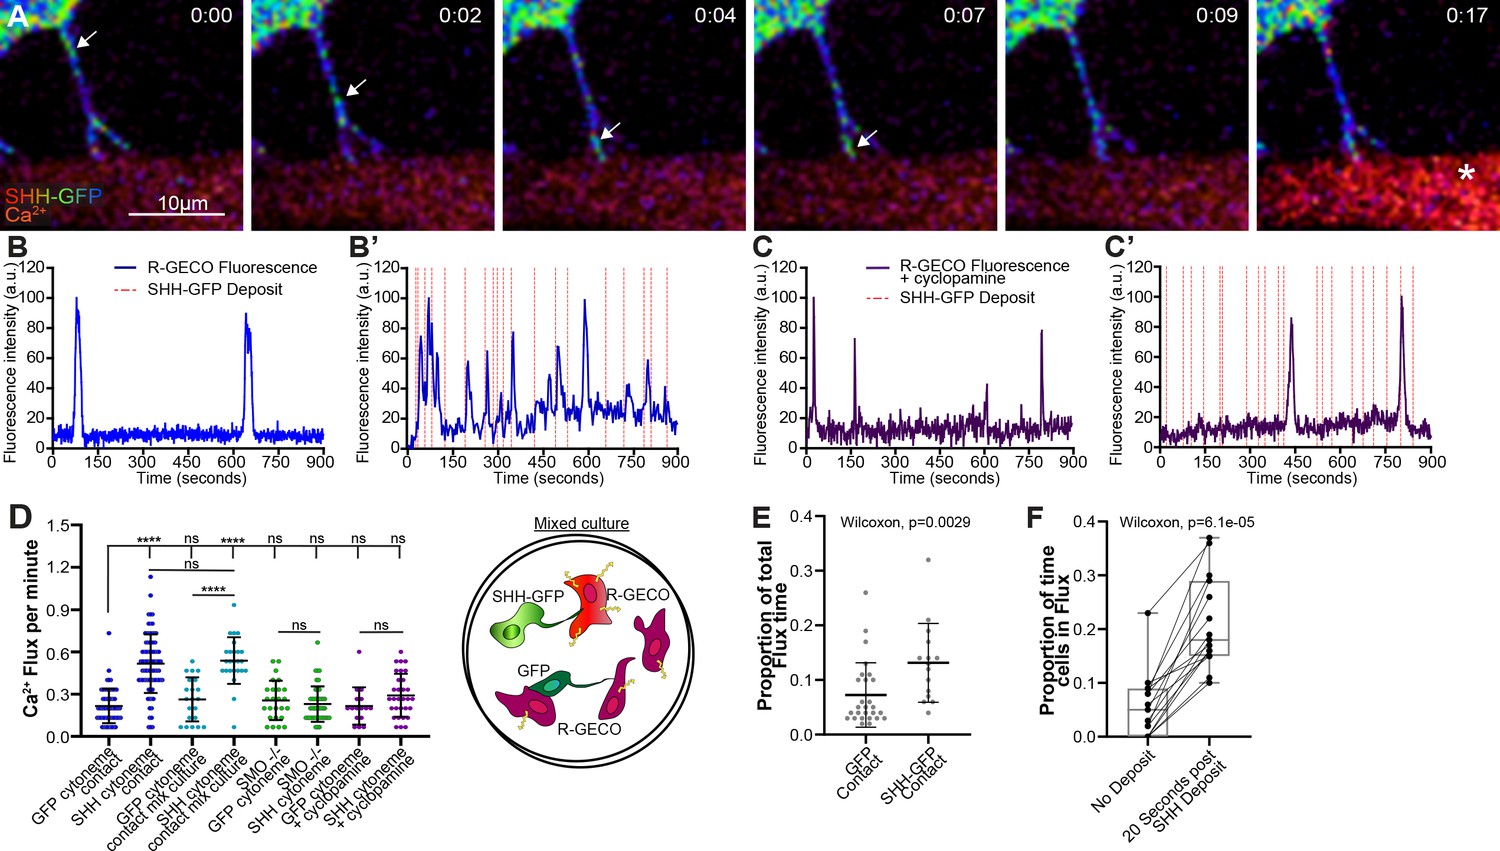
Cytoneme-based SHH delivery induces signaling in target cells.
(A) Time lapse images of an SHH-expressing NIH3T3 cell show SHH-GFP as a fluorescent intensity-spectrum in puncta. Progressive movement of a single punctum traveling down a cytoneme to the tip in contact with a R-GECO sensor cell is indicated by an arrow. R-GECO fluorescent intensity increases ~ 10 s after release of the SHH puncta from the cytoneme (asterisk). Time stamp indicates minutes:seconds. (B–C’) R-GECO fluorescent intensity graphs are shown for single cells in contact with a cytoneme from GFP-expressing (B and C) or SHH-GFP-expressing (B’ and C’) cells. Flux activity occurring over 15-min contact periods in the absence (B,B’) or presence (C,C’) of the inverse SMO agonist cyclopamine is shown. (D) Flux rates per minute were calculated for 14–51 individual cells per condition, with visual representation of the mixed culture conditions. (E) Total flux time for R-GECO reporter cells is shown (n = 27 for GFP and n = 15 for SHH contact). (F) Box plot (min/max whiskers) comparison of individual R-GECO cells (n = 15) receiving SHH-GFP cytoneme deposits measured as proportion of time spent in flux in the absence of an SHH deposit, or within 20 s following deposit. All data are presented as mean ± SD, unless stated otherwise. ns = not significant, ***p<0.001, ****p<0.0001. See also Figure 2—figure supplement 1. Source data for (B, B’, E and F) can be found in Figure 2—source data 1. Source data for (D) is located in Figure 2—source data 2.
-
Figure 2—source data 1
Normalized fluorescent intensity values of individual R-GECO cells in contact with GFP or SHH-GFP cytonemes.
- https://cdn.elifesciences.org/articles/61432/elife-61432-fig2-data1-v2.xlsx
-
Figure 2—source data 2
Flux counts per minute of R-GECO cells in contact with cytonemes from specified conditions.
- https://cdn.elifesciences.org/articles/61432/elife-61432-fig2-data2-v2.xlsx
Figure 2—figure supplement 1
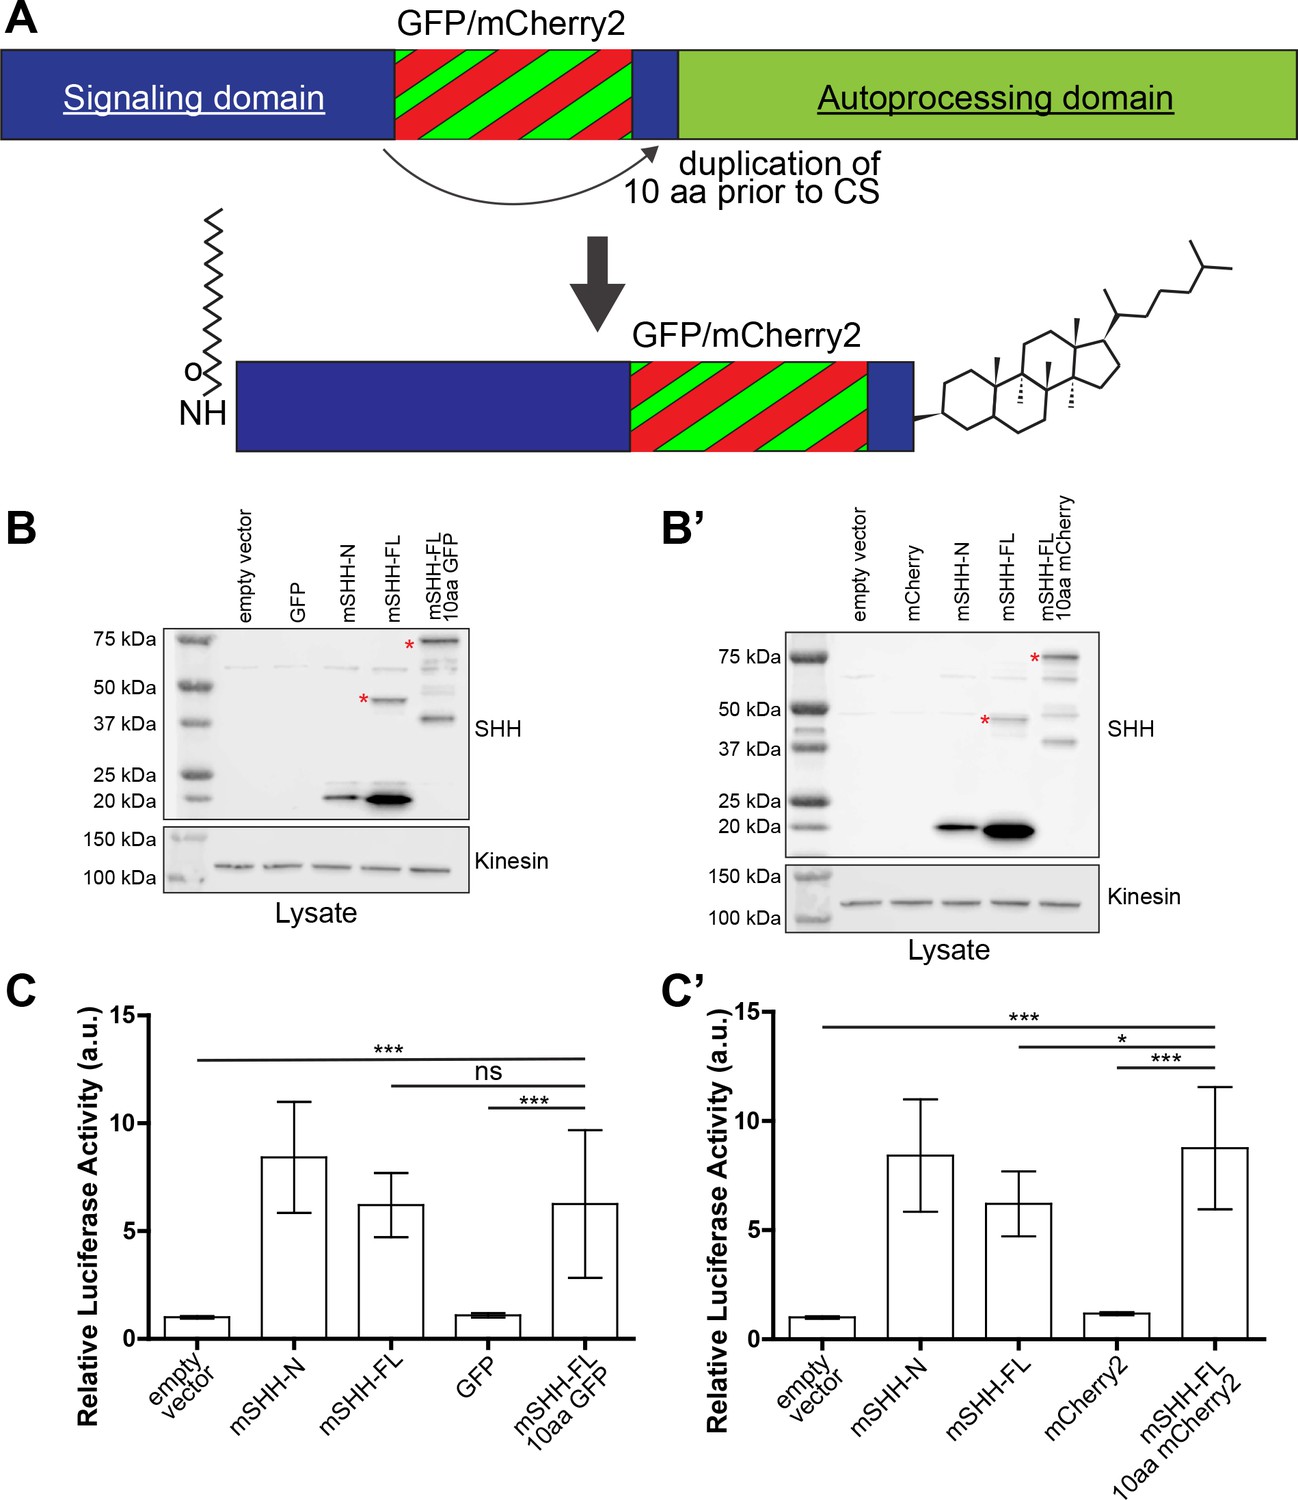
Generation and validation of mouse (m)SHH-GFP and SHH-mCherry.
(A) GFP or mCherry2 was inserted into the SHH signaling domain immediately prior to the autoprocessing site (Gly198, CS). The 10 amino acids prior to the cleavage site (CS) were duplicated carboxyl-terminal to the insert to ensure normal processing. (B,B’) Immunoblots of lysates from NIH3T3 cells expressing (B) SHH-GFP or (B’) SHH-mCherry are shown compared to SHH-FL and SHH-N. Red asterisks indicate unprocessed SHH proteins. (C,C’) SHH responsive Light II cells were co-cultured with HEK293T cells expressing the indicated SHH-fluorescent fusion proteins and assayed for ligand-induced reporter gene induction. Reporter assays were performed in triplicate, with three biological replicates. All data are presented as mean ± SD. ns = not significant, *p<0.05, ***p<0.001.
Figure 3 with 2 supplements
SHH is transported inside cytonemes.
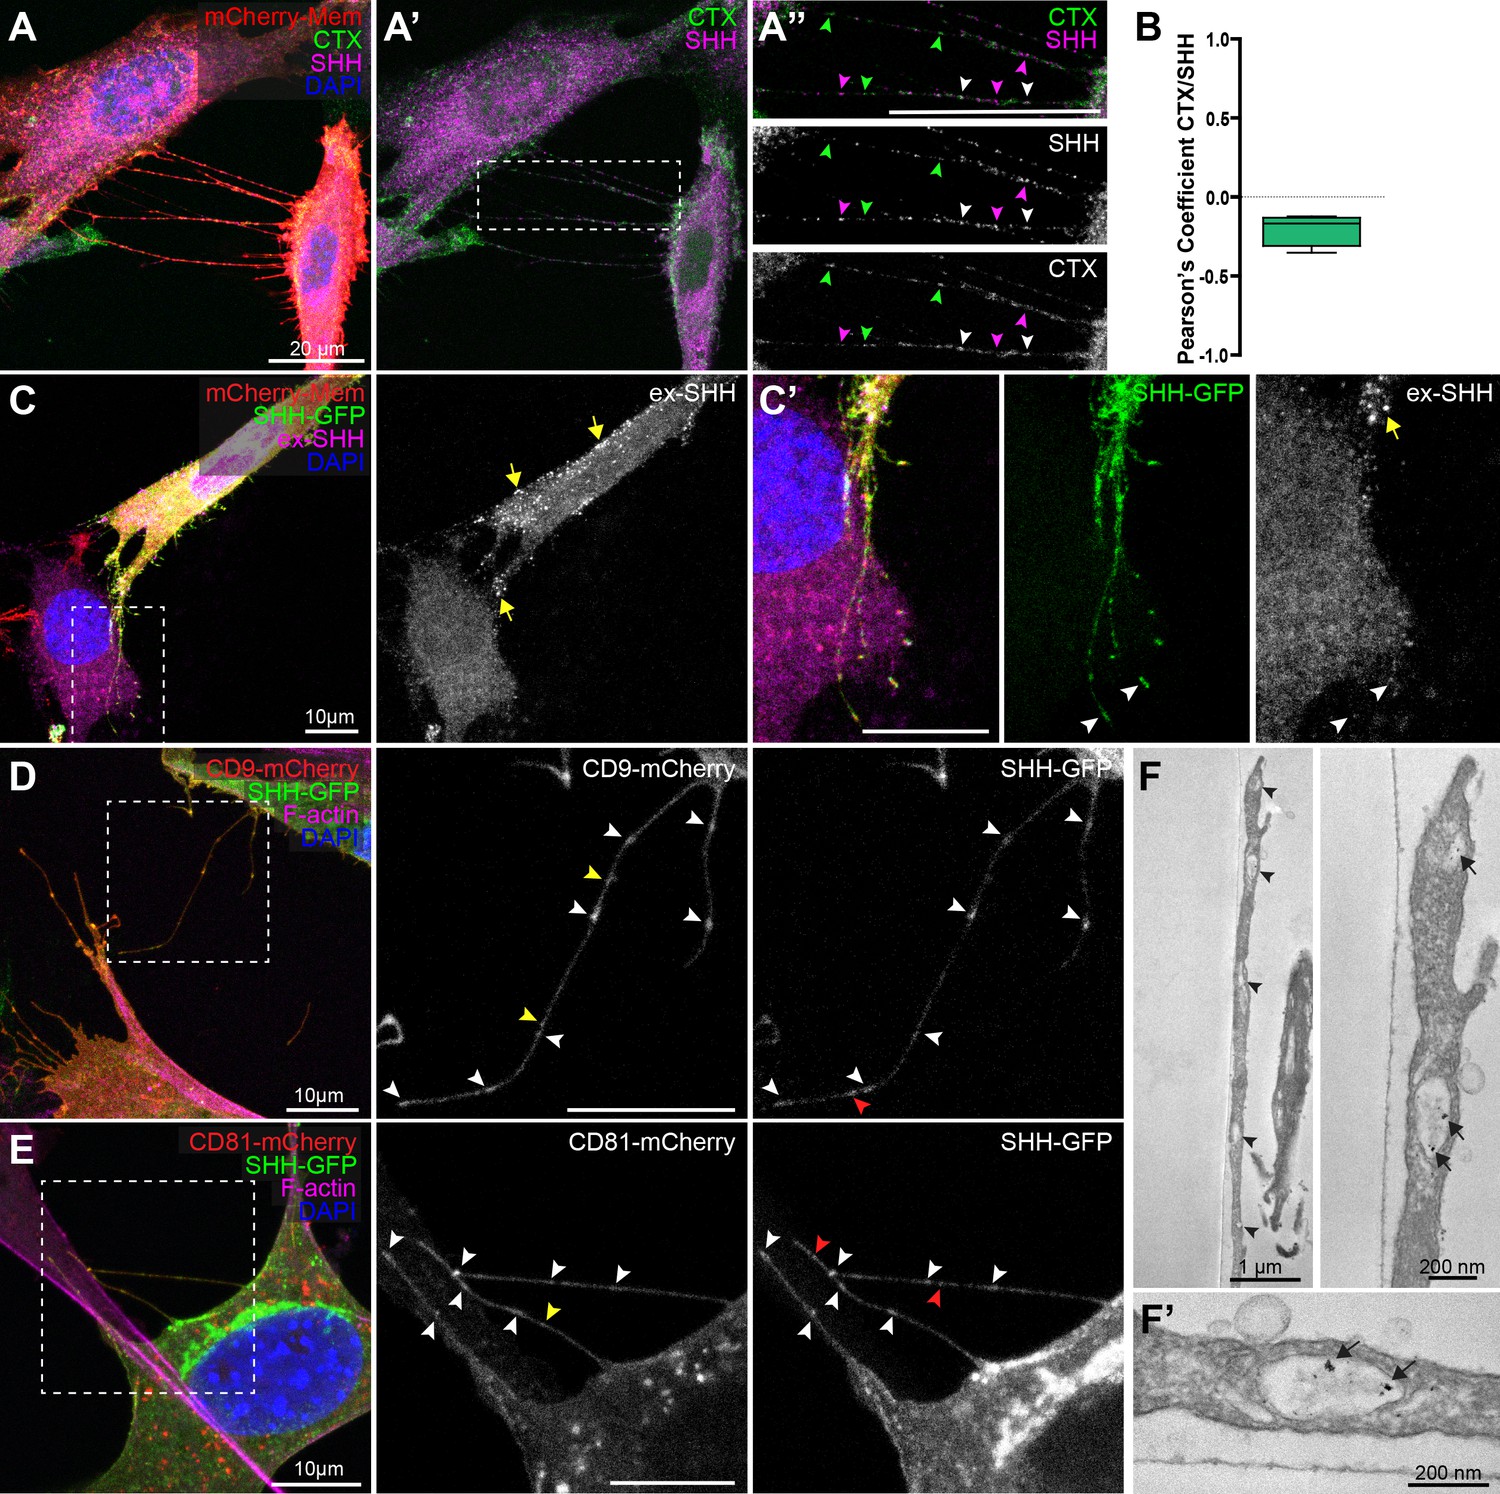
(A–A’’) NIH3T3 cells expressing SHH (magenta) and mCherry-Mem (red), were incubated with lipid raft marker CTX (green). (A’) shows CTX and SHH, and (A”) shows channels zoomed in with colored arrowheads indicating SHH or CTX puncta. White arrowheads mark rare colocalization events between SHH and CTX along cytonemes. (B) Box plot with min/max whiskers of Pearson’s correlation coefficients values of colocalization between SHH and CTX in cytonemes. (C,C’) NIH3T3 cell expressing SHH-GFP and mCherry-Mem is shown. Although SHH-GFP (green) is detected along cytonemes and at tips (C’, arrowheads), staining for extra-cellular SHH (ex-SHH, magenta and white) shows signal only on the cell body (C,C’, yellow arrows). (D,E) CD9-mCherry (D) and CD81-mCherry (E) colocalize with SHH-GFP in puncta along cytonemes (white arrowheads). CD9/CD81 puncta lacking SHH are indicted by yellow arrowheads. SHH-GFP puncta lacking CD9/CD81 are indicted by red arrowheads. (F,F’) Transmission electron microscopy sections of an SHH-mCherry expressing cell cytoneme immunolabeled with anti-mCherry. Cytonemes contain vesicles (F, arrow heads), a subset of which contain SHH-mCherry (F,F’ arrows). For all panels, nuclei are marked by DAPI (blue). See also Figure 3—figure supplements 1 and 2.
Figure 3—figure supplement 1
Control experiments for non-permeabilization immuno-staining of SHH and GFP and colocalization of SHH with lipid rafts, CD63 or Rab18 in cytonemes.
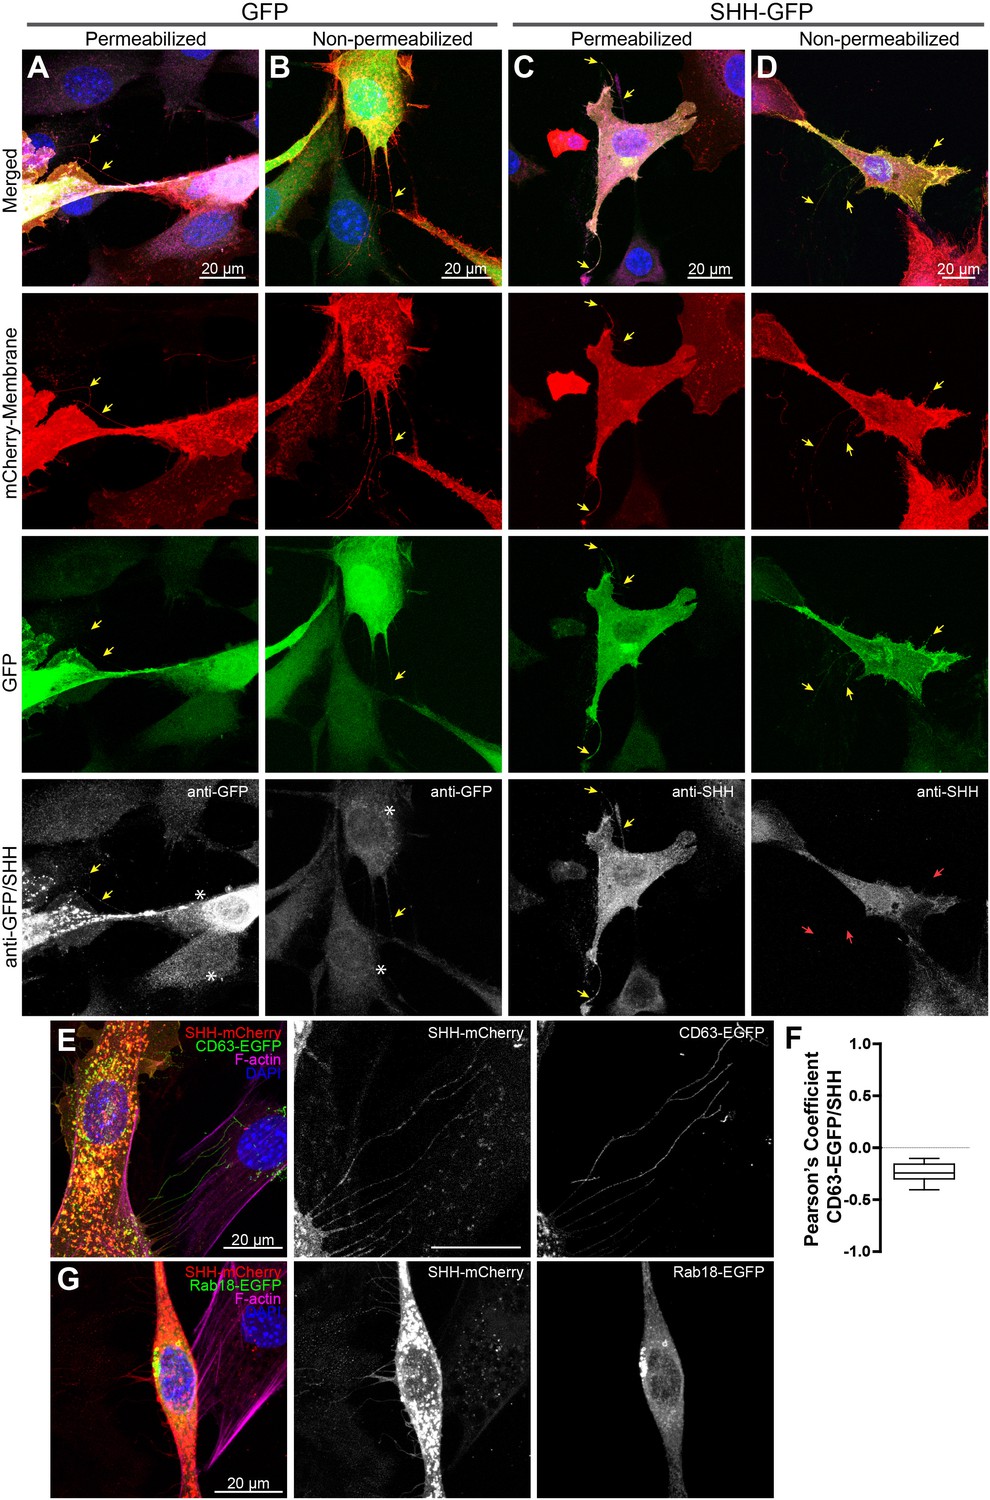
(A,B) Cytoplasmic GFP and mCherry-Mem transfected NIH3T3 cells were immuno-stained for GFP under (A) permeabilized or (B) non-permeabilized conditions. GFP is detected by anti-GFP in permeabilized cells, but not in non-permeabilized cells (asterisks). (C,D) SHH-GFP and mCherry-Mem transfected NIH3T3 cells were immuno-stained using anti-SHH under, (C) permeabilized or, (D) non-permeabilized conditions. SHH-GFP signal is evident in cytonemes in both conditions (yellow arrows), but not evident in non-permeabilized cells when probed with anti-SHH (red arrows). (E–G) Cytonemes of NIH3T3 cells expressing SHH-mCherry and CD63-EGFP (E) or Rab18-EGFP (G) analyzed by confocal microscopy do not show significant co-localization. Rab18-EGFP does not enter cytonemes. (F) Box plot with min/max whiskers of Pearson’s coefficients values of colocalization between SHH-mCherry and CD63-EGFP in cytonemes.
Figure 3—figure supplement 2
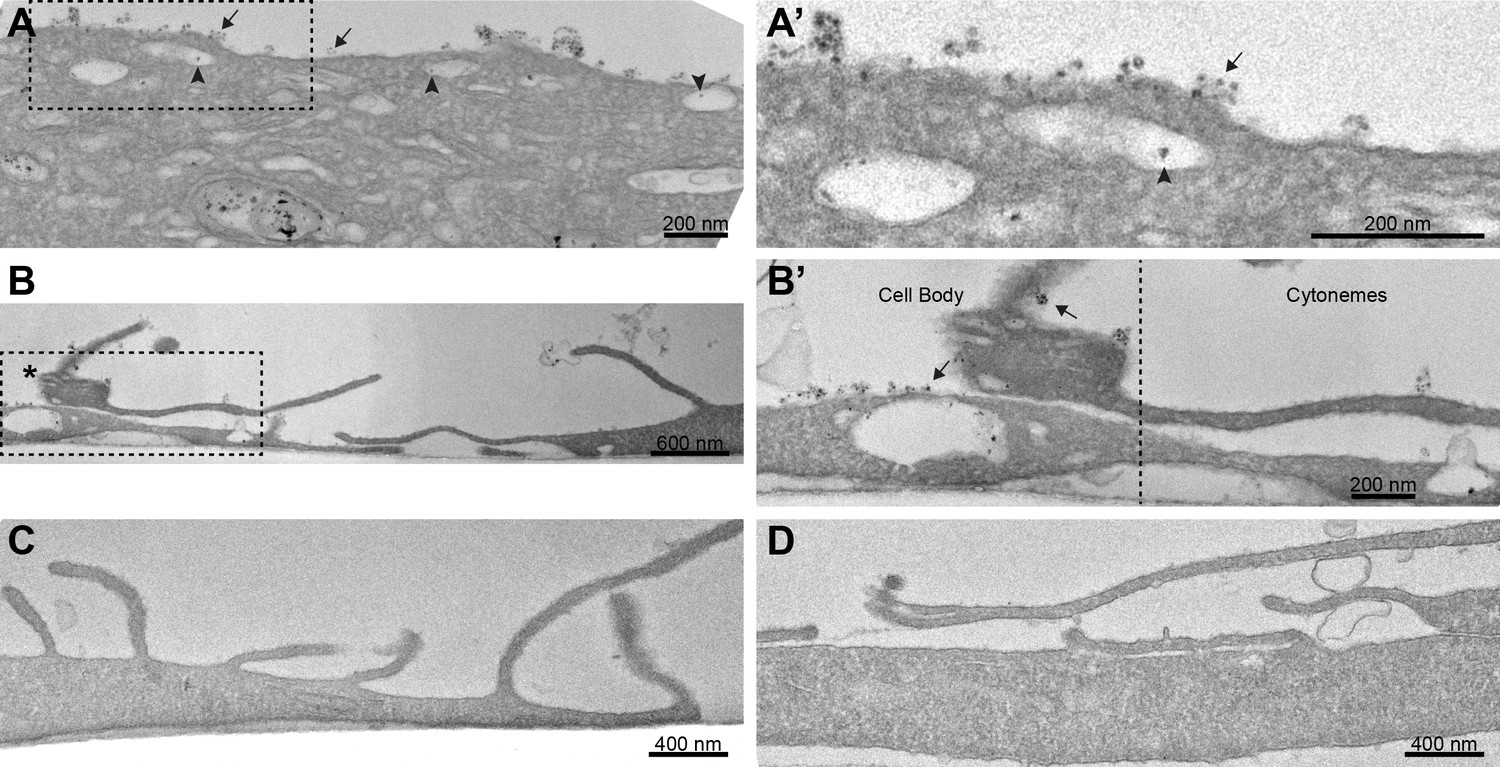
Immuno-TEM of SHH-mCherry in NIH3T3 cell cytonemes.
(A,A’) Anti-mCherry immuno-label detects SHH-mCherry in vesicles (arrowheads) and along the plasma membrane of producing cells (arrows, A’ zoom). Plasma membrane localization is similar to what was observed in non-permeabilized immuno-stains (Figure 2A). (B–B’) SHH-mCherry producing cell (asterisk, left) and receiving cells (right). (B’, zoom) Surface SHH-mCherry clusters are present along the main cell body (arrows), but absent along cellular protrusions. (C) Sections of SHH-mCherry-expressing NIH3T3 cells not exposed to mCherry primary antibody were incubated with streptavidin conjugated secondary antibody followed by silver enhancement. Nonspecific labeling was not detected. (D) A section from an NIH3T3 cell not expressing SHH-mCherry was incubated with anti-mCherry prior to secondary antibody incubation and silver enhancement. Nonspecific labeling was not detected.
Figure 4 with 2 supplements
Myosin10 facilitates cytoneme-based SHH transport and delivery.
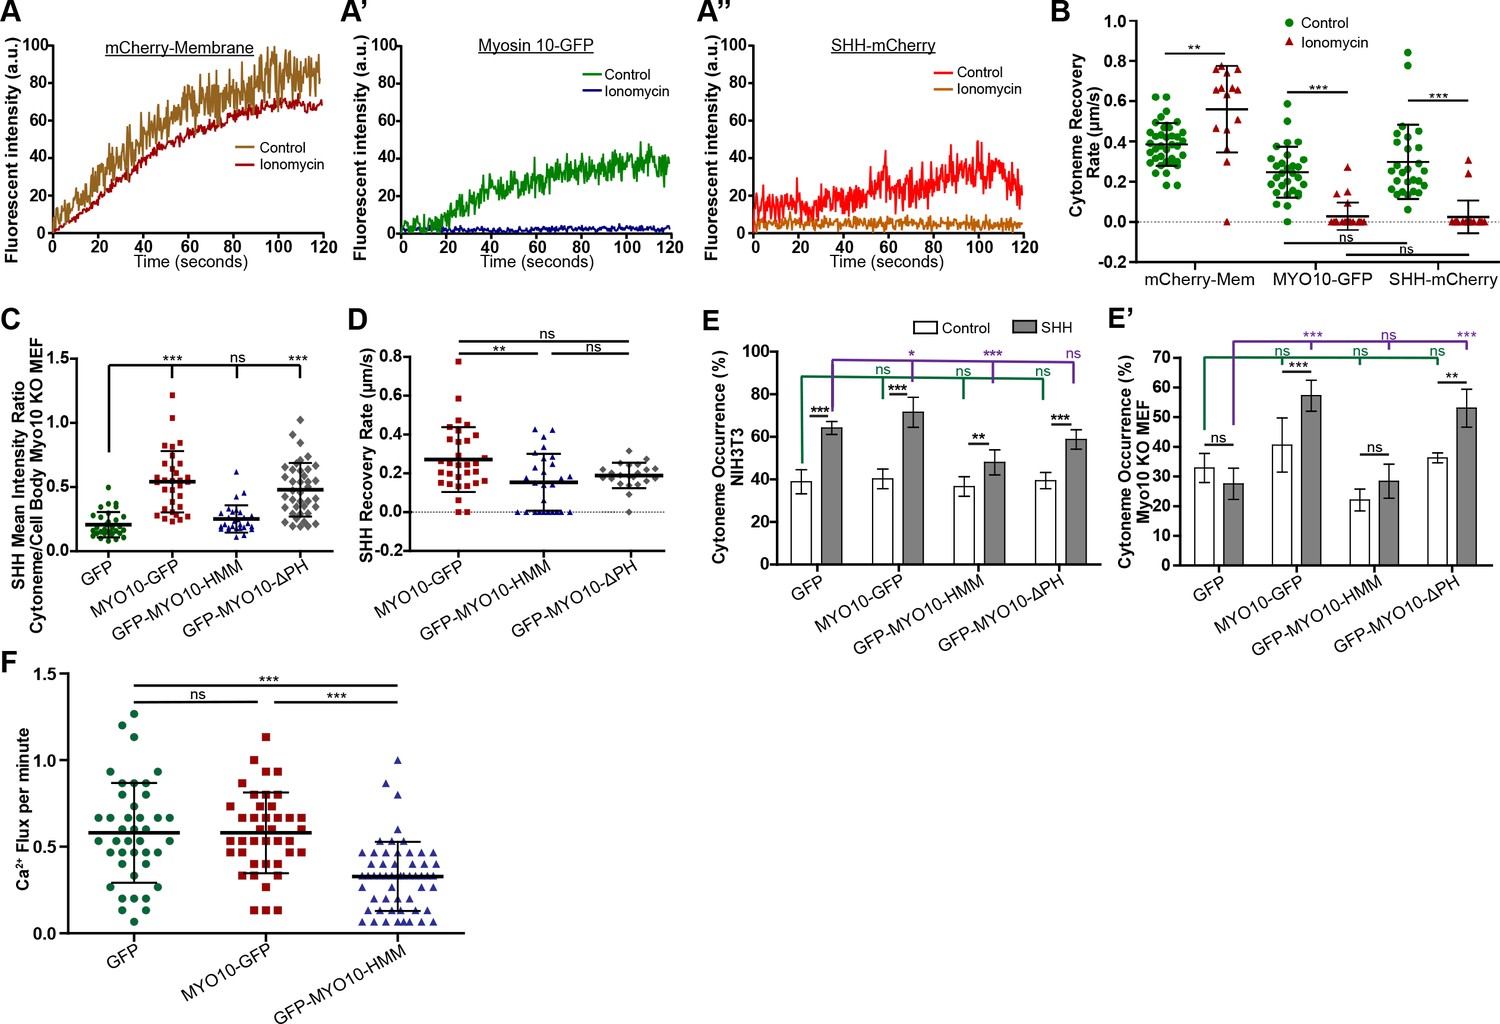
(A–A”) NIH3T3 cells expressing the indicated fluorescent proteins were subjected to FRAP. Representative FRAP curves of (A) mCherry-Mem, (A’) MYO10-GFP, and (A”) SHH-mCherry to a cytoneme tip in control (DMSO) or ionomycin-treated (2.5 µM) conditions are shown. (B) Scatter plots show the recovery rates of the indicated fluorescent proteins to cytoneme tips in control (DMSO) or ionomycin-treated conditions, calculated from FRAP curves (n = 14–38 cells). (C) Scatter plots of mean cytoneme to cell body SHH fluorescent signal ratios in Myo10-/- MEFs co-expressing GFP or the indicated MYO10 proteins (n = 28–38). (D) Scatter plots of FRAP calculated recovery rates for SHH-mCherry movement toward cytoneme tips in NIH3T3 cells co-expressing the indicated MYO10 proteins (n = 22–32). (E,E’) Cytoneme occurrence rates were calculated for MEM-fixed NIH3T3 and Myo10-/- MEFs co-expressing mCherry-Mem (control) or SHH plus the indicated MYO10 proteins or GFP control. (F) Ca2+ flux rates per minute were determined for R-GECO reporter cells in contact with cytonemes of SHH-producing cells co-expressing the indicated MYO10 proteins (n = 40–55 cells per condition). Data are represented as mean ± SD. See also Figure 4—figure supplements 1 and 2.
Figure 4—figure supplement 1
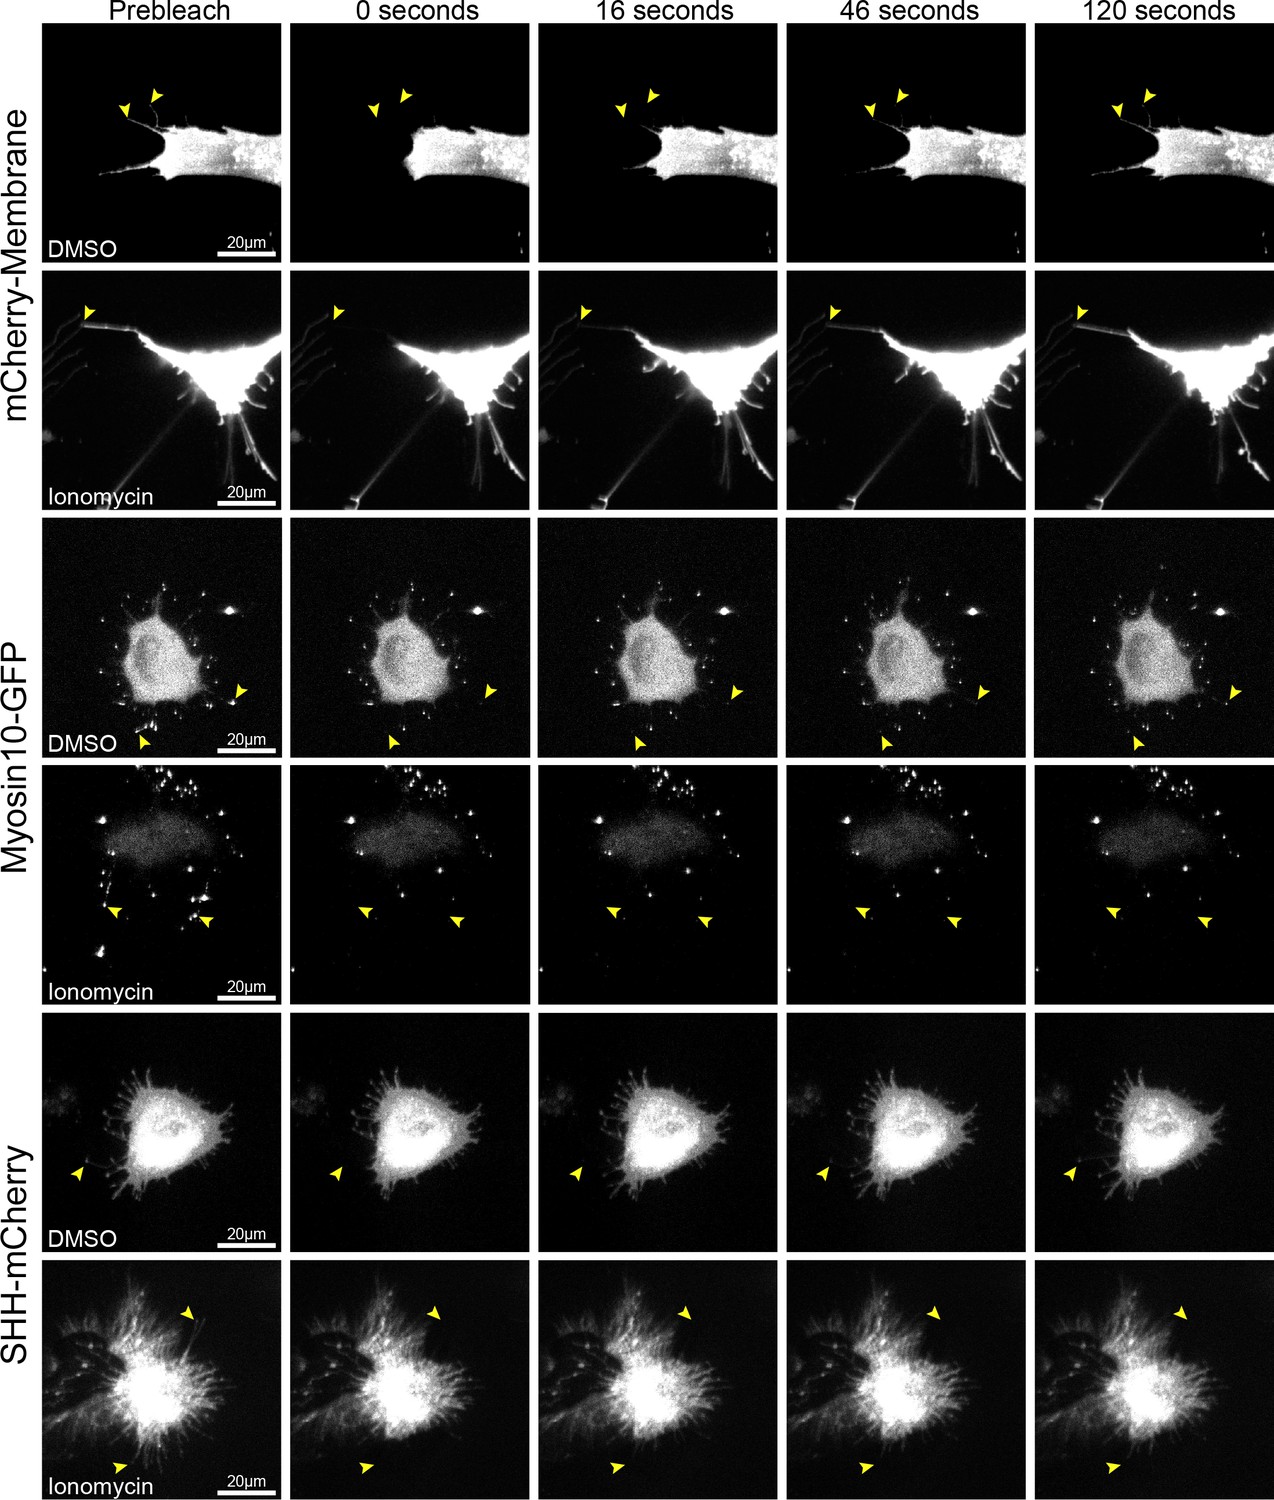
FRAP of NIH3T3 cell cytonemes treated with DMSO (control) or ionomycin.
Cytoneme tips are indicated by yellow arrowheads. Ionomycin does not impair mCherry-Membrane recovery along the cytoneme. MYO10-GFP and SHH-mCherry fail to recover to cytoneme tips by 120 s post-photobleaching in treated cells.
Figure 4—figure supplement 2
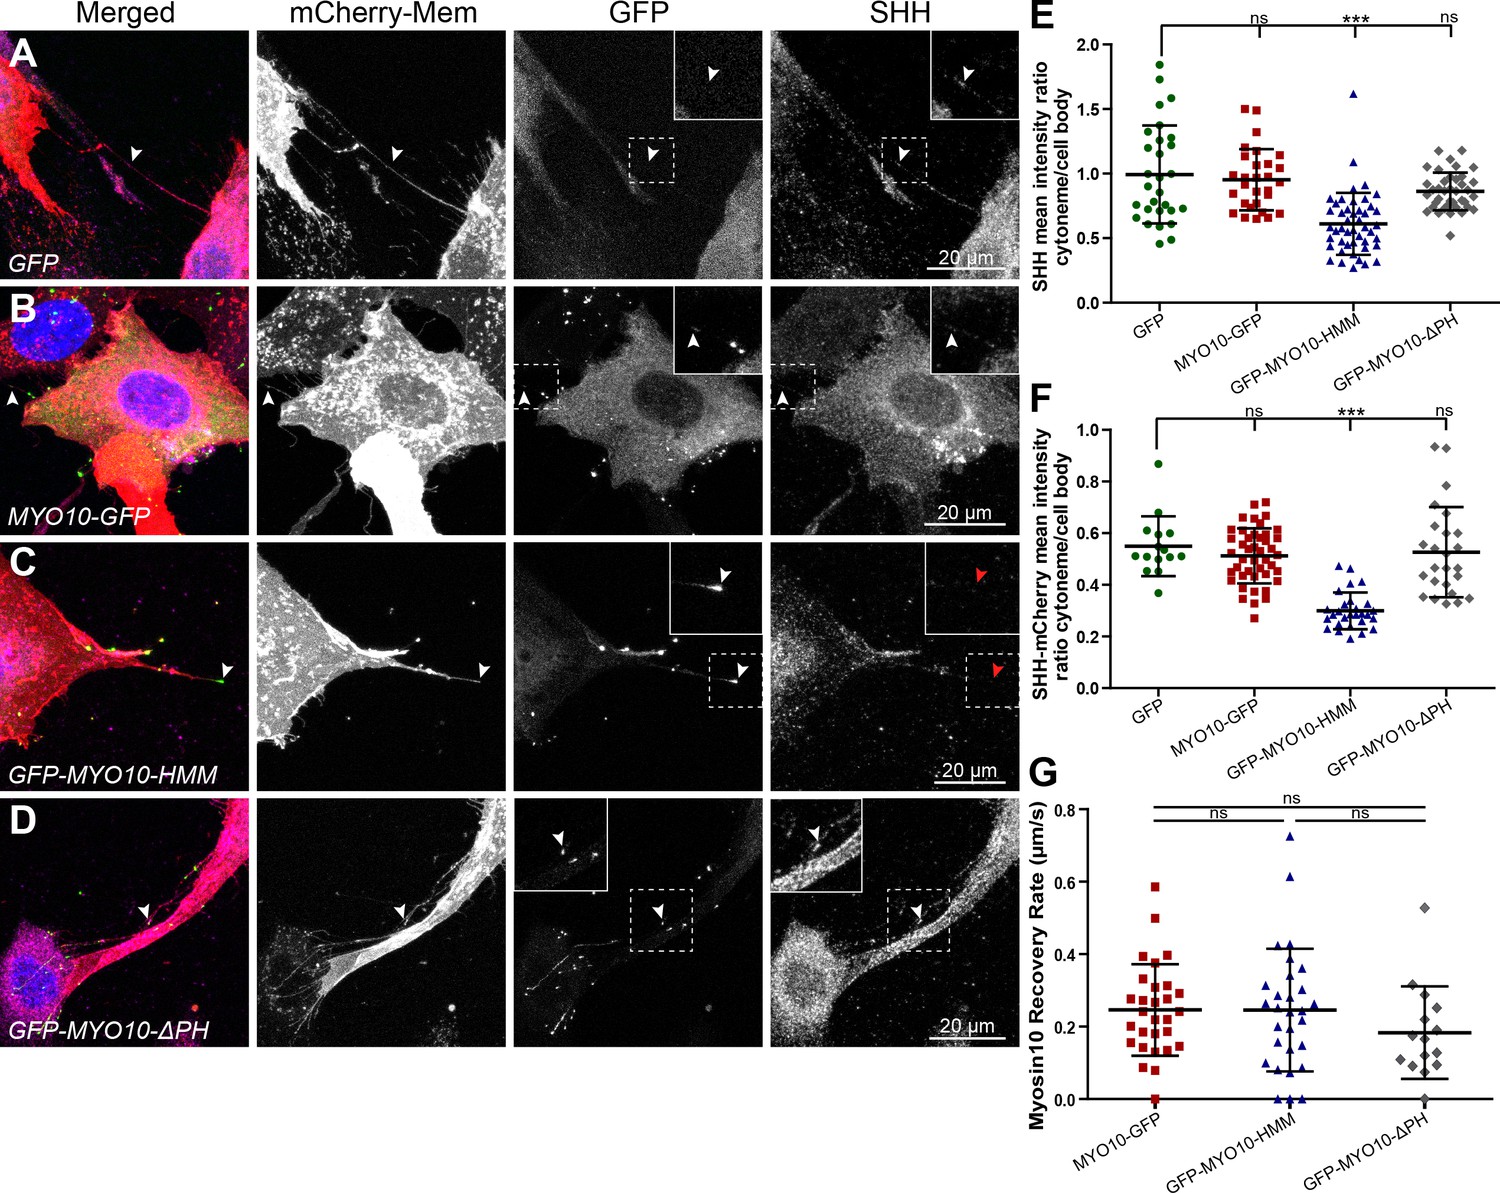
MYO10 influences SHH transport in cytonemes.
(A–D) NIH3T3 cells expressing mCherry-Mem and SHH with either (A) GFP, (B) MYO10-GFP, (C) GFP-MYO10-HMM, or (D) GFP-MYO10-ΔPH are shown. Arrowheads indicate cytonemes. Red arrowheads mark a MYO10-HMM positive cytoneme that failed to accumulate SHH. (E,F) Scatter plots of mean (E) SHH, or (F) SHH-mCherry fluorescent ratios of cytoneme:cell body in NIH3T3 cells when co-expressing GFP or the indicated MYO10 constructs. (G) Scatter plots of recovery rates of MYO10 constructs to cytoneme tips. All data are presented as mean ± SD. ns = not significant, ***p<0.001.
Figure 5
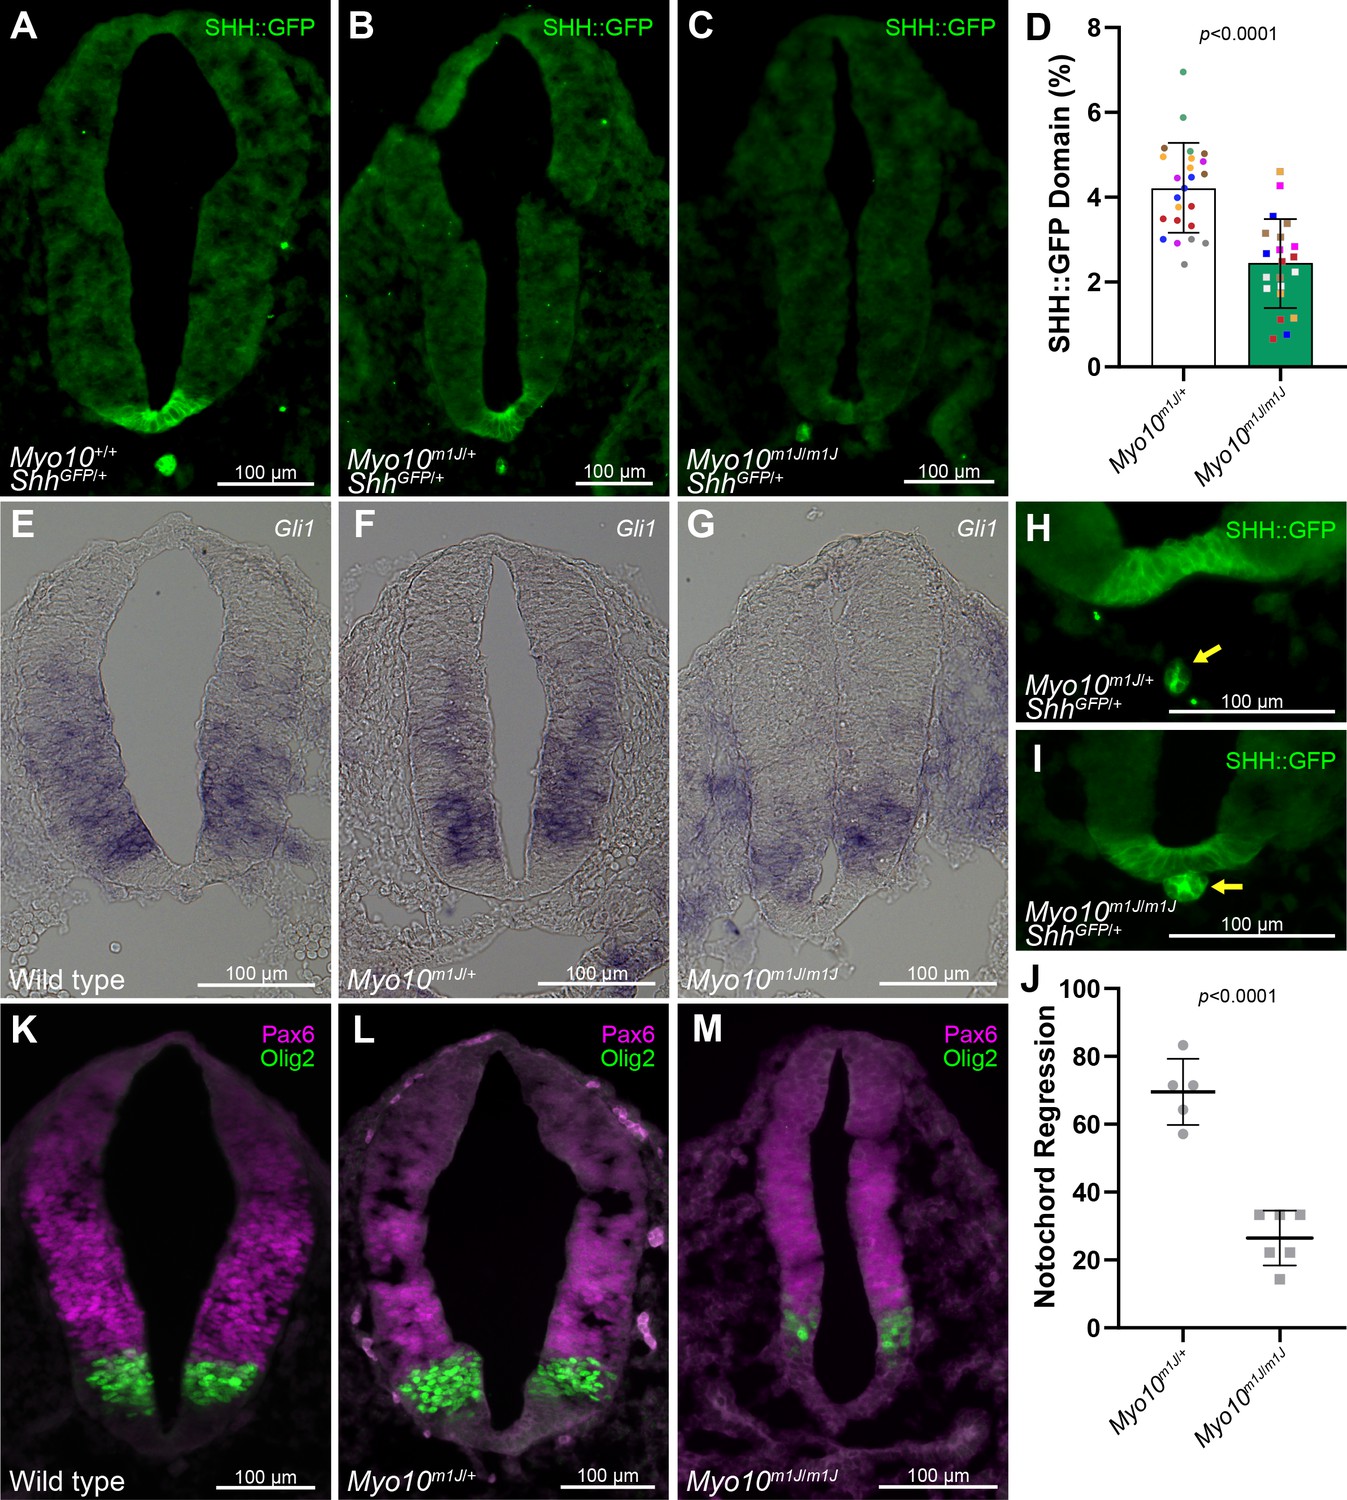
MYO10 influences the SHH morphogen gradient.
(A–C) Representative section of cardiac-level neural tube from E9.5 (A) ShhGFP/+; Myo10 wild type, (B) ShhGFP/+; heterozygous or (C) ShhGFP/+; null mice were immuno-stained for GFP. The domain of SHH::GFP in the floorplate was reduced in Myo10m1J/m1J mice. (D) Relative SHH::GFP neural tube area in Myo10m1J/+ and Myo10m1J/m1J sections. Dots are color-coded for each embryo and represent the individual sections examined. Seven Myo10m1J/+ and six Myo10m1J/m1J embryos per condition were analyzed, with 3–4 sections per embryo. (E–G) RNA in situ hybridization with Gli1 probe. The Gli1 expression domain is reduced in Myo10m1J/m1J sections. (H–I) Notochord (arrow) regression initiates in (H) ShhGFP/+; Myo10m1J/+, but it delayed in (I) ShhGFP/+; Myo10m1J/m1J embryos. (J) Percentage of sections showing notochord regression of >5 µm from the floorplate was calculated across 5–7 cardiac level section in 5 Myo10m1J/+ and 6 Myo10m1J/m1J embryos. Dots represents individual embryos analyzed. (K–M) Wild type, Myo10m1J/+ and Myo10m1J/m1J E9.5 neural tubes were immuno-stained for Olig2 and Pax6. Data are represented as mean ± SD.
Figure 6 with 1 supplement
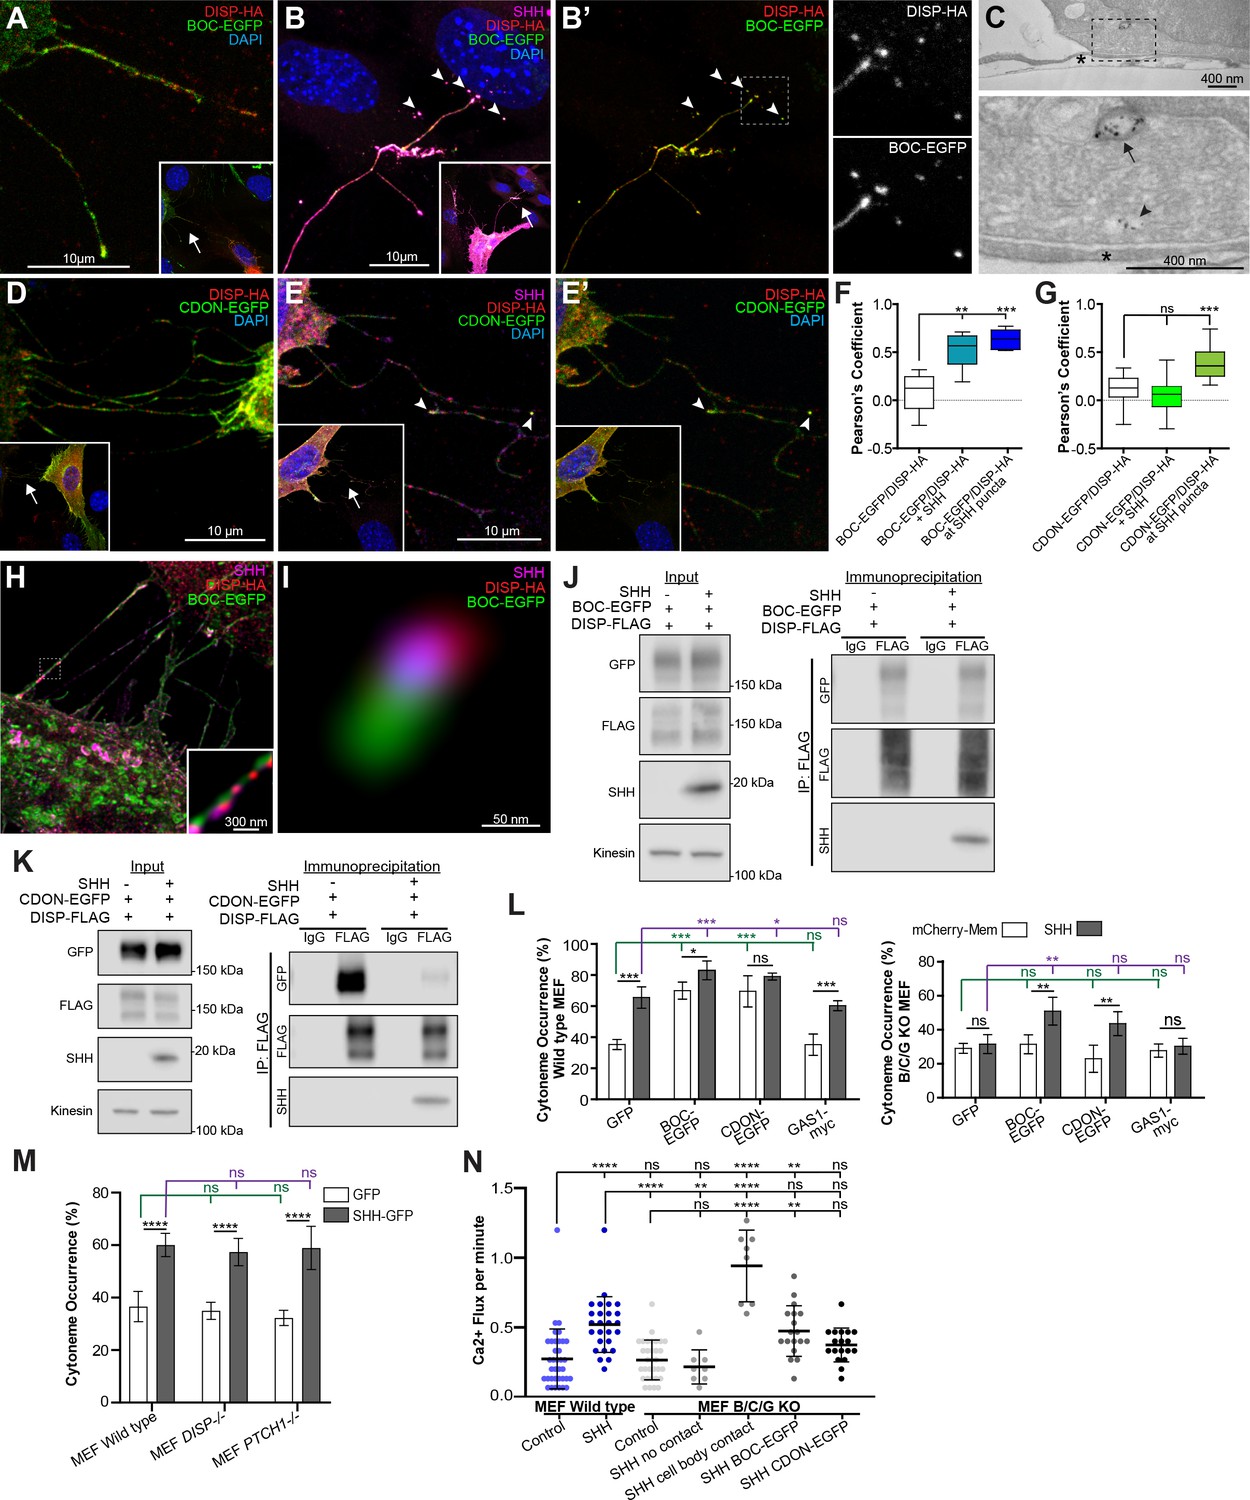
DISP, BOC, and CDON ligand complexes influence SHH cytonemes.
(A) DISP-HA (red) and BOC-EGFP (green) localize to cytonemes of NIH3T3 cells. Inset shows lower magnification, with arrow indicating magnified area. (B–B’) SHH (magenta)-expressing NIH3T3 cell cytonemes show co-localization between DISP-HA and BOC-EGFP. Inset shows lower magnification, with arrow indicating magnified area. Puncta visible on signal-receiving cells contain BOC-EGFP and DISP-HA (arrowheads and right). Dashed lines indicate magnified regions, right. (C) TEM section of an SHH-mCherry expressing cell cytoneme in contact with a receiving cell. SHH is immunolabeled with anti-mCherry and is present in early (arrow head), and late (arrow) endosomal compartments of the receiving cell near the cytoneme contact point (asterisk). (D) DISP-HA and CDON-EGFP (green) are present in cytonemes of NIH3T3 cells. Inset shows lower magnification, with arrow indicating magnified area. (E–E’) DISP-HA, CDON-EGFP, and SHH localize to cytonemes of NIH3T3 cells. Arrowheads identify colocalization. (F–G) Box plots of Pearson’s correlation coefficient value (min/max whiskers) measuring colocalization between (F) DISP-HA and BOC-EGFP, or (G) DISP-HA and CDON-EGFP under the indicated conditions. (n=>30 cytonemes per condition). (H–I) Stimulated emission depletion microscopy images of SHH, BOC-EGFP, and DISP-HA in cytonemes (H) and a representative magnified puncta (I). (J–K) DISP-FLAG was immunoprecipitated from lysate from NIH3T3 cells expressing DISP-FLAG and BOC-EGFP (J) or CDON-EGFP (K) in the absence or presence of SHH. Lysate input is shown at left and FLAG immunoprecipitates are shown at right. IgG serves as control. (L) Cytoneme occurrence rates for wild type and Boc/Cdon/Gas1-/- (BCG KO) MEFs expressing mCherry-Mem or SHH in the presence of GFP or the indicated SHH co-receptor. (M) Cytoneme occurrence rates for wild type, Ptch1-/- and Disp1-/- are shown in GFP or SHH-GFP-expressing cells (N). Ca2+ flux was determined in R-GECO reporter cells in contact with cytonemes (or cell body) of the indicated ligand-producing cells. BCG KO cells fail to produce cytonemes that contact neighboring cells, so do not promote cytoneme-mediated signal initiation in R-GECO reporter cells. BCG KO cells can induce a response in reporter cells through direct cell body contact. Cytoneme-based signal initiation is fully or partially rescued by BOC or CDON re-expression in SHH-expressing cells. All data are presented as mean ± SD, unless stated otherwise. ns = not significant, *p<0.05, **p<0.01, ***p<0.001, ****p<0.0001. See also Figure 6—figure supplement 1.
Figure 6—figure supplement 1
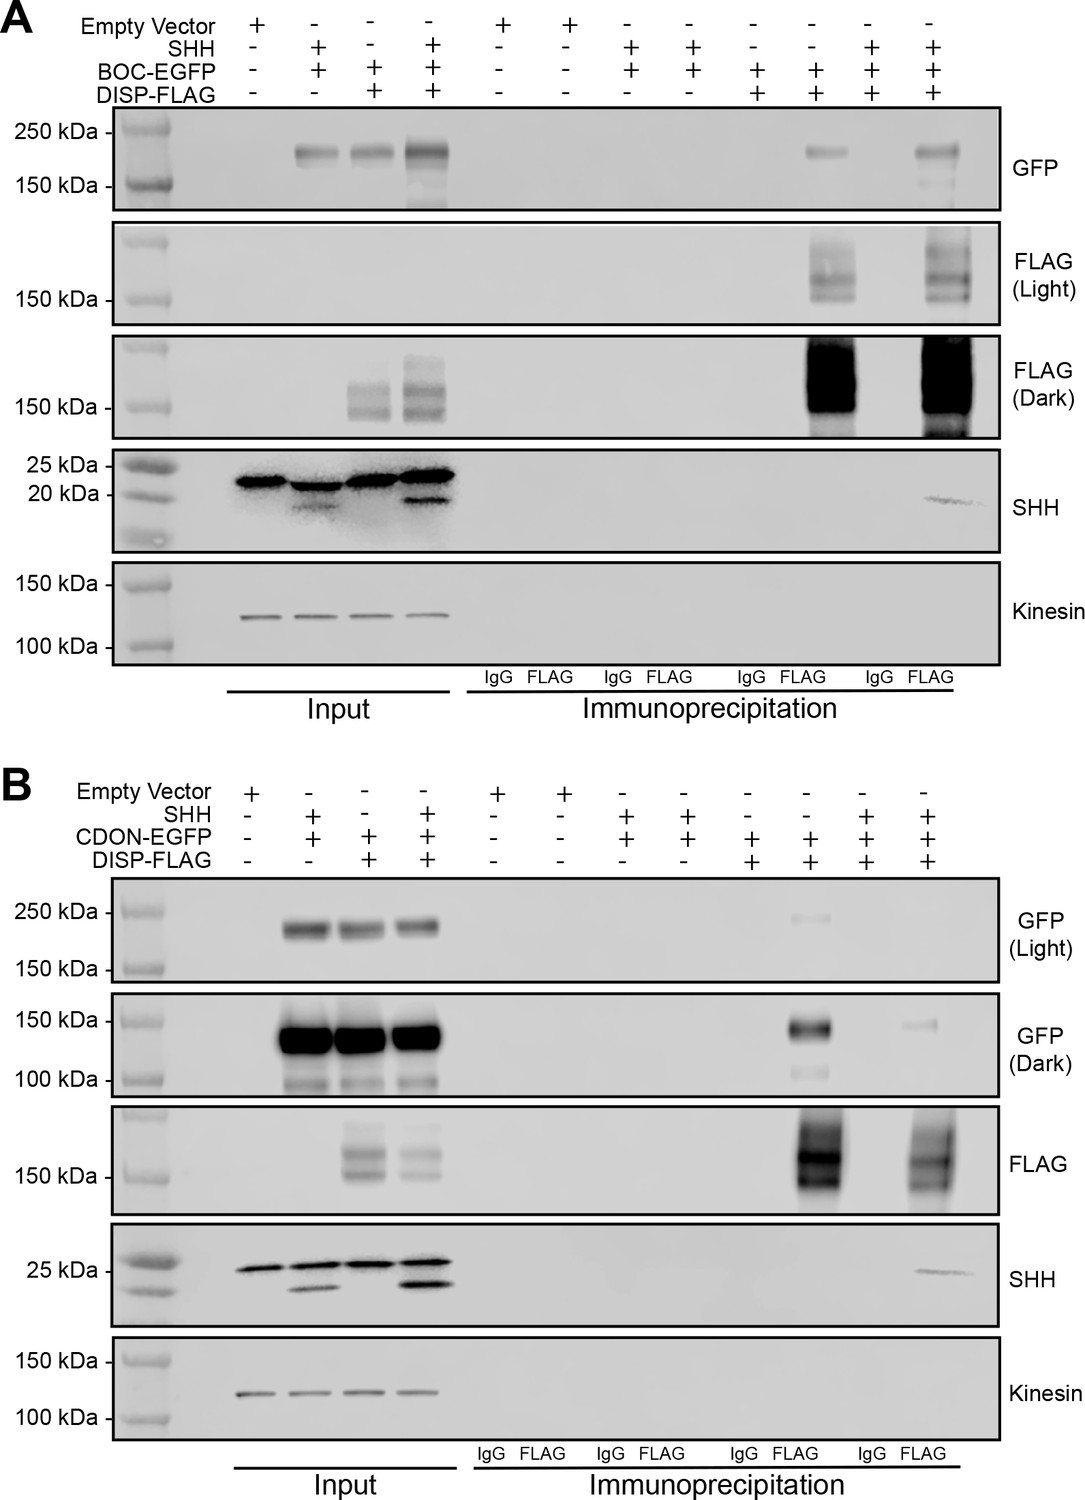
Western blots in support of Figure 4J–K.
Immunoblots of cell lysates and immunoprecipitated proteins from NIH3T3 cells expressing DISP-FLAG and BOC-EGFP (A) or CDON-EGFP (B) with or without SHH. Anti-FLAG immunoprecipitation with input (10%).
Videos
Video 1
Cytonemes are dynamic cellular extensions that contain MYO10.
Two adjacent NIH3T3 cells expressing SHH, mCherry-Mem (magenta), and MYO10-EGFP (green) are shown as a maximum intensity projection of 10 Z-sections spanning 4.5 µm, imaged at 4.1 s/frame over 18 min. Cytonemes are distinguished from other cellular extension by active growth and accumulation of MYO10-EGFP at the tips. Time stamp indicates min:s.
Video 2
Dynamic cytonemes move in three dimensions.
Video 3
Cytonemes exhibit transient interactions and stable connections.
NIH3T3 cells expressing SHH, mCherry-Mem (magenta), and MYO10-EGFP (green) are shown as a maximum intensity projection of 5 Z-sections spanning 2 µm, imaged at 2.05 s/frame over 9 min. Cytonemes transiently scan membrane of a neighboring cell (upper right) and form stable connections with cytonemes from adjacent cells (center). MYO10-GFP moves along cytonemes in puncta and enriches at cytoneme contact points. Time stamp indicates min:s.
Video 4
NIH3T3 R-GECO-positive cells in contact with GFP expressing cells.
GFP-expressing NIH3T3 cells (green) are shown in contact with R-GECO reporter cells (orange intensity spectrum) and presented as a maximum intensity projection of 4 Z-sections spanning 3 µm, imaged at 1.7 s/frame over 15 min. Time stamp indicates hr:min:s.
Video 5
NIH3T3 R-GECO-positive cells in contact with cytonemes from SHH-GFP expressing cell.
Cytonemes from SHH-GFP-expressing cells (green) are shown contacting R-GECO reporter cells (orange intensity spectrum), shown as a maximum intensity projection of 4 Z-sections spanning 2.5 µm, imaged at 1.7 s/frame over 15 min. Time stamp indicates hr:min:s.
Video 6
FRAP of NIH3T3 cytonemes expressing SHH-mCherry and MYO10-GFP treated with DMSO.
SHH-mCherry (white) and MYO10-GFP (green) recover to the cytoneme tip within 120 s post photobleaching. Cell was imaged at two frames per second from a single focal plane for 5 s prior to photobleaching, following ~130 s of recovery.
Video 7
FRAP of NIH3T3 cytonemes expressing SHH-mCherry and MYO10-GFP treated with ionomycin dissolved in DMSO.
SHH-mCherry (white) and MYO10-GFP (green) do not recover to the cytoneme tip post photobleaching. Recovery of SHH-mCherry occurs along the base of some cytonemes but fails to reach the tip. Live images were acquired as described for Video 6.
Tables
Appendix 1—key resources table
| Reagent type (species) or resource | Designation | Source or reference | Identifiers | Additional information |
|---|---|---|---|---|
| genetic reagent (Mus musculus) | B6.129X1(Cg)-Shhtm6Amc/J | The Jackson Laboratory (JAX) | #008466, RRID:IMSR_JAX:008466 | |
| genetic reagent (Mus musculus) | B6.Cg-Myo10m1J/GrsrJ | JAX | #024583, RRID:IMSR_JAX:024583 | |
| genetic reagent (Mus musculus) | C57BL/6J | JAX | #000664, RRID:IMSR_JAX:000664 | |
| cell line (Mus musculus) | NIH3T3 | ATCC | CRL-1658, RRID:CVCL_0594 | |
| cell line (Homo sapiens) | HEK293T | ATCC | CRL-11268, RRID:CVCL_1926 | |
| cell line (Mus musculus) | Dispatched KO MEFs | Ma et al., 2002 | ||
| cell line (Mus musculus) | Light II | ATCC | JHU-68, RRID:CVCL_2721 | |
| cell line (Homo sapiens) | HEK (Bosc 23) SHH inducible | Goetz et al., 2006 | ||
| cell line (Mus musculus) | Boc/Cdon/Gas1 KO MEFs | Allen et al., 2011 | ||
| cell line (Mus musculus) | Myo10 KO MEFs | This study | Derived from RRID:IMSR_JAX:024583 | |
| cell line (Mus musculus) | Ptch1 KO MEFs | Kim et al., 2015 | A gift from Phil Beachy | |
| cell line (Mus musculus) | Smo KO 3T3 | This study | originated from CRL-1658 | |
| cell line (Mus musculus) | MEF wt | This study | C57BL/6 MEF cells | |
| antibody | anti-HA (Rat monoclonal) | Roche | 11867423001, RRID:AB_390918 | 1:250 (IF) 1:3000 (WB) |
| antibody | anti-Shh (H-160) (Rabbit polyclonal) | Santa Cruz Biotechnolgy | sc-9024, RRID:AB_2239216 | 1:100 (IF) 1:2000 (WB) |
| antibody | anti-GFP (4B10) (Mouse monoclonal) | Cell Signaling Technology (CST) | #2955, RRID:AB_1196614 | 1:500 (IF) |
| antibody | anti-CD63 (E-12) (Mouse monoclonal) | Santa Cruz Biotechnolgy | sc-365604, RRID:AB_10847220 | 1:100 (IF) |
| antibody | anti-Myc-Tag (Rabbit polyclonal) | CST | #2272, RRID:AB_10692100 | 1:400 (IF) |
| antibody | anti-GFP (Chicken polyclonal) | Aves | GFP-1010, RRID:AB_2307313 | 1:500 (IF) |
| antibody | anti-PAX6 (Mouse monoclonal) | DSHB | PAX6, RRID:AB_528427 | 1:25 (IF) |
| antibody | anti-OLIG2 (Rabbit polyclonal) | Millipore | AB9610 | 1:300 (IF) |
| antibody | anti-GFP (Rabbit polyclonal) | Rockland | 600-401-215, RRID:AB_828167 | 1:8000 (WB) |
| antibody | anti-Kif5b (Rabbit monoclonal) | Abcam | ab167429, RRID:AB_2715530 | 1:5000 (WB) |
| antibody | anti-α-Tubulin (DM1A) (Mouse monoclonal) | CST | #3873 | 1:5000 (WB) |
| antibody | anti-Flag (DDDDK) (Rabbit polyclonal) | Abcam | ab1162, RRID:AB_298215 | 1:3000 (WB) |
| antibody | anti-mCherry (Chicken polyclonal) | Abcam | ab205402, RRID:AB_2722769 | 1:1000 (IF) |
| antibody | AlexaFluor 488 | Life technologies | A11029 (Mouse); A11034 (Rabbit); A11006 (Rat) | 1:1000 |
| antibody | AlexaFluor 555 | Life technologies | A21424 (Mouse); A21429 (Rabbit); A21434 (Rat) | 1:1000 |
| antibody | AlexaFluor 633 | Life technologies | A21236 (Mouse); A21245 (Rabbit); A21247 (Rat) | 1:1000 |
| antibody | AlexaFluor 488 F(ab')2 | CST | #4408 (Mouse); #4412 (Rabbit) | 1:1000 |
| antibody | AlexaFluor 555 F(ab')2 | CST | #4409 (Mouse); #4413 (Rabbit) | 1:1000 |
| antibody | AlexaFluor 594 F(ab')2 | Jackson Immuno | #712-586-153, RRID:AB_2340691 | 1:1000 |
| antibody | anti-ATTO 655 STED (Goat anti-Rabbit polyclonal) | Active motif | #15049 | 1:1000 |
| antibody | Peroxidase AffiniPure (Donkey anti-Mouse polyclonal) | Jackson Immuno | 715-035-151, RRID:AB_2340771 | 1:5000 |
| antibody | Peroxidase AffiniPure (Donkey anti-Rabbit polyclonal) | Jackson Immuno | 711-035-152, RRID:AB_10015282 | 1:5000 |
| antibody | Peroxidase AffiniPure (Goat anti-Rat polyclonal) | Jackson Immuno | 112-035-175, RRID:AB_2338140 | 1:5000 |
| antibody | anti-Flag M2 Affinity gel (Mouse monoclonal) | Millipore | F2426 | 25ul slurry for IP |
| transfected construct (Aequorea victoria) | pCDNA3-EGFP | Addgene | RRID:Addgene_13031 | Doug Golenbock |
| transfected construct (Discosoma sp.) | pCMV-mCherry-Mem | Addgene | RRID:Addgene_55779 | Catherine Berlot |
| transfected construct (Homo sapiens) | pcDNA-Wnt3A | Addgene | RRID:Addgene_35908 | Marian Waterman |
| transfected construct (R. norvegicus ) | pIRES-Jag1-HA | Addgene | RRID:Addgene_17336 | Joan Conaway, Ronald Conaway |
| transfected construct (synthetic construct) | pCMV-R-GECO1 | Addgene | RRID:Addgene_32444 | Robert Campbell |
| transfected construct (Homo sapiens) | pCMV-mCherry-CD9 | Addgene | RRID:Addgene_55013 | Michael Davidson |
| transfected construct (Homo sapiens) | pCMV-mCherry-CD81 | Addgene | RRID:Addgene_55012 | Michael Davidson |
| transfected construct (Homo sapiens) | pEGFP-CD63-C2 | Addgene | RRID:Addgene_62964 | Paul Luzio |
| transfected construct (Homo sapiens) | pCMV-EGFP-Rab18 | Addgene | RRID:Addgene_49550 | Marci Scidmore |
| transfected construct (Homo sapiens) | pEGFP-C1-hMyoX | Addgene | RRID:Addgene_47608 | Emanuel Strehler |
| transfected construct (Homo sapiens) | pCMV6-hGAS1-Myc-DDK | Origene | RC224804 | |
| transfected construct (Mus musculus) | pCMV3-mFGF2-N-GFPSpark | SinoBiological | MG50037-ANG | |
| transfected construct (Mus musculus) | pCMV3-mBMP2-C-GFPSpark | SinoBiological | MG51115-ACG | |
| transfected construct | pCMV-mCherry2 | Addgene | RRID:Addgene_54517 | Michael Davidson |
| transfected construct (Mus musculus) | pCDNA3-mSHH-FL | Stewart et al., 2018 | ||
| transfected construct (Mus musculus) | pCDNA3-mSHH-N | Stewart et al., 2018 | ||
| transfected construct (Mus musculus) | pCDNA3-mSHH-FL-EGFP | This paper | ||
| transfected construct (Mus musculus) | pCDNA3-mSHH-FL-mCherry2 | This paper | ||
| transfected construct (Mus musculus) | pCDNA3-V5-Disp-HA | Stewart et al., 2018 | ||
| transfected construct (Homo sapiens) | pCS2-hBOC-EGFP | Wierbowski et al., 2020 | Gift from Adrian Salic | |
| transfected construct (Homo sapiens) | pCS2-hCDON-EGFP | Wierbowski et al., 2020 | Gift from Adrian Salic | |
| transfected construct (Bos taurus) | pEGFP-C2-bMyo10-HMM | Berg and Cheney, 2002 | ||
| transfected construct (Bos taurus) | pEGFP-C2-bMyo10-Δ3PH | This paper | ||
| Recombinant DNA reagent | mGli1 in situ probes | Hui et al., 1994 | A gift from Xin Sun | |
| software, algorithm | Photoshop 2020 | Adobe | RRID:SCR_014199 | for making figures |
| software, algorithm | Illustrator 2020 | Adobe | RRID:SCR_010279 | for making figures |
| software, algorithm | LAS X | Leica | RRID:SCR_013673 | image processing |
| software, algorithm | Prism 8 | GraphPad | RRID:SCR_002798 | statistical analyses and graph generation |
| software, algorithm | Huygens Professional software | Scientific Volume Imaging | RRID:SCR_014237 | decovolution |
| software, algorithm | Igor Pro 8 | Wavemetrics | RRID:SCR_000325 | FRAP analyses |
| software, algorithm | Imaris | Bitplane | RRID:SCR_007370 | video processing |
| software, algorithm | ImageJ | National Institutes of Health | RRID:SCR_002285 | image analysis and video processing |
| software, algorithm | SAS software | SAS Institute | RRID:SCR_008567 | Statistical analyses |
| software, algorithm | R version 3.6.0 | R Foundation for Statistical Computing | Statistical analyses | |
| software, algorithm | CellProfiler | McQuin et al., 2018 | RRID:SCR_007358 | image analysis |
| software, algorithm | CRIS.py | Connelly and Pruett-Miller, 2019 | NGS analysis | |
| commercial assay or kit | Dual Luciferase Reporter Assay Kit | Promega | PRE1960 | |
| commercial assay or kit | ECL Prime Western Blotting Detection Reagent | Fisher Scientific | RPN2232 | |
| commercial assay or kit | Quickchange II XL Kit | Agilent | 200522 | |
| commercial assay or kit | Lipofectamine 3000 | ThermoFisher Scientific | L3000008 | |
| commercial assay or kit | MycoAlert Mycoplasma Detection Kit | Lonza | LT07-118 | |
| chemical compound, drug | Cholera Toxin Subunit B (Recombinant) (CTX) Alexa Fluor 488 Conjugate | Invitrogen | C34775 | |
| chemical compound, drug | ionomycin | CST | #9995 | |
| chemical compound, drug | Ponasterone A | Sigma Aldrich | P3490-1MG | |
| chemical compound, drug | Vismodegib | LC Laboratories | NC1633974 | |
| chemical compound, drug | SAG | Selleck Chemical Co | S7779-2MG | |
| chemical compound, drug | cyclopamine | LC Laboratories | C-8700 | |
Additional files
Download links
A two-part list of links to download the article, or parts of the article, in various formats.
Downloads (link to download the article as PDF)
Open citations (links to open the citations from this article in various online reference manager services)
Cite this article (links to download the citations from this article in formats compatible with various reference manager tools)
Cytoneme delivery of Sonic Hedgehog from ligand-producing cells requires Myosin 10 and a Dispatched-BOC/CDON co-receptor complex
eLife 10:e61432.
https://doi.org/10.7554/eLife.61432


