Gamma rhythms and visual information in mouse V1 specifically modulated by somatostatin+ neurons in reticular thalamus

  1. Mahmood S Hoseini
  2. Bryan Higashikubo
  3. Frances S Cho
  4. Andrew H Chang
  5. Alexandra Clemente-Perez
  6. Irene Lew
  7. Agnieszka Ciesielska
  8. Michael P Stryker
  9. Jeanne T Paz  Is a corresponding author
  1. University of California, San Francisco, Department of Physiology, United States
  2. Gladstone Institute of Neurological Disease, United States
  3. University of California, San Francisco, Neurosciences Graduate Program, United States
  4. University of California, San Francisco, Department of Neurology, United States
  5. Kavli Institute for Fundamental Neuroscience, University of California San Francisco, United States

Abstract

Visual perception in natural environments depends on the ability to focus on salient stimuli while ignoring distractions. This kind of selective visual attention is associated with gamma activity in the visual cortex. While the nucleus reticularis thalami (nRT) has been implicated in selective attention, its role in modulating gamma activity in the visual cortex remains unknown. Here, we show that somatostatin- (SST) but not parvalbumin-expressing (PV) neurons in the visual sector of the nRT preferentially project to the dorsal lateral geniculate nucleus (dLGN), and modulate visual information transmission and gamma activity in primary visual cortex (V1). These findings pinpoint the SST neurons in nRT as powerful modulators of the visual information encoding accuracy in V1 and represent a novel circuit through which the nRT can influence representation of visual information.

Introduction

Visual perception relies on the ability to focus on important information while ignoring distractions. Such selective attention is associated with neural oscillations in the gamma frequency band (~30–90 Hz, ‘gamma oscillations’) in the visual cortices in both rodents and humans (Engel et al., 2001; Taylor et al., 2005; Pavlova et al., 2006; Doesburg et al., 2008; Ray et al., 2008; Siegel et al., 2008). Gamma oscillations, particularly in the visual cortex in rodents, carnivores, and primates, are associated with a high level of cortical activity, and some have speculated that they may play a causal role in perception and the focusing of attention (Gray et al., 1992; Singer and Gray, 1995; Kreiter and Singer, 1996; Yazdan-Shahmorad et al., 2013) or in enabling a time-division multiplexing of cortical responses to multiple simultaneous stimuli (Stryker, 1989). Therefore, understanding the cellular and circuit mechanisms that underlie gamma rhythms could lead to a better understanding of the mechanisms behind higher cognitive functions such as perception and attention.

Two types of gamma oscillations have been reported in the primary visual cortex (V1), differentiated by whether they result from intra-cortical or subcortical inputs through the dorsal lateral geniculate nucleus (dLGN) in the mouse thalamus (Saleem et al., 2017). dLGN—the source of the specific sensory input to V1—gates the flow of all visual information to V1. The activity in dLGN is controlled by inputs from GABAergic neurons from the nucleus reticularis thalami (nRT) (Houser et al., 1980; Sherman and Koch, 1986; McCormick and Bal, 1997; Gentet and Ulrich, 2003; Lam and Sherman, 2011; Reinhold et al., 2015; Halassa and Acsády, 2016; Crabtree, 2018; Campbell et al., 2020). Indeed, optogenetic activation of inhibitory (Gad2-positive) neurons in the dorsal portion of the nRT transiently reduces activity in the dLGN (Reinhold et al., 2015). Similar results were obtained with optogenetic activation of inhibitory neurons expressing somatostatin (SST) in transgenic mice (Campbell et al., 2020). However, it is unknown whether nRT can control gamma rhythms or the representation of visual information in V1, and if so, whether such control involves a specific cell type.

In our previous work we dissociated the connectivity, physiology, and circuit functions of neurons within rodent nRT, based on the expression of parvalbumin (PV) and SST markers, and validated the existence of such populations in human nRT (Clemente-Perez et al., 2017). Specifically, we showed in mice that (1) somatosensory nRT PV but not SST neurons exhibit intrinsic rhythmogenic properties due to the presence of low-threshold T-type calcium channels; (2) PV and SST neurons in the somatosensory nRT segregate into distinct input-output circuits; and (3) PV neurons are the main rhythm generators in the somatosensory circuits. However, it remained unknown whether PV and SST neurons also have distinct roles in other sensory sectors of the nRT.

A positive relationship between gamma power and the encoding of memories as assayed by retrieval has been widely reported for many years in the hippocampus and closely related cortical areas (Wang, 2010 and references therein). In sensory cortex, however, it has not been clear whether gamma power is associated with the encoding of information (Ray and Maunsell, 2015). For this reason, we focused our study on the role of specific nRT cell types in thalamocortical visual processing on measurements of both field potentials and the fidelity of encoding of visual information in the firing activity of V1 neurons. Specifically, we investigated whether SST and PV nRT neurons modulate activity in the thalamocortical visual system. We began by examining the anatomy of cell-type-specific projections from nRT to the lateral geniculate nucleus (dLGN) and neighboring thalamic structures. Finding that the SST-cell projection was more prominent, we investigated their role in modulating responses in the thalamocortical visual system by optogenetically exciting or inhibiting them and making recordings in the V1 of the changes produced in local field potentials (LFPs) in different frequency bands and in the sensory responses of isolated single neurons. These sensory responses provide information about the visual world, and we computed changes in the representation of visual information from the single cellular responses of multiple neurons that were recorded simultaneously. The large effects of SST nRT cell activation on V1 were compared to the smaller and sometimes different effects of PV nRT cell activation. Finally, we studied the effects of SST nRT cell activation on the responses of single neurons in the dLGN, the site that receives direct input from nRT. Our electrophysiological findings, in line with anatomical data, indicate that activating SST but not PV neurons in nRT strongly reduces both visual information transmission and gamma power in V1 and dLGN.

Results

dLGN receives projections mainly from SST nRT neurons

To determine whether the visual thalamocortical relay nuclei receive inputs from SST and/or PV neurons of the nRT, we injected an AAV viral construct encoding enhanced yellow fluorescent protein (eYFP) in the nRT of adult Sst-Cre and Pvalb-Cre mice. We used the viral approach in adult mice because in transgenic knockin mice transient expression of PV and SST during early development causes labeling of the same cell population, precluding distinction between PV and SST cells in adulthood. We previously validated the viral approach immunohistochemically (Clemente-Perez et al., 2017). In adult mice, SST and PV neurons of the nRT were found to target distinct midline and somatosensory thalamocortical relay nuclei (Clemente-Perez et al., 2017). Sst-Cre and Pvalb-Cre cell bodies and their axons robustly expressed AAV-eYFP 4 weeks post-injection (Figure 1A, B), and we will refer to these as SST and PV neurons hereon. Confocal microscopy revealed dense axonal boutons from SST nRT neurons in the dLGN, but only very sparse input from PV nRT neurons (Figure 1B–D). This was surprising given that PV neurons are thought to represent the major cellular population of nRT (Clemente-Perez et al., 2017; Li et al., 2020). As previously shown, PV but not SST neurons from the nRT projected densely to the somatosensory ventroposteromedial (VPM) thalamocortical nucleus (Figure 1B–D, Figure 1—figure supplement 2). Also, PV nRT neurons projected to the higher-order visual thalamus LP (Figure 1B–D, Figure 1—figure supplement 2), suggesting that lack of dense synaptic boutons in dLGN was not due to lack of expression of the viral construct in PV nRT neurons. Furthermore, injections of the retrograde tracer cholera-toxin (CTB) in dLGN resulted in retrograde labeling of SST and PV neurons in the visual sector of the nRT (Figure 1—figure supplement 1). We cannot exclude that the retrograde labeling of certain nRT neurons might have resulted from tracer uptake by axons that are on route through the dLGN to LP. Nevertheless, these results suggest that SST and PV neurons projecting to first- and higher-order visual nuclei are intermingled in the same visual sector of the nRT. Retrograde labeling also revealed neurons that co-expressed SST and PV markers consistent with previous work (Clemente-Perez et al., 2017, Figure 1—figure supplement 2).

Figure 1 with 2 supplements see all
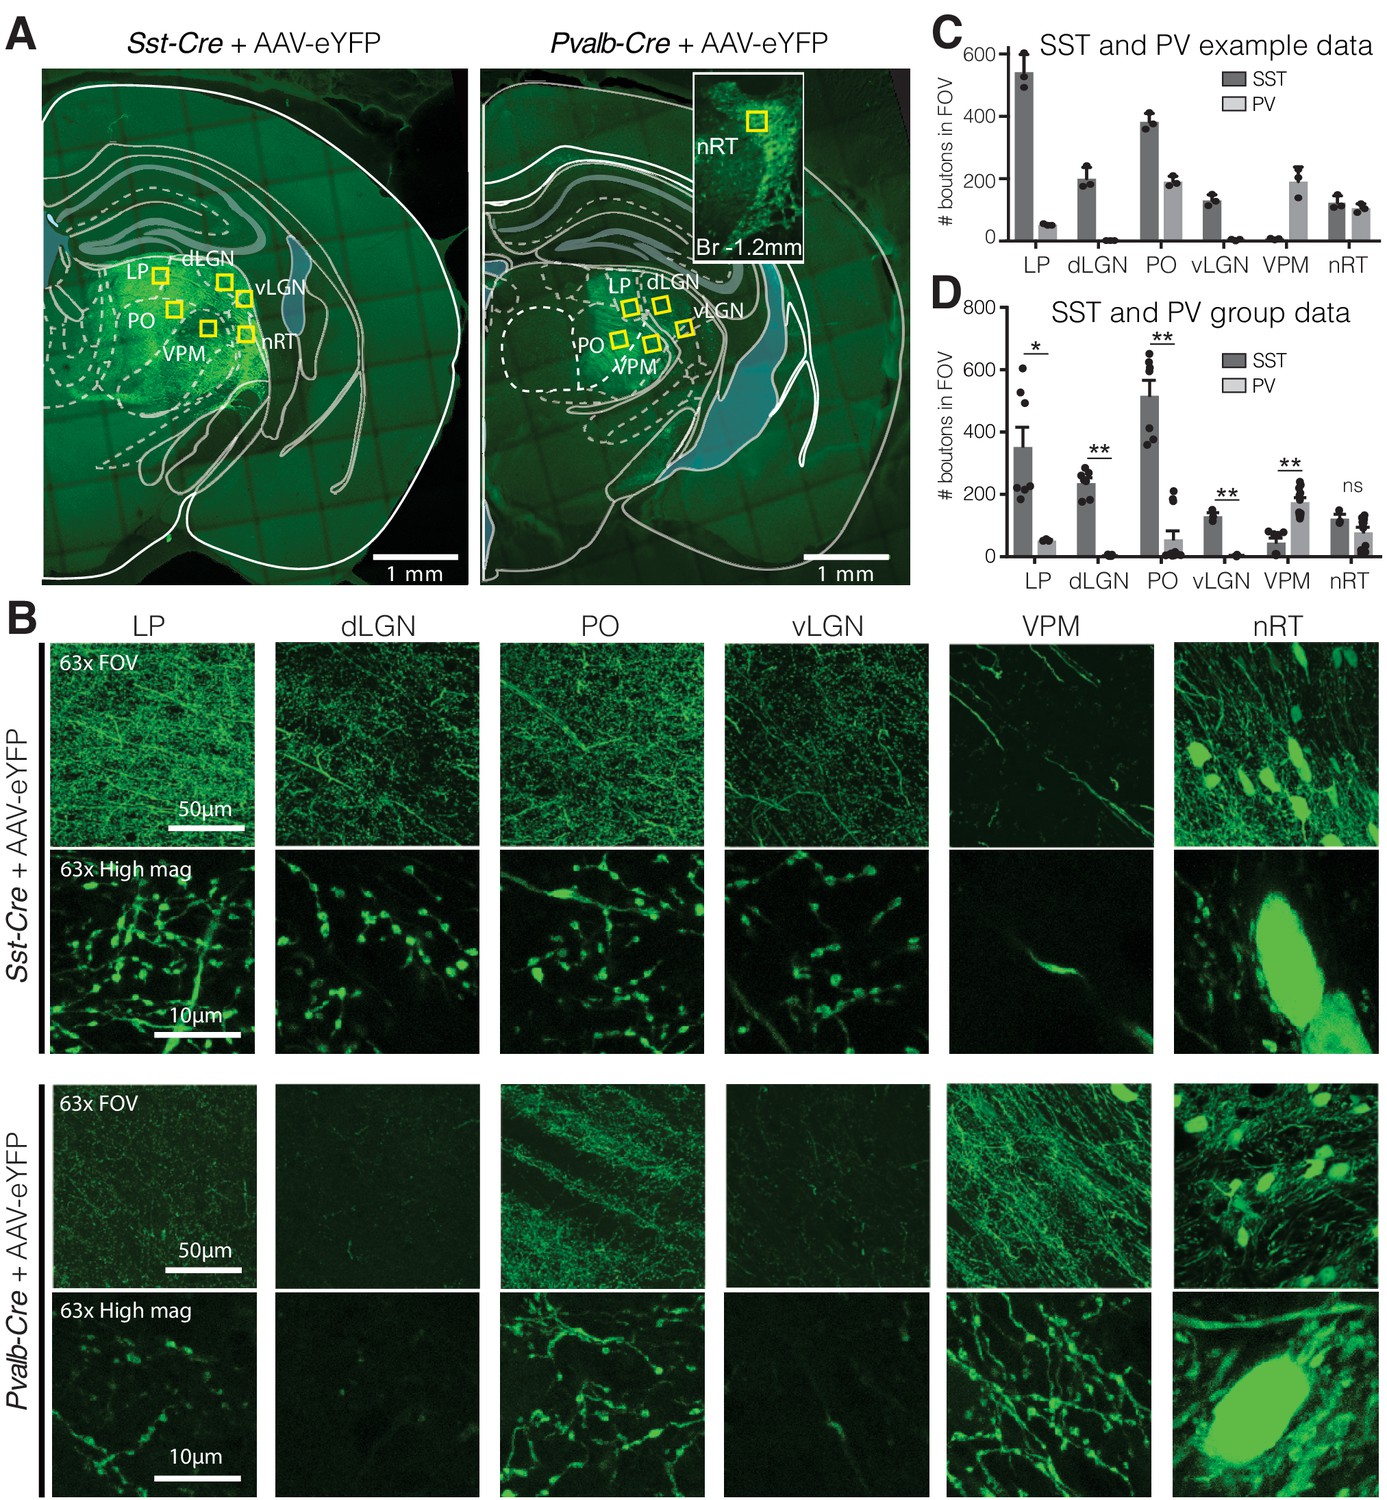
Visual relay thalamic nuclei are preferentially targeted by somatostatin (SST) and not parvalbumin (PV) GABAergic neurons from nucleus reticularis thalami (nRT).

(A) Representative example sections of Sst-Cre and Pvalb-Cre mice after injection of floxed AAV in nRT, which results in enhanced yellow fluorescent protein (eYFP) expression in cell bodies and projections of SST or PV neurons, respectively. Yellow boxes indicate locations chosen for 63× confocal imaging and putative bouton quantification. Inset: nRT injection site as seen in an adjacent section. (B) 63× confocal images showing the entire field of view (FOV) and a zoomed cropped region (‘High mag’) to show details of axonal boutons and nRT somata. LP: lateral posterior nucleus; dLGN: dorsal lateral geniculate nucleus; PO: posterior medial nucleus; vLGN: ventral lateral geniculate nucleus; VPM: ventroposteromedial nucleus. The expression of the viral constructs in different brain regions was confirmed using the mouse brain atlas (Paxinos and Franklin, 2001). (C) Number of eYFP-labeled boutons present in thalamic nuclei of representative mice shown in (A). Data taken from three consecutive sections from each mouse. (D) Number of eYFP-labeled boutons present in thalamic nuclei of all mice imaged (n = 2 Sst-Cre, 3 Pvalb-Cre, 3–4 sections per mouse). Differences are significant between genotypes for all regions except for nRT after correction for multiple comparisons. *p<0.05, **p<0.01.

Optogenetic activation of SST but not PV nRT neurons reduces gamma power in V1 both with and without visual stimulation

Given the distinct projections from SST and PV nRT neurons to dLGN, whose main target is V1 cortex, we next investigated to what extent perturbing the activity of SST and PV nRT neurons affects visual responses in V1. For this purpose, we injected an AAV viral construct containing Channelrhodopsin-2 (ChR2) in the nRT of Sst-Cre and Pvalb-Cre mice. The expression of opsins was restricted to the nRT, was cell-type-specific, and the opsins were well expressed throughout the visual sector of the nRT (Sokhadze et al., 2019; Figure 1—figure supplements 1 and 2). Given that we used saturating illumination to activate these neurons, the activation of SST-nRT input to dLGN was likely uniform rather than focal. Thereafter, extracellular recordings of single-unit activity and LFPs were made using a double-shank 128-channel microelectrode array placed in the V1 of mice that were free to stand or run on a polystyrene ball floating on an air stream (Figure 2A; Du et al., 2011; Hoseini et al., 2019). Mice viewed a gray blank screen while a blue light (473 nm, ~63 mW/mm2) was delivered using an optical fiber implanted above nRT during different locomotion states (Figure 2B). Optogenetic activation reduced across-trial average power (scaled by 1/f) in all recording channels and all frequencies, but the strongest reduction was in the gamma band (Figure 2C, Table 1). Consistent with previous findings, locomotion itself differently modulated power across different frequencies (Niell and Stryker, 2010), and the main effect of locomotion was a dramatic power increase at higher frequencies in the gamma band (30–80 Hz) (Figure 2D, Table 1). Whether the mice were still or running, activation of SST nRT neurons significantly reduced gamma power, but not theta and beta power, in V1, compared to baseline (Figure 2E, Table 1).

Figure 2 with 3 supplements see all
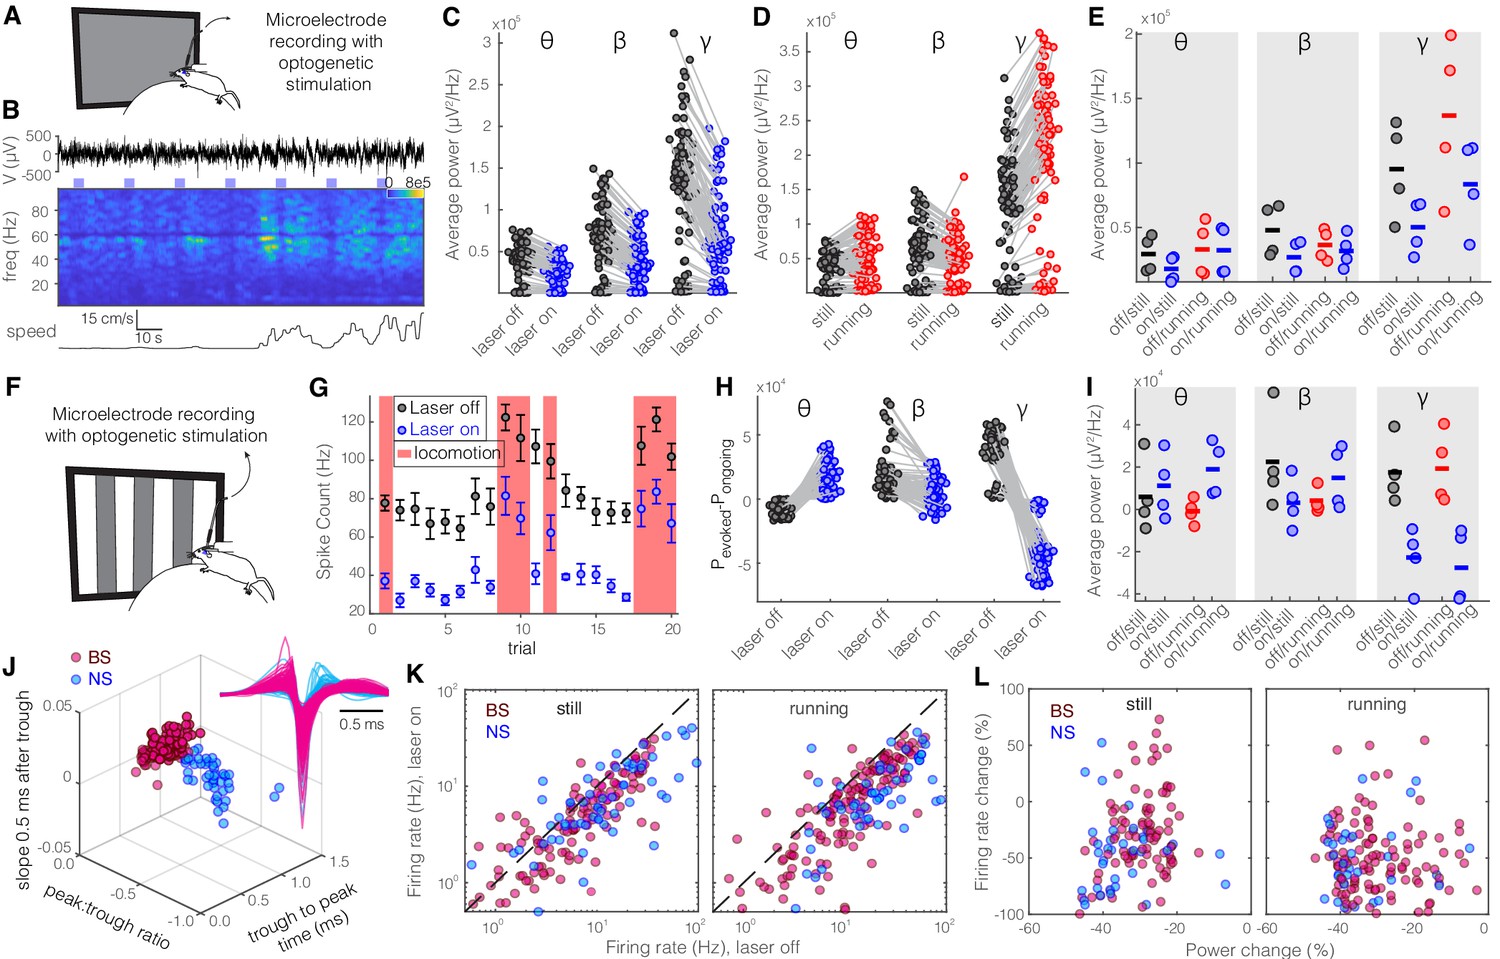
Optogenetic activation of somatostatin (SST) nucleus reticularis thalami (nRT) neurons reduces gamma activity in the primary visual cortex (V1) both with and without visual stimulation.

(A) Neural activity was recorded from V1 in freely moving mice. Mice were presented with a gray blank screen while a blue light (473 nm, ~63 mW/mm2) was delivered to Channelrhodopsin-2 (ChR2)-expressing SST cells in nRT using an optical fiber implanted above the nRT. Mouse movement was tracked over the course of the experiment. (B) Representative extracellular raw voltage trace is shown along with its power spectrum. Blue shading areas indicate optogenetic activation. Mouse movement speed is shown at the bottom. Note that optogenetic activation of SST cells in nRT reduced the power of local field potentials (LFPs) regardless of the locomotion state of the animal. (C) Optogenetic stimulations at baseline: across-trial average power of all channels in the absence (black) and presence (blue) of optogenetic activation in one representative mouse shows significant decreases across theta (4–8 Hz), beta (15–30 Hz), and gamma bands (30–80 Hz) (see Table 1 for statistics). (D) Effect of locomotion without optogenetic stimulations: across-trial average power of all channels in one representative mouse indicates that locomotion has no significant effect on theta power, significantly reduces beta power, while causing a strong enhancement in gamma power (Table 1). (E) Effect of optogenetic stimulations in still and running conditions: average power across all channels in four mice shows that optogenetic activation of SST nRT cells selectively reduces gamma power both in the still (black vs. blue marks) and running conditions (red vs. blue marks) (Table 1), and has no significant effect on theta and beta powers from four mice. (F) Visual responses were recorded while mice were presented with moving gratings (eight directions, each moving in one of two possible directions; 2 s duration; randomly interleaved with optogenetic stimulation) in the visual field contralateral to the recording site. (G) Firing rate (averaged over all eight drifting directions) of an example cell during the course of the experiment. Black marks: visual responses when the laser is off; blue marks: visual responses when visual stimuli and optogenetic activation of SST nRT cells are coupled. Red shadings: locomotion state. Error bars: SEM. (H) Effect of visual stimulation with and without optogenetic manipulation: stimulus-evoked (average over all 20 trials) minus ongoing power of all channels when the laser is off (black circles) versus the laser-on condition (blue circles) in one representative mouse indicates a significant shift across all frequencies (Table 1). (I) Same as in (E) in the presence of visual stimulus (Table 1). Note that optogenetic activation of SST nRT cells selectively reduces gamma power in both still and running conditions, without significant effects on the other frequency bands. (J) Using three parameters calculated from average waveforms, cells were classified into narrow- (NS, cyan) or broad- (BS, magenta) spiking (height of the positive peak relative to the negative trough: −0.20 ± 0.01, –0.34 ± 0.02 [p=1.02e-9, Wilcoxon rank-sum test]; the time from the negative trough to the peak: 0.73 ± 0.02, 0.32 ± 0.02 ms [p=3.9e-33], slope of the waveform 0.5 ms after the negative trough: 0.01 ± 0.00, –0.01 ± 0.00 [p=5.94e-35], BS [n = 169], and NS [n = 73] cells, respectively). Subplot: average spike waveforms for all units, aligned to minimum, demonstrating BS (magenta) and NS (cyan) cells. (K) Optogenetic light significantly reduced firing rate of BS (magenta) and NS (cyan) cells during visual stimulus in both still and running conditions (Table 1). (L) Percentage change in visually evoked firing rate of both cell types versus percentage change of power in channels that each cell is recorded from for still and running states (Table 1, Spearman’s rho and p: 0.05, 0.58 BS and still [n = 100 BS in four mice]; −0.12, 0.22 BS and running; 0.19, 0.29 NS and still [n = 32 NS in four mice]; 0.05, 0.77 NS and running).

Figure 2—source data 1

Results of significance testing accross different conditions.

https://cdn.elifesciences.org/articles/61437/elife-61437-fig2-data1-v2.docx
Table 1
Results of significance testing across different conditions.

Power amplitudes are in units of 1000 * uV2/Hz (Figure 2C–I, Figure 4B–E) and firing rates are in Hz (Figure 2K, L, Figure 4F). BS: broad spiking; NS: narrow spiking.

Still and laser-offStill and laser-onRunning and laser-offRunning and laser-onp-Value
Figure 2C (n = 111 channels)θ39 ± 1.827 ± 1.41.2e-9
β64 ± 3.438 ± 2.34.7e-10
γ131 ± 6.567 ± 4.42.5e-12
Figure 2D (n = 111 channels)θ39 ± 1.845 ± 2.80.70
β64 ± 3.449 ± 2.74.5e-5
γ131 ± 6.5201 ± 9.25.2e-12
Figure 2E (n = 384 channels, four mice)θ29 ± 7.11.8e4 ± 5.033 ± 10.632 ± 9.50.12 (still), 0.46 (running)
β47 ± 10.02.7e4 ± 6.336 ± 6.032 ± 6.40.07 (still), 0.69 (running)
γ95 ± 18.55.0e4 ± 10.3137 ± 31.0483 ± 17.70.009 (still), 0.01 (running)
Figure 2H (n = 94 channels)θ−8.9 ± 0.516 ± 1.13.8e-17
β18 ± 1.65.7 ± 1.14.9e-9
γ39 ± 1.4−42 ± 1.63.8e-17
Figure 2I (n = 322 channels, four mice)θ6.2 ± 8.71.1e4 ± 7.7−0.9 ± 2.81.9e4 ± 6.40.71 (still), 0.03 (running)
β22 ± 11.93.3e4 ± 5.93.7 ± 2.91.5e4 ± 7.40.28 (still), 0.64 (running)
γ17 ± 7.6−2.3e4 ± 7.119 ± 8.5−2.8e4 ± 9.20.004 (still), 0.005 (running)
Figure 2K (n = 134 BS, 51 NS, in four mice)BS10.6 ± 1.616.9 ± 1.0016.9 ± 2.6510.5 ±. 590.0009 (still), 0.001 (running)
NS15.98 ± 2.949.2 ± 1.3325.9 ± 4.3415.2 ± 2.400.003 (still), 0.006 (running)
Figure 2L (n = 100 BS, 32 NS cells, in four mice)BS−38.2 ± 0.83−23.6 ± 4.72−38.2 ± 1.01−34.0 ± 4.02
NS−38.5 ± 0.65−21.1 ± 8.10−38.0 ± 1.17−35.56 ± 5.31
Figure 4B (n = 121 channels, in two mice)θ22 ± 1.422 ± 1.40.78
β42 ± 5.345 ± 5.50.50
γ77 ± 12.578 ± 12.40.88
Figure 4C (n = 121 channels, in two mice)θ22 ± 1.427 ± 2.00.04
β42 ± 5.342 ± 4.5.49
γ77 ± 12.599 ± 12.20.004
Figure 4E (59 channels, in two mice)θ27 ± 0.33.3 ± 0.40.45
β4.0 ± 0.84.7 ± 0.70.15
γ6.6 ± 1.86.5 ± 1.20.33
Figure 4F (n = 31 BS, 43 NS cells, in two mice)BS10.8 ± 1.7211.8 ± 1.8115.8 ± 2.6416.1 ± 2.750.81 (still), 0.98 (running)
NS12.0 ± 2.1312.3 ± 2.1518.9 ± 4.0518.3 ± 3.900.91 (still), 0.87 (running)

To investigate how evoked visual responses are affected by optogenetic activation of SST nRT neurons, visual responses were recorded to drifting sinusoidal gratings presented in the visual field contralateral to the recording site, and SST nRT neurons were activated optogenetically during randomly interleaved trials while recording LFPs and spiking activity in V1 (Figure 2F–G, Figure 2—figure supplement 1). Visual stimulation alone reduced theta but enhanced beta- and gamma-band LFP power compared with baseline activity (Figure 2H). In the presence of visual stimulation, optogenetic activation of SST nRT neurons significantly enhanced theta power while reducing power in other frequency bands (Figure 2H, Table 1). However, only the reduction of gamma power was consistently observed across all four recorded mice, while other effects were variable across subjects (Figure 2I, Table 1).

Given that the reduction in gamma power in response to activation of SST nRT neurons could potentially be caused by reduced spiking of neurons in V1, we next investigated firing rates of isolated neurons in V1. Neurons in V1 were classified as narrow spiking (NS) or broad spiking (BS) using three parameters calculated from average spike waveforms (Niell and Stryker, 2008; Figure 2J). NS cells consist of fast-spiking interneurons, whereas BS cells are 90% excitatory and 10% inhibitory cells (Barthó et al., 2004; Atencio and Schreiner, 2008). Optogenetic activation of SST nRT neurons during visual stimulation significantly suppressed activity of both BS and NS cell types in V1 of all four mice during both stationary and locomotion states (Figure 2K, Table 1).

To test whether different cortical layers are disproportionately modulated by the optogenetic activation of SST nRT neurons, we compared the changes in visual responses at individual recording sites. Visual stimuli evoked strong responses in all layers (Figure 2—figure supplement 2A, B), and optogenetic activation of SST nRT neurons reduced the activity evoked by visual stimuli (Figure 2—figure supplement 2C, D). Interestingly, the changes in LFP power produced by optogenetic manipulation of the nRT neurons were not solely due to reduction in the firing rate of V1 neurons (Figure 2L, Table 1).

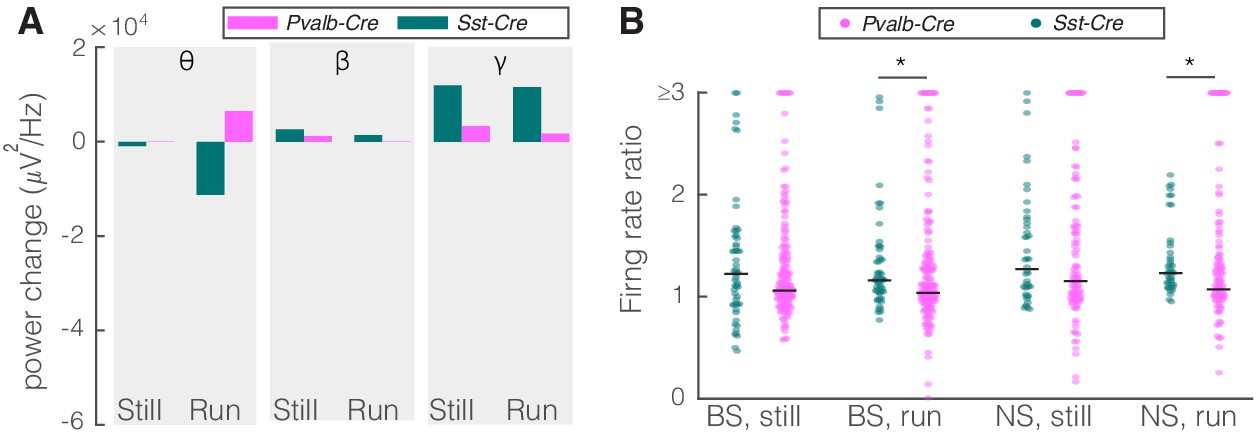
Given that PV nRT neurons projected less densely to dLGN, we hypothesized that modifying the activity of these neurons would have a smaller, if any, effect on V1. Indeed, consistent with their weaker projection to dLGN, activating PV nRT neurons produced only insignificant effects on V1 (Figure 2—figure supplement 3, Figure 2—source data 1). Surprisingly, the average change in gamma response to PV nRT activation, while not statistically significant, was in the opposite direction than the effect obtained with SST nRT activation (Figure 3A, Table 2). The difference between effects of activating SST or PV nRT neurons on firing rates was parallel to their effects on gamma (Figure 3B).

Comparison of optogenetic activation of somatostatin (SST) versus parvalbumin (PV) nucleus reticularis thalami (nRT) neurons on V1.

(A) Changes in the V1 ongoing power in response to optogenetic stimulation of SST (teal) and PV (pink) neurons in nRT (Table 2). *p<8e-3, **p<1.6e-3, ***p<1.6e-4. (B) Effect of optogenetic activation of SST and PV neurons in nRT on the ratio of laser-on to laser-off firing rates in narrow spiking (NS) and broad spiking (BS) cells in V1 in still and running conditions (SST vs. PV; BS, still: 0.79 vs. 1.27, p=0.0006, run: 0.67 vs. 1.29, p=1e-6, n: 134 vs. 191 cells; NS, still: 0.65 vs. 1.46, p=2e-5, run: 1.46 vs. 1.50, p=8e-7, n: 51 vs. 113; all in four mice). **p<2.5e-3, ***p<2.5e-4.

Table 2
Results of significance testing across different conditions.

Power amplitudes are in units of 1000 * uV2/Hz. PV: parvalbumin; SST: somatostatin.

SST: laser-on–laser-offPV: laser-on–laser-offMean difference and 95% CIp-Value
Figure 3A (SST: n = 384 channels, four mice; PV: n = 189 channels in four mice)θStill−11.5−1.310.2, [3.4, 15.2]0.005
Run−0.70.1−0.8, [–8.2, 5.1]0.14
 βStill−20.84.4−25.2, [–29.8, –17.0]0.008
Run−4.82.3−7.1, [–10.1, –6.6]0.08
 γStill−45.011.9−55.9, [–63.1, –51.4]0.001
Run−53.39.8−63.1, [–66.0, –60.2]5e-5
Figure 5A (SST: n = 313 channels, four mice; PV: n = 121 channels in two mice)θStill−3.80.2−4.0, [–5.1, 1.3]0.72
Run−15.93.5−19.4, [–22.0, –11.1]0.06
 βStill6.44.12.3, [–0.9, 3.5]0.81
Run3.9−0.74.6, [–2.2, 8.7]0.47
 γStill11.95.47.5, [4.1, 10.5]0.12
Run9.83.86.0, [3.4, 9.8]0.09

As a control experiment, we tested for potential non-specific effects of the laser light used for optogenetic activation by performing recordings in the V1 cortex of Sst-Cre mice in which an AAV viral construct containing eYFP rather than an opsin was injected into nRT. Visual responses were recorded with and without optogenetic light during interleaved trials (Figure 4A, D). As expected, delivering the optogenetic light (blue, 473 nm, ~63 mW/mm2) in nRT had no effect on the power across different frequency bands with (Figure 4E, Table 1) or without (Figure 4B, Table 1) visual stimulation; nor did it alter the firing rates of individual neurons (Figure 4F, Table 1) or the effects of locomotion on LFP power (Figure 4C, Table 1). These results indicate that the laser light used for optogenetic experiments has no effects in the absence of opsin expression.

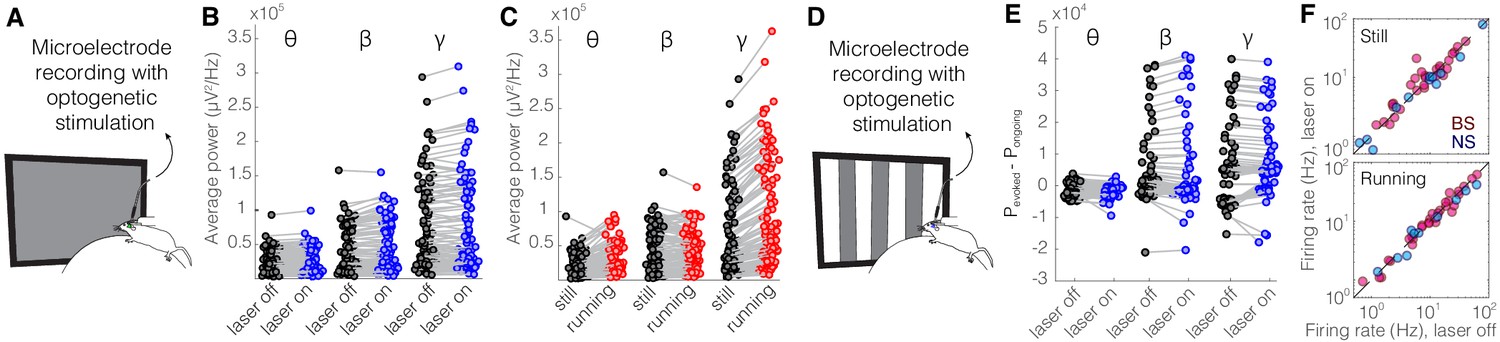
Optical stimulation of control enhanced yellow fluorescent protein (eYFP)-expressing somatostatin (SST) nucleus reticularis thalami (nRT) neurons does not change V1 activity.

(A) Experimental setup. (B) Across-trial average power of all 121 channels in the absence (black) and presence (blue) of optogenetic activation in one mouse shows no change (Table 1). (C) Across-trial average power of all channels in one mouse indicates that locomotion slightly modulates theta and beta powers, while causing a strong enhancement in gamma power (Table 1). (D) Visual responses were recorded while mice were presented with moving gratings. (E) Average power across all channels shows that light delivery in eYFP-expressing SST nRT cells does not affect power in V1 (Table 1). (F) Firing rate of broad spiking (BS) (magenta) and narrow spiking (NS) (cyan) cells across different conditions is not affected by the light in mice in which nRT does not express the opsin (Table 1).

Optogenetic inhibition of SST but not PV nRT neurons enhances single-cell responses in V1

As an alternative approach to determine how nRT gates input to the cortex, we examined the effect of inhibiting either SST or PV nRT neurons by expressing the enhanced Natronomonas halorhodopsin (eNpHR) in Sst-Cre or Pvalb-Cre mice. The outcome of this experiment is not trivial since optogenetic activation and inactivation of neurons do not necessarily produce symmetric effects (Phillips and Hasenstaub, 2016; Moore et al., 2018). We found that inhibiting eNpHR-expressing SST nRT neurons at baseline increased the firing rates of BS and NS cells in V1 during running but the increase in gamma did not reach significance (Figure 5, Table 2, Figure 5—figure supplement 1, Figure 2—source data 1). Inhibiting eNpHR-expressing PV nRT neurons neither significantly changed power in any of the frequency bands nor firing rates during still or running states (Figure 5, Table 2, Figure 5—figure supplement 2, Figure 2—source data 1).

Figure 5 with 2 supplements see all
Comparison of optogenetic inhibition of somatostatin (SST) versus parvalbumin (PV) nucleus reticularis thalami (nRT) neurons on V1.

(A) Changes in the V1 ongoing power due in response to optogenetic inhibition of SST (teal) and PV (pink) neurons in nRT across the three frequency bands (Table 2). (B) Effect of the optogenetic inhibition of SST and PV neurons in nRT on the ratio of laser-on to laser-off firing rates in narrow spiking (NS) and broad spiking (BS) cells in V1, in still and running conditions during visual stimulation (SST vs. PV; BS, still: 1.33 vs. 1.27, p=0.05, run: 1.29 vs. 1.10, p=0.004, n: 58 [in four mice] vs. 127 [in two mice] cells; NS, still: 1.47 vs. 1.26, p=0.13, run: 1.35 vs. 1.17, p=0.01, n: 44 vs. 75). *p<0.0125, **p<2.5e-3.

Optogenetic activation of SST nRT but not PV nRT neurons diminishes encoding ability of both BS and NS cells in V1

The action potentials in V1 neurons represent features of the visual world. Information theory provides a means to calculate how action potentials of a neuron inform us about what visual stimulus the animal was viewing. Given that SST nRT neurons are well positioned to modulate the information transmitted through the dLGN to V1, we asked, quantitatively, to what extent the activity of the SST nRT neurons modifies the encoding of visual information in V1. We computed the mutual information (I(R, S), see Materials and methods) conveyed by the spikes of single neurons about the visual stimuli that gave rise to those responses. We did this with and without optogenetic activation of SST nRT neurons, and separately for the running and stationary behavioral states, because locomotion alters both strength and information content of visual responses (Niell and Stryker, 2008; Dadarlat and Stryker, 2017). Optogenetic activation of SST nRT neurons markedly reduced mutual information between the neuronal responses and our set of visual stimuli for both BS and NS cells in V1 (Figure 6A, D, Figure 6—figure supplement 1A, B). The reduction of mutual information in individual V1 neurons during optogenetic activation of SST nRT neurons suggests that activity of the V1 population as a whole would encode less information about visual stimuli. We estimated the representation of visual information in the response of the V1 population by training a linear decoder (LDA) to identify the visual stimulus that the animal was viewing in single stimulus trials on the basis of the spike responses in the entire population of recorded neurons. LDA incorporates the following three assumptions: that different visual stimuli evoke linearly separable responses, that evoked responses are independent across neurons, and that the responses have a Gaussian distribution. The decoder is trained on all data except a single trial, which is left out for testing purposes (leave-one-out cross validation [LDA-LOOXV]). This approach allows us to quantify how well orientation of the visual stimulus can be predicted for the single trials excluded from the training set.

Figure 6 with 2 supplements see all
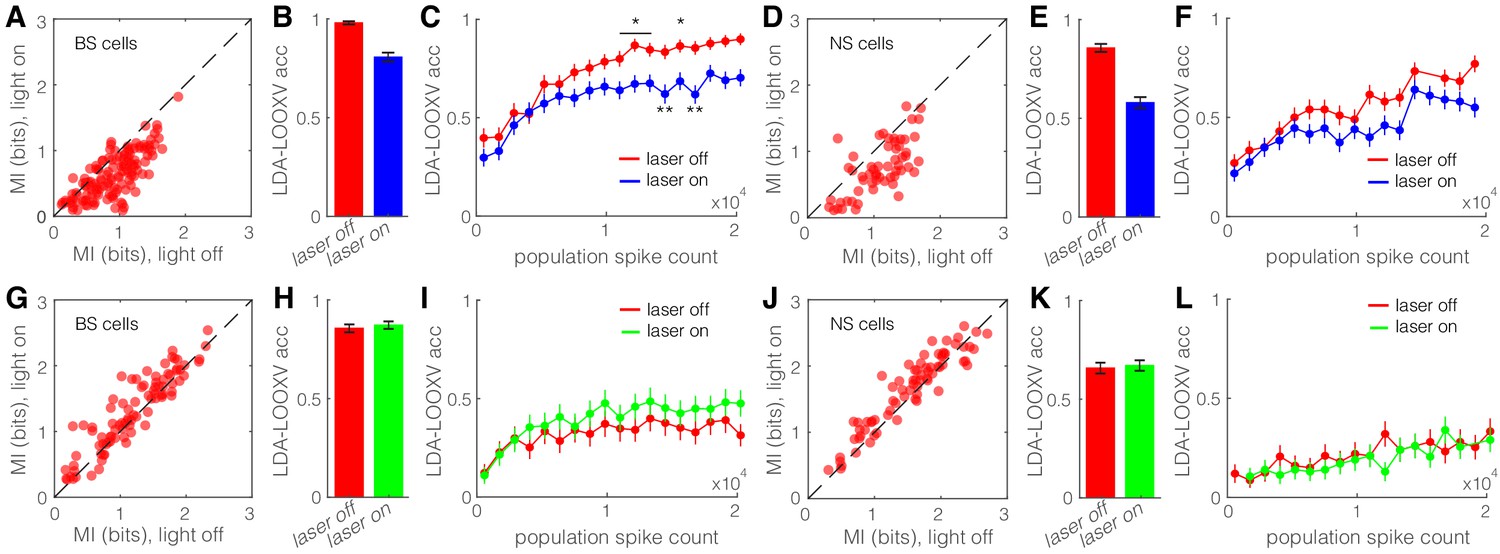
Optogenetic activation of somatostatin (SST) nucleus reticularis thalami (nRT) neurons diminishes encoding ability in both broad spiking (BS) and narrow spiking (NS) cells in V1.

(A) Effects of optogenetic activation of SST nRT cells on BS single-cell mutual information (MI) during locomotion: single-cell MI of BS neurons during locomotion demonstrates a significant reduction with optogenetic activation of SST nRT neurons (MI: light-off 0.91 ± 0.03 to light-on 0.64 ± 0.03, p=6e-5, n = 141 cells, four mice). Dashed line indicates unity. (B) Accuracy in leave-one-out cross validation (LDA-LOOXV) classification of visual stimulus movement orientation using BS responses during locomotion and optogenetic activation of SST nRT cells: (light-off 0.98 to light-on 0.81, p=2e-11, four mice, Wilcoxon rank-sum test). Error bars indicate bootstrapped estimates of SE. (C) Classification accuracy for grating movement orientation as a function of BS population spike count during locomotion and optogenetic activation of SST nRT neurons. Error bars indicate bootstrapped estimates of SE. Chance level would be at 0.16. (D) Effects of optogenetic activation of SST nRT cells on NS single-cell MI during locomotion: (MI: light-off 1.09 ± 0.05 to light-on 0.76 ± 0.05, p=7e-4, n = 58 cells, four mice). (E) Accuracy in LDA-LOOXV classification of visual stimulus movement orientation using NS responses during locomotion and optogenetic activation of SST nRT cells: (light-off 0.86 to 0.58, p=1e-13, four mice). (F) Classification accuracy for grating movement orientation as a function of NS population spike count during locomotion and optogenetic activation of SST nRT neurons. (G) Effects of optogenetic inhibition of SST nRT cells on BS single-cell MI during locomotion: (1.19 ± 0.06 to 1.31 ± 0.06, p=2e-4, n = 90 cells, four mice). (H) Accuracy in LDA-LOOXV classification of visual stimulus movement orientation using BS responses during locomotion and optogenetic inhibition of SST nRT cells: (light-off 0.86–0.87, p=0.53, four mice). (I) Classification accuracy for grating movement orientation as a function of BS population spike count during locomotion and optogenetic inhibition of SST nRT neurons. (J) Effects of optogenetic inhibition of SST nRT cells on NS single-cell MI during locomotion: (MI: 1.54 ± 0.07 to 1.65 ± 0.06, p=7e-4, n = 74 cells, four mice). (K) Accuracy in LDA-LOOXV classification of visual stimulus movement orientation using NS responses during locomotion and optogenetic inhibition of SST nRT cells: (light-off 0.65–0.67, p=0.72, four mice). (L) Classification accuracy for grating movement orientation as a function of NS population spike count during locomotion and optogenetic inhibition of SST nRT neurons. *p<0.05, **p<0.01.

Single-trial neuronal responses during locomotion were classified less accurately during optogenetic activation of SST nRT neurons for grating orientation in both BS (98% laser-off vs. 81% laser-on, p=2e-11, Wilcoxon rank-sum test) and NS (86% vs. 58%, p=1e-13) cells (Figure 6B, E). This finding indicates that the cortical representation of information about the visual world is reduced when SST nRT neurons are active. Importantly, this finding did not depend on the behavioral state of the animal (Figure 6—figure supplement 1C). Moreover, repeating the decoding analysis separately including only cells that are in the same range of cortical depth yielded similar accuracy (data not shown), indicating no particular laminar distinction in stimulus encoding.

Reduction in V1 information produced by nRT activation is not solely due to the reduction in firing rate

Optogenetic activation of SST nRT neurons led to lower population spike counts on average, which in turn led to reduced visual information (Figure 6—figure supplement 1A, B). The observed reduction in visual information could therefore be due either to the reduction of neuronal firing rates or to changes in the pattern of neural responses. To distinguish between these two possibilities, we quantified decoding accuracy for trials with equal population spike counts (see Materials and methods). We sampled (without replacement) anywhere between one and maximum number of neurons to get a very low or high number of spikes, respectively. This process was repeated 70 times, and then decoding accuracy was compared for equal population spike counts during laser-off and laser-on states by including more cells in the laser-on than the laser-off classifier. LDA-LOOXV was performed separately for the data collected from each mouse, and results from all four mice were pooled to generate average decoding accuracy as a function of population spike count for each cell type, behavioral state, and optogenetic state. Not surprisingly, classification accuracy increased with increasing spike count across all conditions. However, accuracy was always lower during optogenetic activation of SST nRT neurons for equal population spike counts (Figure 6C, F, Figure 6—figure supplement 1D), and particularly so at high population spike counts. The difference was less prominent with optogenetic inhibition of SST nRT neurons (Figure 6G–L, Figure 6—figure supplement 1E–H) and optogenetic activation or inhibition of PV nRT neurons (Figure 6—figure supplement 2). These findings indicate that optogenetic activation of SST nRT neurons not only reduces spiking activity in V1 cells but also alters the spiking pattern, leading to a less accurate encoding of visual stimuli.

Optogenetic activation of SST nRT neurons reduces single-cell responses and gamma power in dLGN

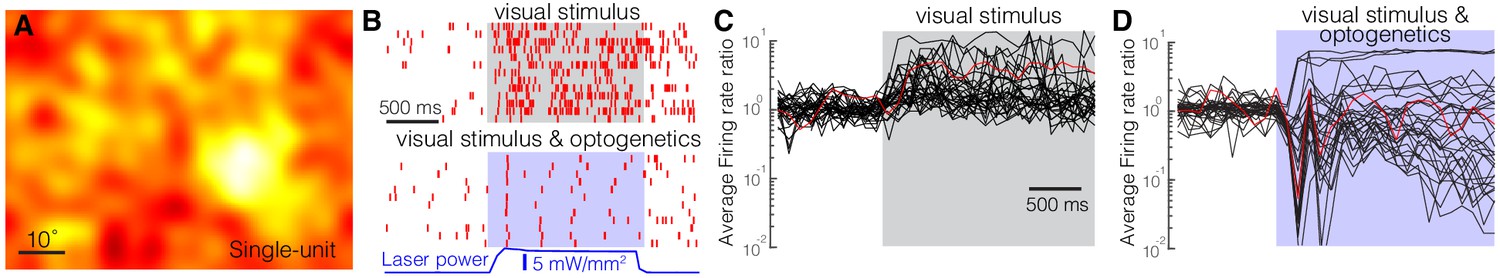
Optogenetic activation of the inhibitory neurons in the nRT, including all of the subtypes, transiently reduces activity of thalamocortical neurons in dLGN (Olsen et al., 2012; Reinhold et al., 2015). Similar results were obtained when optogenetically activating SST nRT neurons in transgenic mice (Campbell et al., 2020). To determine how effective activation of only the SST nRT subpopulation is in reducing activity in dLGN, we expressed ChR2 in SST nRT neurons by intra-nRT viral injections in Sst-Cre mice and performed single-unit (SU) and multiunit (MU) and field potential recordings from dLGN. Responses to low-frequency filtered noise stimulus were used to calculate spike-triggered averages (STAs, Figure 7A). STAs at 18% (35/193) of the recording sites displayed a classical center-surround structure like that shown for a SU (Figure 7A). Nearly all of the SU and MU recordings were effectively inhibited during the 4 s optogenetic activation of SST nRT neurons (Figure 7—video 1), and field potentials recorded in dLGN showed a dramatic reduction across all frequency bands (Figure 7—figure supplement 1, Figure 7—source data 1), in agreement with a strong projection of SST nRT neurons to dLGN (see Figure 1; Campbell et al., 2020). While visual stimuli evoked strong responses in SUs (Figure 7B, top), optogenetic activation markedly reduced those responses, leaving only a few spikes in response to each cycle of the grating stimulus (sinusoidal drifting gratings, 2 Hz temporal frequency, 0.04 Hz spatial frequency) (Figure 7B–D). MU recording sites displayed a similar degree reduction (Figure 7—figure supplement 1).

Figure 7 with 4 supplements see all
Optogenetic activation of somatostatin (SST) nucleus reticularis thalami (nRT) neurons reduces firing in dorsal lateral geniculate nucleus (dLGN) neurons.

Spike-triggered averages of a single unit (A) in dLGN were calculated using responses to low-frequency filtered noise stimulus. (B) Spike raster for a representative single unit in dLGN across several trials (rows) with visual stimulus only (top) or visual stimulus coupled with optogenetic activation of SST nRT neurons (bottom). Gray shaded area shows the duration of the visual stimulus. Blue shading shows the duration of optogenetic activation. Average firing rate ratios (computed as the visually evoked firing rates for the optimal grating divided by the firing rates prior to the onset of visual stimulation) of dLGN single units in response to visual stimulation only (C) and in response to visual stimulation coupled with optogenetic activation of SST nRT neurons (D). Red trace in (C) and (D) is the example cell shown in B.

Figure 7—source data 1

Results of significance testing accross different conditions.

https://cdn.elifesciences.org/articles/61437/elife-61437-fig7-data1-v2.docx

Optogenetic inhibition of SST nRT neurons, in line with our V1 recordings, caused only a slight, and not significant, increase in gamma activity and spiking in dLGN compared to baseline (Figure 7—figure supplement 2, Figure 7—source data 1).

To test how nRT output alters the reliability of dLGN responses to visual stimulation, we calculated the coefficient of variation (CV) by dividing the standard deviation of firing rates in the presence or absence of optogenetic manipulation by their respective means. Our data reveal that optogenetic activation of SST nRT neurons increased the CV of dLGN responses (Figure 7—figure supplement 3A). These findings reveal that the firing of SST nRT neurons reduces the ability of dLGN neurons to reliably report visual information. In contrast, optogenetic inhibition of SST nRT neurons did not significantly reduce CV of dLGN responses (Figure 7—figure supplement 3B).

The effects of perturbing SST nRT activity by optogenetics on field potentials recorded in the dLGN were measured in the absence of visual stimulation. As expected, optogenetic excitation generally reduced their amplitude and optogenetic inhibition increased them or left them unchanged. These opposite-directed changes were significant in the beta and gamma bands both during locomotion and at rest (Figure 8A). During visual stimulation, which increases the firing of dLGN neurons, activation of SST neurons in nRT produced much stronger effects on dLGN firing of both SU and MU sites than did inhibiting them (Figure 8B). These findings from optogenetic perturbation of SST nRT neurons on dLGN activity reveal that activating nRT neurons powerfully reduces the visual input to V1.

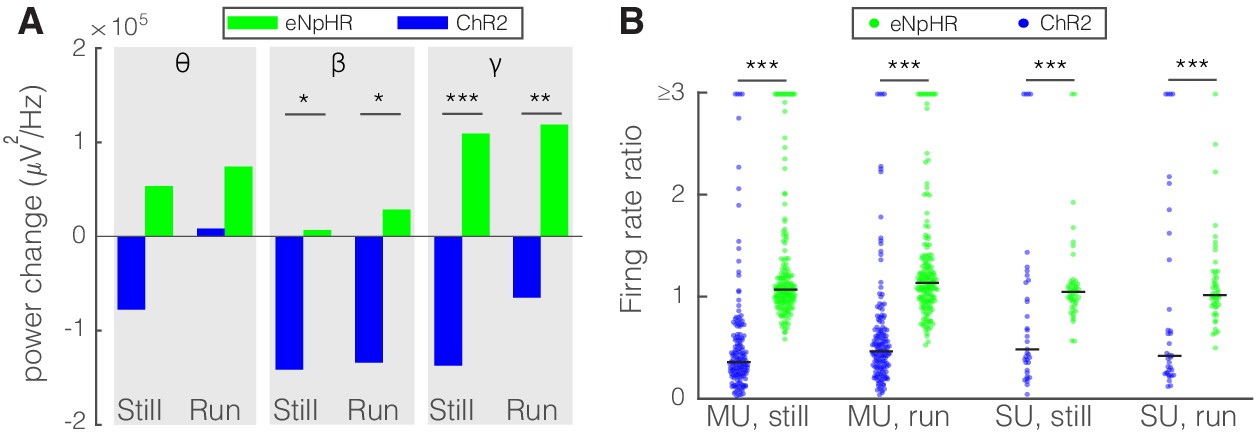
Optogenetic activation and inhibition of somatostatin (SST) nucleus reticularis thalami (nRT) neurons bidirectionally control the activity of dorsal lateral geniculate nucleus (dLGN) neurons.

(A) Changes in the dLGN ongoing power due to optogenetic activation (blue) or inhibition (green) of SST nRT neurons across the three frequency bands (Channelrhodopsin-2 [ChR2] vs. enhanced Natronomonas halorhodopsin [eNpHR]; theta, still: −77.6e3 vs. 53.4e3, p=0.06, nested t-test, mean difference −132.0e3 with a 95% CI of [−105.1e3, 163.0e3], run: 8.2e3 vs. 74.1e3, p=0.09, nested t-test, mean difference −65.9e3 with a 95% CI of [−75.1e3, −51.8e3]; beta, still: −141.3e3 vs. 6.7e3, p=0.012, mean difference −134.6e3 with a 95% CI of [−178.0e3, −87.2e3], run: −134.0e3 vs. 28.5e3, p=0.009, mean difference −162.5e3 with a 95% CI of [−184.0e3, −123.6e3]; gamma, still: −137.0e3 vs. 109.3e3, p=3e-5, mean difference −246.3e3 with a 95% CI of [−289.5e3, −191.7e3], run: −65.0e3 vs. 118.9e3, p=6e-3, mean difference −183.9e3 with a 95% CI of [−202.0e3, −58.8e3]; all in three mice, all powers in uV2/Hz). *p<0.016, **p<0.0016, ***p<0.00016. (B) Effects of optogenetic activation or inhibition of SST neurons on the ratio of laser-on to laser-off firing rates of dLGN cells across locomotion conditions (ChR2 vs. eNpHR; multi-unit [MU], still: 0.65 vs. 1.28, p=5e-22, run: 0.66 vs. 1.65, p=5e-11, n: 158 vs. 185 cells; single-unit [SU], still: 1.13 vs. 1.30, p=7e-6, run: 1.34 vs. 1.23, p=6e-8, n: 35 vs. 49; all in three mice). ***p<2.5e-4.

Discussion

Here, we have identified new specificity in a subcortical circuit that modulates both gamma power and the representation of information in the discharge of neurons in the primary visual cortex. We found that the input from nRT to the dLGN in the mouse is predominantly from the class of inhibitory neurons that express SST, with negligible anatomical connections from the more numerous PV-positive neurons (Figure 1, Figure 1—figure supplement 1). Optogenetic activation of SST nRT neurons in alert, head-fixed mice suppressed the SU spiking and field potential responses to visual stimulation in both dLGN and V1, and caused suppression of gamma, whether the mice were stationary or running on a polystyrene ball floating on air. Inhibition of SST nRT neurons produced mostly opposite effects (Figures 3 and 5). Perturbation of PV neurons in nRT had much smaller effects compared to SST nRT neurons, consistent with fewer projections to dLGN (Figures 3 and 5). These findings provide evidence for a specific neural circuit that regulates gamma power, and which is associated with visual attention, and the encoding of visual information in V1.

Cellular heterogeneity in the nRT

SST and PV neurons have been defined by antibody staining of the protein markers, by genetic labeling throughout development, and by their recombinase activity in adulthood. These three approaches to distinguishing SST from PV cell types may differ in the extent of overlap that is interpreted as coexpression. The findings of this paper are based on the third approach and do not bear on the issue of coexpression assessed from the other approaches. The present study reveals the distinct functional effects of Sst-Cre and Pvalb-Cre expressing neurons.

The existence of functionally distinct neuron types within the nRT has been shown (Lee et al., 2007; Halassa et al., 2014) and has recently been associated with PV and SST markers (Clemente-Perez et al., 2017) and further extended to additional molecular markers (Li et al., 2020; Martinez-Garcia et al., 2020). Finding molecular markers of functionally distinct nRT cells may be significant because it could allow us to selectively perturb distinct functions of the nRT.

Our studies used virally injected constructs in mature Pvalb-Cre and Sst-Cre mice to distinguish PV and SST neurons in the various sectors of the nRT (Clemente-Perez et al., 2017), including in the visual sector (Figure 1—figure supplement 1; Clemente-Perez et al., 2017). Using immunohistochemistry and confocal imaging, we confirmed that putative synaptic boutons from PV and SST nRT neurons are largely distinct (Figure 1—figure supplement 2), although certain neurons do express both markers (Figure 1—figure supplement 2) consistent with previous work (Clemente-Perez et al., 2017). Calbindin has been suggested as another marker of a subpopulation of nRT neurons (Martinez-Garcia et al., 2020); however, this has not been confirmed by single-nuclear RNA sequencing studies, which found no absolutely exclusive genetic markers between nRT cell types, although gradients in Spp1 and Ecl1 gene expression were noted between core and shell parts of the nRT (Li et al., 2020). Future studies at multiple levels of analysis (protein, genetic) will determine whether the differences between results of the studies cited above are due to use of different transgenic mouse models. In the present study, using viral expression of fluorescent reporters of recombination in adult mice, we find that both PV and SST neurons are present in the visual sector of the nRT (Figure 1—figure supplements 1 and 2) and that both types project to visual thalamic nuclei, but the SST neurons predominate in the projection to dLGN, whereas PV neurons project more strongly to higher-order visual nuclei (LP) (Figure 1). The role of neurons that express both markers (PV and SST) and their specific contribution remains to be determined; however, our results demonstrate that the functional effects of Sst-Cre and Pvalb-Cre neurons in nRT are distinct.

Notably, the studies cited above were all done in mice, which are more readily amenable to molecular studies than other species. Such markers will need to be validated in other mammals, and non-human primates and humans in future studies. However, the existence of mutually exclusive PV and SST neurons in the adult human nRT (Clemente-Perez et al., 2017) suggests that our findings in mice may be relevant to the human brain.

Comparison with carnivore and primate

The perigeniculate nucleus in the carnivore and primate is thought to be the portion of the nRT related to the thalamocortical visual system, although this is contested (Ahlsén et al., 1982). The carnivore perigeniculate consists of inhibitory neurons that receive excitatory input from ascending thalamocortical axons of the dLGN as well as from layer 6 cells of V1, and they project back to inhibit the principal cells of the dLGN in a highly focused topographic fashion (Lam and Sherman, 2011; Soto-Sánchez et al., 2017; Crabtree, 2018). This focal projection of the nRT is consistent with the 'Searchlight' hypothesis for nRT function (Crick, 1984). It is not known whether the nRT projection to the mouse dLGN has sufficiently precise topography to play such a focal role in directing attention to particular areas of the field. It is possible that the portion of the carnivore nRT referred to by Ahlsén et al., 1982 as ‘reticular neurons’ may be analogous or even homologous to the nRT of the mouse. Such an arrangement could be consistent with a role for the mouse nRT in switching attention between modalities (Wimmer et al., 2015) rather than among different loci in the visual field. However, recent findings indicate a more focal role for the mouse nRT in corticothalamic feedback that modifies the properties of receptive fields in dLGN (Born et al., 2020), consistent with the focal retrograde labeling we observed in Figure 1—figure supplement 2.

Earlier studies have found that, as in the mouse, the nRT of cats (Oertel et al., 1983; Clemence and Mitrofanis, 1992), ferrets (Clemence and Mitrofanis, 1992), and monkeys (Graybiel and Elde, 1983; Jones and Hendry, 1989) contains both PV and SST cells. In those studies, the projections of the specific cell types to visual thalamic nuclei and their roles in the transmission of visual information were not determined. Interestingly, in one primate species, the Galago senegalensis, different laminae of the visual portion of the nRT project to the dLGN and the pulvinar, which corresponds loosely to the mouse LP (Conley and Diamond, 1990). Cells in the more medial laminae, which is rich in SST cells, project to the pulvinar, while cells in the more lateral laminae project to the dLGN (Conley et al., 1991). These findings suggest a functional segregation of the roles of SST and PV cells in this species, although in the opposite direction to that found in mice, where the dLGN receives a more substantial projection from SST cells and LP a denser projection from PV cells.

Does nRT activity merely turn off the input to V1?

Activation of SST nRT neurons caused a robust reduction in the firing of both the thalamocortical neurons in dLGN and the excitatory and putative fast spiking inhibitory interneurons in V1 (Figures 2, 7, and 8). Consistent with this effect, electron microscopy reveals geniculate terminations of SST nRT neurons only on dLGN excitatory neurons (Campbell et al., 2020). Interestingly, activating SST nRT neurons alters not just the amount but also the pattern of activity across the population in V1. In contrast, despite the fact that PV neurons are present in the visual portion of the nRT (see Figure 1—figure supplement 1), perturbation of their firing rate did not affect the visual information encoding in V1. Optogenetic perturbation of PV nRT neurons had a smaller effect on V1 compared with SST nRT neurons, and some of these effects were in the opposite direction. For instance, activation of PV nRT neurons increased gamma activity and firing rates in V1 cells while SST nRT neurons did the opposite (Figure 3). These findings are consistent with the possibility that the PV nRT neurons inhibit dLGN interneurons and/or SST nRT neurons, although such connections are yet to be established. We propose that the different outputs of SST and PV nRT neurons to primary and high-order visual thalamic nuclei, and the possible intra-nRT connections, may support the switching of attention as suggested for the nRT (Wimmer et al., 2015).

We speculate that the more potent effects of transiently silencing V1 by the activation of all nRT neurons in experiments using Gad2-Cre mice are due to the simultaneous suppression of both dLGN and LP thalamocortical neurons (Reinhold et al., 2015). Interestingly, excitation of SST nRT neurons does not silence activity in V1 but only reduces the information about the visual world that V1 carries.

SST and PV neurons in the somatosensory sector of the nRT have distinct burst firing properties Clemente-Perez et al., 2017; whether this is also true in the visual sector remains to be determined. Distinct bursting properties have been demonstrated in the rat visual nRT (Kimura et al., 2012), but it remains unknown whether these are associated with distinct molecular markers.

Cortical VIP neurons also modulate V1 activity

Locomotion increases both gamma power and visual responses in mouse V1, and gates a form of adult plasticity (Niell and Stryker, 2010; Kaneko and Stryker, 2014; Kaneko et al., 2017; Hoseini et al., 2019). The effects of locomotion are produced by a circuit operating through vasoactive intestinal peptide (VIP) interneurons in V1 (Fu et al., 2014; Fu et al., 2015). During locomotion, when gamma power is strong in dLGN and V1, activation of SST nRT neurons reduces it (Figures 2, 3, and 8). Visual responses of both excitatory and inhibitory cortical neurons were reduced to a similar extent by activation of SST nRT cells (Figure 2). These findings indicate that these two modulatory systems—locomotion via cortical VIP cells (Niell and Stryker, 2010; Fu et al., 2014) and SST nRT activation—contribute independently to activity in V1. In the somatosensory representation, SST nRT neurons receive inputs from mainly subcortical structures (central amygdala, anterior thalamus, external segment of globus pallidus) in contrast with PV nRT neurons that mainly receive sensory cortical inputs (Clemente-Perez et al., 2017). We speculate that the SST nRT neurons are well positioned to exert a bottom-up regulation of visual attention. In contrast, the effects of locomotion on V1 activity are regulated by cortical VIP interneurons that receive top-down inputs from higher cortical areas (Zhang et al., 2014).

Implications for disease

Sensory stimulation in the gamma range has been shown to enhance cognition in a mouse model of Alzheimer’s disease (Adaikkan et al., 2019). Given that nRT is involved in sensory processing and attention, and that its dysfunction has been implicated in attention disorders (Zikopoulos and Barbas, 2012; Ahrens et al., 2015; Wells et al., 2016), and given that gamma power has been associated with attention (Kim et al., 2016), we propose that SST nRT neurons could be a target for modulating visual attention.

Materials and methods

Key resources table
Reagent type (species) or resourceDesignationSource or referenceIdentifiersAdditional information
Strain, strain background (B6.129P2 Pvalbtm1(cre)Arbr/J)Mus musculus Male and femalePvalb-CreThe Jackson LaboratoryStock No: 017320
RRID:IMSR_JAX:017320
Strain, strain background (B6N.Cg-Ssttm2.1(cre)Zjh/J)Mus musculus Male and femaleSst-CreThe Jackson LaboratoryStock No: 018973
RRID:IMSR_JAX:018973
Strain, strain background (C57BL/6J)
Mus musculus Male and female
C57BL/6JThe Jackson LaboratoryStock No: 000664
RRID:IMSR_JAX:000664
Sequence-based reagentPvalb-1 WT/Pvalb-5 KOTransnetyxGenotyping probes
Sequence-based reagentSst-1 WT/Sst-5 TgTransnetyxGenotyping probes
Viral prep (rAAV5/EF1a-EYFP)eYFPAddgeneAddgene plasmid # 27056 SCR_002448
RRID:Addgene_27056
Viral prep (rAAV5/EF1a-ChR2-EYFP)ChR2AddgeneAddgene plasmid # 20298
RRID:Addgene_20298
Viral prep (rAAV5/EF1a-eNpHR3.0-EYFP)eNpHRAddgeneAddgene plasmid # 26966
RRID:Addgene_26966
Immunohistochemistry reagentNormal donkey serumJackson ImmunoresearchCat #: 017-000-121
RRID:AB_2337258
Immunohistochemistry reagentAntifade medium (Vectashield)Vector LaboratoriesCat #: H-1000
RRID:AB_2336789
Immunohistochemistry reagentCholera Toxin Subunit B (Recombinant), Alexa Fluor 488 ConjugateInvitrogenCat #: C34775
AntibodyRabbit anti-parvalbumin antibodySwantCat #: PV27
RRID:AB_2631173
1:500 dilution
AntibodyDonkey anti-rabbit Alexa Fluor 594AbcamCat #: ab150076
RRID:AB_2782993
1:500 dilution
AntibodyRabbit anti-somatostatin antibody, unconjugatedPeninsula Laboratories InternationalCat #: T-4103
RRID:AB_518614
1:1000 dilution
AntibodyMonoclonal anti parvalbumin antibodySwantCat #: 235
RRID:AB_10000343
1:1000 dilution
AntibodyDonkey anti-Mouse IgG (H+L) highlycross-adsorbed secondary antibody, Alexa Fluor 555Thermo Fisher ScientificCat# A-31570
RRID:AB_2536180
Surgery itemMetabondPATTERSON DENTAL / Parkell Co.Three items:
Cat #: 5533559
Cat #: 5533500
Cat #: 5533492
EquipmentFiber opticThorLabsCat #: CFML12U-20
EquipmentGreen laser for eNpHROPTO ENGINE LLCCat #: MGL-III-532
EquipmentBlue laser for ChR2OPTO ENGINE LLCCat #: MDL-III-450
SoftwareMATLABMathWorksSCR_001622
SoftwareGraphPad Prism 8GraphPadSCR_002798
SoftwareOrigin 9.0OriginLabSCR_002815
SoftwareRR-projectSCR_001905
SoftwareSigmaPlotSigmaPlotSCR_003210

Animals

We performed all experiments in compliance with protocols approved by the Institutional Animal Care and Use Committees at the University of California, San Francisco, and Gladstone Institutes (protocol numbers AN180588-02C and AN174396-03E). Precautions were taken to minimize stress and the number of animals used in all experiments. We followed the NIH guidelines for rigor and reproducibility of the research. Adult (P60–P180) male and female mice of the following genotypes were used: Sst-Cre mice, Pvalb-Cre mice, and C57BL/6J mice.

Viral delivery in nRT for optogenetic experiments

Request a detailed protocol

We performed stereotaxic injections of viruses into the nRT as described (Paz et al., 2011; Paz et al., 2013; Clemente-Perez et al., 2017; Ritter-Makinson et al., 2019). We targeted the nRT with the following stereotaxic coordinates: 1.3 mm posterior to bregma and 2.0–2.1 mm lateral to the midline at two different injection depths (200 nl at 2.65 and 200 nl at 3.0 mm) ventral to the cortical surface. We previously validated that this protocol results in specific expression of the viral construct in the nRT neurons and not in the surrounding brain areas (Clemente-Perez et al., 2017) (see also Figure 1—figure supplement 1). For eYFP tracing studies (Figure 1), a total of 400 nl of concentrated virus (2 × 1012 genome copies per milliliter) carrying genes for eYFP alone (rAAV5/EF1a-EYFP) were injected unilaterally in nRT of Pvalb-Cre and Sst-Cre mice. For optogenetic experiments, a total of 400 nl of concentrated virus (2 × 1012 genome copies per milliliter) carrying genes for ChR2 or eNpHR were injected unilaterally in nRT of Pvalb-Cre and Sst-Cre mice, as described (Clemente-Perez et al., 2017). The Allen Brain and the Paxinos mouse brain atlases were used to validate the location of the viral expression in nRT (Paxinos and Franklin, 2001; Lein et al., 2007).

Headplate surgery and implanting fiber optic

Request a detailed protocol

Three to six weeks after viral injections in the nRT, we performed a second surgery to implant a fiber optic (core diameter, 200 μm) in nRT at 1.3 mm posterior to bregma, 1.9–2.0 mm lateral to the midline, and 2.3–2.5 mm ventral to the cortical surface; and a titanium headplate—circular center with a 5 mm central opening—above the V1 cortex (−2.9 mm posterior to bregma, 2.5 mm lateral to the midline) or dLGN (−2.0 mm posterior to bregma, 2.0 mm lateral to the midline). The base of the fiber optic and the entire skull, except for the region above V1 or dLGN, was covered with Metabond. One week after the recovery from this surgery, the animal was allowed to habituate to the recording setup by spending 15–30 min on the floating ball over the course of 1–3 days, during which time the animal was allowed to run freely. About 2 weeks following this surgery (i.e., ~4–6 weeks after viral injection in nRT), the animal’s head was fixed to a rigid crossbar above a floating ball. The polystyrene ball was constructed using two hollow 200-mm-diameter halves (Graham Sweet Studios) placed on a shallow polystyrene bowl (250 mm in diameter, 25 mm thick) with a single air inlet at the bottom. Two optical USB mice, placed 1 mm away from the edge of the ball, were used to sense rotation of the floating ball and transmit signals to our data analysis system using custom driver software. These measurements are used to divide data into still and running trials and analyze them separately.

Microelectrode recordings in alert mice

Request a detailed protocol

To control for circadian rhythms, we housed our animals using a fixed 12 hr reversed light/dark cycle and performed recordings between roughly 11:00 AM and 6:00 PM. All the recordings were made during wakefulness in awake, head-fixed mice that were free to run on the floating ball (Figure 2A; Hoseini et al., 2019). On the day of recording, the animal was anesthetized with isoflurane (3% induction, 1.5% maintenance) and a craniotomy of about 1 mm in diameter was made above V1 or dLGN. After animals recovered from anesthesia for at least 1 hr, a 1.1-mm-long double-shank 128-channel electrode (Du et al., 2011), fabricated by the Masmanidis laboratory (University of California, Los Angeles) and assembled by the Litke laboratory (University of California, Santa Cruz), was slowly inserted through the cranial window. To record from V1, the electrode was placed at an angle of 20–40° to the normal of the cortical surface and inserted to a depth of ~1000 μm. To record from dLGN, the electrode was placed at a normal angle to the cortical surface and inserted to a depth of 2.5–3.0 mm (Piscopo et al., 2013). An optical fiber (200 μm diameter) coupled to a light source (green laser for eNpHR, peak intensity ~104 mW/mm2 at 532 nm; blue laser for ChR2, peak intensity ~63 mW/mm2 at 473 nm) was connected to the implanted fiber optic in order to deliver light into nRT. Laser power (3–20 mW) was measured at the end of the optical fiber before connecting to the animals. Recordings were started an hour after electrode insertion.

Visual stimuli

Request a detailed protocol

Stimuli were displayed on an LCD monitor (Dell, 30 × 40 cm, 60 Hz refresh rate, 32 cd/m2 mean luminance) placed 25 cm from the mouse and encompassing azimuths from −10° to 70° in the contralateral visual field and elevations from −20° to +40°. In the first set of recordings, no stimulus was presented (uniform 50% gray) while nRT was exposed to the optogenetic light for 4 s every 20 s. For the second set of recordings, drifting sinusoidal gratings at eight evenly spaced directions (20 repetitions, 2 s duration, 0.04 cycles per degree, and 1 Hz temporal frequency) were generated and presented in random sequence using the MATLAB Psychophysics Toolbox (Brainard, 1997; Kleiner et al., 2007), followed by 2 s blank period of uniform 50% gray. This stimulus set was randomly interleaved with a similar set in the presence of optogenetic light. Optogenetic stimulation was delivered for 2 s periods beginning simultaneously with the onset of the visual stimulus, overlapping the entire stimulus period and turned off by the end of the stimulus.

Data acquisition and analysis

Request a detailed protocol

Movement signals from the optical mice were acquired in an event-driven mode at up to 300 Hz and integrated at 100-ms-long intervals and then converted to the net physical displacement of the top surface of the ball. A threshold was calculated individually for each experiment (1–3 cm/s), depending on the noise levels of the mouse tracker, and if the average speed of each trial fell above the threshold, the mouse was said to be running in that trial. Running speed of the animal was used to divide trials into running and still states that were analyzed separately. Data acquisition was performed using an Intan Technologies RHD2000-Series Amplifier Evaluation System, sampled at 20 kHz; recording was triggered by a TTL pulse at the moment visual stimulation began. Spike responses during a 1000 ms period beginning 500 ms after stimulus onset were used for analysis. LFP power was computed with and without visual stimulation, and each was compared to its power during a time window of similar duration preceding optogenetic stimulation. Raw data collected at 20 kHz were first bandpass filtered between 1 and 300 Hz, and then wavelet transform was used to compute its spectrum (Torrence and Compo, 1998). Finally, power spectra were adjusted for 1/fα with α of 2.5 and averaged over all trials for each recording channel.

Cortical layers were estimated by performing current source density (CSD) analysis on data collected during presentations of a contrast-reversing square checkerboard (0.04 cycles/degree, square-wave reversing at 1 Hz). Raw data filtered as above were averaged across all 1 s positive-phase presentations of the checkerboard. Data from channels at the same depth were averaged together within a shank of the electrode, then CSD for each channel was computed as described (Mitzdorf, 1985) (see Figure 2—figure supplement 2).

Single-neuron analysis

Request a detailed protocol

The data acquired using 128-site microelectrodes were sorted using MountainSort (Chung et al., 2017), which allows for fully automated spike sorting and runs at 2× real time. Manual curation after a run on 40 min of data takes an additional 20 min, typically yielding 90 (range 50–130) isolated SUs. Using average waveforms of isolated SUs recorded from V1, three parameters were defined in order to classify SUs into NS or BS (Niell and Stryker, 2008). The parameters were as follows: the height of the positive peak relative to the negative trough, the slope of the waveform 0.5 ms after the negative trough, and the time from the negative trough to the peak (see Figure 2J). For dLGN recordings, STAs were used to classify units into SUs and MUs (Figure 7A).

Mutual information

Request a detailed protocol

Neuronal responses are considered informative if they are unexpected. For example, in the context of visually evoked neural activity, if a neuron responds strongly to only a very specific stimulus, for example, photographs of Jennifer Aniston (Quiroga et al., 2005), the response is informative. In contrast, if a neuron consistently produces similar responses (measured in the number of spikes per second) to all stimuli that are presented, its responses provide little information. This notion can be formalized by a measure of information called the Shannon entropy,

HX=EXIx=-xXpx.log2p(x)

where H(X) is in units of bits. The neuron that responds to Jennifer Aniston’s face has high entropy and is therefore said to be informative. The concept is further extended to mutual information, I(R, S), which quantifies how much information the neuronal response (R) carries about the visual stimulus (S) by computing the average reduction in uncertainty (entropy) about the visual stimulus produced by observing neuronal responses. Intuitively, observing responses from the aforementioned Jennifer Aniston neuron leaves little uncertainty as to which face was presented. Mutual information between S and R is calculated as follows:

IR, S= HS-H(S|R)=EXIx=rRsSpr, s.log2(p(r, s)prp(s))

where r and s are particular instances from the set of neural responses (measured as spike counts) and stimuli (grating movement directions in our case), respectively. We used Information Theory Toolbox in MATLAB to compute mutual information (https://www.mathworks.com/matlabcentral/fileexchange/35625-information-theory-toolbox).

Population-based analysis: decoding the visual stimulus from population responses

Request a detailed protocol

To decode the stimulus that the mouse was viewing from single-trial responses of the population of neurons that was recorded simultaneously, we used a linear discriminant analysis (LDA) classifier (Dadarlat and Stryker, 2017). The LDA classifier was trained to classify single-trial neural responses, assuming independence between neurons (a diagonal covariance matrix). The trials were divided into two groups of equal size, a control group with the laser off and an experimental group with the laser on. We then randomly subsampled the trials from each group 50 times to obtain a distribution of errors in decoding the stimulus based on the data included.

The difference between the decoding errors using trials from the control and experimental groups was a measure of the effect of optogenetic modulation of nRT-cell responses on the representation of information in V1 about which grating stimulus was viewed. We used a leave-one-out (LDA-LOOXV) approach to train and test classification separately for the trials in each group using MATLAB’s fitcdiscr and predict functions. To decode only grating orientation and not movement direction, we grouped stimuli moving 180° apart into the same class.

Population-based analysis: decoding with equal population spike counts

Request a detailed protocol

A higher firing rate has the potential to convey more information. To determine whether the effect of optogenetic manipulation of the nRT on the representation of information in V1 was solely due to the resulting change in V1 firing rates, we compared decoding accuracy from trials in the laser-off and laser-on groups with equal population spike counts, the sum of spikes from all neurons. This was accomplished by selecting subsets of neurons from the population (1–70 neurons were randomly subsampled with replacement). The constructed datasets retain higher-order structure between neural activity within each trial, allowing us to consider many samples of laser-off and laser-on trials that have the same population spike counts. We used an LDA-LOOXV to train and test classification separately for each subset. For each number of neurons, we subsampled with replacement 100 times from the population, yielding 100 combinations of neurons. Classifiers were trained separately on each subsample and for each condition.

Immunostaining, retrograde staining, microscopy, and image analysis

Request a detailed protocol

Immunohistochemistry on mouse brain sections and image analysis were performed as previously described (Clemente-Perez et al., 2017; Ritter-Makinson et al., 2019). Briefly, the brains were removed, post-fixed for 24 hr in 4% paraformaldehyde (PFA), and then transferred to 30% w/v sucrose in PBS, at 4°C for cryoprotection. Serial coronal sections (30 μm thick) were cut on a Leica SM2000R Sliding Microtome. Sections were stored in 96-well plates in cryoprotectant solution (0.5 M sodium phosphate buffer, pH 7.4, 30% glycerol, and 30% ethylene glycol) at 4°C until further processing. Free-floating sections were washed in PBS, permeabilized with 0.5% Triton-X100 in PBS (PBST-0.5%), washed with 0.05% Triton-X100 in PBS (PBST-0.05%), and blocked in 10% normal donkey serum in PBST-0.05% for 1 hr at room temperature. Primary incubation was performed in 3% normal donkey serum overnight at 4°C, followed by 3 × 10 min washes in PBST-0.05%. Secondary incubation was performed in 3% normal donkey serum overnight for 1–2 hr at room temperature, followed by washes in PBST-0.05% and PBS. All secondary antibodies were dissolved at 1:1000 dilution in 3% NDS in PBST. Sections were mounted in an antifade medium and imaged using either a Biorevo BZ-9000 Keyence microscope or a Zeiss LSM880 confocal microscope. The expression of the viral constructs in different brain regions was confirmed with reference to two standard mouse brain atlases (Paxinos and Franklin, 2001 and the Allen Brain Atlas Lein et al., 2007).

In the experiments described in Figure 1 and Figure 1—figure supplements 1 and 2, sections were immunostained with antibodies against PV (host: rabbit; concentration: 1:500) and donkey anti-rabbit Alexa Fluor 594 (concentration: 1:500). In the experiments described in Figure 1—figure supplement 2: 30 nl of Cholera-ToxinB conjugated with Alexa488 was injected in the dLGN in the adult male mouse at −2.8 mm from Bregma, 2.2 mm lateral from midline, 2.4 mm under the cortical surface using the same injection method as described for opsin injections. 48 hr post-CTB injection, mice underwent cardiac perfusion/fixation with ice-cold PBS followed by 4% w/v PFA in 0.1 M sodium phosphate (PBS) as described above. The primary antibodies used in the immunohistochemical procedures were as follows: polyclonal rabbit anti-somatostatin-14 (SST), 1:1000 (Peninsula Laboratories); rabbit antiserum against PV, 1:500. For dual fluorescent immunostaining (PV/SST), a combination of primary antibodies—monoclonal mouse anti-PV, 1:1000 and polyclonal rabbit anti-SST, 1:1000 (Peninsula Laboratories)—was applied to sections and incubated overnight at 4°C (shaker). All primary antibodies were dissolved in 3% NDS in PBST. After three washes in PBST, monoclonal primary antibodies were visualized by incubation in the dark for 2 hr with appropriate secondary fluorochrome-conjugated antibodies: donkey anti-rabbit Alexa Fluor 549, donkey anti-rabbit 647, and donkey anti-mouse Alexa Fluor 555 (Invitrogen).

Experimental design and statistical analysis

Request a detailed protocol

The experiments reported here were designed to determine (1) whether specific cell types in nRT project to visual thalamus and (2) whether optogenetic activation or inhibition of either SST or PV cells in nRT alters visual responses and oscillatory activity in V1 and dLGN. For the quantification of putative synaptic inputs from SST and PV nRT neurons to various thalamocortical nuclei (see Figure 1), we performed immunohistochemistry of brain sections from n = 2 Sst-Cre and n = 3 Pvalb-Cre mice (male, age range 2–4 months) in which we had injected an AAV construct that resulted in eYFP expression in SST or PV neurons, respectively (for specific details, see Figure 1). For the physiology experiments, we recorded V1 responses of n = 4 (two males and two females) Sst-Cre mice with optogenetic activation, n = 4 (two males and two females) Sst-Cre mice with optogenetic inhibition, n = 4 (three males and one female) Pvalb-Cre mice with optogenetic activation, and n = 2 (males) Pvalb-Cre mice with optogenetic inhibition (age range 3–5 months). Furthermore, we recorded dLGN responses in n = 3 (males) Sst-Cre mice with optogenetic activation and n = 3 (males) Sst-Cre mice with optogenetic inhibition. For the control experiment, we recorded n = 2 mice (males, age 3 months), which were injected with a viral construct expressing eYFP in nRT. The expression and specific location of the opsins were verified in all the recorded mice listed above (see representative examples in Figure 1—figure supplement 1). All data are illustrated in Figures 18 and figure supplements.

All numerical values are given as mean ± SEM and error bars are SEM unless stated otherwise in the figure legends. Hypothesis testing for representative channels or cells in one mouse was done using appropriate parametric or non-parametric tests. Due to the nested structure of data, a multilevel analysis was used to probe statistical differences between measurements under different conditions across all mice (Aarts et al., 2014). Number of samples (n), number of subjects (when applicable), exact p-value, and test name are reported in figure legends and tables. Data analysis was done in MATLAB, Origin 9.0, GraphPad Prism 8, R-project, and SigmaPlot using Wilcoxon rank-sum, Wilcoxon signed-rank test, Spearman rank-order correlation with the Bonferroni correction for multiple comparisons.

Data availability

All data generated or analyzed during this study are included in the manuscript and supporting files. Source data for all figures are available in a spreadsheet format.

References

  1. Book
    1. Paxinos G
    2. Franklin KBJ
    (2001)
    Paxinos and Franklin’s the Mouse Brain in Stereotaxic Coordinates
    Academic Press.

Decision letter

  1. Solange P Brown
    Reviewing Editor; Johns Hopkins University, United States
  2. Laura L Colgin
    Senior Editor; University of Texas at Austin, United States
  3. Ashley L Juavinett
    Reviewer; University of California, San Diego, United States

In the interests of transparency, eLife publishes the most substantive revision requests and the accompanying author responses.

Acceptance summary:

This paper investigates two different cell types within the reticular nucleus of the thalamus (nRT), demonstrating that they have different projection patterns and impacts on subsequent visual processing. The overarching theme here is to understand if and how parvalbumin-expressing and somatostatin-expressing cells in nRT are involved in gating information to the cortex during different behavioral contexts. While some of this manuscript reinforces and complements work by this group and others, the additions of a mutual information analysis and the emphasis on these nRT cell types within the visual system are both novel.

Decision letter after peer review:

Thank you for submitting your article "Gamma rhythms and visual information in mouse V1 specifically modulated by somatostatin+ neurons in reticular thalamus" for consideration by eLife. Your article has been reviewed by 3 peer reviewers, and the evaluation has been overseen by a Reviewing Editor and Laura Colgin as the Senior Editor. The following individual involved in review of your submission has agreed to reveal their identity: Ashley L Juavinett (Reviewer #1).

The reviewers have discussed the reviews with one another and the Reviewing Editor has drafted this decision to help you prepare a revised submission.

We would like to draw your attention to changes in our revision policy that we have made in response to COVID-19 (https://elifesciences.org/articles/57162). Specifically, when editors judge that a submitted work as a whole belongs in eLife but that some conclusions require a modest amount of additional new data, as they do with your paper, we are asking that the manuscript be revised to either limit claims to those supported by data in hand, or to explicitly state that the relevant conclusions require additional supporting data.

Our expectation is that the authors will eventually carry out the additional experiments and report on how they affect the relevant conclusions either in a preprint on bioRxiv or medRxiv, or if appropriate, as a Research Advance in eLife, either of which would be linked to the original paper.

Summary:

The diversity of cell types within the thalamic reticular nucleus (nRT) has been increasingly appreciated as has its influence on cortical responses depending on the behavioral context. Here, the authors show how a subset of nRT neurons expressing somatostatin project into the primary thalamic nucleus of the visual system, the lateral geniculate nucleus, and influence visual processing and rhythm generation in the primary visual cortex. This study highlights the functional effects of a specific circuit within the nRT, supporting the hypothesis that cell-type specific pathways within the nRT subserve distinct functions in sensory processing.

The authors' overarching theme is to understand if and how PV and SOM cells in the thalamic reticular nucleus (nRT) are involved in gating information to the cortex during different behavioral contexts (movement and visual input). The authors provide anatomical data showing that SOM neurons of the visual sector of the nRT project to the lateral geniculate nucleus (LGN). Using optogenetics to show loss and gain of function influences, the authors demonstrate that SOM neurons (and not PV) of the nRT disrupt thalamocortical transmission and gamma activity in the primary visual cortex (V1) and LGN, thus implicating a cell-type specific pathway from the nRT in thalamocortical modulation of visual information processing and gamma oscillations.

Overall, the reviewers agreed that the manuscript presents an interesting set of data but would benefit from removing claims not well supported by the presented data, more clearly motivating the experiments and analyses performed, and clarifying several claims and aspects of the methods including the statistical treatment of certain results.

Essential revisions:

Claims not well supported by the presented data:

1. The discussion of V1 layer specificity is not supported by the data. On page 6, column 2, line 16: "Visual stimuli evoked the strongest responses in the superficial layers (~layer 2/3) and layer 4 (Figure 2 – S3A, B)." This result is not quantified nor is it evident in the figures. Relatedly, "optogenetic activation of SOM nRT neurons reduced the activity evoked by visual stimuli in these layers (Figure 2 – S3C)." This manipulation reduced the activity in all layers. Comparisons between layers were not formally performed and responses of the shanks shown in S3E differ in their profile. Considering these factors, the appropriate analyses should be performed or the text and related title of the supplemental figure, "Optogenetic activation of SOM neurons in nRT has a stronger effect on neuronal responses in superficial layers in V1," should be changed.

2. While the greatest change was seen in gamma during running, it appears optogenetic activation of SOM neurons in the nRT reduced power across all frequencies whether the mouse was still or running (Figure 3). The authors assert that inhibiting SOM neurons produced a "consistent increase" in both gamma and spiking activity of cells in V1. However, the stats in Figure 5A do not support a significant increase in beta or gamma. Thus, it is unclear why one of the overarching conclusions of the paper is the selective impact on gamma activity.

3. Page 9, line 17: "presumably because of their strong projections to the dLGN" – why not any of the other changes in V1 already described?

4. "These findings suggest that SOM neurons in nRT can powerfully modulate the encoding ability of neurons in dLGN" – it is unclear how the CV captures encoding ability. Similarly, on page 10, line 15: "determines how accurately visual stimuli are encoded" and page 12 "positioned to control encoding ability" – the authors should be careful about claims about accurate encoding vs the ability to perform an accurate decoding.

5. Effects on LGN activity. The stats presented in Figure 8A indicate that the bidirectional changes in power were not significant. However, the explanation in the text is confusing and also fails to take these stats into account.

6. Page 12, line 27: "and which is associated with visual attention," – nothing in this paper elucidates mechanisms of visual attention and this mention should be removed. Similarly, line 40, "leading to a blurred representation of the visual world" is an interesting possible extension of these findings but is not directly supported by the data. Whether the visual world is "blurred" or whether stimuli are not easily decoded from neural activity are not equivalent.

Results requiring further clarification:

1. It would be worthwhile elaborating on the relationships between PV and SOM neurons in the visual sector of nRT. The results in Figure 1 – S1 should be quantified rather than simply showing representative images. Clemente-Perez et al. 2017 does not provide clear evidence that the two groups are mutually exclusive, but rather shows co-expression of PV and SOM in some nRT neurons. The relationship between the labeled neurons in the two Cre-lines should also be clarified. The results from Martinez-Garcia et al. 2020 and Li et al. 2020 should also be integrated into the manuscript.

2. Furthermore, there appears to be a substantial population of PV neurons in the visual sector, but it is unclear if these are projection neurons. If so, where do they terminate since visual thalamic nuclei are largely devoid of PV terminals? If they are intrinsic to the nRT, optogenetic stimulation of PV could potentially silence SOM projection neurons and disrupt thalamocortical activity through the LGN. Does optogenetic activation of PV affect LGN activity? How these factors affect the interpretation of the results should be addressed.

3. Another, more fundamental, issue with these experiments is the location chosen for injection. Retrograde labelling experiments have suggested that dLGN projecting nRT neurons are located more posterior and dorsal (approx. A/P: -1.6, M/L: +/- 2.0, D/V: -2.4) than the injection site used here. This raises the concern that PV neurons outside the nRT may be labeled. Moreover, there is no guarantee that PV and SOM positive populations projecting to LGN are located in the same region of nRT. To clearly differentiate the relevance of PV and SOM nRT neurons for visual processing, retrograde labelling of each population would be important to assess the location that should be targeted. Alternatively, the framing of these issues should be modified. Because the reasoning for comparing PV and SOM populations is not particularly clear, it may be better to de-emphasize this set of results and focus on the impact of activating the SOM population on sensory processing.

4. For V1 (and LGN) activity, is it possible that a reduction in spike firing can explain the loss of power? What is the relationship between these variables? This issue also comes up in the Discussion section, and it would be important to articulate whether the reduction in spike firing is tied to the loss of power. If these variables are tightly coupled, then the loss of power could simply be a consequence of reduced activity.

Methods requiring clarification:

1. The statistical test run for each comparison throughout the paper needs to be clearly included. Although the reporting methods form says, " In the main text statistical reporting always directly follows the sentence in which the result is first mentioned, and includes test name, test statistics, exact p-value (when possible)and sample size (n)," this is not the case in the text. Similarly, the reporting form says, " A table has been uploaded with all statistical tests done for figures 2 to 4" but this table does not include Figure 3, and there are many other statistical tests performed throughout the manuscript that should be included. Table 1, and any additional tables that are added, should also include the number of observations for each comparison.

2. Furthermore, the manuscript contains statements and conclusions about the magnitude of change. In many instances the authors use inferential statistics to illustrate the magnitude of effects (e.g. "moderate decreases in theta and beta and strong decrease in gamma"). If the magnitude of change is important, the authors should consider using estimation statistics. As it stands, the p-valued based stats do not support qualitative statements about the magnitude of change.

3. In some figures, it is difficult to identify what each dot represents, for example, in Figure 9D. It would be useful to specify n values for all figures (not just those included in Table 1) and identify the quantity (i.e. n = X neurons or n = Y pairs) to help the reader to understand what is being shown.

4. There is no description in the methods about the acquisition of LFP band and calculation of power, 1/f scaling, etc. Was the LFP band acquired at 20 Hz as well? Was it down-sampled? How was it filtered? Relatedly, is Figure 2L showing power across all bands, and how exactly was the CSD / laminar structure computed?

5. Information theory and the concept of mutual information are not fully introduced in the main text. Similarly, the motivation and caveats of the LDA and deep neural network analyses should be more explicit. Relatedly, it is important to frame the methods description of the mutual information analysis first within information theory (and with the proper citation), because "Neuronal responses are considered informative if they are unexpected," does not make sense taken out of that specific context.

Organization of the manuscript, including motivation for some experiments:

1. It would be helpful to readers to more clearly define the experimental question at the outset and center the organization and flow of the manuscript accordingly. Whereas the focus of the introduction is largely on the role of gamma in visual attention and perception, these concepts are not central to the paper and are never directly tested. Other ideas dominate the current figures: the role of narrow- and broad-spiking cells and the differences in neural activity in specific cell types between moving and stationary. Framing these questions for the reader at the beginning, as well as re-considering the organization of some of the figures and supplementary information, would be very useful. With 9 figures and many supplemental figures, the main message in this paper is easily obscured, and the manuscript would benefit from a tighter framing of this interesting collection of data.

2. One reason that the different results presented sometimes appear disconnected is that the writing is at times disjointed and lacks transitions. Even in the abstract (abstract lines 14-16) following a sentence describing projections of nRT neurons, the authors immediately jump to a describe "powerful modulation" of sensory encoding and gamma activity without stating what this modulation is or even mentioning that it is produced by SOM-positive nRT neurons. Similar examples occur for many key transitions in different parts of the manuscript (For example: Intro., p. 2, line 1-2, left; Intro., p. 2, line 33-38, left; Results, p. 6, line 1-3, left; Results, p. 7, line 4-12, right; Results, p. 10, line 4-8, right). It would be very important to clarify the reasoning for each of these steps individually and together, so that reader can understand the results.

3. Another example needing clarification is the transition from comparing the impact of SOM and PV manipulations on gamma oscillations to examining the impact on sensory responses in V1 using mutual information (MI) and linear decoding methods. This is a large jump and seems almost the beginning of a separate study. More to the point, the authors do not seem to attempt to relate the observed effects on oscillatory dynamics to their various analysis of sensory encoding in the dorsal lateral geniculate nucleus (dLGN) and visual cortex (V1) beyond a general discussion. To address this issue, it would be important to clearly link changes in sensory encoding and processing with the observed changes in oscillatory dynamics and, ideally, to better describe how optogenetic manipulation of nRT leads to changes in each aspect of sensory processing. Unifying the various observations in this way would substantially strengthen the study and would allow the authors to address their original thesis that gamma oscillations are relevant to sensory processing and that the role of the nRT in "gating" sensory input involves control of these oscillatory dynamics.

4. The authors present multiple analysis, including linear decoding, spike triggered averages (STA), measurement of coefficients of variation (CV) and a pairwise correlation based decoding method without discussing how effects observed in one measure relate to other observations.

5. Overall, the Discussion section could be improved with a more in-depth discussion about the following: identity, source, and targeting of SOM and PV neurons in the visual of nRT, the relationship between power and levels of activity and candidate circuits and their degree of independence in modulating V1 activity.

6. As touched on in the Discussion, it is not clear how locomotion via VIP neurons and SOM nRT activation contributes independently to activity in V1. Could it be possible that SOM nRT via LGN could regulate VIP neurons in V1? What is the evidence that describes the inputs and outputs of VIP interneurons?

7. The notion that mouse nRT may be suited for switching attention between different sensory modalities is interesting, and the work of the Halassa lab may be worth citing and discussing in the Discussion.

8. It may be worth discussing the relationship with the perigeniculate nucleus as the visual sector of nRT in carnivores. Is the more caudal part of the carnivore nRT analogous/homologous to the auditory and somatosensory sector of mouse nRT?

9. The Discussion would benefit from references to specific figures.

[Editors' note: further revisions were suggested prior to acceptance, as described below.]

Thank you for submitting your article "Gamma rhythms and visual information in mouse V1 specifically modulated by somatostatin+ neurons in reticular thalamus" for consideration by eLife. Your article has been reviewed by 3 peer reviewers, and the evaluation has been overseen by a Reviewing Editor and Laura Colgin as the Senior Editor. The following individual involved in review of your submission has agreed to reveal their identity: Ashley L Juavinett (Reviewer #1).

The reviewers all agreed that the manuscript was substantially improved in response to the reviewers' comments. However, after consultation among the reviewers, the reviewers agreed that there were six remaining issues to address before publication in eLife.

1. The authors should clarify whether optogenetic inhibition of SST neurons significantly alters gamma power relative to baseline. It seems that inhibiting SST nRT neurons did not significantly increase either gamma or spiking activity relative to baseline, and this could be more clearly acknowledged. Furthermore, there at times seems to be contradictions between the main text and the figures as well as with the response to the reviewers. These contradictions should be resolved in a revised manuscript.

2. The authors could report the P values based on the adjusted alpha (0.05/number of comparisons) for Bonferroni corrections.

3. The heading "Optogenetic activation of SST nRT but not PV nRT neurons diminished encoding ability of BS cells in V1" should be changed to "Optogenetic activation of SST nRT but not PV nRT neurons diminishes encoding ability of both BS and NS cells in V1" as both BS and NS encoding were affected.

4. The authors should further clarify the extent of PV and SST co-expression (see points 4a-4f).

4a. In Figure 1- supplemental figure 1, some images appear to show that PV and SST are mutually exclusive while the CTB experiments show some co-expression. These latter retrograde tracing experiments indicate that PV, SST and co-expressing neurons project to LGN.

4b. The authors should clarify why in Figure 1-supplemental figure 1, there does not appear to be co-localization between ChR2-EYFP and PV IHC in PV-Cre;ChR2-EYFP mice.

4c. The possibility of co-expression should be incorporated into the interpretation of the results.

4d. The possibility for interactions between PV and SST neurons in nRT should be incorporated into the authors' interpretation of their results.

4e. The reference to Campbell et al. 2020 regarding PV and SST expression in the visual sector of nRT should be eliminated as their comparison was between SST and NeuN.

4f. The figure legend in Figure 1C, D should be changed to SST for consistency. Consider changing SOM to SST throughout (ie. Figure 1—figure supplement 2).

5. It is difficult to interpret the effects of activation of SST-positive nRT neurons on population decoding and mutual information measures. These effects could simply be due to non-specific inhibition changes produced by activating a random subset of this population introducing an additional source of noise to the sensory signal. While the observation that most single-units recorded in LGN were inhibited may reduce this concern, it is unclear whether this is sufficient to address the concern. A more useful approach would be to compare sensory response properties of LGN neurons with and without SST activation. This could be done qualitatively by comparing receptive field properties of LGN neurons and the coefficient of variation (which was removed from the previous revision) could be used to support the claim that changes in response fidelity were present at the level of individual neurons and thus that the changes in population decoding were not a consequence of inhomogeneous. If the authors choose not to include such an analysis, this caveat should be included explicitly in the discussion.

6. There remains some lack of clarity in the text. Some claims are very difficult to understand from what is written (see, for example, the case mentioned in Concern 1). The complexity of some claims also makes it difficult for the authors to draw specific conclusions in many cases. For instance, after discussing a variety of changes in oscillatory dynamics across several frequency bands during locomotion and non-locomotion produced by bi-directional optogenetic manipulations of nRT sub-populations the authors conclude that "SST nRT neurons are well positioned to exert powerful effects on the visual input to V1". Moreover, the relationship between oscillatory dynamics and sensory responses of individual neurons is still somewhat unclear. These challenges should be mitigated by a careful discussion of the relationship between changes in oscillatory dynamics, firing rates and the relevant neuronal populations in the thalamus and cortex and further clarification of the language reporting the results in a revised manuscript.

Reviewer #1:

In this paper, the authors have dissected two different circuits arising from somatostatin (SST) and parvalbumin (PV) positive cells from the nRT nucleus of the thalamus. This paper is an impressive technical tour de force, incorporating many techniques to address the underlying questions about the connectivity of these cells and their role in visual processing. With this lab's overarching interest in brain oscillations, there is a particular focus on the impact of these cells on gamma in the visual cortex. This work fits into a broader body of work that is continuously seeking to elucidate the distinct roles of various cell types in particular areas of the brain, and provides possible mechanistic explanations for previous findings from other labs.

The strengths of this paper are largely derived from the comprehensive approach to the overarching question. First, the authors show that SST and PV neurons in the nRT have very different projection patterns to other nuclei in the thalamus, both visual and somatosensory. Seeing that SST neurons project more strongly to other visual nuclei (such as the dLGN), they hypothesized that optogenetically manipulating the activity of these neurons would more strongly impact the visual cortex (which primarily receives input from the dLGN). While doing so impacted multiple frequency bands across multiple layers of cortex, the impact on gamma was most evident. Importantly, the authors performed control experiments for non-specific laser effects. Although the analysis on broad spiking (BS) and narrow spiking (NS) cells did not yield any differences, future studies looking at more specific cell types may.

As V1 is ultimately responsible for encoding visual information, the authors then tested whether or not SST activation would reduce mutual information between responses in broad spiking neurons in V1 – and it does. Additional controls demonstrated that this was not due to spike rate differences. Future work could investigate whether this is behaviorally relevant to the animal during a discrimation task, for example.

While gamma oscillations are strongly correlated with visual attention, this isn't directly tested in this paper. The authors have provided a potential mechanism by which gamma could be regulated, but have not directly confirmed whether this is the mechanism that underlies changes during attention. Future work would need to address this directly using a behavioral task that probes visual attention. Overall, the authors have addressed the feedback on the initial submission and the claims made in this paper are supported by the data.

The authors have comprehensively addressed the feedback of the first submission, and have delivered a much stronger manuscript as a result. I am particularly impressed by the new statistical approach and the additional sections in the methods. As such, I have no additional major suggestions. There are some thoughts on additional behavioral experiments, which I'm sure will come of no surprise to the authors.

I have two remaining concerns about the statistical approach:

1. Why not use the nested approach in Figure 6?

2. There is a mention of Bonferroni corrections in the methods but the reported P-values are still * p < 0.05. Use of a Bonferroni correction means adjusting the alpha – reporting the adjusted alpha (0.05/number of comparisons) would make sense here.

The authors might reconsider the opening of the paper, which largely focuses on gamma oscillations. Although this is indeed one of the main findings of the manuscript, it is not the only finding, and in this reviewer's perspective, this manuscript offers quite a bit by way of understanding the cell types within a previously unknown thalamic nucleus, and also in the mutual information approach. Regardless, the logical progression of the introduction is clear and I can appreciate the lab's prevailing interest in gamma oscillations and their role in visual attention.

One small suggested change: the header "Optogenetic activation of SST nRT but not PV nRT neurons diminishes encoding ability of BS cells in V1" is a bit misleading, because it impacts both BS and NS cells. I suggest, "Optogenetic activation of SST nRT but not PV nRT neurons diminishes encoding ability of both BS and NS cells in V1."

Lastly, the authors have provided "source data" but this is simply a word document of the two tables in the manuscript. I do not see a spreadsheet of source data as is referenced in "Data Availability" statement on the cover sheet. The authors might consider making their data and relevant code available.

Reviewer #2:

Many of the concerns raised by the reviewers have been adequately addressed. However, there is still confusion about the exclusivity of PV and SOM neurons in nRT. It is also not clear how such heterogeneity or lack thereof, impact the results and interpretation. The authors state that the two groups are mutually exclusive but that a subgroup "show both markers". Which is it and how does this impact the interpretation of results? The bottom line based on the authors results is to acknowledge anatomically there is sparse co-expression in the visual sector, but functionally SST projecting neurons seem to regulate dLGN activity related to gamma.

Other related issues are listed below.

The reference to Campbell et al. 2020 is inaccurate, since in this paper they showed about 80% of neurons in the visual sector co-express SST and NeuN (not SST and PV). There are several instances throughout the paper that mistakenly cite Campbell et al. 2020 as evidence for PV and SST co-expression. This needs to be amended.

In the supplemental figure 1, the authors showed with IHC, the labeling of PV in SST-Cre ChR2-EYFP mice. Based on the high-power images it appears that SST and PV are mutually exclusive in the visual sector of nRT (head), but it doesn't appear this was quantified; was there any evidence of co-expression (as asked by one of the reviewers) in the visual sector? CTB experiments seem to reveal some co-expression but from the images it's difficult to evaluate how prevalent.

In the supplemental figure 1, I am puzzled by the lack of co-expression between PV-Cre/ChR2 eYFP and PV IHC. Do the authors have an explanation?

While the authors show that PV projections largely project to PV and not dLGN, they still failed to address whether intrinsic connections between PV and SOM in nRT could complicate their optogenetic manipulations.

Figure 1 C-D, the bar graphs refer to SOM, for consistency it should be changed to SST (see also figure 2 supplement panels C-E).

Reviewer #3:

The author's study brings together a set of interesting experiments designed to investigate the role of the inhibitory nucleus reticularis of the thalamus (nRT) in controlling sensory processing in the visual cortex and relate this control to changes in gamma oscillatory dynamics that have been tied to attentional control and state-specific sensory processing. By specifically controlling molecularly defined groups of nRT neurons using optogenetic techniques, they find that somatostatin- (SST-) positive neurons play a distinct role in regulating visual cortical oscillations as well as population encoding across multiple conditions. Although this is a valuable discovery, there are some conceptual questions that remain unanswered. First, it is unclear how to interpret the changes in population decoding observed in V1 following SOM neuron activation. Because the optogenetic approach used would randomly activate a subset of SST neurons, the change in the representation they estimate may simply represent an injection of noise into the signal arising from the non-specific inhibitory input. While their linear decoding approach suggests that the effect is not simply due to reduced spiking, the issue of non-specific inhibition is difficult to exclude based on the findings presented. In addition, while their optogenetic experiments convincingly show that activation of SST-positive nRT neurons has a much stronger effect on cortical activity compared with similar manipulation of parvalbumin- (PV-) positive nRT neurons, the anatomical tracing results they presented leave some uncertainty as to whether this population is the main inhibitory projection from the visual subdivision of the nRT to the primary visual thalamus (the lateral geniculate nucleus, LGN). In particular, without quantification the retrograde tracing shown cannot exclude the possibility that PV neurons also substantially project to the LGN. Finally, although the authors do show that both gamma oscillations and population encoding are impacted by changes in SST activity, how these changes related to each other remains unclear. Despite these remaining questions, however, this study does represent valuable progress towards understanding how inhibitory control systems in the thalamus impact key aspects of cortical processing.

While valuable results are presented in the manuscript some technical and conceptual issues remain that complicate the interpretation of these results. Although revisions made to the previous submission have improved the manuscript, particularly by appropriately weakening and/or clarifying some claims, some major concerns still present issues for the overall manuscript which it would be important to address. These concerns are described in detail below:

1. In the previous submission concerns were raised regarding the claim that the majority of neurons projecting from the visual nRT to the LGN are SST-positive, with PV-positive neurons projecting instead to higher-order visual thalamic neurons (Previous Concern 7 and 8) and that the injection site used for the retrograde labelling may not have fully addressed these concerns (Previous concern 9). To address these concerns, the authors performed retrograde labelling experiments using cholera-toxin (CTB-Alexa488) injected into the LGN followed by histological assessment of labelled neurons to determine whether they were PV- or SST- positive. Based on these experiments, it appears that both cell types project to LGN. However, based on their earlier viral tracing experiments, they still conclude that the predominant projection is from SST-positive neurons. While the earlier results do provide qualitative support for this conclusion, it would still be important to have some quantification in order to make the claim that input is "mainly" from SST.

2. Previously, a concern was raised regarding the statistical significance of changes in gamma power produced by suppression of SST neurons (Previous concern 2). This remains an important claim for the overall message but, while the authors rebuttal appears to state that additional statistical analysis has clarified this point, this is not at all clear from the text. The rebuttal response refers to Figure 5A which is described in the main text as follows: "We found that inhibiting eNpHR-expressing SST nRT neurons at baseline produced a consistent, but insignificant, increase in both gamma and spiking activity of cells in V1 and a reduction in theta and beta (Figure 5A, Table 2, Figure 5—figure supplement 1, Figure 2-source data 1).…". Based on this, it is very hard to determine whether any significant change occurred (indeed, the change is described as "insignificant"). Moreover, the analysis in the figure itself appears to be comparing inhibition of PV versus SST rather than making any comparison with baseline although it is difficult to be certain due to some overall issues with labelling (see major concern 4). This key point needs substantial clarification in the main text and legend.

3. It is difficult to interpret the effects of activation of SST-positive nRT neurons on population decoding and mutual information measures these effects could simply be due to the fact that non-specific inhibition changes produced by activating a random subset of this population introduce an additional source of noise to the sensory signal. While the observation that most single-units recorded in LGN were inhibited may reduce this concern, it is unclear whether this is sufficient to address the concern. A more useful approach would be to compare sensory response properties of LGN neurons with and without SST activation. This could be done qualitatively by comparing receptive field properties of LGN neurons and the coefficient of variation (which was removed from the previous revision) could be used to support the claim that changes in response fidelity were present at the level of individual neurons and thus that the changes in population decoding were not a consequence of inhomogeneous inhibitory input. In any case, however, it would be worth including this caveat in the discussion.

4. Despite some improvement compared to the previous submission, there is still substantial lack of clarity in the text. Some claims are very difficult to understand from what is written the text (see, for example, the case mentioned in Major Concern 2). The complexity of some claims also appears to make it difficult for the authors to draw specific conclusions in many cases. For instance, after discussing a variety of changes in oscillatory dynamics across several frequency bands during locomotion and non-locomotion produced by bi-directional optogenetic manipulations if nRT sub-populations the authors conclude that "SST nRT neurons are well position to exert powerful effects on the visual input to V1". Moreover, as before, the relationship between oscillatory dynamics and sensory responses of individual neurons is still somewhat unclear. While these challenges could have been mitigated by a careful discussion of the relationship between changes in oscillatory dynamics, firing rates and the relevant neuronal populations in the thalamus and cortex, such a discussion does not seem to have been included in the current manuscript.

https://doi.org/10.7554/eLife.61437.sa1

Author response

Essential revisions:

Claims not well supported by the presented data:

1. The discussion of V1 layer specificity is not supported by the data. On page 6, column 2, line 16: "Visual stimuli evoked the strongest responses in the superficial layers (~layer 2/3) and layer 4 (Figure 2 – S3A, B)." This result is not quantified nor is it evident in the figures. Relatedly, "optogenetic activation of SOM nRT neurons reduced the activity evoked by visual stimuli in these layers (Figure 2 – S3C)." This manipulation reduced the activity in all layers. Comparisons between layers were not formally performed and responses of the shanks shown in S3E differ in their profile. Considering these factors, the appropriate analyses should be performed or the text and related title of the supplemental figure, "Optogenetic activation of SOM neurons in nRT has a stronger effect on neuronal responses in superficial layers in V1," should be changed.

We agree with the reviewer that the manipulation changed the activity in all layers. Therefore, we removed the claim of laminar differences in the text and the Figure legend.

2. While the greatest change was seen in gamma during running, it appears optogenetic activation of SOM neurons in the nRT reduced power across all frequencies whether the mouse was still or running (Figure 3). The authors assert that inhibiting SOM neurons produced a "consistent increase" in both gamma and spiking activity of cells in V1. However, the stats in Figure 5A do not support a significant increase in beta or gamma. Thus, it is unclear why one of the overarching conclusions of the paper is the selective impact on gamma activity.

Figure 3 shows that optogenetic activation of SOM neurons in the nRT reduced power mainly in the gamma range. Also, we have now calculated confidence intervals to show that the strongest change occurred in gamma power. We have clarified this in the text (page 4).

We realized that the nested statistic test (Aarts et al., 2014) is more appropriate for analyzing our dataset. We added a paragraph in the “Experimental Design and Statistical Analysis” section in the Materials and methods to explain this. According to the new statistical analysis, the results in Figure 5A show a significant increase in the gamma power, but not in the other power bands. We have now clarified this in the text and Figure legends (page 6).

3. Page 9, line 17: "presumably because of their strong projections to the dLGN" – why not any of the other changes in V1 already described?

We apologize for lack of clarity. Other changes in V1 can also be explained by nRT SOM projections to the dLGN. We have revised to remove the quoted text to address this concern.

4. "These findings suggest that SOM neurons in nRT can powerfully modulate the encoding ability of neurons in dLGN" – it is unclear how the CV captures encoding ability. Similarly, on page 10, line 15: "determines how accurately visual stimuli are encoded" and page 12 "positioned to control encoding ability" – the authors should be careful about claims about accurate encoding vs the ability to perform an accurate decoding.

We revised the text to address this concern. Variability of responses does limit the encoding ability of sensory neurons. Our analysis of the effect of optogenetic modulation of nRT on dLGN responses has two parts. First, we merely considered one neuron at a time, and computed the variability of its responses to identical stimuli, as indicated by the coefficient of variation (CV). To measure the ability of dLGN responses to sustain decoding of the orientation of the grating stimuli used to study V1, we devised a novel method based on the responses of pairs of dLGN neurons. However, the reviewers have a reasonable point. There is no standard way to measure the decoding of information in the activity of neurons in the dLGN. Any such approach is, of course, subject to criticism. Therefore, we decided to remove this part of the results and the associated parts in the methods section.

5. Effects on LGN activity. The stats presented in Figure 8A indicate that the bidirectional changes in power were not significant. However, the explanation in the text is confusing and also fails to take these stats into account.

We apologize for this inconsistency. We redid the statistical analysis using the nested statistical approach, which is more appropriate for our dataset (see our answer above to comment #2). In Figure 8A, the new analysis shows that indeed the effects of optical stimulation of ChR2- and eNpHR-expressing SOM nRT neurons produce opposite changes in all the frequency bands except in the theta band during running. Please note that the strongest magnitude of difference between ChR2 and eNpHR effects is in the gamma band (confidence intervals for gamma do not overlap with those for theta and beta comparing eNpHR and ChR2 conditions). We revised the figure by adding the new statistical analysis and edited the legend accordingly (page 16).

6. Page 12, line 27: "and which is associated with visual attention," – nothing in this paper elucidates mechanisms of visual attention and this mention should be removed. Similarly, line 40, "leading to a blurred representation of the visual world" is an interesting possible extension of these findings but is not directly supported by the data. Whether the visual world is "blurred" or whether stimuli are not easily decoded from neural activity are not equivalent.

While we have not measured perception behaviorally, the results are consistent with visual attention behavior. We clarified in the text that our study did not assess visual attention directly, but that our findings that the SOM-nRT->dLGN->V1 pathway alters gamma activity suggest a role for the pathway in visual attention because other findings have associated gamma power with attention (Gray et al., 1992; Singer and Gray, 1995; Kreiter and Singer, 1996).

We agree that the wording about SOM nRT neurons leading to a “blurred representation of the visual world” is too speculative for the Results section, so we deleted this wording.

Results requiring further clarification:

1. It would be worthwhile elaborating on the relationships between PV and SOM neurons in the visual sector of nRT. The results in Figure 1 – S1 should be quantified rather than simply showing representative images. Clemente-Perez et al. 2017 does not provide clear evidence that the two groups are mutually exclusive, but rather shows co-expression of PV and SOM in some nRT neurons. The relationship between the labeled neurons in the two Cre-lines should also be clarified. The results from Martinez-Garcia et al. 2020 and Li et al. 2020 should also be integrated into the manuscript.

Thank you for the constructive suggestions. We now elaborate on the relationships between PV and SOM neurons in the nRT (page 3, Results section), and added a new Discussion section on cellular heterogeneity in the nRT (page XX). The results of Figure S1 show the presence of mutually exclusive PV and SOM neurons in the visual sector of the nRT, confirming the findings published in Clemente-Perez et al., 2017, which showed that the PV and SOM neurons in certain sectors of the nRT are exclusive but that a subgroup of neurons shows both markers (see Figure 1 in Clemente-Perez et al., 2017). The two recent manuscripts (Li et al., 2020; Martinez-garcia et al., 2020) which both confirm the cellular heterogeneity in the nRT, are now cited in the manuscript. We also cite Campbell et al., 2020, which showed that the same nRT cells in the visual sector are both SOM and PV positive, although please note that these studies were based on transgenic knockin mice in which transient expression of PV and SOM during early development would cause labeling of the same cell population. In contrast, we used viral labelling, which does not affect precursor cells during development, and which shows the existence of distinct PV and SOM populations of cells in the visual nRT. Not only these cells are distinct, but they also project to distinct visual thalamic nuclei: SOM nRT neurons mainly project to the primary order visual nucleus dLGN, whereas PV nRT neurons mainly project to the higher order visual nucleus LP. Our result cautions against the use of certain transgenic lines if one wants to distinguish these distinct cell populations in the mouse. We have clarified this in the text.

2. Furthermore, there appears to be a substantial population of PV neurons in the visual sector, but it is unclear if these are projection neurons. If so, where do they terminate since visual thalamic nuclei are largely devoid of PV terminals? If they are intrinsic to the nRT, optogenetic stimulation of PV could potentially silence SOM projection neurons and disrupt thalamocortical activity through the LGN. Does optogenetic activation of PV affect LGN activity? How these factors affect the interpretation of the results should be addressed.

There is indeed a population of PV neurons in the visual sector (see Figure 1—figure supplement 1). Please note that all neurons in the nRT (comprising PV and SOM neurons) are projection neurons, meaning that 100% of nRT cells project to the thalamocortical relay nuclei (Pinault et al., 1995; Pinault and Deschênes, 1998). However, we cannot exclude the existence of intra-nRT connections between the projection neurons. Indeed, our Clemente-Perez et al. 2017 study, as well as other studies (Makinson et al., 2017) suggested the existence of such connections. Notably, in Figure 1 and Figure 1—figure supplement 1, we show that PV nRT cells project only weakly to the primary order visual thalamus dLGN but strongly to the higher order visual thalamus LP. We clarified this novel finding in the Results and the Discussion sections (pages 3, 4, 9, and 10).

3. Another, more fundamental, issue with these experiments is the location chosen for injection. Retrograde labelling experiments have suggested that dLGN projecting nRT neurons are located more posterior and dorsal (approx. A/P: -1.6, M/L: +/- 2.0, D/V: -2.4) than the injection site used here. This raises the concern that PV neurons outside the nRT may be labeled.

If the reviewers are concerned that our injections caused opsin expression in PV cells located outside the nRT, this is not the case. Indeed, Figure 1—figure supplement 1 shows that the opsin expression is specific to the nRT. However, we agree that the opsin expression in PV and SOM neurons is in the entire visual sector of the nRT, and not restricted to the visual sector. Nonetheless, although the viral expression may not affect 100% of visual nRT neurons, it has an important advantage compared with transgenic models in that the opsin is only in the nRT (shown in Figure 1—figure supplement 1). Also, please see our reply to comment #7 that points out that PV and SOM cells in mice at the age we studied them are distinct. To address the reviewers’ question as to whether PV and SOM neurons are located in the visual sector of the nRT, we also performed a new experiment: we injected a retrograde tracer (CTB-Alexa) in dLGN and found that SOM but not PV neurons were retrogradely labeled in the visual sector of the nRT. We cannot exclude the existence of PV projections to dLGN, but our results suggest that the projections to dLGN from the visual nRT mainly originate from SOM nRT cells.

Moreover, there is no guarantee that PV and SOM positive populations projecting to LGN are located in the same region of nRT. To clearly differentiate the relevance of PV and SOM nRT neurons for visual processing, retrograde labelling of each population would be important to assess the location that should be targeted. Alternatively, the framing of these issues should be modified. Because the reasoning for comparing PV and SOM populations is not particularly clear, it may be better to de-emphasize this set of results and focus on the impact of activating the SOM population on sensory processing.

Thank you for the suggestion. Based on this comment, we did a new experiment of retrograde labeling of nRT neurons that project to dLGN. Please see our reply to the comment above, which we believe addresses this concern. We now clarify that the main projection from nRT to dLGN originates mainly in SOM nRT neurons, rather than PV neurons. Our results primarily focus on SOM nRT neurons, but we believe that the comparison with PV neurons is very novel and interesting, so we would like to keep these results in the manuscript. However, we edited the text to clarify the location of PV and SOM neurons, and why these would cause distinct effects in V1.

4. For V1 (and LGN) activity, is it possible that a reduction in spike firing can explain the loss of power? What is the relationship between these variables? This issue also comes up in the Discussion section, and it would be important to articulate whether the reduction in spike firing is tied to the loss of power. If these variables are tightly coupled, then the loss of power could simply be a consequence of reduced activity.

We did not find any relationship between these two factors (see Figure 2L). Change in firing rate does not account for much of the variance in gamma power change. We clarify this in the Results section (page 5).

Methods requiring clarification:

1. The statistical test run for each comparison throughout the paper needs to be clearly included. Although the reporting methods form says, " In the main text statistical reporting always directly follows the sentence in which the result is first mentioned, and includes test name, test statistics, exact p-value (when possible)and sample size (n)," this is not the case in the text. Similarly, the reporting form says, " A table has been uploaded with all statistical tests done for figures 2 to 4" but this table does not include Figure 3, and there are many other statistical tests performed throughout the manuscript that should be included. Table 1, and any additional tables that are added, should also include the number of observations for each comparison.

Thank you for this important feedback. To address this concern all of the statistical tests have been redone using the more appropriate nested design (see our reply to comment #2). All details are now noted in the legends and the Table.

2. Furthermore, the manuscript contains statements and conclusions about the magnitude of change. In many instances the authors use inferential statistics to illustrate the magnitude of effects (e.g. "moderate decreases in theta and beta and strong decrease in gamma"). If the magnitude of change is important, the authors should consider using estimation statistics. As it stands, the p-valued based stats do not support qualitative statements about the magnitude of change.

We addressed this concern by providing confidence intervals for these changes (see legends of Figures 3, 5, 8).

3. In some figures, it is difficult to identify what each dot represents, for example, in Figure 9D. It would be useful to specify n values for all figures (not just those included in Table 1) and identify the quantity (i.e. n = X neurons or n = Y pairs) to help the reader to understand what is being shown.

Thank you; this has been done.

4. There is no description in the methods about the acquisition of LFP band and calculation of power, 1/f scaling, etc. Was the LFP band acquired at 20 Hz as well? Was it down-sampled? How was it filtered? Relatedly, is Figure 2L showing power across all bands, and how exactly was the CSD / laminar structure computed?

We added this information in the methods section (page 19).

5. Information theory and the concept of mutual information are not fully introduced in the main text. Similarly, the motivation and caveats of the LDA and deep neural network analyses should be more explicit. Relatedly, it is important to frame the methods description of the mutual information analysis first within information theory (and with the proper citation), because "Neuronal responses are considered informative if they are unexpected," does not make sense taken out of that specific context.

We clarified this theory in the Results section (page 6).

Organization of the manuscript, including motivation for some experiments:

1. It would be helpful to readers to more clearly define the experimental question at the outset and center the organization and flow of the manuscript accordingly. Whereas the focus of the introduction is largely on the role of gamma in visual attention and perception, these concepts are not central to the paper and are never directly tested. Other ideas dominate the current figures: the role of narrow- and broad-spiking cells and the differences in neural activity in specific cell types between moving and stationary. Framing these questions for the reader at the beginning, as well as re-considering the organization of some of the figures and supplementary information, would be very useful. With 9 figures and many supplemental figures, the main message in this paper is easily obscured, and the manuscript would benefit from a tighter framing of this interesting collection of data.

We have improved the framing of the questions at the end of the introduction section (pages 2 and 3).

2. One reason that the different results presented sometimes appear disconnected is that the writing is at times disjointed and lacks transitions. Even in the abstract (abstract lines 14-16) following a sentence describing projections of nRT neurons, the authors immediately jump to a describe "powerful modulation" of sensory encoding and gamma activity without stating what this modulation is or even mentioning that it is produced by SOM-positive nRT neurons. Similar examples occur for many key transitions in different parts of the manuscript (For example: Intro., p. 2, line 1-2, left; Intro., p. 2, line 33-38, left; Results, p. 6, line 1-3, left; Results, p. 7, line 4-12, right; Results, p. 10, line 4-8, right). It would be very important to clarify the reasoning for each of these steps individually and together, so that reader can understand the results.

Thank you for the constructive suggestion. We revised the abstract and the entire manuscript by adding transitions for clarity as suggested.

3. Another example needing clarification is the transition from comparing the impact of SOM and PV manipulations on gamma oscillations to examining the impact on sensory responses in V1 using mutual information (MI) and linear decoding methods. This is a large jump and seems almost the beginning of a separate study. More to the point, the authors do not seem to attempt to relate the observed effects on oscillatory dynamics to their various analysis of sensory encoding in the dorsal lateral geniculate nucleus (dLGN) and visual cortex (V1) beyond a general discussion. To address this issue, it would be important to clearly link changes in sensory encoding and processing with the observed changes in oscillatory dynamics and, ideally, to better describe how optogenetic manipulation of nRT leads to changes in each aspect of sensory processing. Unifying the various observations in this way would substantially strengthen the study and would allow the authors to address their original thesis that gamma oscillations are relevant to sensory processing and that the role of the nRT in "gating" sensory input involves control of these oscillatory dynamics.

Thank you for this telling comment. The reviewers have raised an important point about the link between the oscillatory dynamics and sensory processing. Elucidating this relationship is beyond the scope of this work, and is properly the subject of a theoretical and computational investigation because it may be understood only in the context of a full model of thalamocortical and cortical function, which does not yet exist.

What we have shown is that oscillatory dynamics and sensory processing, as indicated by firing rates and information, covary, and that both are powerfully modulated by the activity of SOM nRT cells. This finding is an important contribution to the development of such a full model.

We have reorganized the paper and clarified the transitions and figure legends.

4. The authors present multiple analysis, including linear decoding, spike triggered averages (STA), measurement of coefficients of variation (CV) and a pairwise correlation based decoding method without discussing how effects observed in one measure relate to other observations.

We now clarify these relationships in the Results (see our reply to comment #4) (page 6).

5. Overall, the Discussion section could be improved with a more in-depth discussion about the following: identity, source, and targeting of SOM and PV neurons in the visual of nRT, the relationship between power and levels of activity and candidate circuits and their degree of independence in modulating V1 activity.

Thank you for this constructive suggestion. We have added a new section in the Discussion (pages 9 and 10) to clarify these points.

6. As touched on in the Discussion, it is not clear how locomotion via VIP neurons and SOM nRT activation contributes independently to activity in V1. Could it be possible that SOM nRT via LGN could regulate VIP neurons in V1? What is the evidence that describes the inputs and outputs of VIP interneurons?

We thank the reviewer for this comment. The major influences on VIP cells have been described in a reference we now cite (Fu et al., 2014, 2015; Zhang et al., 2014) (page 11).

7. The notion that mouse nRT may be suited for switching attention between different sensory modalities is interesting, and the work of the Halassa lab may be worth citing and discussing in the Discussion.

Done. We have added citations from the Halassa lab that address this point (pages 2 and 9).

8. It may be worth discussing the relationship with the perigeniculate nucleus as the visual sector of nRT in carnivores. Is the more caudal part of the carnivore nRT analogous/homologous to the auditory and somatosensory sector of mouse nRT?

We have elaborated the discussion of the carnivore perigeniculate nucleus in relation to the visual sector of the mouse nRT and our findings in the context of recent findings (page 10).

9. The Discussion would benefit from references to specific figures.

Thank you; this has been done.

References:

Aarts E, Verhage M, Veenvliet J V., Dolan C V., Van Der Sluis S (2014) A solution to dependency: Using multilevel analysis to accommodate nested data. Nat Neurosci 17:491–496.Campbell PW, Govindaiah G, Masterson SP, Bickford ME, Guido W (2020) Synaptic properties of the feedback connections from the thalamic reticular nucleus to the dorsal lateral geniculate nucleus. J Neurophysiol:jn.00757.2019.Clemente-Perez A, Makinson SR, Higashikubo B, Brovarney S, Cho FS, Urry A, Holden SS, Wimer M, Dávid C, Fenno LE, Acsády L, Deisseroth K, Paz JT (2017) Distinct Thalamic Reticular Cell Types Differentially Modulate Normal and Pathological Cortical Rhythms. Cell Rep 19:2130–2142.Fu Y, Kaneko M, Tang Y, Alvarez-Buylla A, Stryker MP (2015) A cortical disinhibitory circuit for enhancing adult plasticity. eLife 4:1–12.Fu Y, Tucciarone JM, Espinosa S, Sheng N, Darcy DP, Nicoll RA, Huang ZJ, Stryker MP (2014) A Cortical Circuit for Gain Control by Behavioral State. Cell 156:1139–1152.Gray CM, Engel AK, König P, Singer W (1992) Synchronization of oscillatory neuronal responses in cat striate cortex: Temporal properties. Vis Neurosci 8:337–347.Kreiter A, Singer W (1996) Stimulus-dependent synchronization of neuronal responses in the visual cortex of the awake macaque monkey. J Neurosci 16:2381–2396.Li Y et al. (2020) Distinct subnetworks of the thalamic reticular nucleus. Nature 583:819–824.Makinson CD, Tanaka BS, Sorokin JM, Wong JC, Christian CA, Goldin AL, Escayg A, Huguenard JR (2017) Regulation of Thalamic and Cortical Network Synchrony by Scn8a. Neuron 93:1165-1179.e6.Martinez-garcia RI, Voelcker B, Zaltsman JB, Patrick SL, Stevens TR, Connors BW, Cruikshank SJ (2020) Two dynamically distinct circuits driving inhibition in sensory thalamus. bioRxiv:2020.04.16.044487.Pinault D, Bourassa J, Deschênes M (1995) The Axonal Arborization of Single Thalamic Reticular Neurons in the Somatosensory Thalamus of the Rat. Eur J Neurosci 7:31–40.Pinault D, Deschênes M (1998) Projection and innervation patterns of individual thalamic reticular axons in the thalamus of the adult rat: A three-dimensional, graphic, and morphometric analysis. J Comp Neurol 391:180–203.Singer W, Gray CM (1995) Visual feature integration and the temporal correlation hypothesis. Annu Rev Neurosci 18:555–586.Sokhadze G, Campbell PW, Guido W (2019) Postnatal development of cholinergic input to the thalamic reticular nucleus of the mouse. Eur J Neurosci 49:978–989.Zhang S, Xu M, Kamigaki T, Do JPH, Chang WC, Jenvay S, Miyamichi K, Luo L, Dan Y (2014) Long-range and local circuits for top-down modulation of visual cortex processing. Science (80- ) 345:660–665.

[Editors' note: further revisions were suggested prior to acceptance, as described below.]

The reviewers all agreed that the manuscript was substantially improved in response to the reviewers' comments. However, after consultation among the reviewers, the reviewers agreed that there were six remaining issues to address before publication in eLife.

1. The authors should clarify whether optogenetic inhibition of SST neurons significantly alters gamma power relative to baseline. It seems that inhibiting SST nRT neurons did not significantly increase either gamma or spiking activity relative to baseline, and this could be more clearly acknowledged. Furthermore, there at times seems to be contradictions between the main text and the figures as well as with the response to the reviewers. These contradictions should be resolved in a revised manuscript.

We apologize for lack of clarity. Relative to baseline, while optogenetic inhibition of SST nRT neurons significantly increases single-cell firing rates especially during running, the increase in gamma did not reach significance (see Table S1, Figure 5-S1K). We are now clarifying this in the text (page 6, line 182-186).

2. The authors could report the P values based on the adjusted alpha (0.05/number of comparisons) for Bonferroni corrections.

Thank you for the suggestion. This is done. Now each figure caption includes the p value corrected for multiple comparisons.

3. The heading "Optogenetic activation of SST nRT but not PV nRT neurons diminished encoding ability of BS cells in V1" should be changed to "Optogenetic activation of SST nRT but not PV nRT neurons diminishes encoding ability of both BS and NS cells in V1" as both BS and NS encoding were affected.

Thank you for the suggestion. This is done (page 6, line 189).

4. The authors should further clarify the extent of PV and SST co-expression (see points 4a-4f).

4a. In Figure 1- supplemental figure 1, some images appear to show that PV and SST are mutually exclusive while the CTB experiments show some co-expression. These latter retrograde tracing experiments indicate that PV, SST and co-expressing neurons project to LGN.

As the reviewer noted, PV and SST neurons defined by cre recombinase expression in adulthood can to some extent express the other marker as previously published (Clemente-Perez et al., 2017) and acknowledged throughout our manuscript (see Introduction page 2, Results page 3-4, and Discussion page 9). What is novel in our manuscript is that perturbing Pvalb-Cre and Sst-Cre neurons that express ChR2 (through viral injection) has distinct effects on the V1 cortex, which suggests that the effects on V1 are mediated by distinct neuronal outputs. The significance of the findings of this manuscript concern the functional effects.

The reviewer is also correct that CTB injection in dLGN results in labeling of SST+PV-, SST+PV+ and SST-PV+ neurons. Please note that CTB can be taken up by fibers of passage that pass through the dLGN to other visual nuclei (e.g. LP). Therefore, it is impossible to conclude that all the “retrogradely” labeled cells in nRT project exclusively to dLGN. Our findings do not exclude that some PV nRT neurons may project to dLGN. This is now clarified in the text. Please see page 4, lines 104-113 and copied here for clarity:

“Furthermore, injections of the retrograde tracer cholera-toxin in dLGN resulted in retrograde staining of SST and PV neurons in the visual sector of the nRT (Figure 1—figure supplement 1). […]Retrograde labeling also revealed neurons that co-expressed SST and PV markers consistent with previous work (Clemente-Perez et al., 2017, Figure 1—figure supplement 2).”

4b. The authors should clarify why in Figure 1-supplemental figure 1, there does not appear to be co-localization between ChR2-EYFP and PV IHC in PV-Cre;ChR2-EYFP mice

There are multiple explanations for this:

1) The ChR2-eYFP construct we used is mainly expressed in processes (dendrites and axons) and only poorly in the soma, whereas the antibody against PV strongly labels somata.

2) The antibody does not penetrate through the depth of the brain slice so a z-stack projection fails to show the antibody labeling in many of the cells.

To address this concern, we are now showing one section of a z-stack rather than a z-stack projection of the section. We revised the Figure 1 Supplement 1 for clarity.

4c. The possibility of co-expression should be incorporated into the interpretation of the results.

Thank you for the suggestion. The co-expression is incorporated in the revised manuscript:

Results (page 4, lines 104-113):

“Retrograde labeling also revealed neurons that co-expressed SST and PV markers consistent with previous work (Clemente-Perez et al., 2017, Figure 1—figure supplement 2).” Discussion (page 10, line 315): “Certain cells expressed both markers (Figure 1—figure supplement 1) consistent with previous work (Clemente-Perez et al., 2017).”

We also edited the Discussion section to incorporate these results (page 10, lines 299-304; 316-318; 328-330).

4d. The possibility for interactions between PV and SST neurons in nRT should be incorporated into the authors' interpretation of their results

The possibility of interactions was incorporated in the previous version of the manuscript, see page 12 and 376 in the current version: “These findings are consistent with the possibility that the PV nRT neurons inhibit dLGN interneurons and/or SST nRT neurons, although such connections are yet to be established.”

4e. The reference to Campbell et al. 2020 regarding PV and SST expression in the visual sector of nRT should be eliminated as their comparison was between SST and NeuN

We apologize for incorrectly citing the reference. We eliminated the reference from the sentence.

4f. The figure legend in Figure 1C, D should be changed to SST for consistency. Consider changing SOM to SST throughout (ie. Figure 1—figure supplement 2).

Thank you for the suggestion. This is done.

5. It is difficult to interpret the effects of activation of SST-positive nRT neurons on population decoding and mutual information measures. These effects could simply be due to non-specific inhibition changes produced by activating a random subset of this population introducing an additional source of noise to the sensory signal. While the observation that most single-units recorded in LGN were inhibited may reduce this concern, it is unclear whether this is sufficient to address the concern. A more useful approach would be to compare sensory response properties of LGN neurons with and without SST activation. This could be done qualitatively by comparing receptive field properties of LGN neurons and the coefficient of variation (which was removed from the previous revision) could be used to support the claim that changes in response fidelity were present at the level of individual neurons and thus that the changes in population decoding were not a consequence of inhomogeneous. If the authors choose not to include such an analysis, this caveat should be included explicitly in the discussion.

To address this concern, we have followed the suggestion of the reviewer and now added figure 7—supplementary figure 3 which shows that optogenetic activation of SST neurons increases the variability of responses in dLGN neurons (page 9, line 267-273).

6. There remains some lack of clarity in the text. Some claims are very difficult to understand from what is written (see, for example, the case mentioned in Concern 1). The complexity of some claims also makes it difficult for the authors to draw specific conclusions in many cases. For instance, after discussing a variety of changes in oscillatory dynamics across several frequency bands during locomotion and non-locomotion produced by bi-directional optogenetic manipulations of nRT sub-populations the authors conclude that "SST nRT neurons are well positioned to exert powerful effects on the visual input to V1".

We revised the text to address this concern. Please see page 9, line 280 and copied here for clarity:

“These findings from optogenetic perturbation of SST nRT neurons on dLGN activity reveal that activating nRT neurons powerfully reduces the visual input to V1.”

Moreover, the relationship between oscillatory dynamics and sensory responses of individual neurons is still somewhat unclear. These challenges should be mitigated by a careful discussion of the relationship between changes in oscillatory dynamics, firing rates and the relevant neuronal populations in the thalamus and cortex and further clarification of the language reporting the results in a revised manuscript.

We added this information in the Introduction. Please see page 3, lines 66-71 and copied here for clarity:

“A positive relationship between gamma power and the encoding of memories as assayed by retrieval has been widely reported for many years in the hippocampus and closely related cortical areas (Wang, 2010 and references therein). […] For this reason, we focused our study on the role of specific nRT cell types in thalamocortical visual processing on measurements of both field potentials and the fidelity of encoding of visual information in the spike activity of V1 neurons.”

Reviewer #1:

[…] The authors have comprehensively addressed the feedback of the first submission, and have delivered a much stronger manuscript as a result. I am particularly impressed by the new statistical approach and the additional sections in the methods. As such, I have no additional major suggestions. There are some thoughts on additional behavioral experiments, which I'm sure will come of no surprise to the authors.

I have two remaining concerns about the statistical approach:

1. Why not use the nested approach in Figure 6?

2. There is a mention of Bonferroni corrections in the methods but the reported P-values are still * p < 0.05. Use of a Bonferroni correction means adjusting the alpha – reporting the adjusted alpha (0.05/number of comparisons) would make sense here.

Thank you for these suggestions. We use the nested approach in Figure 6 of the revised manuscript. We also clarified the adjusted alpha for multiple comparisons.

The authors might reconsider the opening of the paper, which largely focuses on gamma oscillations. Although this is indeed one of the main findings of the manuscript, it is not the only finding, and in this reviewer's perspective, this manuscript offers quite a bit by way of understanding the cell types within a previously unknown thalamic nucleus, and also in the mutual information approach. Regardless, the logical progression of the introduction is clear and I can appreciate the lab's prevailing interest in gamma oscillations and their role in visual attention.

We have revised the Introduction to address this concern (page 3, lines 66-71).

One small suggested change: the header "Optogenetic activation of SST nRT but not PV nRT neurons diminishes encoding ability of BS cells in V1" is a bit misleading, because it impacts both BS and NS cells. I suggest, "Optogenetic activation of SST nRT but not PV nRT neurons diminishes encoding ability of both BS and NS cells in V1."

Thank you for the suggestion. This is done (page 6, line 189).

Lastly, the authors have provided "source data" but this is simply a word document of the two tables in the manuscript. I do not see a spreadsheet of source data as is referenced in "Data Availability" statement on the cover sheet. The authors might consider making their data and relevant code available.

This is included.

Reviewer #2:

Many of the concerns raised by the reviewers have been adequately addressed. However, there is still confusion about the exclusivity of PV and SOM neurons in nRT. It is also not clear how such heterogeneity or lack thereof, impact the results and interpretation. The authors state that the two groups are mutually exclusive but that a subgroup "show both markers". Which is it and how does this impact the interpretation of results? The bottom line based on the authors results is to acknowledge anatomically there is sparse co-expression in the visual sector, but functionally SST projecting neurons seem to regulate dLGN activity related to gamma.

We apologize for lack of clarity. We revised the text to clarify the existence of populations that express PV or SST or both markers. We also clarified that the most important result of the study is that opsin expression in Pvalb-Cre and Sst-Cre neurons of the nRT yields distinct results demonstrating that the opsin is expressed in distinct neuronal populations in Pvalb-Cre and Sst-cre mice. Notably, the fact that Sst-cre and Pvalb-Cre cells led to distinct functional effects on V1 cortex demonstrate that the opsin targets distinct cell populations despite the existence of a subgroup that expresses both markers. We clarify that the goal of our manuscript is not to quantify the percentage of cells based on their expression of certain markers, but rather to understand whether Sst-cre and Pvalb-Cre cell populations in the visual nRT have distinct functional effects on V1, similar to what has been shown for the somatosensory sector of the nRT (Clemente-Perez et al., 2017). We edited the text to clarify the goals and the novelty. Please see page 9, lines 298-304 and copied here for clarity:

“SST and PV neurons have been defined by antibody staining of the protein markers, by genetic labeling throughout development, and by the recombinase of activity in adulthood. […] The present study reveals distinct functional effects of Sst-Cre and Pvalb-Cre expressing neurons.”

Other related issues are listed below.

The reference to Campbell et al. 2020 is inaccurate, since in this paper they showed about 80% of neurons in the visual sector co-express SST and NeuN (not SST and PV). There are several instances throughout the paper that mistakenly cite Campbell et al. 2020 as evidence for PV and SST co-expression. This needs to be amended.

We sincerely apologize for this mistake. We addressed this important concern in the revised manuscript.

In the supplemental figure 1, the authors showed with IHC, the labeling of PV in SST-Cre ChR2-EYFP mice. Based on the high-power images it appears that SST and PV are mutually exclusive in the visual sector of nRT (head), but it doesn't appear this was quantified; was there any evidence of co-expression (as asked by one of the reviewers) in the visual sector? CTB experiments seem to reveal some co-expression but from the images it's difficult to evaluate how prevalent.

As the reviewer noted, PV and SST neurons defined by cre recombinase expression in adulthood can to some extent express the other marker as previously published (Clemente-Perez et al., 2017) and acknowledged throughout our manuscript (see Introduction page 2, Results page 3-4, and Discussion page 10). What is novel in our manuscript is that perturbing Pvalb-Cre and Sst-Cre neurons that express ChR2 (through viral injection) has distinct effects on the V1 cortex, which suggests that the effects on V1 are mediated by distinct neuronal outputs. The significance of the findings of this manuscript concern the functional effects.

The reviewer is also correct that CTB injection in dLGN results in labeling of SST+PV-, SST+PV+ and SST-PV+ neurons. Please note that CTB can be taken up by fibers of passage that pass through the dLGN to other visual nuclei (e.g. LP). Therefore, it is impossible to conclude that all the “retrogradely” labeled cells in nRT project exclusively to dLGN. Our findings do not exclude that some PV nRT neurons may project to dLGN. This is now clarified in the text. Please see page 4, lines 104-113 and copied here for clarity:

“Furthermore, injections of the retrograde tracer cholera-toxin in dLGN resulted in retrograde staining of SST and PV neurons in the visual sector of the nRT (Figure 1—figure supplement 1). […] Retrograde labeling also revealed neurons that co-expressed SST and PV markers consistent with previous work (Clemente-Perez et al., 2017, Figure 1—figure supplement 2).”

In the supplemental figure 1, I am puzzled by the lack of co-expression between PV-Cre/ChR2 eYFP and PV IHC. Do the authors have an explanation?

There are multiple explanations for this:

1) The ChR2-eYFP construct we used is mainly expressed in processes (dendrites and axons) and only poorly in the soma, whereas the antibody against PV strongly labels somata.

2) The antibody does not penetrate through the depth of the brain slice so a z-stack projection fails to show the antibody labeling in many of the cells.

To address this concern, we are now showing one section of a z-stack rather than a z-stack projection of the section. We revised the Figure 1 Supplement 1 for clarity.

While the authors show that PV projections largely project to PV and not dLGN, they still failed to address whether intrinsic connections between PV and SOM in nRT could complicate their optogenetic manipulations.

Thank you for the suggestion. The co-expression is incorporated in the revised manuscript:

Results (page 4, lines 104-113): “Retrograde labeling also revealed neurons that co-expressed SST and PV markers consistent with previous work (Clemente-Perez et al., 2017, Figure 1—figure supplement 2).” Discussion (page 10, line 315): “Certain cells expressed both markers (Figure 1—figure supplement 1) consistent with previous work (Clemente-Perez et al., 2017).”

Figure 1 C-D, the bar graphs refer to SOM, for consistency it should be changed to SST (see also figure 2 supplement panels C-E).

Thank you. This is done.

Reviewer #3:

The author's study brings together a set of interesting experiments designed to investigate the role of the inhibitory nucleus reticularis of the thalamus (nRT) in controlling sensory processing in the visual cortex and relate this control to changes in gamma oscillatory dynamics that have been tied to attentional control and state-specific sensory processing. By specifically controlling molecularly defined groups of nRT neurons using optogenetic techniques, they find that somatostatin- (SST-) positive neurons play a distinct role in regulating visual cortical oscillations as well as population encoding across multiple conditions. Although this is a valuable discovery, there are some conceptual questions that remain unanswered. First, it is unclear how to interpret the changes in population decoding observed in V1 following SOM neuron activation. Because the optogenetic approach used would randomly activate a subset of SST neurons, the change in the representation they estimate may simply represent an injection of noise into the signal arising from the non-specific inhibitory input. While their linear decoding approach suggests that the effect is not simply due to reduced spiking, the issue of non-specific inhibition is difficult to exclude based on the findings presented. In addition, while their optogenetic experiments convincingly show that activation of SST-positive nRT neurons has a much stronger effect on cortical activity compared with similar manipulation of parvalbumin- (PV-) positive nRT neurons, the anatomical tracing results they presented leave some uncertainty as to whether this population is the main inhibitory projection from the visual subdivision of the nRT to the primary visual thalamus (the lateral geniculate nucleus, LGN). In particular, without quantification the retrograde tracing shown cannot exclude the possibility that PV neurons also substantially project to the LGN.

We agree and had made this point in the previous version of the manuscript: see page 11: “These findings are consistent with the possibility that the PV nRT neurons inhibit dLGN interneurons”. In the revised manuscript, we clarified 1) the presence of neurons that express both PV and SST markers; 2) the novelty of the study is not a quantification of the percentage of distinct markers in the nRT but the finding that Pvalb-Cre and Sst-Cre neurons have distinct functions and their perturbation affects the V1 cortex differently, and this finding is robust and needs to be taken into consideration when using the different mouse Cre lines for studying the circuitry and function of the nRT.

The reviewer is also correct that CTB injection in dLGN results in labeling of SST+PV-, SST+PV+ and SST-PV+ neurons. Please note that CTB can be taken up by fibers of passage that pass through the dLGN to other visual nuclei (e.g. LP)., Therefore, it is impossible to conclude that all the “retrogradely” labeled cells in nRT project exclusively to dLGN. Our findings do not exclude that some PV nRT neurons may project to dLGN. This is now clarified in the text. Please see page 4, lines 104-113 and copied here for clarity:

“Furthermore, injections of the retrograde tracer cholera-toxin in dLGN resulted in retrograde staining of SST and PV neurons in the visual sector of the nRT (Figure 1—figure supplement 1). […] Retrograde labeling also revealed neurons that co-expressed SST and PV markers consistent with previous work (Clemente-Perez et al., 2017, Figure 1—figure supplement 2).”

Finally, although the authors do show that both gamma oscillations and population encoding are impacted by changes in SST activity, how these changes related to each other remains unclear.

The reviewer is correct about the current state of knowledge. We added this information in the introduction. Please see page 3 and copied here for clarity:

“A positive relationship between gamma power and the encoding of memories as assayed by retrieval has been widely reported for many years in the hippocampus and closely related cortical areas (Wang, 2010 and references therein). […] For this reason, we focused our study on the role of specific nRT cell types in thalamocortical visual processing on measurements of both field potentials and the fidelity of encoding of visual information in the spike activity of V1 neurons.”

While valuable results are presented in the manuscript some technical and conceptual issues remain that complicate the interpretation of these results. Although revisions made to the previous submission have improved the manuscript, particularly by appropriately weakening and/or clarifying some claims, some major concerns still present issues for the overall manuscript which it would be important to address. These concerns are described in detail below:

1. In the previous submission concerns were raised regarding the claim that the majority of neurons projecting from the visual nRT to the LGN are SST-positive, with PV-positive neurons projecting instead to higher-order visual thalamic neurons (Previous Concern 7 and 8) and that the injection site used for the retrograde labelling may not have fully addressed these concerns (Previous concern 9). To address these concerns, the authors performed retrograde labelling experiments using cholera-toxin (CTB-Alexa488) injected into the LGN followed by histological assessment of labelled neurons to determine whether they were PV- or SST- positive. Based on these experiments, it appears that both cell types project to LGN. However, based on their earlier viral tracing experiments, they still conclude that the predominant projection is from SST-positive neurons. While the earlier results do provide qualitative support for this conclusion, it would still be important to have some quantification in order to make the claim that input is "mainly" from SST.

We agree and had made this point in the previous version of the manuscript: see page 11: “These findings are consistent with the possibility that the PV nRT neurons inhibit dLGN interneurons”. In the revised manuscript, we clarified 1) the presence of neurons that express both PV and SST markers; 2) the novelty of the study is not a quantification of the percentage of distinct markers in the nRT but the finding that Pvalb-cre and SST-cre neurons have distinct functions and their perturbation affects the V1 cortex differently, and this finding is robust and needs to be taken into consideration when using the different mouse cre lines for studying the circuitry and function of the nRT.

The reviewer is also correct that CTB injection in dLGN results in labeling of SST+PV-, SST+PV+ and SST-PV+ neurons. Please note that CTB can be taken up by fibers of passage that pass through the dLGN to other visual nuclei (e.g. LP)., Therefore, it is impossible to conclude that all the “retrogradely” labeled cells in nRT project exclusively to dLGN. Our findings do not exclude that some PV nRT neurons may project to dLGN. This is now clarified in the text. Please see page 4, lines 104-113 and copied here for clarity:

“Furthermore, injections of the retrograde tracer cholera-toxin in dLGN resulted in retrograde staining of SST and PV neurons in the visual sector of the nRT (Figure 1—figure supplement 1). […] Retrograde labeling also revealed neurons that co-expressed SST and PV markers consistent with previous work (Clemente-Perez et al., 2017, Figure 1—figure supplement 2).”

2. Previously, a concern was raised regarding the statistical significance of changes in gamma power produced by suppression of SST neurons (Previous concern 2). This remains an important claim for the overall message but, while the authors rebuttal appears to state that additional statistical analysis has clarified this point, this is not at all clear from the text. The rebuttal response refers to Figure 5A which is described in the main text as follows: "We found that inhibiting eNpHR-expressing SST nRT neurons at baseline produced a consistent, but insignificant, increase in both gamma and spiking activity of cells in V1 and a reduction in theta and beta (Figure 5A, Table 2, Figure 5—figure supplement 1, Figure 2-source data 1).…". Based on this, it is very hard to determine whether any significant change occurred (indeed, the change is described as "insignificant"). Moreover, the analysis in the figure itself appears to be comparing inhibition of PV versus SST rather than making any comparison with baseline although it is difficult to be certain due to some overall issues with labelling (see major concern 4). This key point needs substantial clarification in the main text and legend.

We have clarified the basis of statistical comparisons.

3. It is difficult to interpret the effects of activation of SST-positive nRT neurons on population decoding and mutual information measures these effects could simply be due to the fact that non-specific inhibition changes produced by activating a random subset of this population introduce an additional source of noise to the sensory signal. While the observation that most single-units recorded in LGN were inhibited may reduce this concern, it is unclear whether this is sufficient to address the concern. A more useful approach would be to compare sensory response properties of LGN neurons with and without SST activation. This could be done qualitatively by comparing receptive field properties of LGN neurons and the coefficient of variation (which was removed from the previous revision) could be used to support the claim that changes in response fidelity were present at the level of individual neurons and thus that the changes in population decoding were not a consequence of inhomogeneous inhibitory input. In any case, however, it would be worth including this caveat in the discussion.

To address this concern, we have followed the suggestion of the reviewer and now added figure 7—supplementary figure 3 which shows that optogenetic activation of SST neurons increases the variability of responses in dLGN neurons (page 9, line 267-273).

4. Despite some improvement compared to the previous submission, there is still substantial lack of clarity in the text. Some claims are very difficult to understand from what is written the text (see, for example, the case mentioned in Major Concern 2). The complexity of some claims also appears to make it difficult for the authors to draw specific conclusions in many cases. For instance, after discussing a variety of changes in oscillatory dynamics across several frequency bands during locomotion and non-locomotion produced by bi-directional optogenetic manipulations if nRT sub-populations the authors conclude that "SST nRT neurons are well position to exert powerful effects on the visual input to V1". Moreover, as before, the relationship between oscillatory dynamics and sensory responses of individual neurons is still somewhat unclear. While these challenges could have been mitigated by a careful discussion of the relationship between changes in oscillatory dynamics, firing rates and the relevant neuronal populations in the thalamus and cortex, such a discussion does not seem to have been included in the current manuscript.

This comment was addressed above.

https://doi.org/10.7554/eLife.61437.sa2

Article and author information

Author details

  1. Mahmood S Hoseini

    University of California, San Francisco, Department of Physiology, San Francisco, United States
    Contribution
    Conceptualization, Data curation, Software, Formal analysis, Validation, Investigation, Visualization, Methodology, Writing - original draft, Writing - review and editing
    Contributed equally with
    Bryan Higashikubo, Michael P Stryker and Jeanne T Paz
    Competing interests
    No competing interests declared
    ORCID icon "This ORCID iD identifies the author of this article:" 0000-0002-3139-0561
  2. Bryan Higashikubo

    Gladstone Institute of Neurological Disease, San Francisco, United States
    Contribution
    Data curation, Funding acquisition, Validation
    Contributed equally with
    Mahmood S Hoseini, Michael P Stryker and Jeanne T Paz
    Competing interests
    No competing interests declared
  3. Frances S Cho

    1. Gladstone Institute of Neurological Disease, San Francisco, United States
    2. University of California, San Francisco, Neurosciences Graduate Program, San Francisco, United States
    3. University of California, San Francisco, Department of Neurology, San Francisco, United States
    4. Kavli Institute for Fundamental Neuroscience, University of California San Francisco, San Francisco, United States
    Contribution
    Validation, Visualization, Methodology, Writing - review and editing
    Competing interests
    No competing interests declared
    ORCID icon "This ORCID iD identifies the author of this article:" 0000-0002-2576-7801
  4. Andrew H Chang

    1. Gladstone Institute of Neurological Disease, San Francisco, United States
    2. University of California, San Francisco, Department of Neurology, San Francisco, United States
    Contribution
    Validation
    Competing interests
    No competing interests declared
  5. Alexandra Clemente-Perez

    1. Gladstone Institute of Neurological Disease, San Francisco, United States
    2. University of California, San Francisco, Neurosciences Graduate Program, San Francisco, United States
    3. University of California, San Francisco, Department of Neurology, San Francisco, United States
    4. Kavli Institute for Fundamental Neuroscience, University of California San Francisco, San Francisco, United States
    Contribution
    Validation, Investigation
    Competing interests
    No competing interests declared
  6. Irene Lew

    1. Gladstone Institute of Neurological Disease, San Francisco, United States
    2. University of California, San Francisco, Department of Neurology, San Francisco, United States
    Contribution
    Validation, Methodology
    Competing interests
    No competing interests declared
    ORCID icon "This ORCID iD identifies the author of this article:" 0000-0003-0153-1236
  7. Agnieszka Ciesielska

    1. Gladstone Institute of Neurological Disease, San Francisco, United States
    2. University of California, San Francisco, Department of Neurology, San Francisco, United States
    Contribution
    Investigation
    Competing interests
    No competing interests declared
  8. Michael P Stryker

    1. University of California, San Francisco, Department of Physiology, San Francisco, United States
    2. University of California, San Francisco, Neurosciences Graduate Program, San Francisco, United States
    3. Kavli Institute for Fundamental Neuroscience, University of California San Francisco, San Francisco, United States
    Contribution
    Conceptualization, Resources, Supervision, Funding acquisition, Writing - original draft, Writing - review and editing
    Contributed equally with
    Mahmood S Hoseini, Bryan Higashikubo and Jeanne T Paz
    Competing interests
    No competing interests declared
    ORCID icon "This ORCID iD identifies the author of this article:" 0000-0003-1546-5831
  9. Jeanne T Paz

    1. Gladstone Institute of Neurological Disease, San Francisco, United States
    2. University of California, San Francisco, Neurosciences Graduate Program, San Francisco, United States
    3. University of California, San Francisco, Department of Neurology, San Francisco, United States
    4. Kavli Institute for Fundamental Neuroscience, University of California San Francisco, San Francisco, United States
    Contribution
    Conceptualization, Resources, Supervision, Funding acquisition, Validation, Investigation, Methodology, Writing - original draft, Writing - review and editing
    Contributed equally with
    Mahmood S Hoseini, Bryan Higashikubo and Michael P Stryker
    For correspondence
    jeanne.paz@gladstone.ucsf.edu
    Competing interests
    No competing interests declared
    ORCID icon "This ORCID iD identifies the author of this article:" 0000-0001-6339-8130

Funding

National Institute of Neurological Disorders and Stroke (R01NS096369)

  • Jeanne T Paz

National Science Foundation (1822598)

  • Michael P Stryker

National Institute for Health Research (EY025174)

  • Michael P Stryker

American Epilepsy Society

  • Bryan Higashikubo

National Institute of Neurological Disorders and Stroke (F31NA111819)

  • Frances S Cho

Gladstone Institutes

  • Jeanne T Paz

DOD (EP150038)

  • Jeanne T Paz

National Science Foundation (1608236)

  • Jeanne T Paz

National Institutes of Health (R01EY002874)

  • Michael P Stryker

Research to Prevent Blindness (Disney Award for Amblyopia Research)

  • Michael P Stryker

National Center for Research Resources (C06 RR018928)

  • Michael P Stryker

The funders had no role in study design, data collection and interpretation, or the decision to submit the work for publication.

Acknowledgements

JTP is supported by NIH/NINDS grant R01NS096369, Gladstone Institutes, the Kavli Institute for Fundamental, DoD (EP150038), and NSF award #1608236. MSH is supported by NSF award 1822598 and by NIH grant R01EY025174. BH is supported by the American Epilepsy Society Postdoctoral Research Fellowship. MPS is supported by NIH grants R01EY002874 and R01EY025174. MPS is a recipient of the Disney Award for Amblyopia Research from Research to Prevent Blindness. AHC is supported by the Berkelhammer award. FSC is supported by the National Science Foundation Graduate Research Fellowship and the National Research Service Award Fellowship (NRSA, NINDS). ACP is supported by National Science Foundation Graduate Research Fellowship awards #1650113. This work was also supported by an NIH/NCRR grant (C06 RR018928) to Gladstone Institutes. We thank Marie Burkart and Stephanie Holden for assistance with immunohistology, and Meredith Calvert of Gladstone Histology and Light Microscopy Core for help with confocal microscopy. We also thank Kathryn Claiborn for critical feedback on our manuscript.

Ethics

Animal experimentation: We performed all experiments in compliance with protocols approved by the Institutional Animal Care and Use Committees at the University of California, San Francisco and Gladstone Institutes (protocol numbers AN180588-02C and AN174396-03E). Precautions were taken to minimize stress and the number of animals used in all experiments. We followed the NIH guidelines for rigor and reproducibility of the research.

Senior Editor

  1. Laura L Colgin, University of Texas at Austin, United States

Reviewing Editor

  1. Solange P Brown, Johns Hopkins University, United States

Reviewer

  1. Ashley L Juavinett, University of California, San Diego, United States

Version history

  1. Received: July 25, 2020
  2. Accepted: April 11, 2021
  3. Accepted Manuscript published: April 12, 2021 (version 1)
  4. Version of Record published: April 23, 2021 (version 2)

Copyright

© 2021, Hoseini et al.

This article is distributed under the terms of the Creative Commons Attribution License, which permits unrestricted use and redistribution provided that the original author and source are credited.

Metrics

  • 2,631
    Page views
  • 370
    Downloads
  • 3
    Citations

Article citation count generated by polling the highest count across the following sources: Crossref, PubMed Central, Scopus.

Download links

A two-part list of links to download the article, or parts of the article, in various formats.

Downloads (link to download the article as PDF)

Open citations (links to open the citations from this article in various online reference manager services)

Cite this article (links to download the citations from this article in formats compatible with various reference manager tools)

  1. Mahmood S Hoseini
  2. Bryan Higashikubo
  3. Frances S Cho
  4. Andrew H Chang
  5. Alexandra Clemente-Perez
  6. Irene Lew
  7. Agnieszka Ciesielska
  8. Michael P Stryker
  9. Jeanne T Paz
(2021)
Gamma rhythms and visual information in mouse V1 specifically modulated by somatostatin+ neurons in reticular thalamus
eLife 10:e61437.
https://doi.org/10.7554/eLife.61437

Further reading

    1. Cell Biology
    2. Neuroscience
    Elisabeth Jongsma, Anita Goyala ... Collin Yvès Ewald
    Research Article Updated

    The amyloid beta (Aβ) plaques found in Alzheimer’s disease (AD) patients’ brains contain collagens and are embedded extracellularly. Several collagens have been proposed to influence Aβ aggregate formation, yet their role in clearance is unknown. To investigate the potential role of collagens in forming and clearance of extracellular aggregates in vivo, we created a transgenic Caenorhabditis elegans strain that expresses and secretes human Aβ1-42. This secreted Aβ forms aggregates in two distinct places within the extracellular matrix. In a screen for extracellular human Aβ aggregation regulators, we identified different collagens to ameliorate or potentiate Aβ aggregation. We show that a disintegrin and metalloprotease a disintegrin and metalloprotease 2 (ADM-2), an ortholog of ADAM9, reduces the load of extracellular Aβ aggregates. ADM-2 is required and sufficient to remove the extracellular Aβ aggregates. Thus, we provide in vivo evidence of collagens essential for aggregate formation and metalloprotease participating in extracellular Aβ aggregate removal.

    1. Computational and Systems Biology
    2. Neuroscience
    Marjorie Xie, Samuel P Muscinelli ... Ashok Litwin-Kumar
    Research Article Updated

    The cerebellar granule cell layer has inspired numerous theoretical models of neural representations that support learned behaviors, beginning with the work of Marr and Albus. In these models, granule cells form a sparse, combinatorial encoding of diverse sensorimotor inputs. Such sparse representations are optimal for learning to discriminate random stimuli. However, recent observations of dense, low-dimensional activity across granule cells have called into question the role of sparse coding in these neurons. Here, we generalize theories of cerebellar learning to determine the optimal granule cell representation for tasks beyond random stimulus discrimination, including continuous input-output transformations as required for smooth motor control. We show that for such tasks, the optimal granule cell representation is substantially denser than predicted by classical theories. Our results provide a general theory of learning in cerebellum-like systems and suggest that optimal cerebellar representations are task-dependent.