Gamma rhythms and visual information in mouse V1 specifically modulated by somatostatin+ neurons in reticular thalamus
- University of California, San Francisco, Department of Physiology, United States
- Gladstone Institute of Neurological Disease, United States
- University of California, San Francisco, Neurosciences Graduate Program, United States
- University of California, San Francisco, Department of Neurology, United States
- Kavli Institute for Fundamental Neuroscience, University of California San Francisco, United States
Figures
Figure 1 with 2 supplements
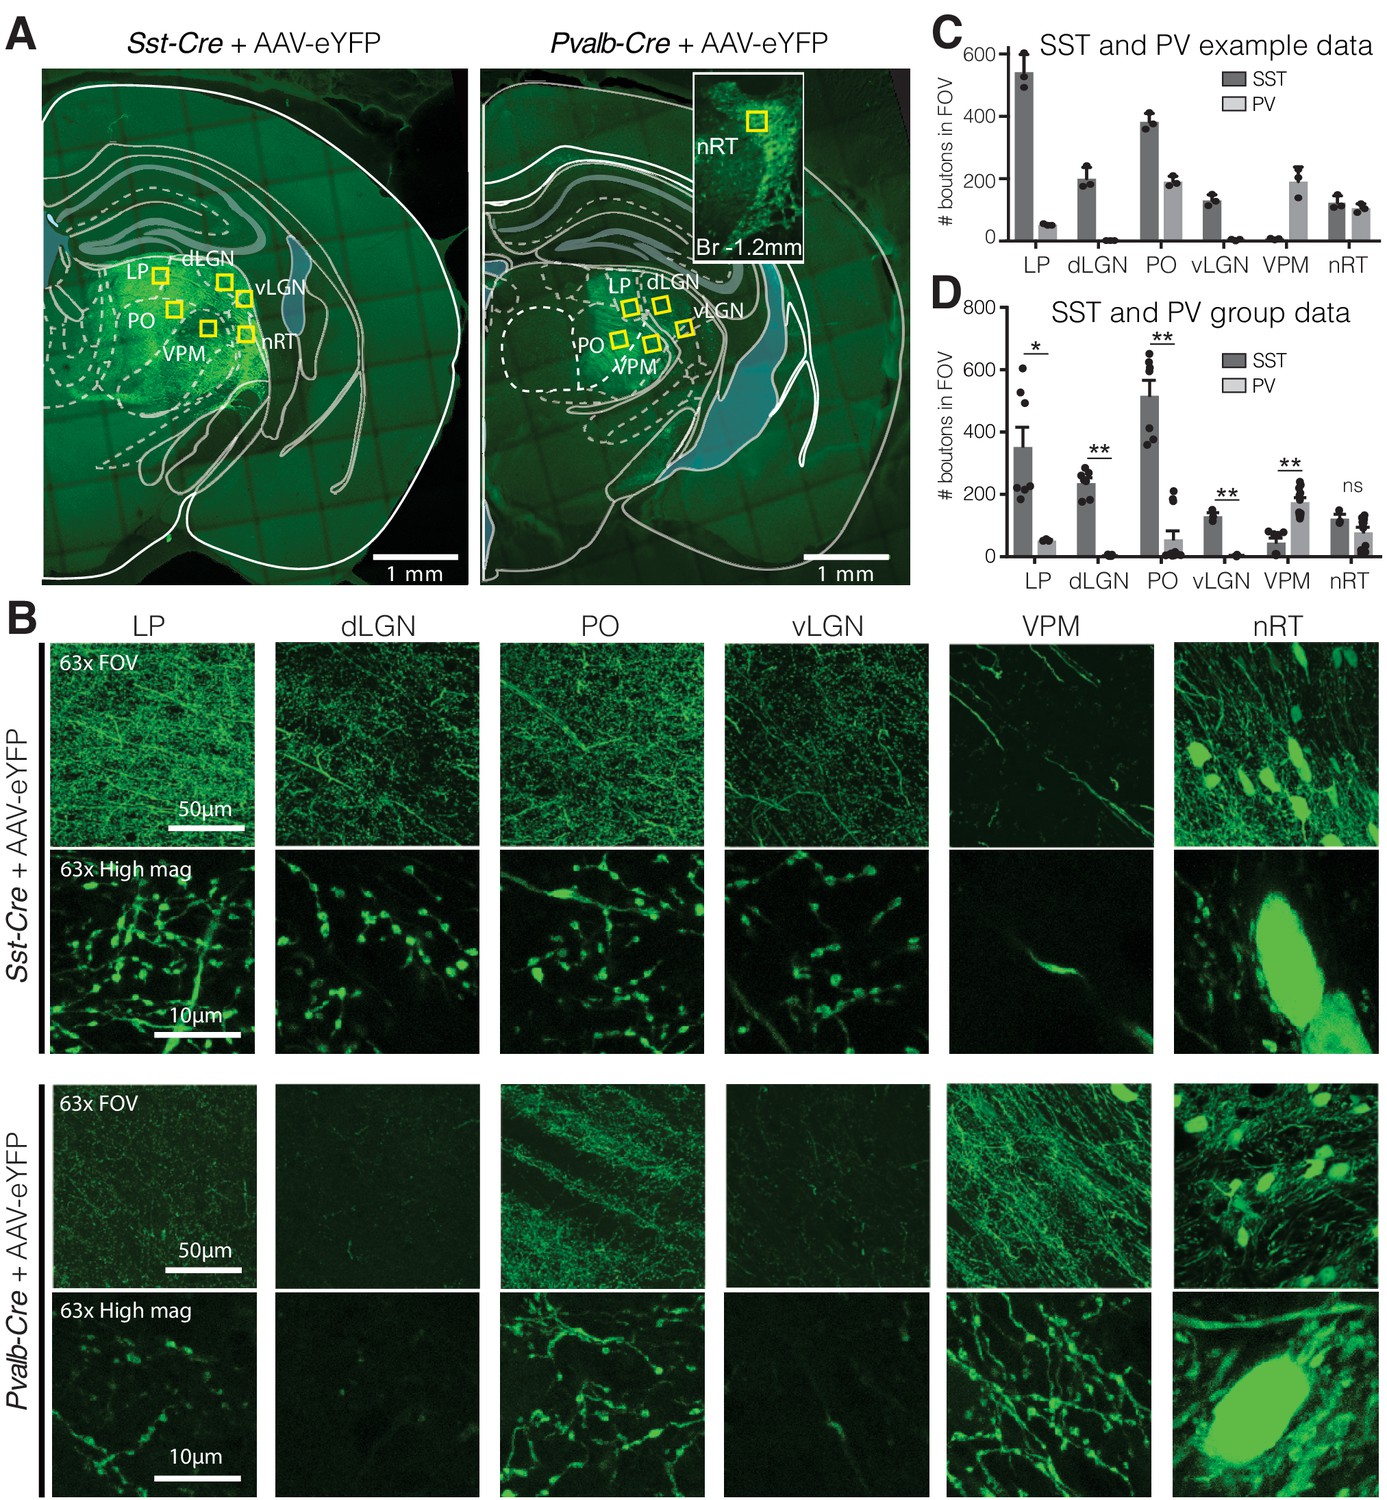
Visual relay thalamic nuclei are preferentially targeted by somatostatin (SST) and not parvalbumin (PV) GABAergic neurons from nucleus reticularis thalami (nRT).
(A) Representative example sections of Sst-Cre and Pvalb-Cre mice after injection of floxed AAV in nRT, which results in enhanced yellow fluorescent protein (eYFP) expression in cell bodies and projections of SST or PV neurons, respectively. Yellow boxes indicate locations chosen for 63× confocal imaging and putative bouton quantification. Inset: nRT injection site as seen in an adjacent section. (B) 63× confocal images showing the entire field of view (FOV) and a zoomed cropped region (‘High mag’) to show details of axonal boutons and nRT somata. LP: lateral posterior nucleus; dLGN: dorsal lateral geniculate nucleus; PO: posterior medial nucleus; vLGN: ventral lateral geniculate nucleus; VPM: ventroposteromedial nucleus. The expression of the viral constructs in different brain regions was confirmed using the mouse brain atlas (Paxinos and Franklin, 2001). (C) Number of eYFP-labeled boutons present in thalamic nuclei of representative mice shown in (A). Data taken from three consecutive sections from each mouse. (D) Number of eYFP-labeled boutons present in thalamic nuclei of all mice imaged (n = 2 Sst-Cre, 3 Pvalb-Cre, 3–4 sections per mouse). Differences are significant between genotypes for all regions except for nRT after correction for multiple comparisons. *p<0.05, **p<0.01.
Figure 1—figure supplement 1
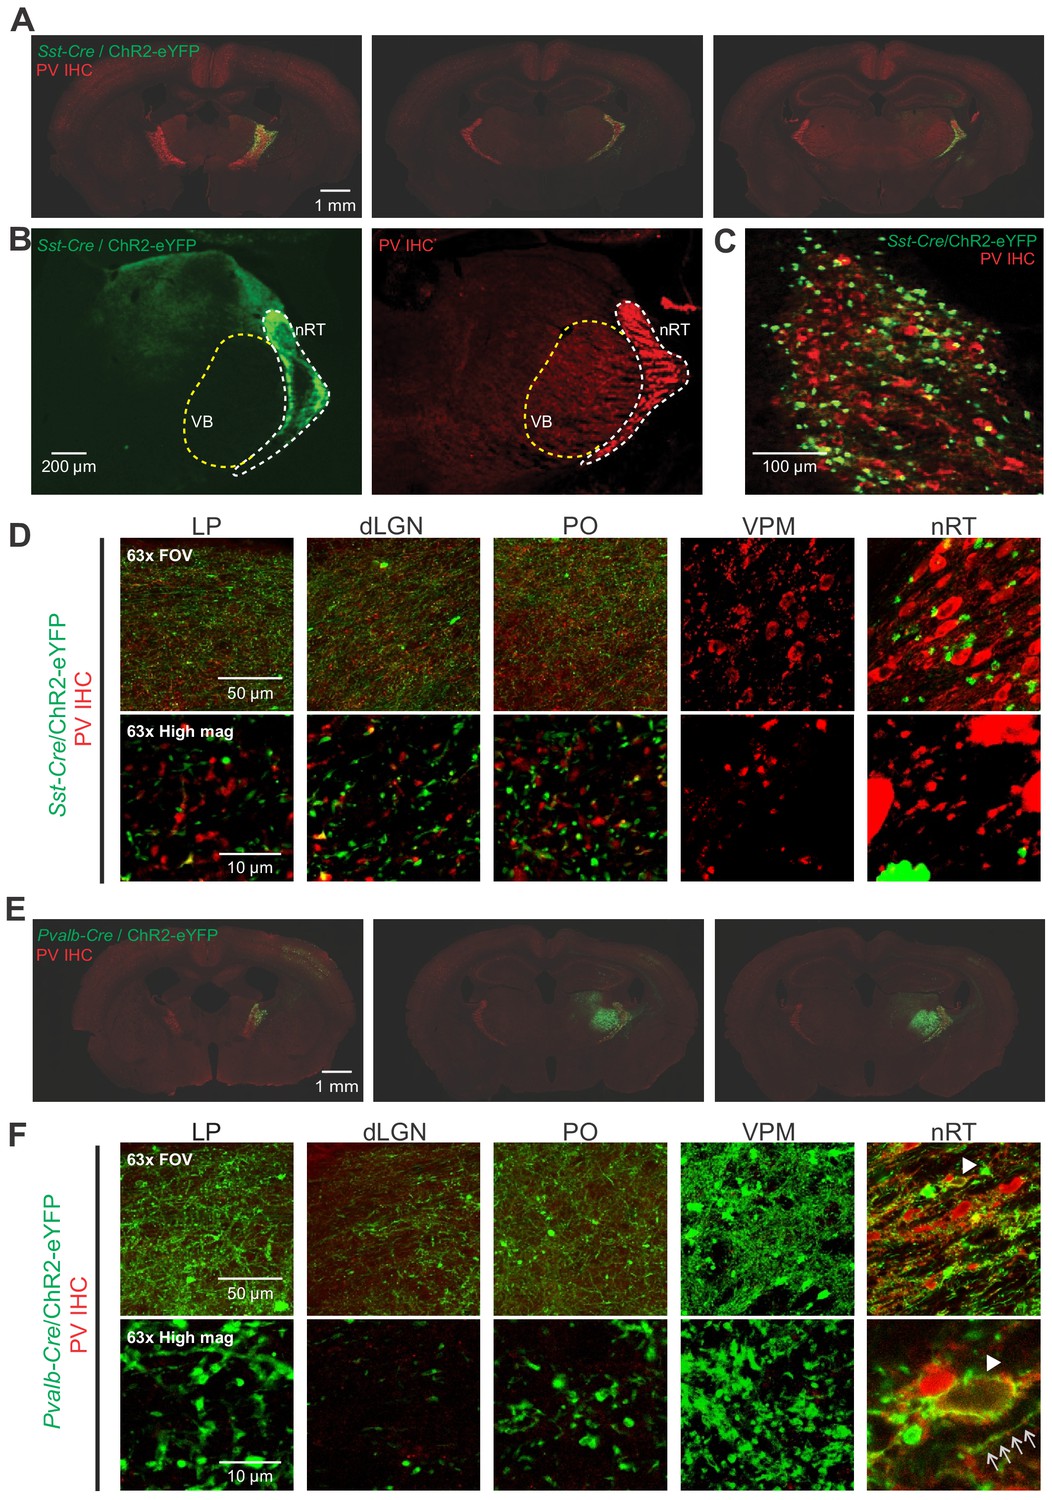
Opsin expression in Sst-Cre and Pvalb-Cre mice.
(A) Representative composite images (individual images, 10×) of coronal brain sections from Sst-Cre mice labeled with parvalbumin (PV) antibody (red). The sections span anterior, middle, and posterior portions of the nucleus reticularis thalami (nRT) and were obtained 4–6 weeks after an intra-nRT injection of an AAV virus containing ChR2-enhanced yellow fluorescent protein (eYFP) targeting Sst-Cre cells in nRT. (B) Representative composite images (individual images, 10×) of coronal brain sections from Sst-Cre mice labeled with PV antibody (red). The sections were obtained 4–6 weeks after an intra-nRT injection of an AAV virus containing ChR2-eYFP targeting Sst-Cre cells in nRT. Note dense axonal projections from PV nRT cells to the somatosensory ventrobasal thalamus (VB), but not to dorsal lateral geniculate nucleus (dLGN), and the opposite for somatostatin (SST) nRT cells. (C) A high magnification image showing that both PV (red) and SST (green) neurons are present in the visual sector of the nRT. The results are representative of six mice out of six from each group. (D) 63× confocal images showing the entire field of view (FOV) and a zoomed cropped region (‘High mag’) to show details of axonal boutons and nRT somata. Each channel is obtained from the maximal intensity projection of a 30 μm z-stack (5 μm intervals). . The expression of the viral constructs in different brain regions was confirmed using the mouse brain atlas (Paxinos and Franklin, 2001). (E) Same as (A) but for Pvalb-Cre mice. (F) Same as (D) but for Pvalb-Cre mice. Arrows indicate co-localization of the PV antibody staining (red) and opsin expression (green). nRT confocal image is presented as a single z-stack for clarity.
Figure 1—figure supplement 2
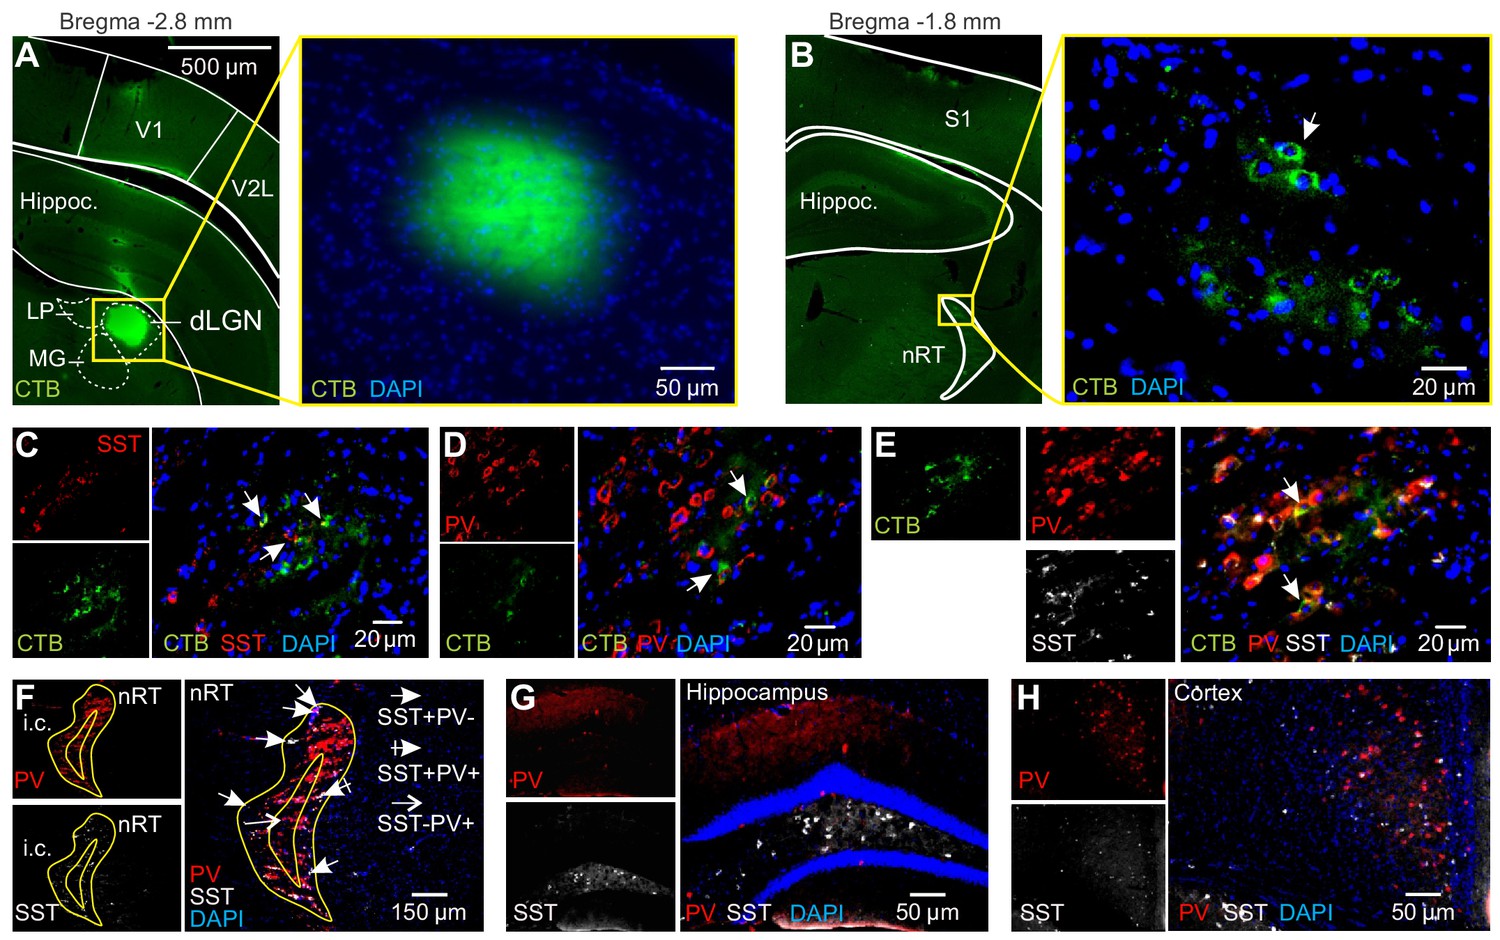
Retrograde labeling of nucleus reticularis thalami (nRT) neurons via intra-dorsal lateral geniculate nucleus (dLGN) injection of CTB-Alexa Fluor 488.
(A) Fluorescence image of a coronal section showing CTB-Alexa Fluor 488 fluorescence in the injection site in dLGN. Note that the presence of CTB-Alexa Fluor 488 was focal in dLGN and no diffusion into neighboring regions. (B) Fluorescence image of a coronal section showing CTB-Alexa Fluor 488 fluorescence in the retrogradely labeled visual sector of the nRT. Arrows indicate retrogradely labeled cells in the nRT. (C) Coronal section from the retrogradely labeled region of nRT stained by rabbit polyclonal anti-somatostatin (anti-SST, 1:1000, Peninsula Laboratories) and a secondary anti-rabbit Alexa Fluor 594 (1:1000). Arrows indicate examples of cells that showed co-localization of SST and CTB-Alexa488 (CTB). (D) Coronal section from the retrogradely labeled region of nRT stained by rabbit antiserum against parvalbumin (PV, 1:1000, Swant) and a secondary antibody anti-rabbit Alexa Fluor 594 (1:1000). Arrows indicate examples of cells that showed co-localization of PV and CTB-Alexa488 (CTB). (E) Coronal section from the retrogradely labeled region of nRT stained by mouse monoclonal anti-PV 1:500 (Swant); secondary anti-mouse Alexa Fluor 555 (1:1000) and by rabbit polyclonal anti-SST -14; 1:1000 (Peninsula Laboratories), secondary anti-rabbit Alexa Fluor 647. Double staining revealed that the retrogradely labeled region of the nRT contains PV and SST neurons. (F–H) Coronal sections using the same triple fluorescence protocol as in (E) show the typical pattern of PV-positive and SST-positive neurons in the nRT (F), hippocampus (G), and neocortex (H). Note the presence of PV and SST staining in the visual sector of the nRT, as well as the distinct staining of PV and SST throughout the nRT: PV neurons are located throughout the entire nRT, while SST neurons are mainly in the outside 'shell' region.
Figure 2 with 3 supplements
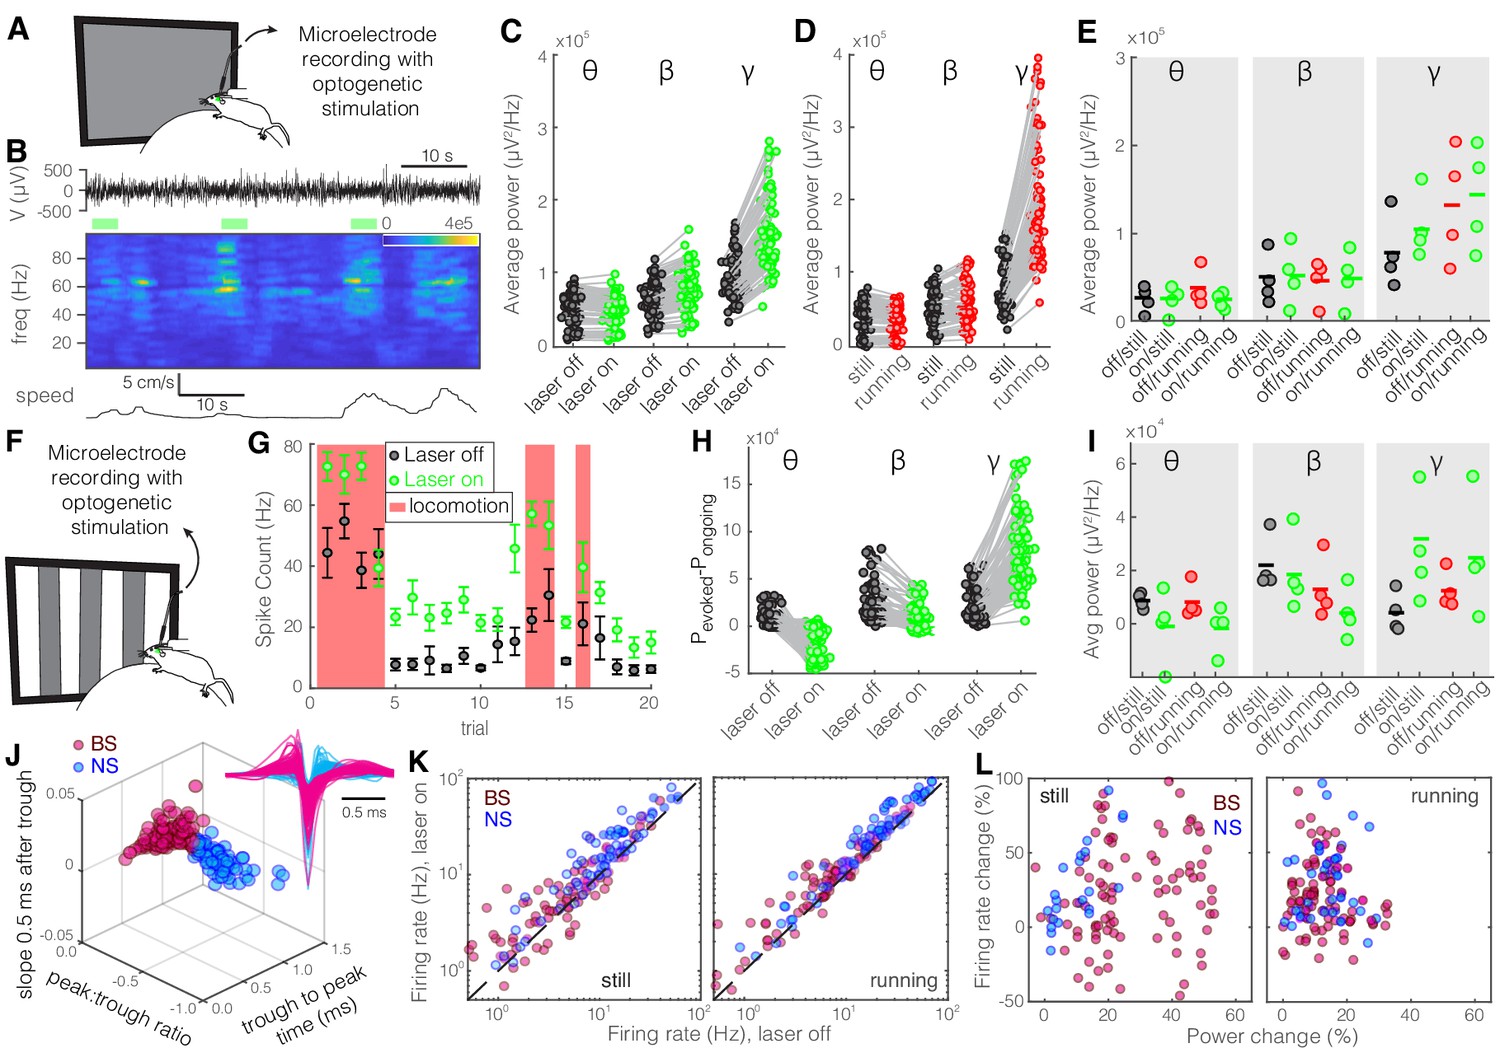
Optogenetic activation of somatostatin (SST) nucleus reticularis thalami (nRT) neurons reduces gamma activity in the primary visual cortex (V1) both with and without visual stimulation.
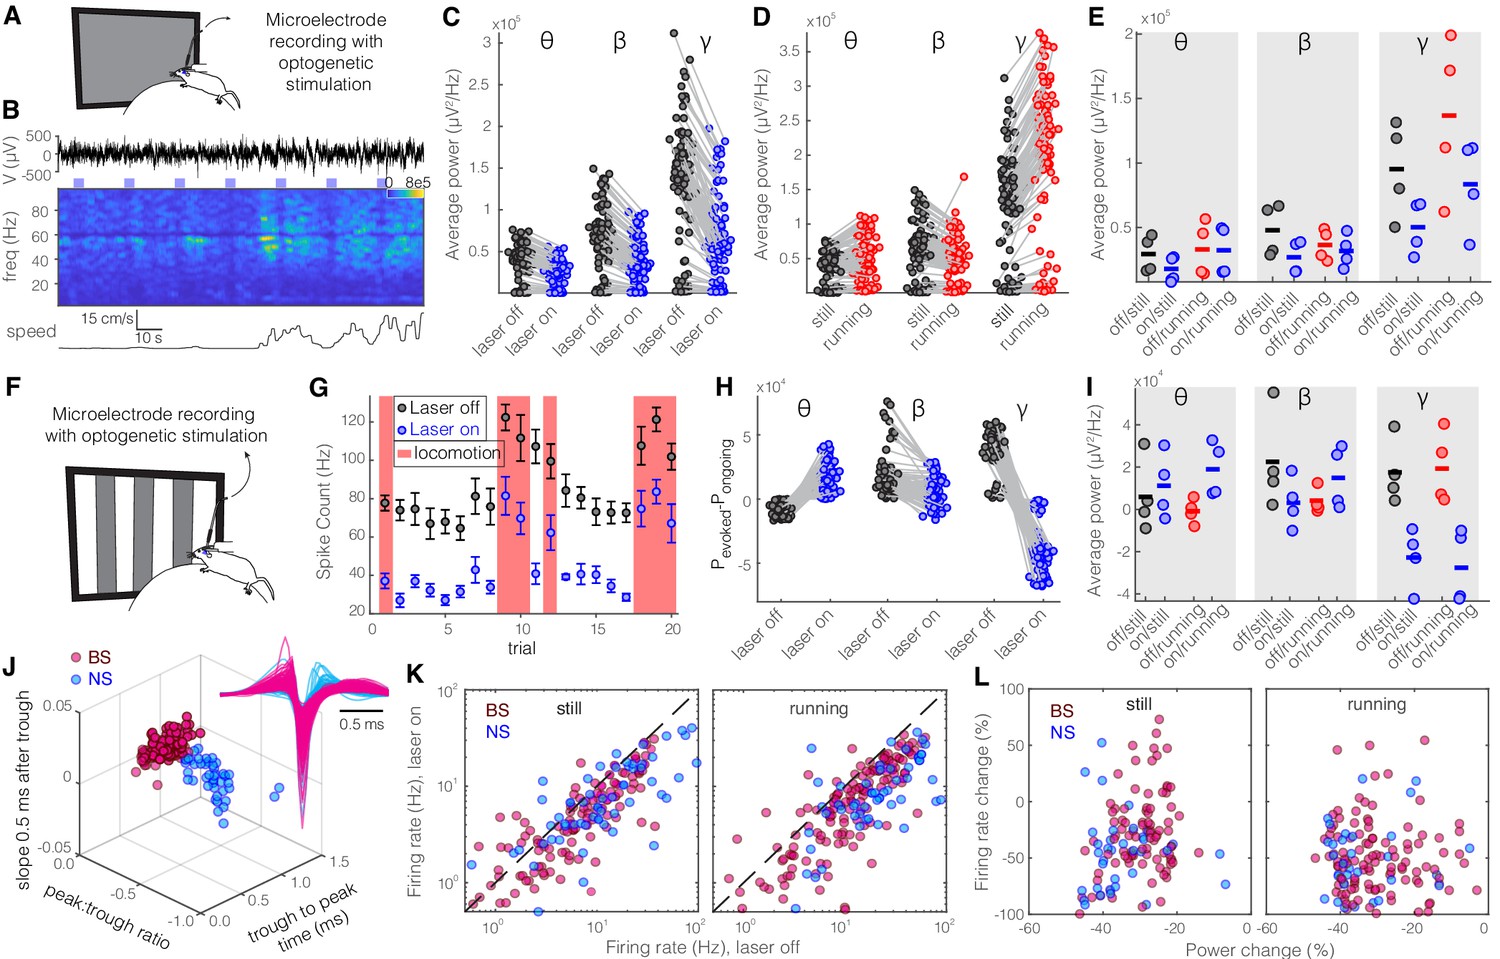
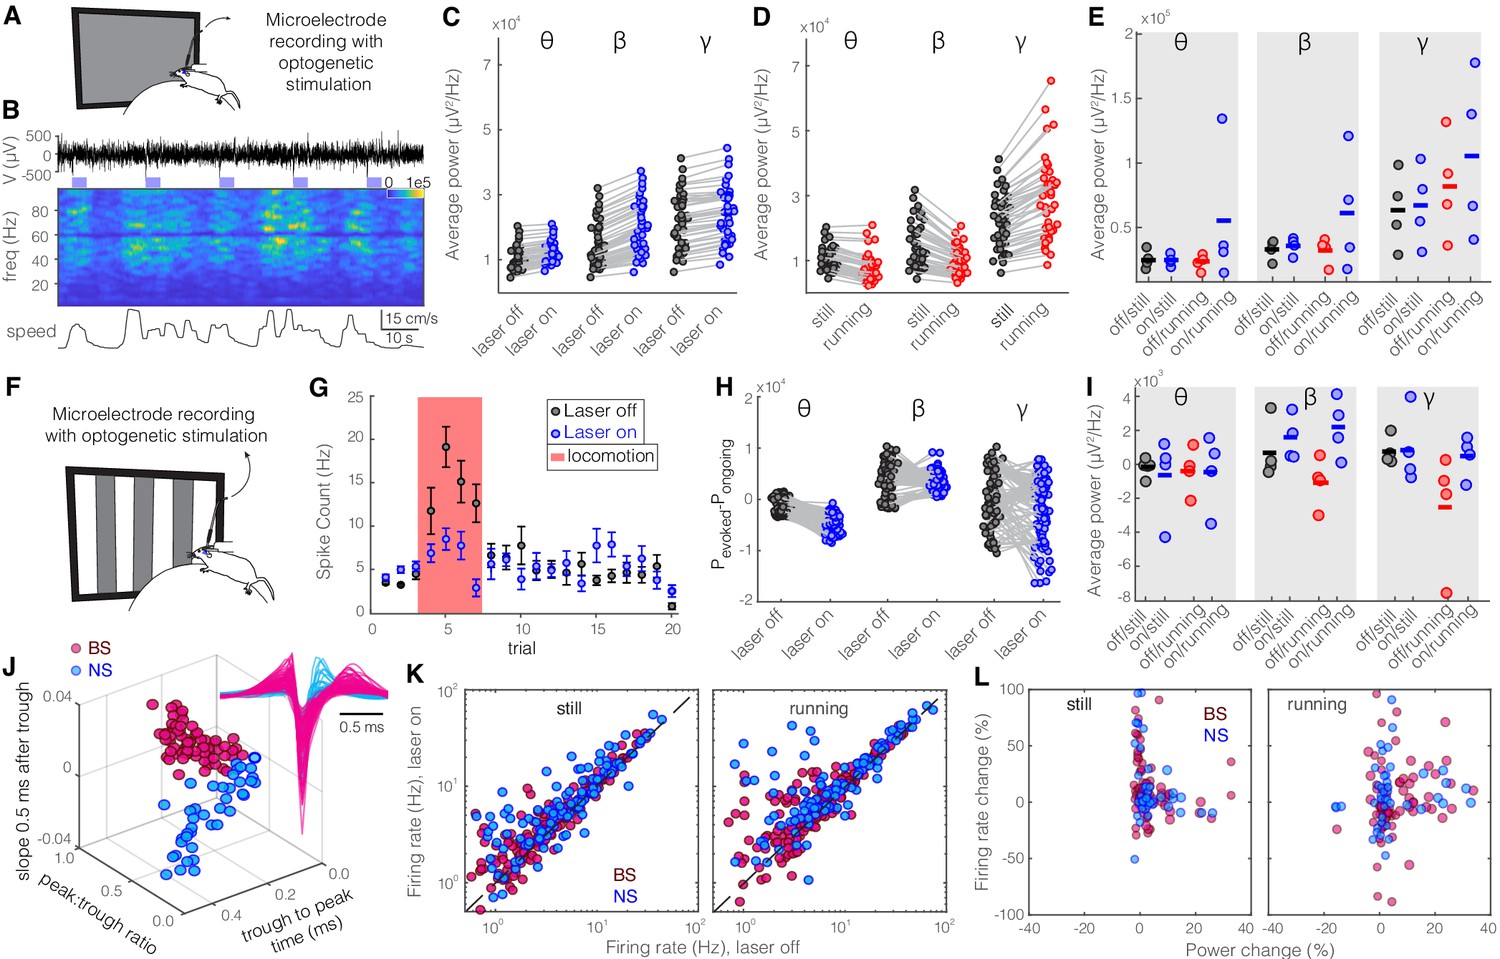
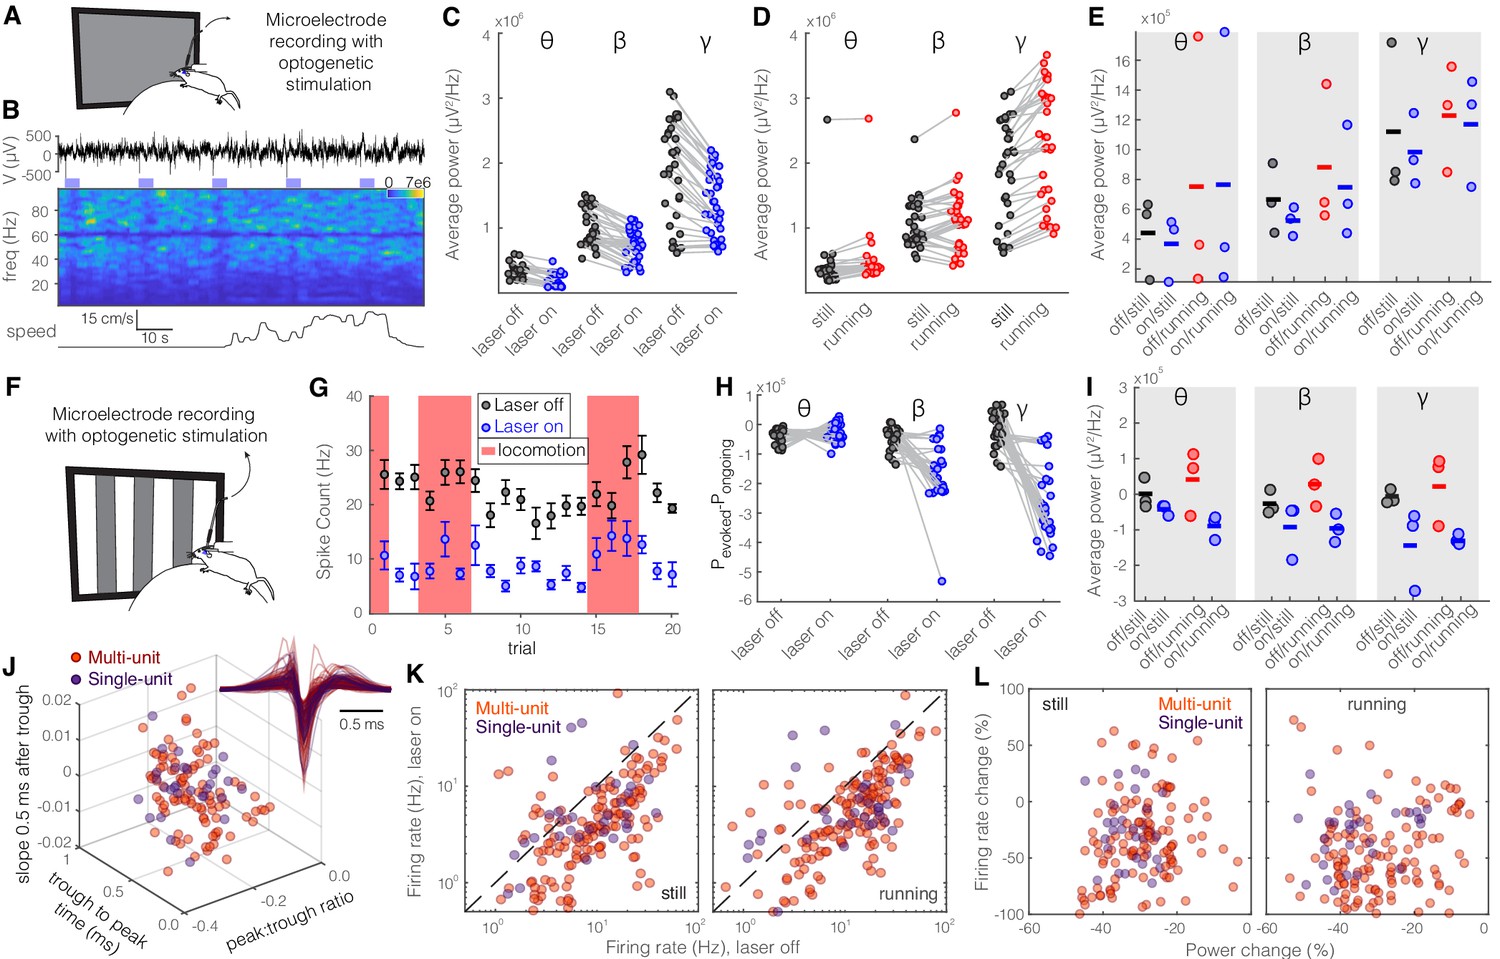
(A) Neural activity was recorded from V1 in freely moving mice. Mice were presented with a gray blank screen while a blue light (473 nm, ~63 mW/mm2) was delivered to Channelrhodopsin-2 (ChR2)-expressing SST cells in nRT using an optical fiber implanted above the nRT. Mouse movement was tracked over the course of the experiment. (B) Representative extracellular raw voltage trace is shown along with its power spectrum. Blue shading areas indicate optogenetic activation. Mouse movement speed is shown at the bottom. Note that optogenetic activation of SST cells in nRT reduced the power of local field potentials (LFPs) regardless of the locomotion state of the animal. (C) Optogenetic stimulations at baseline: across-trial average power of all channels in the absence (black) and presence (blue) of optogenetic activation in one representative mouse shows significant decreases across theta (4–8 Hz), beta (15–30 Hz), and gamma bands (30–80 Hz) (see Table 1 for statistics). (D) Effect of locomotion without optogenetic stimulations: across-trial average power of all channels in one representative mouse indicates that locomotion has no significant effect on theta power, significantly reduces beta power, while causing a strong enhancement in gamma power (Table 1). (E) Effect of optogenetic stimulations in still and running conditions: average power across all channels in four mice shows that optogenetic activation of SST nRT cells selectively reduces gamma power both in the still (black vs. blue marks) and running conditions (red vs. blue marks) (Table 1), and has no significant effect on theta and beta powers from four mice. (F) Visual responses were recorded while mice were presented with moving gratings (eight directions, each moving in one of two possible directions; 2 s duration; randomly interleaved with optogenetic stimulation) in the visual field contralateral to the recording site. (G) Firing rate (averaged over all eight drifting directions) of an example cell during the course of the experiment. Black marks: visual responses when the laser is off; blue marks: visual responses when visual stimuli and optogenetic activation of SST nRT cells are coupled. Red shadings: locomotion state. Error bars: SEM. (H) Effect of visual stimulation with and without optogenetic manipulation: stimulus-evoked (average over all 20 trials) minus ongoing power of all channels when the laser is off (black circles) versus the laser-on condition (blue circles) in one representative mouse indicates a significant shift across all frequencies (Table 1). (I) Same as in (E) in the presence of visual stimulus (Table 1). Note that optogenetic activation of SST nRT cells selectively reduces gamma power in both still and running conditions, without significant effects on the other frequency bands. (J) Using three parameters calculated from average waveforms, cells were classified into narrow- (NS, cyan) or broad- (BS, magenta) spiking (height of the positive peak relative to the negative trough: −0.20 ± 0.01, –0.34 ± 0.02 [p=1.02e-9, Wilcoxon rank-sum test]; the time from the negative trough to the peak: 0.73 ± 0.02, 0.32 ± 0.02 ms [p=3.9e-33], slope of the waveform 0.5 ms after the negative trough: 0.01 ± 0.00, –0.01 ± 0.00 [p=5.94e-35], BS [n = 169], and NS [n = 73] cells, respectively). Subplot: average spike waveforms for all units, aligned to minimum, demonstrating BS (magenta) and NS (cyan) cells. (K) Optogenetic light significantly reduced firing rate of BS (magenta) and NS (cyan) cells during visual stimulus in both still and running conditions (Table 1). (L) Percentage change in visually evoked firing rate of both cell types versus percentage change of power in channels that each cell is recorded from for still and running states (Table 1, Spearman’s rho and p: 0.05, 0.58 BS and still [n = 100 BS in four mice]; −0.12, 0.22 BS and running; 0.19, 0.29 NS and still [n = 32 NS in four mice]; 0.05, 0.77 NS and running).
-
Figure 2—source data 1
Results of significance testing accross different conditions.
- https://cdn.elifesciences.org/articles/61437/elife-61437-fig2-data1-v2.docx
Figure 2—figure supplement 1
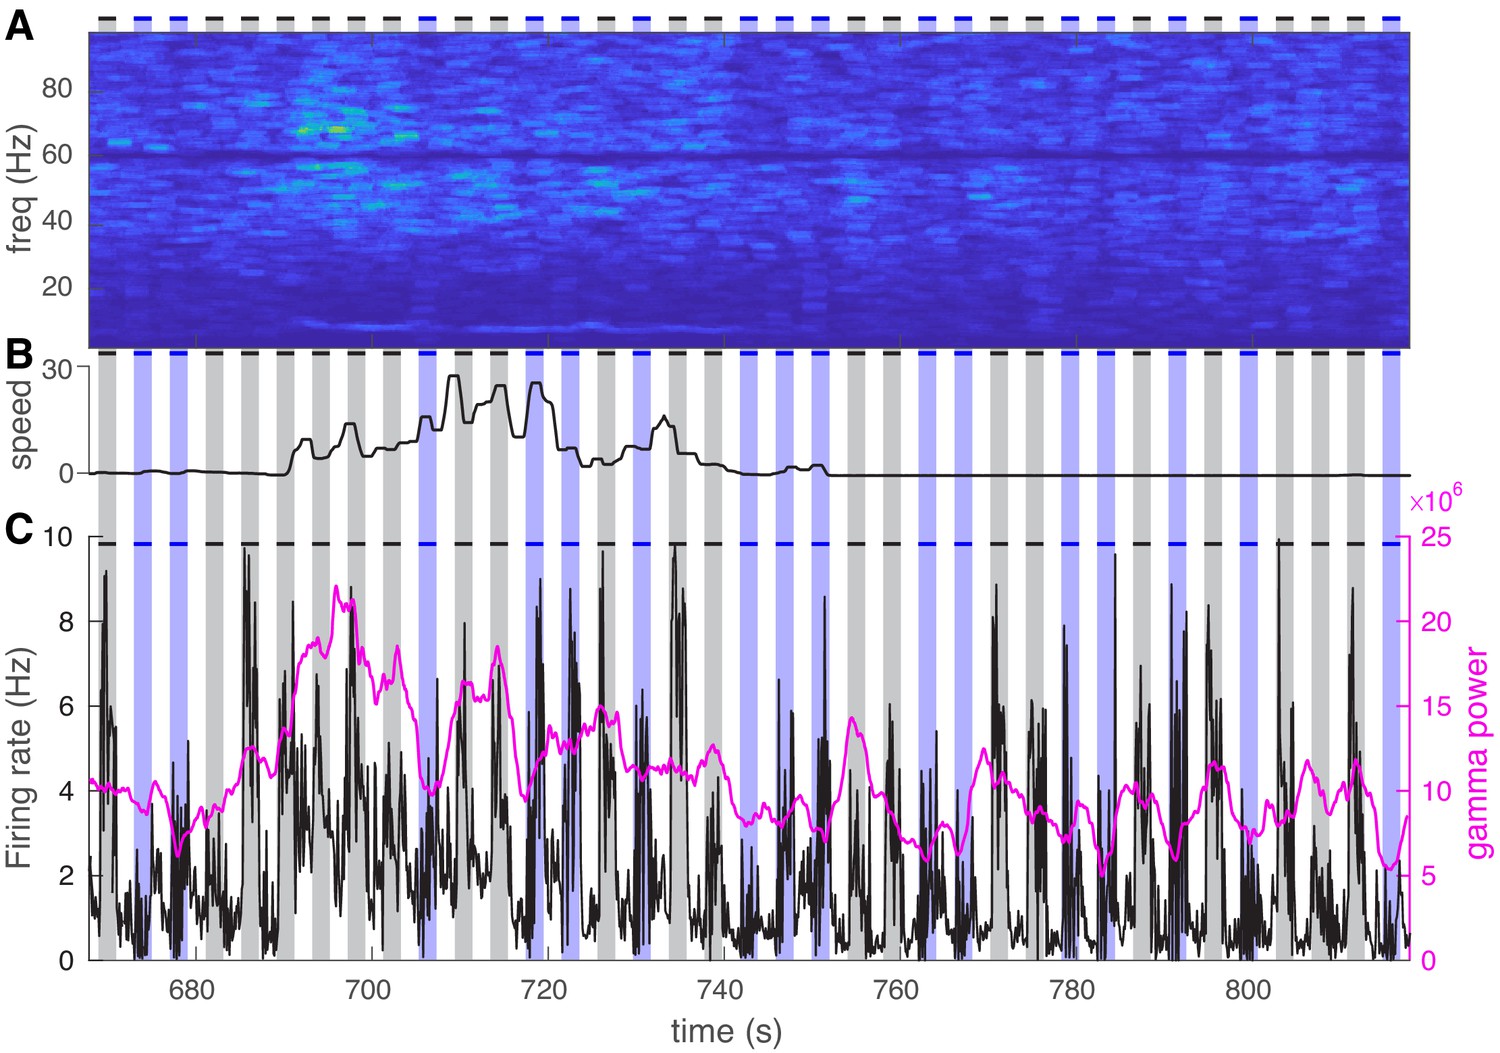
Visual stimuli consistently increase both power and average firing rate while visual exposure coupled with optogenetic activation causes a marked reduction in both measures.
(A) Representative power spectrum during 150 s of visual exposure only (gray shadings) and visual exposure coupled with optogenetic activation of nucleus reticularis thalami neurons (blue shadings). (B) Mouse movement speed. (C) Average firing rate of all cells (black curve) is shown along with the gamma power (magenta curve). Visual stimuli consistently increase both power and average firing rate while visual exposure coupled with optogenetic activation causes a marked reduction in both measures.
Figure 2—figure supplement 2
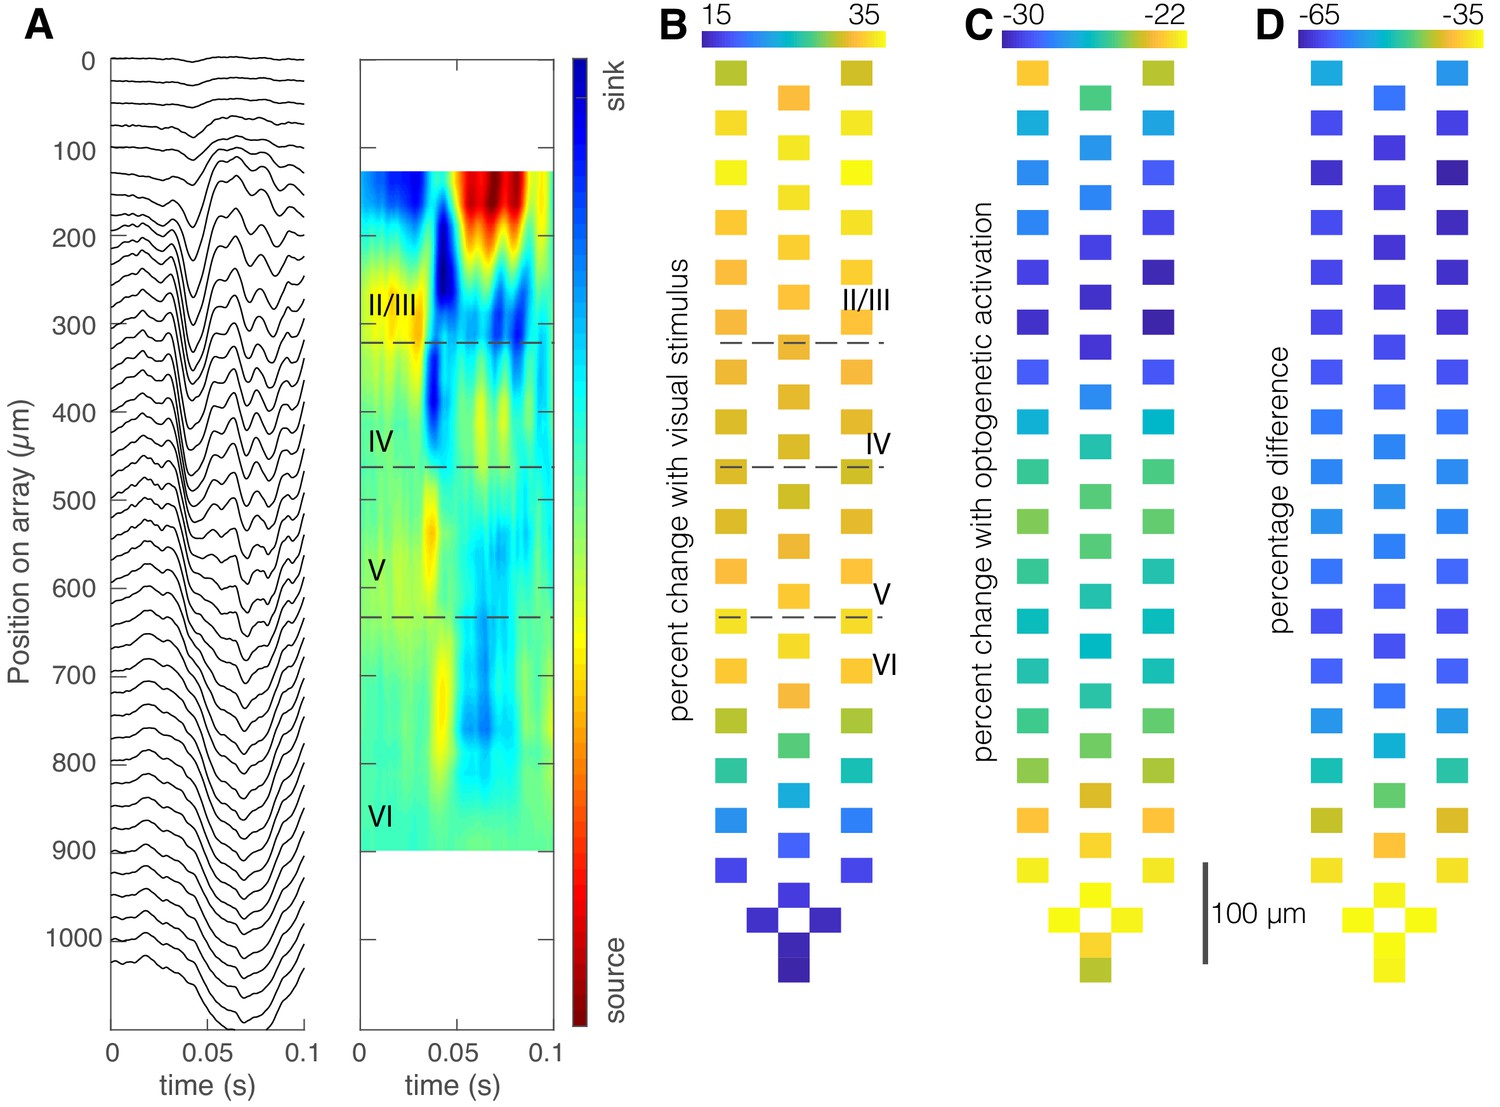
Optogenetic activation of somatostatin (SST) neurons in nucleus reticularis thalami (nRT) reduces visually evoked field responses in V1.
(A) Current source density identifies laminar structure in V1. Local field potential traces averaged over 150 repetitions of a contrast-reversing square checkerboard stimulus (left) and current-source density plot for one mouse show laminar structure (right). Distances at left refer to electrode location relative to the top-most recording site of the array. (B) Percentage increase of average evoked visual responses relative to the average preceding ongoing activity, overlaid over microelectrode map, shows an increase in all mice (mean ± SEM, 29% ± 11%, p=0.03, nested t-test, n = 271 channels in four mice). (C) Percentage change of average evoked visual activity in the presence of optogenetic light relative to the average preceding activity, overlaid over microelectrode map (mean ± SEM, −25% ± 7%, p=0.05). (D) Percentage difference between evoked responses in the presence of laser light (C) and evoked responses in the absence of laser light (B).
Figure 2—figure supplement 3
Optogenetic activation of parvalbumin (PV) nucleus reticularis thalami (nRT) neurons produces an insignificant increase in gamma activity in V1 both with and without visual stimulation.
Same layout as Figure 2. (A) Experimental setup. (B) Representative extracellular raw voltage trace. (C) Optogenetic stimulations at baseline (see Figure 2—source data 1 for statistics). (D) Effect of locomotion without optogenetic stimulations (Figure 2—source data 1). (E) Effect of optogenetic stimulations in still and running conditions (Figure 2—source data 1). (F) Visual responses were recorded while mice were presented with moving gratings. (G) Firing rate of an example cell during the course of the experiment. (H) Effect of visual stimulation with and without optogenetic manipulation (Figure 2—source data 1). (I) Effect of optogenetic stimulations in still and running conditions in the presence of visual stimulus (Figure 2—source data 1). (J) Height of the positive peak relative to the negative trough: −0.18 ± 0.01, –0.27 ± 0.02 (p=3.3e-6, Wilcoxon rank-sum test); the time from the negative trough to the peak: 0.77 ± 0.04, 0.32 ± 0.03 ms (p=8.1e-26), slope of the waveform 0.5 ms after the negative trough: 0.01 ± 0.00, –0.01 ± 0.00 (p=3.6e-30), broad spiking (BS) (n = 191) and narrow spiking (NS) (n = 113) cells, respectively. (K) Effects of optogenetic stimulation on firing rate of BS and NS cells during visual stimulus in both still and running conditions (Figure 2—source data 1). (L) Spearman’s rho and p: 0.00, 0.81 BS and still; 0.20, 0.31 BS and running; 0.06, 0.63; NS and still; 0.11, 0.29 NS and running.
Figure 3

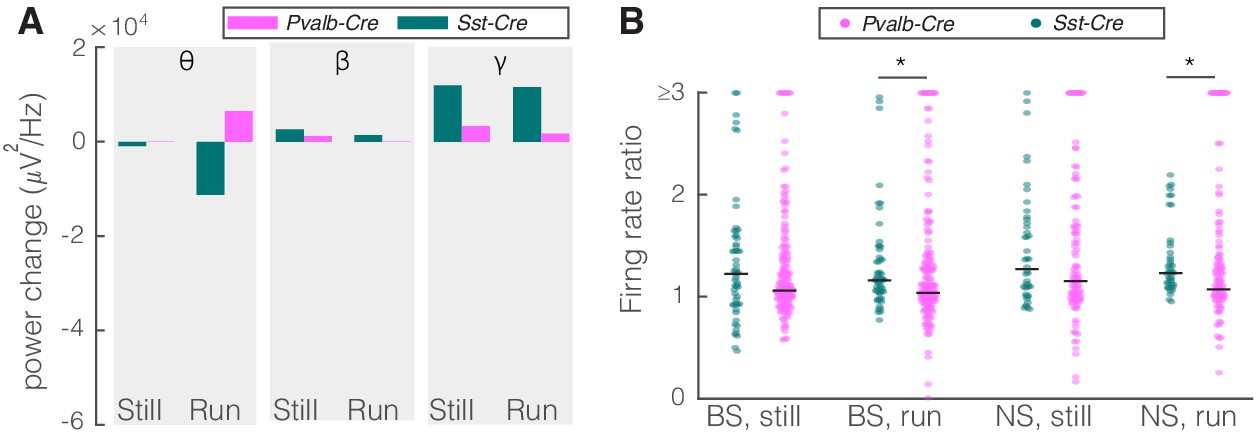
Comparison of optogenetic activation of somatostatin (SST) versus parvalbumin (PV) nucleus reticularis thalami (nRT) neurons on V1.
(A) Changes in the V1 ongoing power in response to optogenetic stimulation of SST (teal) and PV (pink) neurons in nRT (Table 2). *p<8e-3, **p<1.6e-3, ***p<1.6e-4. (B) Effect of optogenetic activation of SST and PV neurons in nRT on the ratio of laser-on to laser-off firing rates in narrow spiking (NS) and broad spiking (BS) cells in V1 in still and running conditions (SST vs. PV; BS, still: 0.79 vs. 1.27, p=0.0006, run: 0.67 vs. 1.29, p=1e-6, n: 134 vs. 191 cells; NS, still: 0.65 vs. 1.46, p=2e-5, run: 1.46 vs. 1.50, p=8e-7, n: 51 vs. 113; all in four mice). **p<2.5e-3, ***p<2.5e-4.
Figure 4
Optical stimulation of control enhanced yellow fluorescent protein (eYFP)-expressing somatostatin (SST) nucleus reticularis thalami (nRT) neurons does not change V1 activity.
(A) Experimental setup. (B) Across-trial average power of all 121 channels in the absence (black) and presence (blue) of optogenetic activation in one mouse shows no change (Table 1). (C) Across-trial average power of all channels in one mouse indicates that locomotion slightly modulates theta and beta powers, while causing a strong enhancement in gamma power (Table 1). (D) Visual responses were recorded while mice were presented with moving gratings. (E) Average power across all channels shows that light delivery in eYFP-expressing SST nRT cells does not affect power in V1 (Table 1). (F) Firing rate of broad spiking (BS) (magenta) and narrow spiking (NS) (cyan) cells across different conditions is not affected by the light in mice in which nRT does not express the opsin (Table 1).
Figure 5 with 2 supplements
Comparison of optogenetic inhibition of somatostatin (SST) versus parvalbumin (PV) nucleus reticularis thalami (nRT) neurons on V1.
(A) Changes in the V1 ongoing power due in response to optogenetic inhibition of SST (teal) and PV (pink) neurons in nRT across the three frequency bands (Table 2). (B) Effect of the optogenetic inhibition of SST and PV neurons in nRT on the ratio of laser-on to laser-off firing rates in narrow spiking (NS) and broad spiking (BS) cells in V1, in still and running conditions during visual stimulation (SST vs. PV; BS, still: 1.33 vs. 1.27, p=0.05, run: 1.29 vs. 1.10, p=0.004, n: 58 [in four mice] vs. 127 [in two mice] cells; NS, still: 1.47 vs. 1.26, p=0.13, run: 1.35 vs. 1.17, p=0.01, n: 44 vs. 75). *p<0.0125, **p<2.5e-3.
Figure 5—figure supplement 1
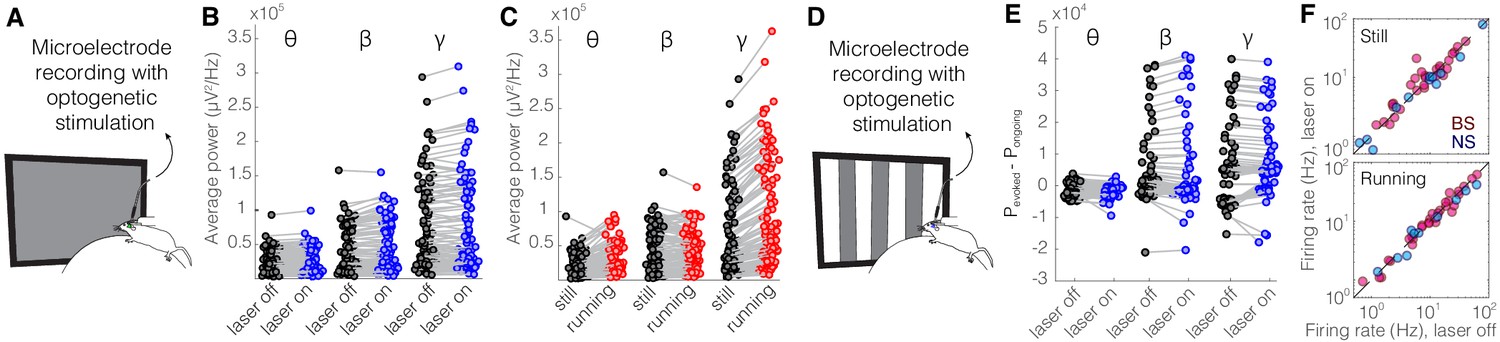
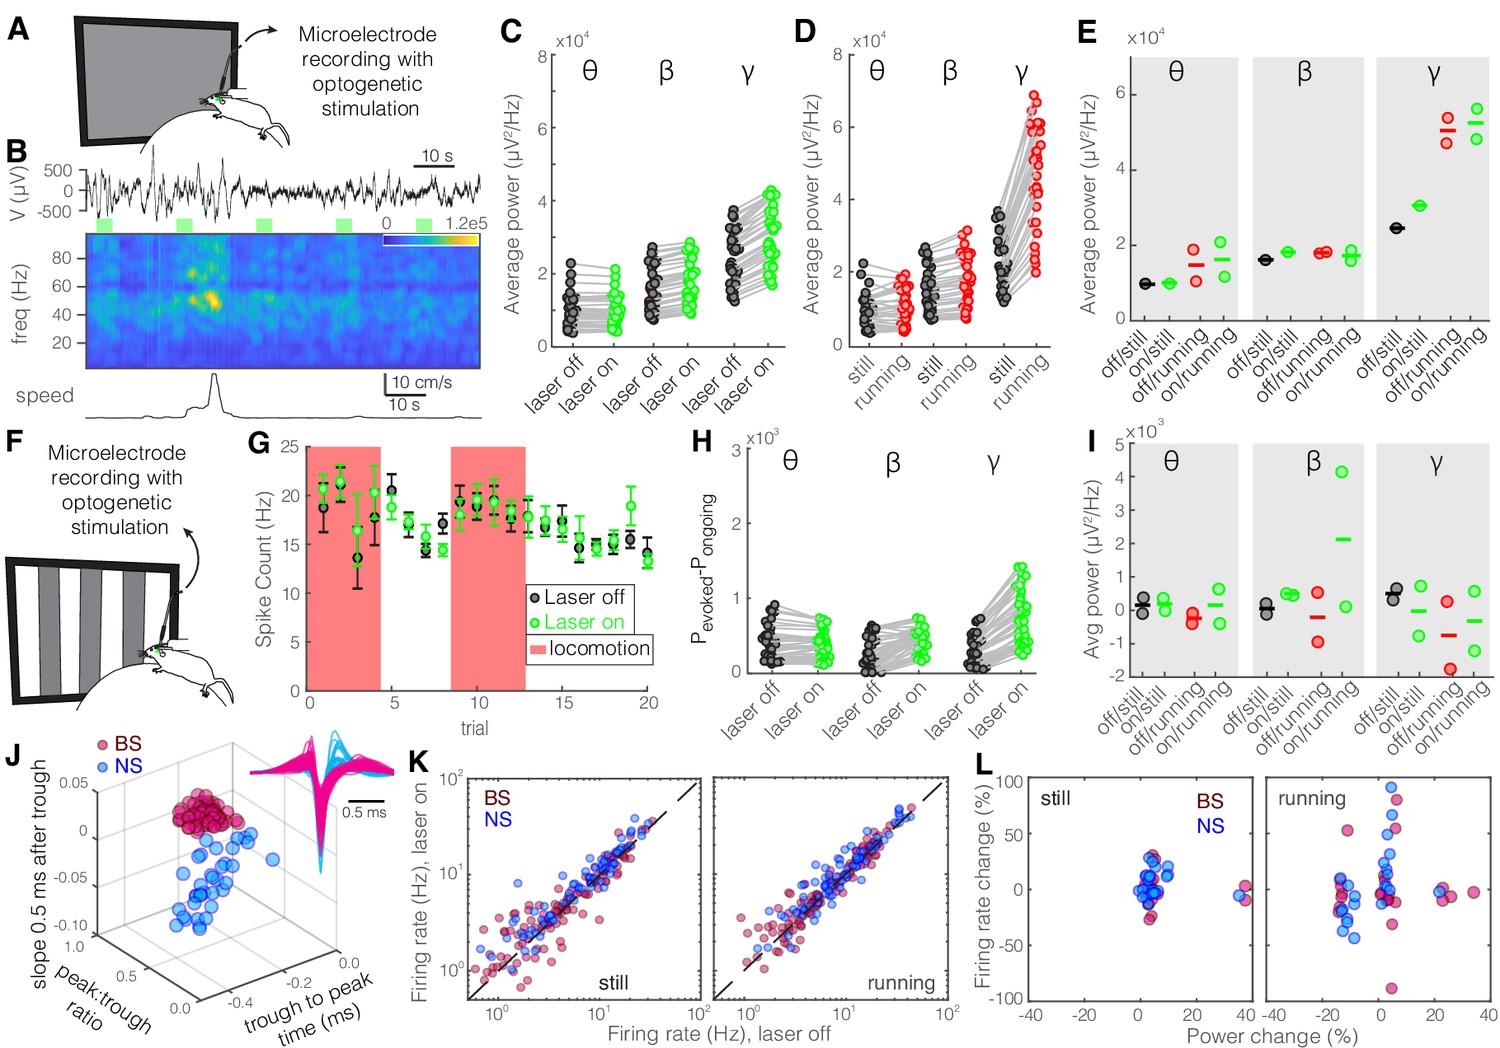
Optogenetic inhibition of somatostatin (SST) nucleus reticularis thalami (nRT) neurons increases gamma activity in V1 during visual stimulation.
Same format as Figure 2. See Figure 2—source data 1 for statistics. (A) Experimental setup. (B) Representative extracellular raw voltage trace. (C) Optogenetic stimulations at baseline (see Figure 2—source data 1 for statistics). (D) Effect of locomotion without optogenetic stimulations (Figure 2—source data 1). (E) Effect of optogenetic stimulations in still and running conditions (Figure 2—source data 1). (F) Visual responses were recorded while mice were presented with moving gratings. (G) Firing rate of an example cell during the course of the experiment. (H) Effect of visual stimulation with and without optogenetic manipulation (Figure 2—source data 1). (I) Effect of optogenetic stimulations in still and running conditions in the presence of visual stimulus (Figure 2—source data 1). (J) Height of the positive peak relative to the negative trough: broad spiking (BS) −0.19 ± 0.01 vs. narrow spiking (NS) −0.28 ± 0.01 (p=3.2e-8, Wilcoxon rank-sum test); the time from the negative trough to the peak: 0.74 ± 0.01 vs. 0.34 ± 0.01 ms (p=5.9e-30); slope of the waveform 0.5 ms after the negative trough: 0.01 ± 0.00 vs. −0.01 ± 0.00 (p=1.2e-27); (n = 97 BS, n = 79 NS cells). (K) Effects of optogenetic stimulation on firing rate of BS and NS cells during visual stimulus in both still and running conditions (Figure 2—source data 1). (L) Spearman’s rho and p: −0.01, 0.87 BS and still; −0.71, 0.46 BS and running; 0.73, 0.08 NS and still; 0.90, 0.33 NS and running.
Figure 5—figure supplement 2
Optogenetic inhibition of parvalbumin (PV) nucleus reticularis thalami (nRT) neurons does not significantly change gamma activity in V1.
Same format as Figure 2. See Figure 2—source data 1 for statistics. (A) Experimental setup. (B) Representative extracellular raw voltage trace. (C) Optogenetic stimulations at baseline (see Figure 2—source data 1 for statistics). (D) Effect of locomotion without optogenetic stimulations (Figure 2—source data 1). (E) Effect of optogenetic stimulations in still and running conditions (Figure 2—source data 1). (F) Visual responses were recorded while mice were presented with moving gratings. (G) Firing rate of an example cell during the course of the experiment. (H) Effect of visual stimulation with and without optogenetic manipulation (Figure 2—source data 1). (I) Effect of optogenetic stimulations in still and running conditions in the presence of visual stimulus (Figure 2—source data 1). (J) Height of the positive peak relative to the negative trough: broad spiking (BS) −0.23 ± 0.02 vs. narrow spiking (NS) −0.29 ± 0.01 (p=1.1e-3, Wilcoxon rank-sum test); the time from the negative trough to the peak: 0.81 ± 0.02 vs. 0.41 ± 0.03 ms (p=9.7e-11); slope of the waveform 0.5 ms after the negative trough: 0.03 ± 0.01 vs. 0.00 ± 0.01 (p=7.3e-6); (n = 75 BS, n = 126 NS cells). (K) Effects of optogenetic stimulation on firing rate of BS and NS cells during visual stimulus in both still and running conditions (Figure 2—source data 1). (L) Spearman’s rho and p: 0.88, 0.63 BS and still; 0.91, 0.60 BS and running; 0.11, 0.27 NS and still; 0.76, 0.09 NS and running.
Figure 6 with 2 supplements
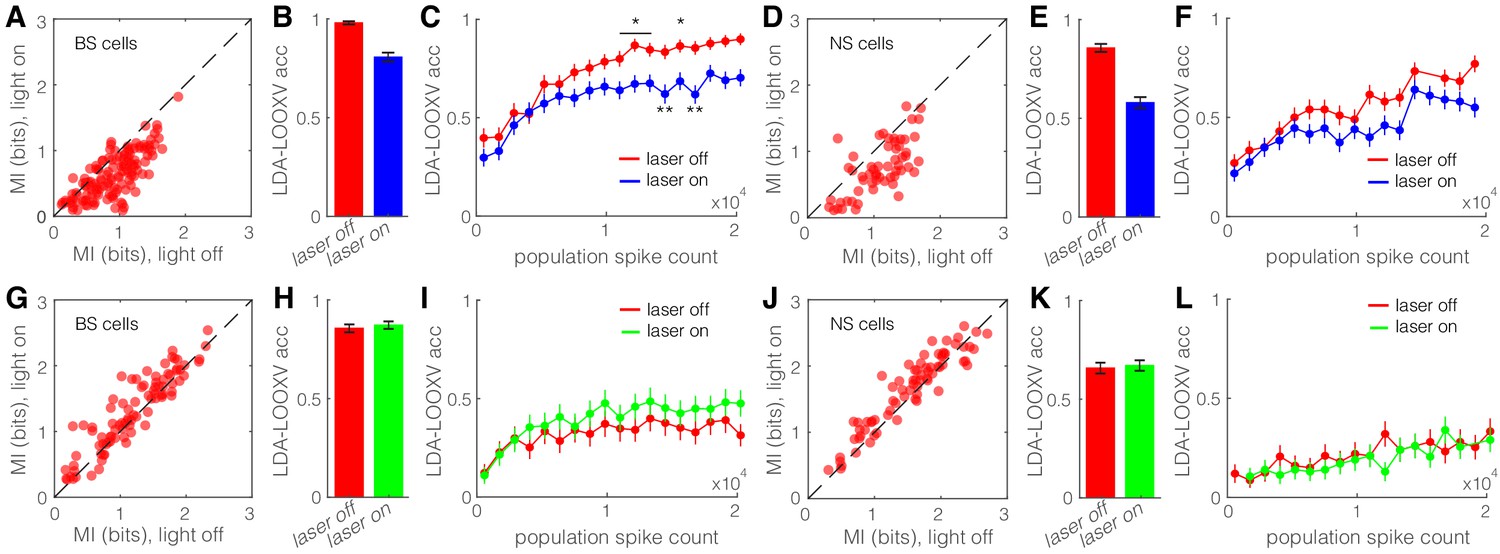
Optogenetic activation of somatostatin (SST) nucleus reticularis thalami (nRT) neurons diminishes encoding ability in both broad spiking (BS) and narrow spiking (NS) cells in V1.
(A) Effects of optogenetic activation of SST nRT cells on BS single-cell mutual information (MI) during locomotion: single-cell MI of BS neurons during locomotion demonstrates a significant reduction with optogenetic activation of SST nRT neurons (MI: light-off 0.91 ± 0.03 to light-on 0.64 ± 0.03, p=6e-5, n = 141 cells, four mice). Dashed line indicates unity. (B) Accuracy in leave-one-out cross validation (LDA-LOOXV) classification of visual stimulus movement orientation using BS responses during locomotion and optogenetic activation of SST nRT cells: (light-off 0.98 to light-on 0.81, p=2e-11, four mice, Wilcoxon rank-sum test). Error bars indicate bootstrapped estimates of SE. (C) Classification accuracy for grating movement orientation as a function of BS population spike count during locomotion and optogenetic activation of SST nRT neurons. Error bars indicate bootstrapped estimates of SE. Chance level would be at 0.16. (D) Effects of optogenetic activation of SST nRT cells on NS single-cell MI during locomotion: (MI: light-off 1.09 ± 0.05 to light-on 0.76 ± 0.05, p=7e-4, n = 58 cells, four mice). (E) Accuracy in LDA-LOOXV classification of visual stimulus movement orientation using NS responses during locomotion and optogenetic activation of SST nRT cells: (light-off 0.86 to 0.58, p=1e-13, four mice). (F) Classification accuracy for grating movement orientation as a function of NS population spike count during locomotion and optogenetic activation of SST nRT neurons. (G) Effects of optogenetic inhibition of SST nRT cells on BS single-cell MI during locomotion: (1.19 ± 0.06 to 1.31 ± 0.06, p=2e-4, n = 90 cells, four mice). (H) Accuracy in LDA-LOOXV classification of visual stimulus movement orientation using BS responses during locomotion and optogenetic inhibition of SST nRT cells: (light-off 0.86–0.87, p=0.53, four mice). (I) Classification accuracy for grating movement orientation as a function of BS population spike count during locomotion and optogenetic inhibition of SST nRT neurons. (J) Effects of optogenetic inhibition of SST nRT cells on NS single-cell MI during locomotion: (MI: 1.54 ± 0.07 to 1.65 ± 0.06, p=7e-4, n = 74 cells, four mice). (K) Accuracy in LDA-LOOXV classification of visual stimulus movement orientation using NS responses during locomotion and optogenetic inhibition of SST nRT cells: (light-off 0.65–0.67, p=0.72, four mice). (L) Classification accuracy for grating movement orientation as a function of NS population spike count during locomotion and optogenetic inhibition of SST nRT neurons. *p<0.05, **p<0.01.
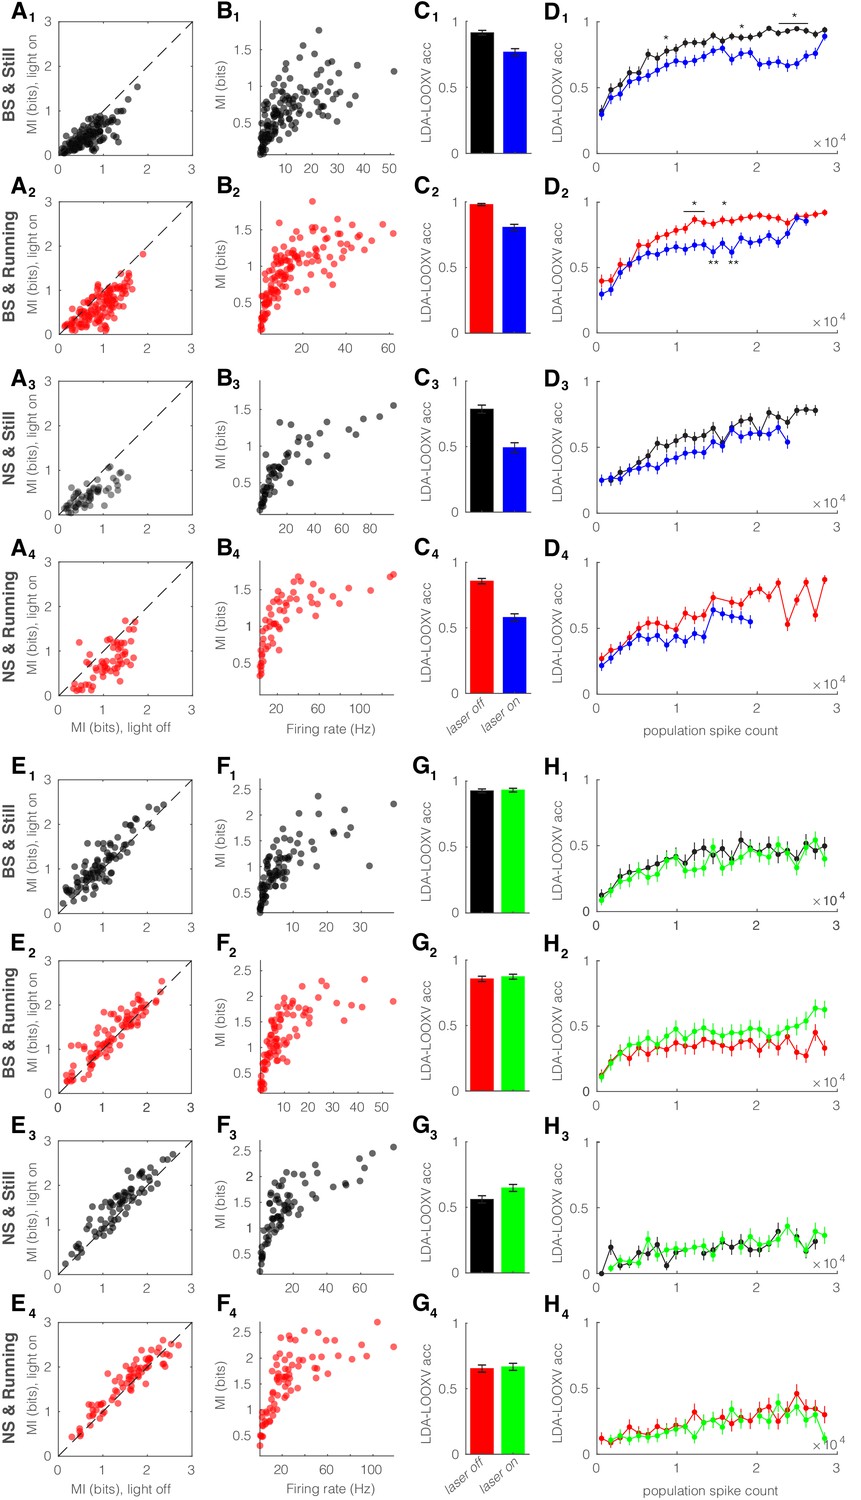
Figure 6—figure supplement 1
Optogenetic manipulation of somatostatin (SST) nucleus reticularis thalami (nRT) neurons alters encoding accuracy in both broad spiking (BS) and narrow spiking (NS) cells.
(A) Effects of optogenetic activation of SST nRT cells on single-cell mutual information (MI): single-cell MI of BS neurons while stationary (A1) and running (A2), and NS neurons while stationary (A3) and running (A4) for optogenetic light-off versus light-on conditions (light-off to light-on; A1, 0.64 ± 0.03 to 0.42 ± 0.02, p=5e-5, n = 141 cells, Wilcoxon signed-rank test; A2, 0.91 ± 0.03 to 0.64 ± 0.03, p=6e-5; A3, 0.69 ± 0.05 to 0.45 ± 0.03, p=7e-3, n = 58; A4, 1.09 ± 0.05 to 0.76 ± 0.05, p=7e-4; all in four mice). Dashed line indicates unity. (B) Effects of optogenetic activation of SST nRT cells on single-cell MI: single-cell MI against firing rate of BS neurons while stationary (B1) and running (B2), and NS neurons while stationary (B3) and running (B4) for light-off (rho, p, Spearman correlation; B1, 0.76, 7e-28; B2, 0.84, 4e-38; B3, 0.9, 0.0; B4, 0.86, 6e-18). (C) Effects of optogenetic activation of SST nRT cells on leave-one-out cross validation (LDA-LOOXV) classification accuracy of visual stimulus movement orientation in BS neurons during stationary (C1) and running (C2), and NS neurons while stationary (C3) and running (C4) for light-off versus light-on (light-off to light-on; C1, 0.91 to 0.77, p=6e-6, Wilcoxon rank-sum test; C2, 0.98 to 0.81, p=2e-11; C3, 0.79 to 0.49, p=9e-9; C4, 0.86 to 0.58, p=1e-13). Error bars indicate bootstrapped estimates of SE. (D) Classification accuracy for grating orientation as a function of population spike count for BS neurons with optogenetic activation of SST nRT neurons during stationary (D1) and running (D2), and NS neurons during stationary (D3) and running (D4) for light-off versus light-on. Error bars indicate bootstrapped estimates of SE. Chance level would be at 0.16. *p<0.05, **p<0.01. (E) Effects of optogenetic inhibition of SST nRT cells on single-cell MI: same format as (A) (light-off to light-on; E1, 0.96 ± 0.05 to 1.10 ± 0.05, p=7e-3, n = 90 cells; E2, 1.19 ± 0.06 to 1.31 ± 0.06, p=2e-4; E3, 1.35 ± 0.06 to 1.54 ± 0.07, p=5e-4, n = 58; E4, 1.54 ± 0.07 to 1.65 ± 0.07, p=7e-4). (F) Effects of optogenetic inhibition of SST nRT cells on single-cell MI: same format as (B) (rho, p, Spearman correlation; F1, 0.84, 1e-24; F2, 0.84, 6e-25; F3, 0.81, 0.0; F4, 0.82, 2e-19). (G) Effects of optogenetic inhibition of SST nRT cells on LDA-LOOXV classification accuracy of visual stimulus movement orientation: same format as (C) (light-off to light-on; G1, 0.93 to 0.93, p=0.75; G2, 0.86 to 0.87, p=0.53; G3, 0.56 to 0.65, p=0.03; G4, 0.65 to 0.67, p=0.71). (H) Classification accuracy for grating orientation as a function of population spike count for BS neurons with optogenetic inhibition of SST nRT neurons. Same format as (D).
Figure 6—figure supplement 2
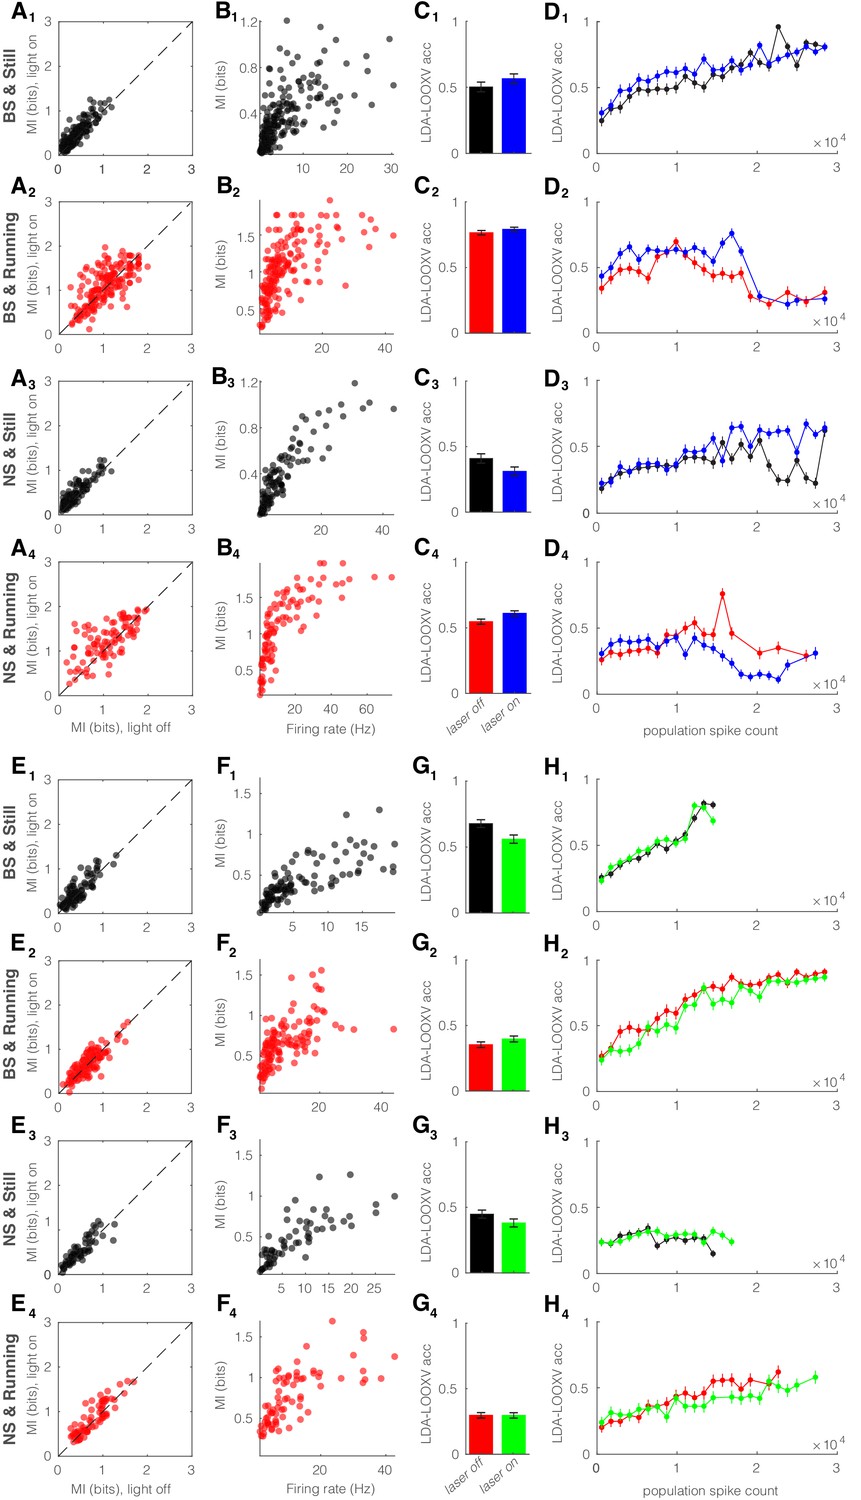
Optogenetic perturbation of parvalbumin (PV) nucleus reticularis thalami (nRT) neurons does not alter encoding accuracy.
Same format as Figure 6—figure supplement 1. (A) Effects of optogenetic activation of PV nRT cells on single-cell mutual information (MI): single-cell MI of broad spiking (BS) neurons while stationary (A1) and running (A2), and narrow spiking (NS) neurons while stationary (A3) and running (A4) for optogenetic light-off versus light-on conditions (light-off to light-on; A1, 0.37 ± 0.02 to 0.44 ± 0.02, p=8e-7, n = 191 cells, Wilcoxon signed-rank test; A2, 1.03 ± 0.03 to 1.08 ± 0.03, p=0.16; A3, 0.37 ± 0.02 to 0.45 ± 0.03, p=3e-5, n = 113; A4, 1.09 ± 0.05 to 1.24 ± 0.04, p=5e-3, all in four mice). (B) Effects of optogenetic activation of PV nRT cells on single-cell MI: single-cell MI against firing rate of BS neurons while stationary (B1) and running (B2), and NS neurons while stationary (B3) and running (B4) for light-off (rho, p, Spearman correlation; B1, 0.74, 1.1e-32; B2, 0.72, 1.1e-29; B3, 0.89, 0.0; B4, 0.87, 1.1e-31; four mice). (C) Effects of optogenetic activation of PV nRT cells on leave-one-out cross validation (LDA-LOOXV) classification accuracy of visual stimulus movement orientation in BS neurons during stationary (C1) and running (C2), and NS neurons while stationary (C3) and running (C4) for light-off versus light-on (light-off to light-on; C1, 0.49 to 0.55, p=0.16, Wilcoxon rank-sum test; C2, 0.75 to 0.77, p=0.19; C3, 0.40 to 0.30, p=0.05; C4, 0.53 to 0.59, p=0.01; all in four mice). (D) Classification accuracy for grating orientation as a function of population spike count for BS neurons with optogenetic activation of PV nRT neurons during stationary (D1) and running (D2), and NS neurons during stationary (D3) and running (D4) for light-off versus light-on. (E) Effects of optogenetic inhibition of PV nRT cells on single-cell MI: same format as (A) (light-off to light-on; E1, 0.41 ± 0.02 to 0.46 ± 0.03, p=1e-2, n = 127 cells, one mouse; E2, 0.66 ± 0.02 to 0.67 ± 0.03, p=0.44, two mice; E3, 0.48 ± 0.04 to 0.52 ± 0.04, p=0.11, n = 75, one mouse; E4, 0.77 ± 0.04 to 0.84 ± 0.04, p=4e-2, two mice). (F) Effects of optogenetic inhibition of PV nRT cells on single-cell MI: same format as (B) (rho, p, Spearman correlation; F1, 0.85, 2.3e-30, one mouse; F2, 0.73, 4.5e-22, two mice; F3, 0.85, 4.0e-18, one mouse; F4, 0.77, 0.0, two mice). (G) Effects of optogenetic inhibition of PV nRT cells on LDA-LOOXV classification accuracy of visual stimulus movement orientation: same format as (C) (light-off to light-on; G1, 0.66 to 0.55, p=0.003, one mouse; G2, 0.35 to 0.39, p=0.12, two mice; G3, 0.44 to 0.37, p=0.13, one mouse; G4, 0.29 to 0.29, p=0.94, two mice). (H) Classification accuracy for grating orientation as a function of population spike count for BS neurons with optogenetic inhibition of PV nRT neurons. Same format as (D).
Figure 7 with 4 supplements
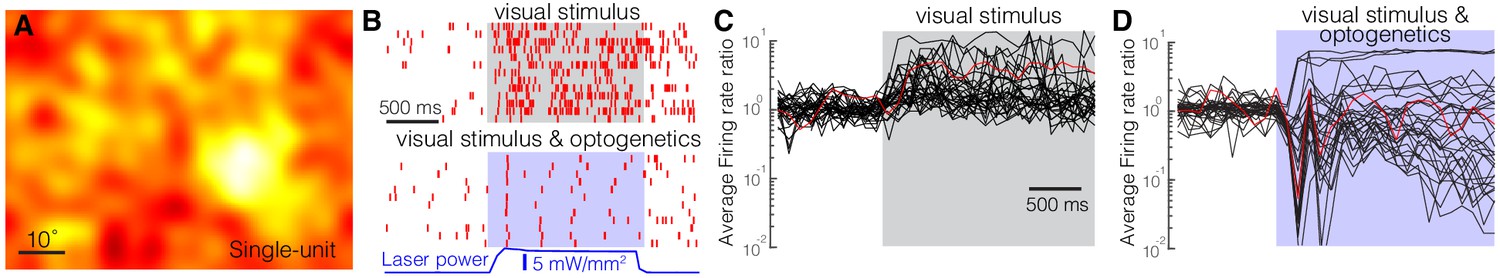
Optogenetic activation of somatostatin (SST) nucleus reticularis thalami (nRT) neurons reduces firing in dorsal lateral geniculate nucleus (dLGN) neurons.
Spike-triggered averages of a single unit (A) in dLGN were calculated using responses to low-frequency filtered noise stimulus. (B) Spike raster for a representative single unit in dLGN across several trials (rows) with visual stimulus only (top) or visual stimulus coupled with optogenetic activation of SST nRT neurons (bottom). Gray shaded area shows the duration of the visual stimulus. Blue shading shows the duration of optogenetic activation. Average firing rate ratios (computed as the visually evoked firing rates for the optimal grating divided by the firing rates prior to the onset of visual stimulation) of dLGN single units in response to visual stimulation only (C) and in response to visual stimulation coupled with optogenetic activation of SST nRT neurons (D). Red trace in (C) and (D) is the example cell shown in B.
-
Figure 7—source data 1
Results of significance testing accross different conditions.
- https://cdn.elifesciences.org/articles/61437/elife-61437-fig7-data1-v2.docx
Figure 7—figure supplement 1
Optogenetic activation of somatostatin (SST) nucleus reticularis thalami (nRT) neurons significantly reduces gamma activity in dorsal lateral geniculate nucleus (dLGN) both with and without visual stimulation.
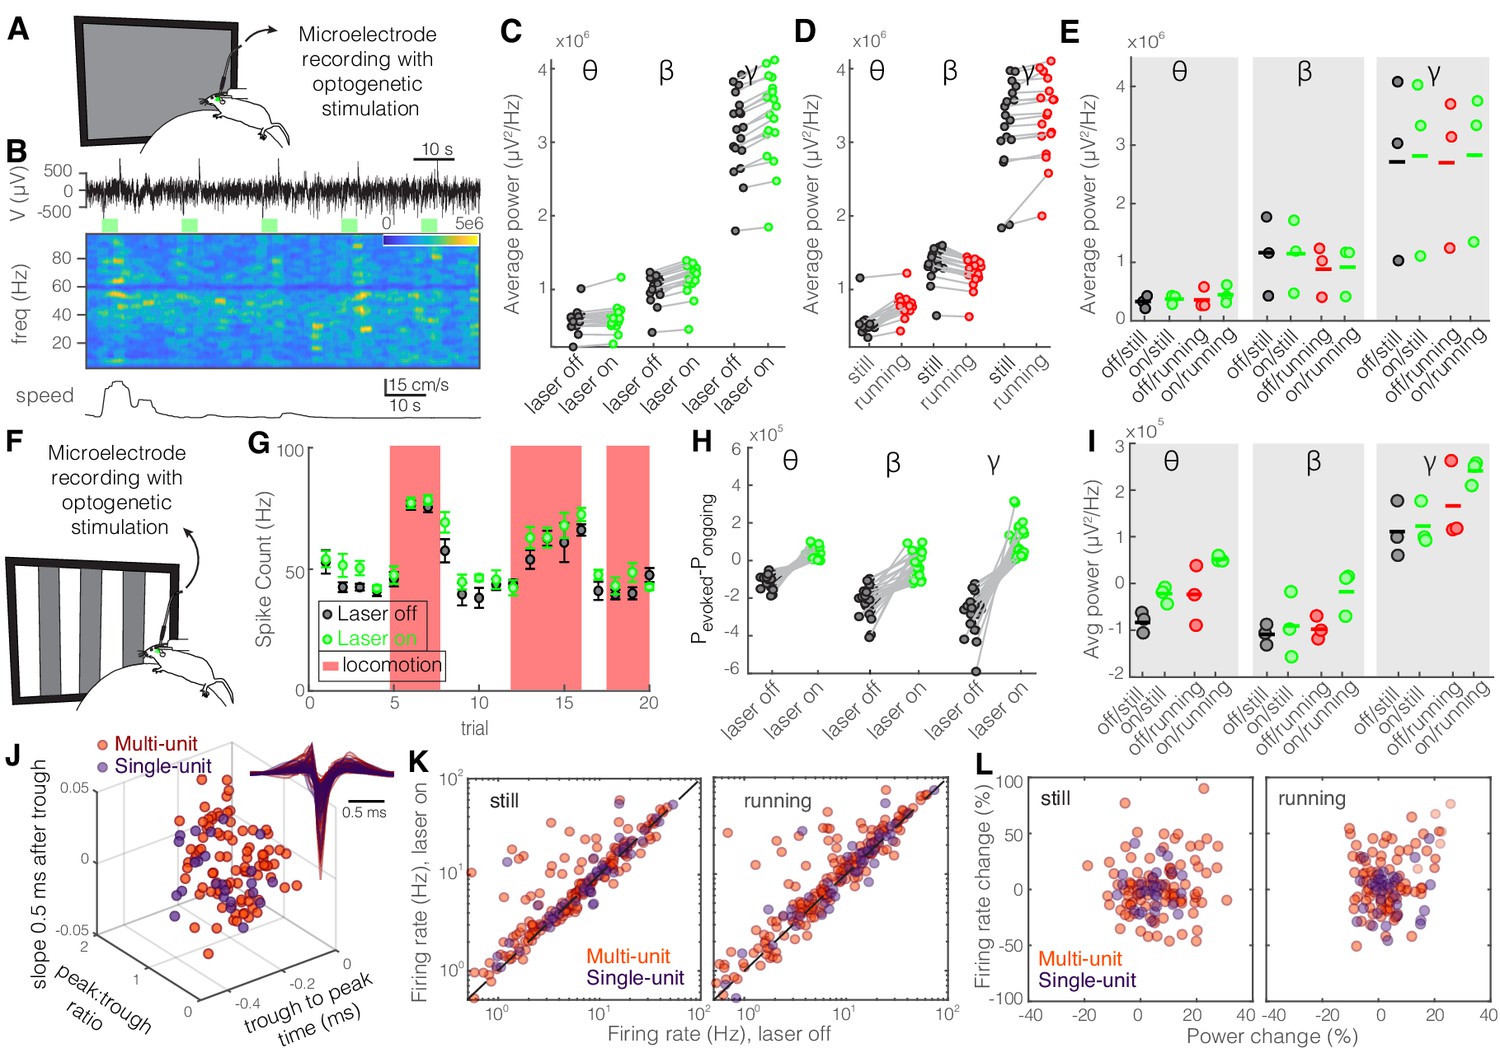
Same format as Figure 2. See Table S2 for statistics. (A) Experimental setup. (B) Representative extracellular raw voltage trace. (C) Optogenetic stimulations at baseline (see Figure 7—source data 1 for statistics). (D) Effect of locomotion without optogenetic stimulations (Figure 7—source data 1). (E) Effect of optogenetic stimulations in still and running conditions (Figure 7—source data 1). (F) Visual responses were recorded while mice were presented with moving gratings. (G) Firing rate of an example cell during the course of the experiment. (H) Effect of visual stimulation with and without optogenetic manipulation (Figure 7—source data 1). (I) Effect of optogenetic stimulations in still and running conditions in the presence of visual stimulus (Figure 7—source data 1). (J) Height of the positive peak relative to the negative trough: multiunit (MU) −0.23 ± 0.02 vs. single-unit (SU) −0.25 ± 0.06 (p=0.98, Wilcoxon rank-sum test); the time from the negative trough to the peak: 0.59 ± 0.02 vs. 0.59 ± 0.04 ms (p=0.76); slope of the waveform 0.5 ms after the negative trough: 0.005 ± 0.001 vs. 0.002 ± 0.03 (p=0.69); (n = 158 MU and n = 35 SU cells). (K) Effects of optogenetic stimulation on firing rate of MU and SU cells during visual stimulus in both still and running conditions (Figure 7—source data 1). (L) Spearman’s rho and p: 0.70, 0.87 MU and still; 0.08, 0.91 MU and running; 0.62, 0.55 SU and still; 0.44, 0.21 SU and running.
Figure 7—figure supplement 2
Optogenetic inhibition of somatostatin (SST) nucleus reticularis thalami (nRT) neurons significantly enhances gamma activity in dorsal lateral geniculate nucleus (dLGN) both with and without visual stimulation.
Same layout as Figure 2. See Table S2 for statistics. (A) Experimental setup. (B) Representative extracellular raw voltage trace. (C) Optogenetic stimulations at baseline (see Figure 7—source data 1 for statistics). (D) Effect of locomotion without optogenetic stimulations (Figure 7—source data 1). (E) Effect of optogenetic stimulations in still and running conditions (Figure 7—source data 1). (F) Visual responses were recorded while mice were presented with moving gratings. (G) Firing rate of an example cell during the course of the experiment. (H) Effect of visual stimulation with and without optogenetic manipulation (Figure 7—source data 1). (I) Effect of optogenetic stimulations in still and running conditions in the presence of visual stimulus (Figure 7—source data 1). (J) Height of the positive peak relative to the negative trough: multi-unit (MU) −0.24 ± 0.01 vs. single-unit (SU) −0.22 ± 0.01 (p=0.24, Wilcoxon rank-sum test); slope of the waveform 0.5 ms after the negative trough: 0.57 ± 0.01 vs. 0.60 ± 0.03 ms (p=0.17); the time from the negative trough to the peak: 0.004 ± 0.001 vs. 0.003 ± 0.002 (p=0.64); (n = 185 MU and n = 49 SU cells). (K) Effects of optogenetic stimulation on firing rate of MU and SU cells during visual stimulus in both still and running conditions (Figure 7—source data 1). (L) Spearman’s rho and p: 0.03, 0.66 MU and still; 0.12, 0.57 MU and running; 0.43, 0.81 SU and still; 0.26, 0.49 SU and running.
Figure 7—figure supplement 3
Optogenetic perturbation of somatostatin (SST) nucleus reticularis thalami (nRT) neurons diminishes spiking reliability.
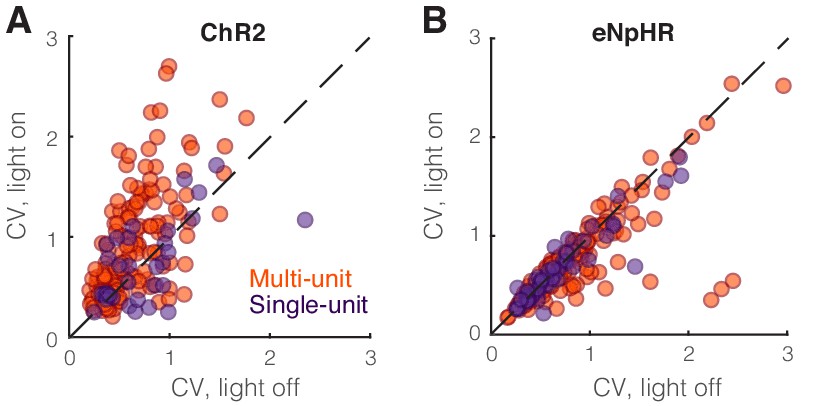
(A) Coefficient of variation of single-unit (dark purple) and multi-unit (orange) responses in dorsal lateral geniculate nucleus (dLGN) to visual stimulation in the presence and absence of optogenetic activation of SST nRT neurons. Changes were significant only for the more numerous multi-unit recordings (multi-units: 0.65 vs. 0.96, light-off vs. light-on, p=5.4e-7, n = 158, Wilcoxon signed-rank test; single units: 0.75 vs. 0.87, light-off vs. light-on, p=0.33, n = 35). (B) Coefficient of variation of single-unit (dark purple) and multi-unit (orange) responses in dLGN to visual stimulation in the presence and absence of optogenetic inhibition of SST nRT neurons. Changes were significant only for the more numerous multi-unit recordings (multi-units: 0.83 vs. 0.74, light-off vs. light-on, p=0.084, n = 185; single-units: 0.71 vs. 0.67, light-off vs. light-on, p=0.19, n = 49).
Figure 7—video 1
Optogenetic activation of somatostatin (SST) nucleus reticularis thalami (nRT) neurons reduces the firing in dorsal lateral geniculate nucleus (dLGN) neurons.
Figure 8
Optogenetic activation and inhibition of somatostatin (SST) nucleus reticularis thalami (nRT) neurons bidirectionally control the activity of dorsal lateral geniculate nucleus (dLGN) neurons.
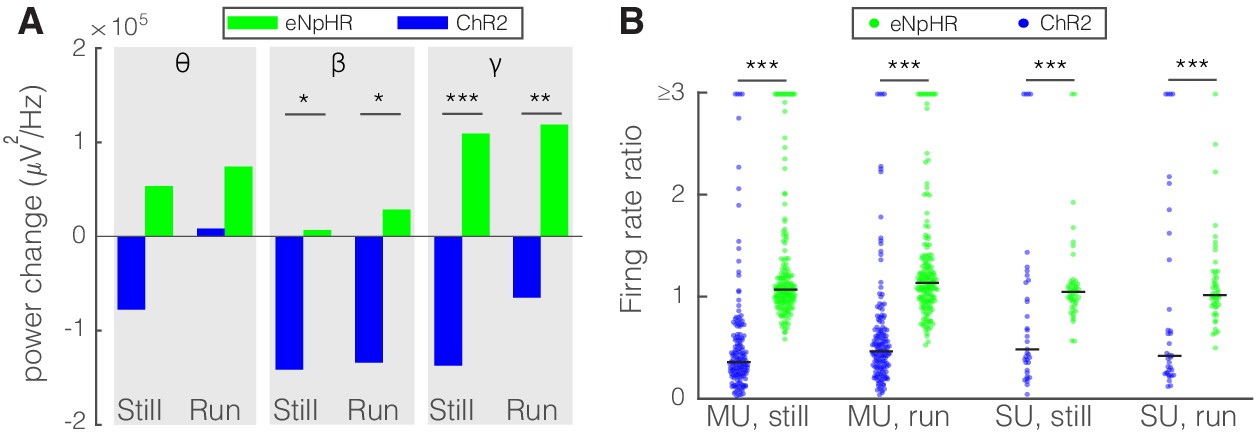
(A) Changes in the dLGN ongoing power due to optogenetic activation (blue) or inhibition (green) of SST nRT neurons across the three frequency bands (Channelrhodopsin-2 [ChR2] vs. enhanced Natronomonas halorhodopsin [eNpHR]; theta, still: −77.6e3 vs. 53.4e3, p=0.06, nested t-test, mean difference −132.0e3 with a 95% CI of [−105.1e3, 163.0e3], run: 8.2e3 vs. 74.1e3, p=0.09, nested t-test, mean difference −65.9e3 with a 95% CI of [−75.1e3, −51.8e3]; beta, still: −141.3e3 vs. 6.7e3, p=0.012, mean difference −134.6e3 with a 95% CI of [−178.0e3, −87.2e3], run: −134.0e3 vs. 28.5e3, p=0.009, mean difference −162.5e3 with a 95% CI of [−184.0e3, −123.6e3]; gamma, still: −137.0e3 vs. 109.3e3, p=3e-5, mean difference −246.3e3 with a 95% CI of [−289.5e3, −191.7e3], run: −65.0e3 vs. 118.9e3, p=6e-3, mean difference −183.9e3 with a 95% CI of [−202.0e3, −58.8e3]; all in three mice, all powers in uV2/Hz). *p<0.016, **p<0.0016, ***p<0.00016. (B) Effects of optogenetic activation or inhibition of SST neurons on the ratio of laser-on to laser-off firing rates of dLGN cells across locomotion conditions (ChR2 vs. eNpHR; multi-unit [MU], still: 0.65 vs. 1.28, p=5e-22, run: 0.66 vs. 1.65, p=5e-11, n: 158 vs. 185 cells; single-unit [SU], still: 1.13 vs. 1.30, p=7e-6, run: 1.34 vs. 1.23, p=6e-8, n: 35 vs. 49; all in three mice). ***p<2.5e-4.
Tables
Table 1
Results of significance testing across different conditions.
Power amplitudes are in units of 1000 * uV2/Hz (Figure 2C–I, Figure 4B–E) and firing rates are in Hz (Figure 2K, L, Figure 4F). BS: broad spiking; NS: narrow spiking.
| Still and laser-off | Still and laser-on | Running and laser-off | Running and laser-on | p-Value | ||
|---|---|---|---|---|---|---|
| Figure 2C (n = 111 channels) | θ | 39 ± 1.8 | 27 ± 1.4 | 1.2e-9 | ||
| β | 64 ± 3.4 | 38 ± 2.3 | 4.7e-10 | |||
| γ | 131 ± 6.5 | 67 ± 4.4 | 2.5e-12 | |||
| Figure 2D (n = 111 channels) | θ | 39 ± 1.8 | 45 ± 2.8 | 0.70 | ||
| β | 64 ± 3.4 | 49 ± 2.7 | 4.5e-5 | |||
| γ | 131 ± 6.5 | 201 ± 9.2 | 5.2e-12 | |||
| Figure 2E (n = 384 channels, four mice) | θ | 29 ± 7.1 | 1.8e4 ± 5.0 | 33 ± 10.6 | 32 ± 9.5 | 0.12 (still), 0.46 (running) |
| β | 47 ± 10.0 | 2.7e4 ± 6.3 | 36 ± 6.0 | 32 ± 6.4 | 0.07 (still), 0.69 (running) | |
| γ | 95 ± 18.5 | 5.0e4 ± 10.3 | 137 ± 31.04 | 83 ± 17.7 | 0.009 (still), 0.01 (running) | |
| Figure 2H (n = 94 channels) | θ | −8.9 ± 0.5 | 16 ± 1.1 | 3.8e-17 | ||
| β | 18 ± 1.6 | 5.7 ± 1.1 | 4.9e-9 | |||
| γ | 39 ± 1.4 | −42 ± 1.6 | 3.8e-17 | |||
| Figure 2I (n = 322 channels, four mice) | θ | 6.2 ± 8.7 | 1.1e4 ± 7.7 | −0.9 ± 2.8 | 1.9e4 ± 6.4 | 0.71 (still), 0.03 (running) |
| β | 22 ± 11.9 | 3.3e4 ± 5.9 | 3.7 ± 2.9 | 1.5e4 ± 7.4 | 0.28 (still), 0.64 (running) | |
| γ | 17 ± 7.6 | −2.3e4 ± 7.1 | 19 ± 8.5 | −2.8e4 ± 9.2 | 0.004 (still), 0.005 (running) | |
| Figure 2K (n = 134 BS, 51 NS, in four mice) | BS | 10.6 ± 1.61 | 6.9 ± 1.00 | 16.9 ± 2.65 | 10.5 ±. 59 | 0.0009 (still), 0.001 (running) |
| NS | 15.98 ± 2.94 | 9.2 ± 1.33 | 25.9 ± 4.34 | 15.2 ± 2.40 | 0.003 (still), 0.006 (running) | |
| Figure 2L (n = 100 BS, 32 NS cells, in four mice) | BS | −38.2 ± 0.83 | −23.6 ± 4.72 | −38.2 ± 1.01 | −34.0 ± 4.02 | |
| NS | −38.5 ± 0.65 | −21.1 ± 8.10 | −38.0 ± 1.17 | −35.56 ± 5.31 | ||
| Figure 4B (n = 121 channels, in two mice) | θ | 22 ± 1.4 | 22 ± 1.4 | 0.78 | ||
| β | 42 ± 5.3 | 45 ± 5.5 | 0.50 | |||
| γ | 77 ± 12.5 | 78 ± 12.4 | 0.88 | |||
| Figure 4C (n = 121 channels, in two mice) | θ | 22 ± 1.4 | 27 ± 2.0 | 0.04 | ||
| β | 42 ± 5.3 | 42 ± 4.5 | .49 | |||
| γ | 77 ± 12.5 | 99 ± 12.2 | 0.004 | |||
| Figure 4E (59 channels, in two mice) | θ | 27 ± 0.3 | 3.3 ± 0.4 | 0.45 | ||
| β | 4.0 ± 0.8 | 4.7 ± 0.7 | 0.15 | |||
| γ | 6.6 ± 1.8 | 6.5 ± 1.2 | 0.33 | |||
| Figure 4F (n = 31 BS, 43 NS cells, in two mice) | BS | 10.8 ± 1.72 | 11.8 ± 1.81 | 15.8 ± 2.64 | 16.1 ± 2.75 | 0.81 (still), 0.98 (running) |
| NS | 12.0 ± 2.13 | 12.3 ± 2.15 | 18.9 ± 4.05 | 18.3 ± 3.90 | 0.91 (still), 0.87 (running) | |
Table 2
Results of significance testing across different conditions.
Power amplitudes are in units of 1000 * uV2/Hz. PV: parvalbumin; SST: somatostatin.
| SST: laser-on–laser-off | PV: laser-on–laser-off | Mean difference and 95% CI | p-Value | ||||
|---|---|---|---|---|---|---|---|
| Figure 3A (SST: n = 384 channels, four mice; PV: n = 189 channels in four mice) | θ | Still | −11.5 | −1.3 | 10.2, [3.4, 15.2] | 0.005 | |
| Run | −0.7 | 0.1 | −0.8, [–8.2, 5.1] | 0.14 | |||
| β | Still | −20.8 | 4.4 | −25.2, [–29.8, –17.0] | 0.008 | ||
| Run | −4.8 | 2.3 | −7.1, [–10.1, –6.6] | 0.08 | |||
| γ | Still | −45.0 | 11.9 | −55.9, [–63.1, –51.4] | 0.001 | ||
| Run | −53.3 | 9.8 | −63.1, [–66.0, –60.2] | 5e-5 | |||
| Figure 5A (SST: n = 313 channels, four mice; PV: n = 121 channels in two mice) | θ | Still | −3.8 | 0.2 | −4.0, [–5.1, 1.3] | 0.72 | |
| Run | −15.9 | 3.5 | −19.4, [–22.0, –11.1] | 0.06 | |||
| β | Still | 6.4 | 4.1 | 2.3, [–0.9, 3.5] | 0.81 | ||
| Run | 3.9 | −0.7 | 4.6, [–2.2, 8.7] | 0.47 | |||
| γ | Still | 11.9 | 5.4 | 7.5, [4.1, 10.5] | 0.12 | ||
| Run | 9.8 | 3.8 | 6.0, [3.4, 9.8] | 0.09 | |||
Key resources table
| Reagent type (species) or resource | Designation | Source or reference | Identifiers | Additional information |
|---|---|---|---|---|
| Strain, strain background (B6.129P2 Pvalbtm1(cre)Arbr/J)Mus musculus Male and female | Pvalb-Cre | The Jackson Laboratory | Stock No: 017320 RRID:IMSR_JAX:017320 | |
| Strain, strain background (B6N.Cg-Ssttm2.1(cre)Zjh/J)Mus musculus Male and female | Sst-Cre | The Jackson Laboratory | Stock No: 018973 RRID:IMSR_JAX:018973 | |
| Strain, strain background (C57BL/6J) Mus musculus Male and female | C57BL/6J | The Jackson Laboratory | Stock No: 000664 RRID:IMSR_JAX:000664 | |
| Sequence-based reagent | Pvalb-1 WT/Pvalb-5 KO | Transnetyx | Genotyping probes | |
| Sequence-based reagent | Sst-1 WT/Sst-5 Tg | Transnetyx | Genotyping probes | |
| Viral prep (rAAV5/EF1a-EYFP) | eYFP | Addgene | Addgene plasmid # 27056 SCR_002448 RRID:Addgene_27056 | |
| Viral prep (rAAV5/EF1a-ChR2-EYFP) | ChR2 | Addgene | Addgene plasmid # 20298 RRID:Addgene_20298 | |
| Viral prep (rAAV5/EF1a-eNpHR3.0-EYFP) | eNpHR | Addgene | Addgene plasmid # 26966 RRID:Addgene_26966 | |
| Immunohistochemistry reagent | Normal donkey serum | Jackson Immunoresearch | Cat #: 017-000-121 RRID:AB_2337258 | |
| Immunohistochemistry reagent | Antifade medium (Vectashield) | Vector Laboratories | Cat #: H-1000 RRID:AB_2336789 | |
| Immunohistochemistry reagent | Cholera Toxin Subunit B (Recombinant), Alexa Fluor 488 Conjugate | Invitrogen | Cat #: C34775 | |
| Antibody | Rabbit anti-parvalbumin antibody | Swant | Cat #: PV27 RRID:AB_2631173 | 1:500 dilution |
| Antibody | Donkey anti-rabbit Alexa Fluor 594 | Abcam | Cat #: ab150076 RRID:AB_2782993 | 1:500 dilution |
| Antibody | Rabbit anti-somatostatin antibody, unconjugated | Peninsula Laboratories International | Cat #: T-4103 RRID:AB_518614 | 1:1000 dilution |
| Antibody | Monoclonal anti parvalbumin antibody | Swant | Cat #: 235 RRID:AB_10000343 | 1:1000 dilution |
| Antibody | Donkey anti-Mouse IgG (H+L) highlycross-adsorbed secondary antibody, Alexa Fluor 555 | Thermo Fisher Scientific | Cat# A-31570 RRID:AB_2536180 | |
| Surgery item | Metabond | PATTERSON DENTAL / Parkell Co. | Three items: Cat #: 5533559 Cat #: 5533500 Cat #: 5533492 | |
| Equipment | Fiber optic | ThorLabs | Cat #: CFML12U-20 | |
| Equipment | Green laser for eNpHR | OPTO ENGINE LLC | Cat #: MGL-III-532 | |
| Equipment | Blue laser for ChR2 | OPTO ENGINE LLC | Cat #: MDL-III-450 | |
| Software | MATLAB | MathWorks | SCR_001622 | |
| Software | GraphPad Prism 8 | GraphPad | SCR_002798 | |
| Software | Origin 9.0 | OriginLab | SCR_002815 | |
| Software | R | R-project | SCR_001905 | |
| Software | SigmaPlot | SigmaPlot | SCR_003210 |
Additional files
-
Source data 1
Source data spreadsheet.
- https://cdn.elifesciences.org/articles/61437/elife-61437-data1-v2.xlsx
-
Transparent reporting form
- https://cdn.elifesciences.org/articles/61437/elife-61437-transrepform-v2.docx
Download links
A two-part list of links to download the article, or parts of the article, in various formats.
Downloads (link to download the article as PDF)
Open citations (links to open the citations from this article in various online reference manager services)
Cite this article (links to download the citations from this article in formats compatible with various reference manager tools)
Gamma rhythms and visual information in mouse V1 specifically modulated by somatostatin+ neurons in reticular thalamus
eLife 10:e61437.
https://doi.org/10.7554/eLife.61437


