Structural insights into the nucleic acid remodeling mechanisms of the yeast THO-Sub2 complex
- Department of Structural Cell Biology, Max Planck Institute of Biochemistry, Germany
Figures
Figure 1
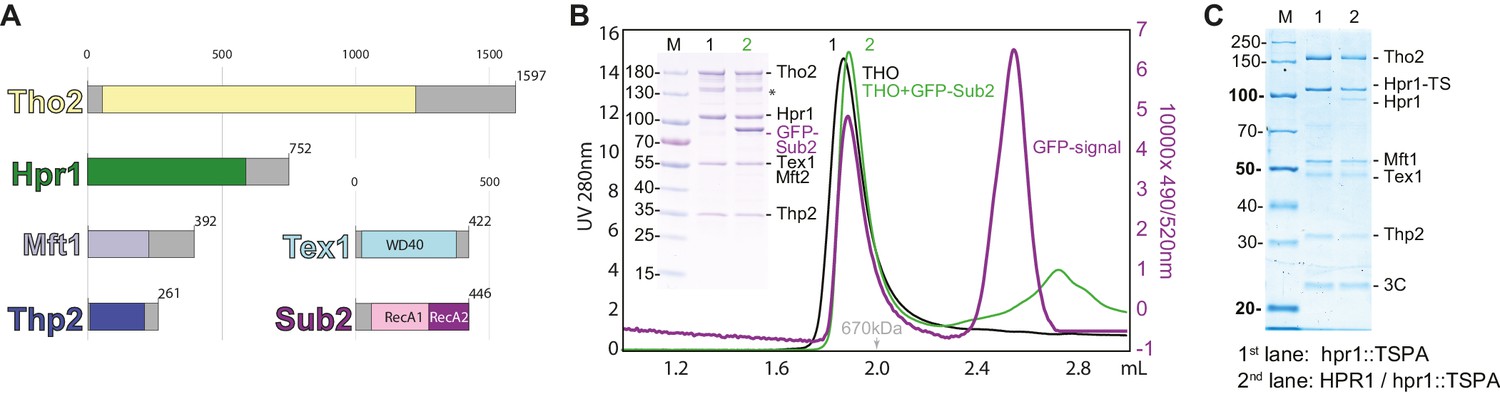
Biochemical reconstitution and native isolation of Saccharomyces cerevisiae THO-Sub2.
(A) Domain organization of Tho2 (yellow), Hpr1 (green), Mft1 (light blue), Thp2 (dark blue), Tex1 (cyan), and Sub2 (with the RecA1 domain in pink and the RecA2 domain in purple). Gray parts are not resolved in the structural analysis described in the paper and correspond to regions predicted to be mainly unstructured. (B) Analytical size-exclusion chromatography of THO with/without GFP-Sub2. The co-elution of GFP-Sub2 was monitored by fluorescence at excitation 490 and emission 520 nm. The green line is the 280 nm absorbance signal of THO with GFP-Sub2; the purple line is the fluorescence signal of THO with GFP-Sub2. The asterisk indicates a Tho2 degradation product. (C) Tandem affinity isolation of native THO-containing complexes from haploid and diploid yeast. A single allele of HPR1 was tagged C-terminally with a Twin-Strep-3C-Protein-A tag (TSPA) in BY4741 (haploid) or BY4743 (diploid). Eluates resulting from IgG-affinity followed by Strep-tactin (IBA) affinity purification were analyzed on 12% SDS-PAGE stained with Instant Blue (Expedeon). M, molecular weight marker; Hpr1-TS, Hpr1 twin strep.
Figure 2 with 4 supplements
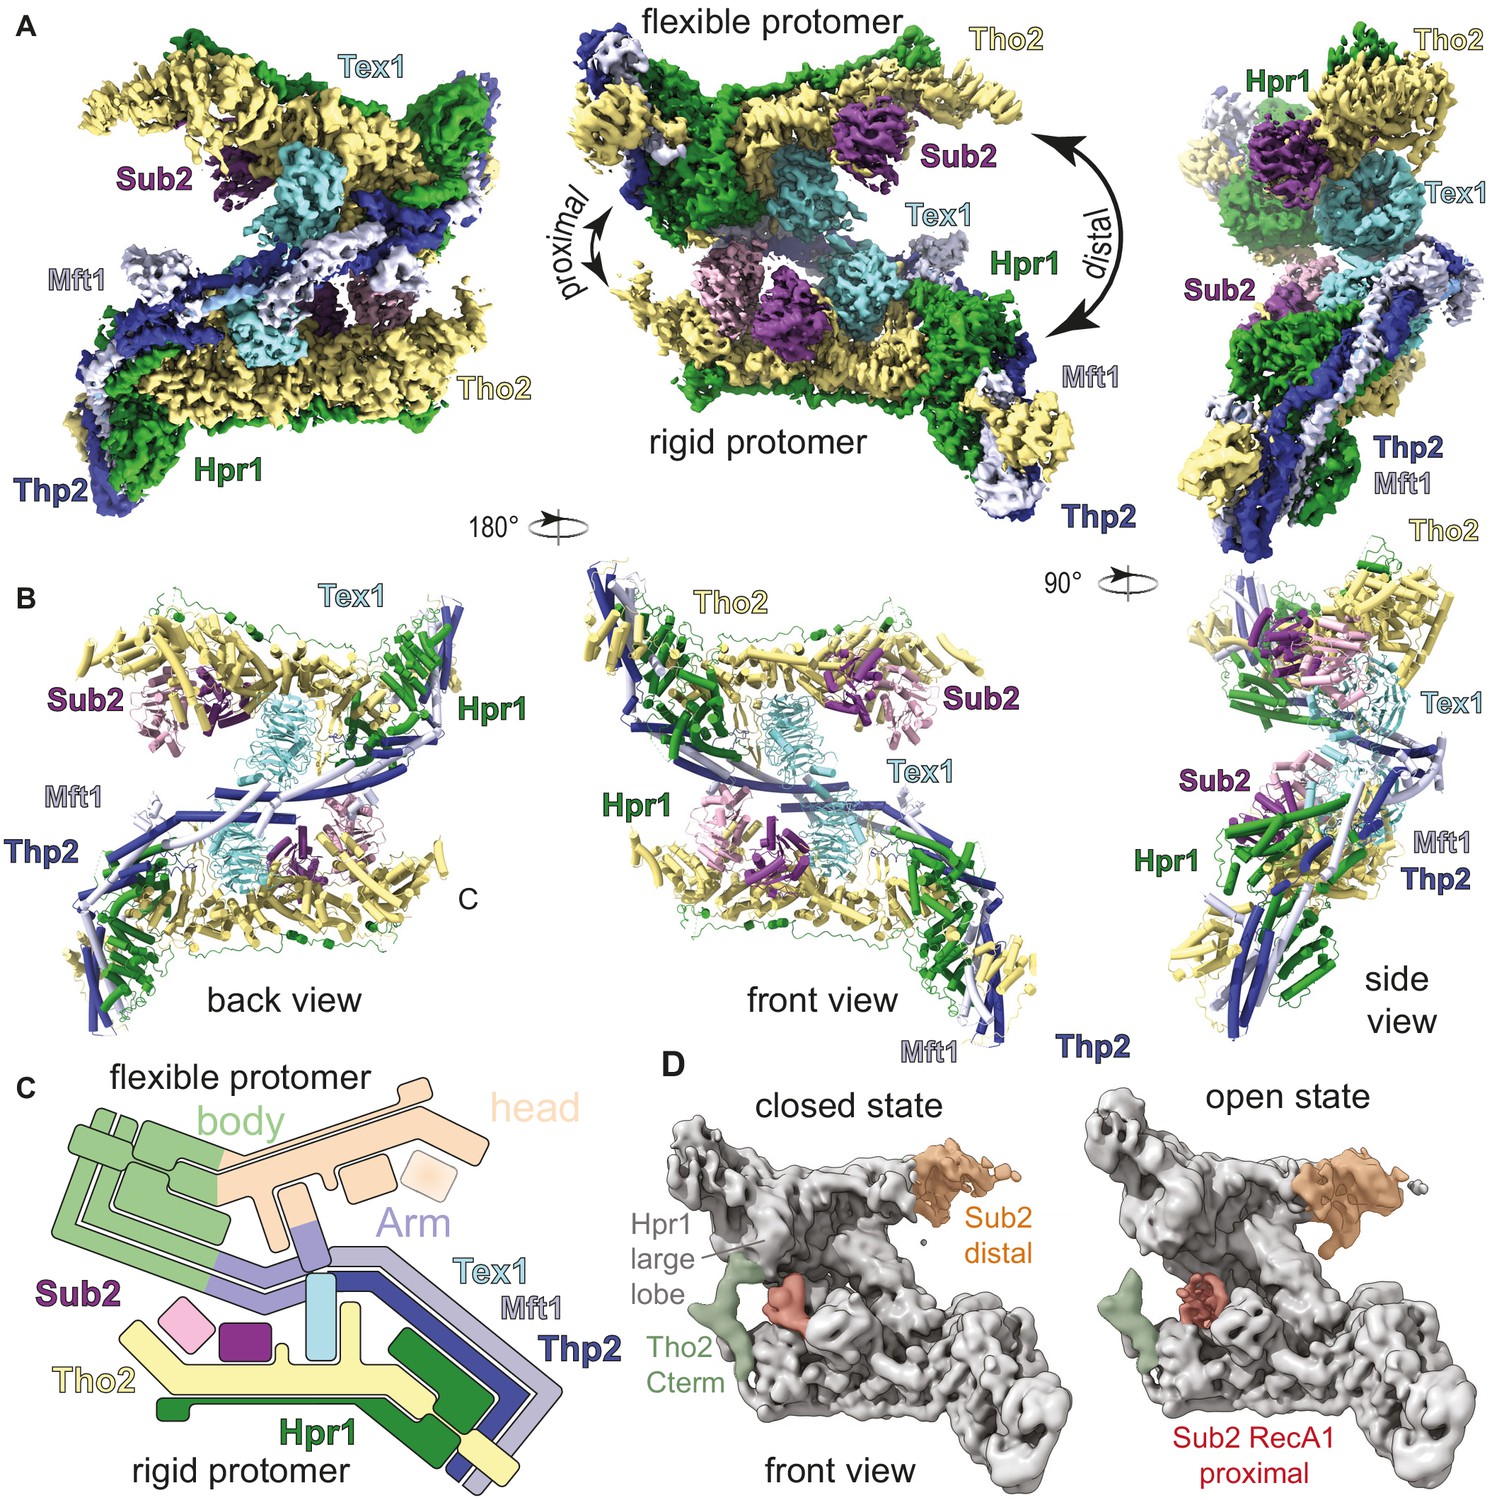
Cryo-electron microscopy (cryo-EM) reconstruction of Saccharomyces cerevisiae THO-Sub2 homodimer.
(A) Segmented cryo-EM reconstruction of the THO-Sub2 dimer. Three different views are shown; proteins and domains are colored as in Figure 1A. Features discussed in the text are indicated, including the proximal and distal sides of the asymmetric homodimer, the rigid and flexible protomers, as well as the ‘head and ‘body’ of each protomer. (B) Cartoon representation of the structure, shown in the same orientations and colors. Helices are rendered as solid cylinders. (C) Schematic representation of the THO-Sub2 complex architecture based on the cryo-EM structure. (D) Two frames of the raw cryo-EM data outputs from the variance analysis shown in Video 1. The Tho2 C-termini of the two protomers are shown in orange and green. Different conformations are adopted as the dimer switches the proximal and distal sides.
Figure 2—figure supplement 1
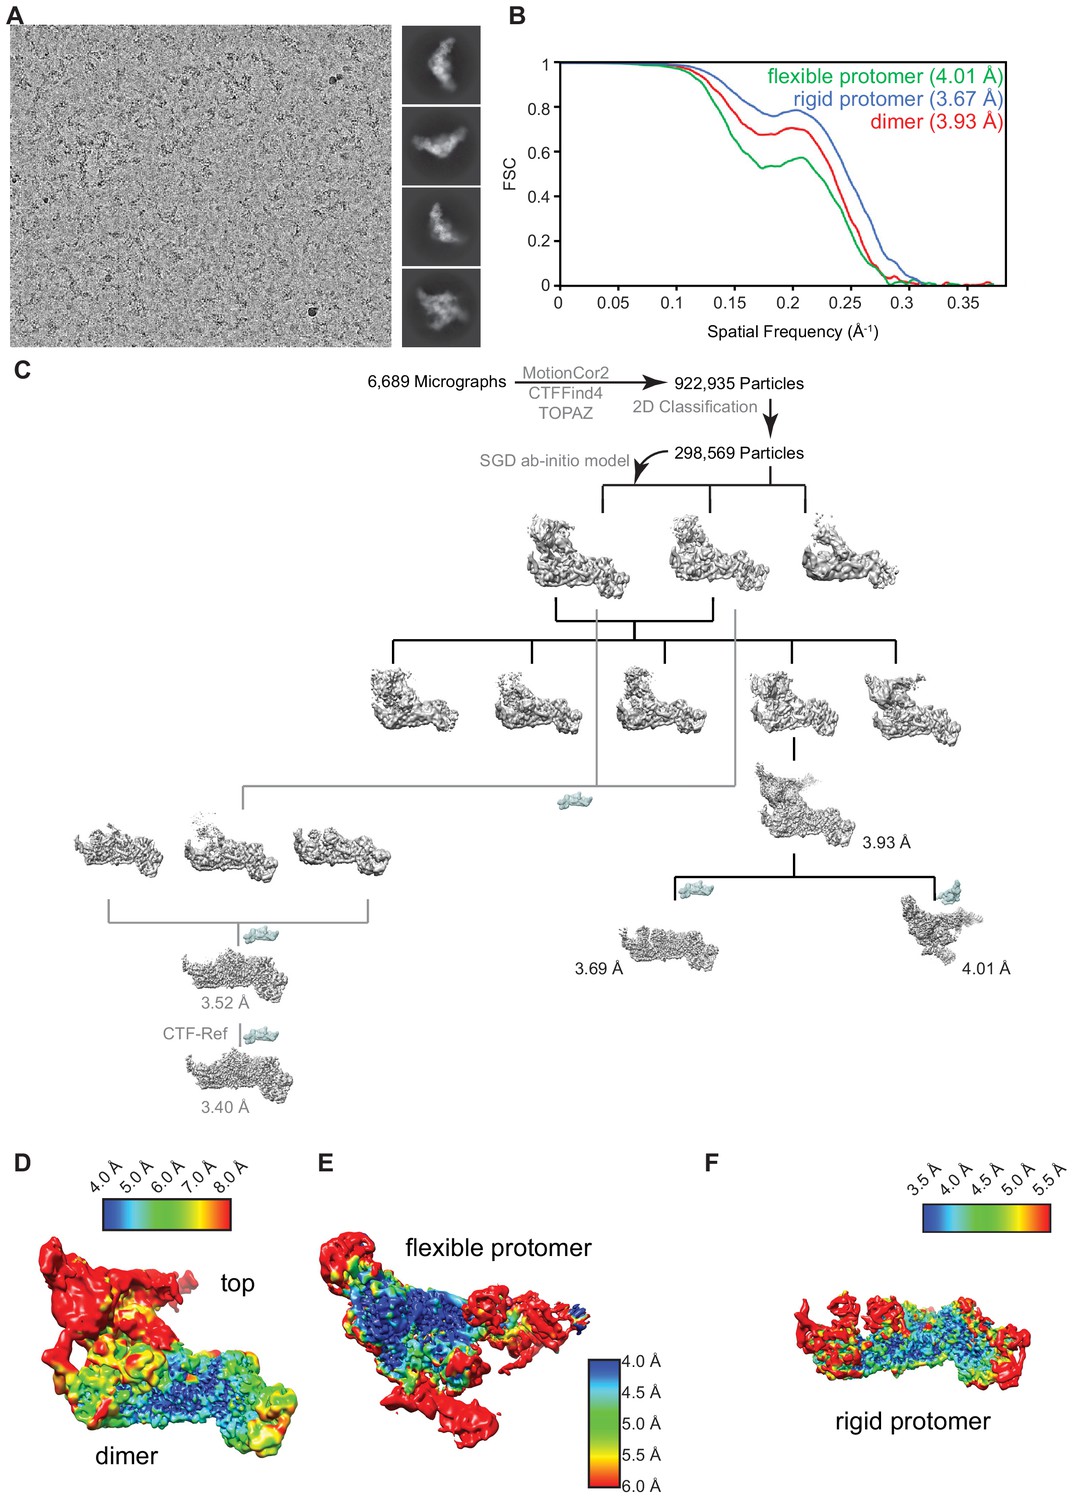
Cryo-electron microscopy analysis.
(A) Representative micrograph acquired on a 300 keV Titan Krios equipped with a post-GIF K3 detector (Gatan, 5760 × 4092 pixel) showing particle distribution and reference-free 2D class-averages. (B) Gold-standard Fourier shell correlation (0.143 – FSC) plot from the final round of refinement for the entire map (THO-Sub2) and the two independently refined maps (rigid protomer and flexible protomer). (C) Particle sorting and classification tree used for 3D reconstruction of the THO-Sub2 complex. The major analysis branch (black) outlines the processing of the dimeric THO-Sub2 complex. The rigid and flexible protomers of the dimeric THO-Sub2 complex were refined locally after density subtraction. The minor analysis branch (gray) outlines the processing focused on the rigid protomer of THO-Sub2. The resolution and map quality were improved using local per-particle CTF-correction (see Figure 2—figure supplement 2). (D) Local resolution analysis of dimeric THO-Sub2, the flexible protomer (E), and the rigid protomer (F) after density subtraction and local refinement. Maps show variation in local resolution as estimated by cryoSPARC.
Figure 2—figure supplement 2
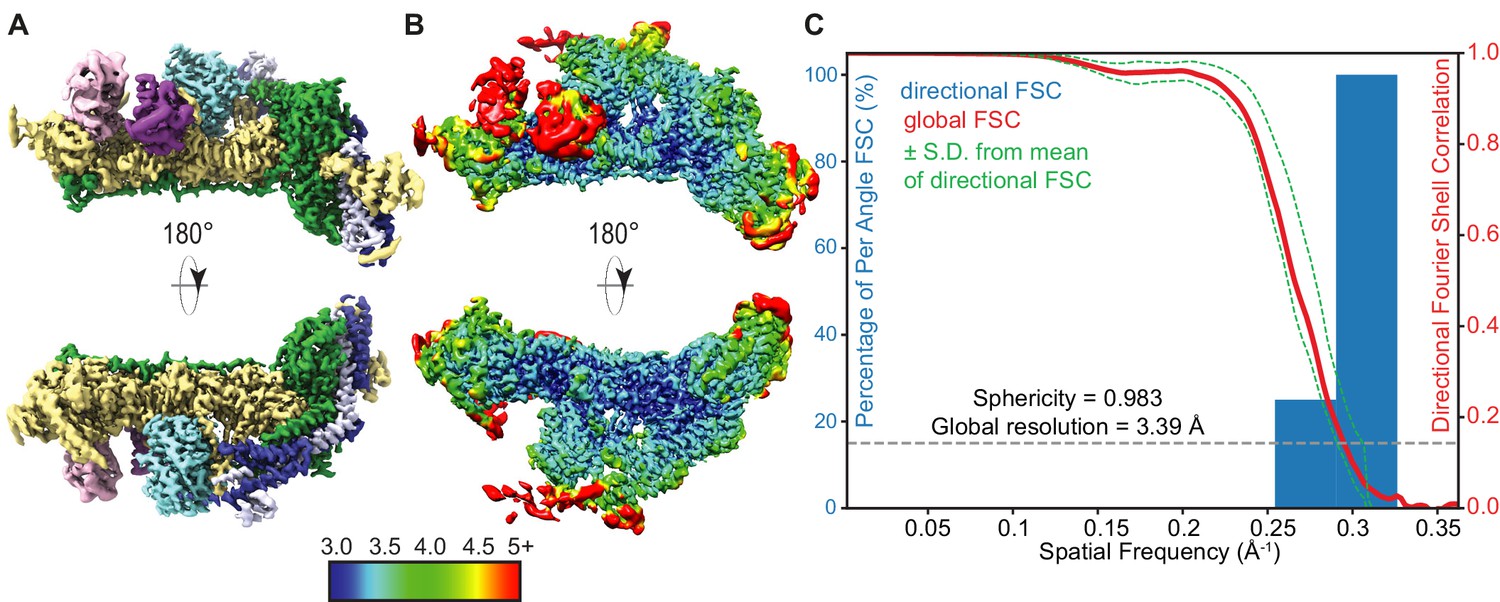
High-resolution THO-Sub2 density.
(A) Segmented cryo-electron microscopy reconstruction of the rigid THO-Sub2 protomer used for de novo atomic modeling. Front and back views are shown; proteins and domains are colored as in Figure 2. (B) Local resolution analysis as estimated by cryoSPARC of the high-resolved rigid THO-Sub2 protomer. (C) 3D FSC and preferred orientation analysis of the rigid THO-Sub2 protomer density calculated using the ‘Remote 3DFSC Processing Server’ web interface. The red line represents the estimated global FSC of 3.39 Å ± 1 SD (green dashed lines). The sphericity of 0.983 indicates a uniform isotropic map without preferred particle orientation bias.
Figure 2—figure supplement 3
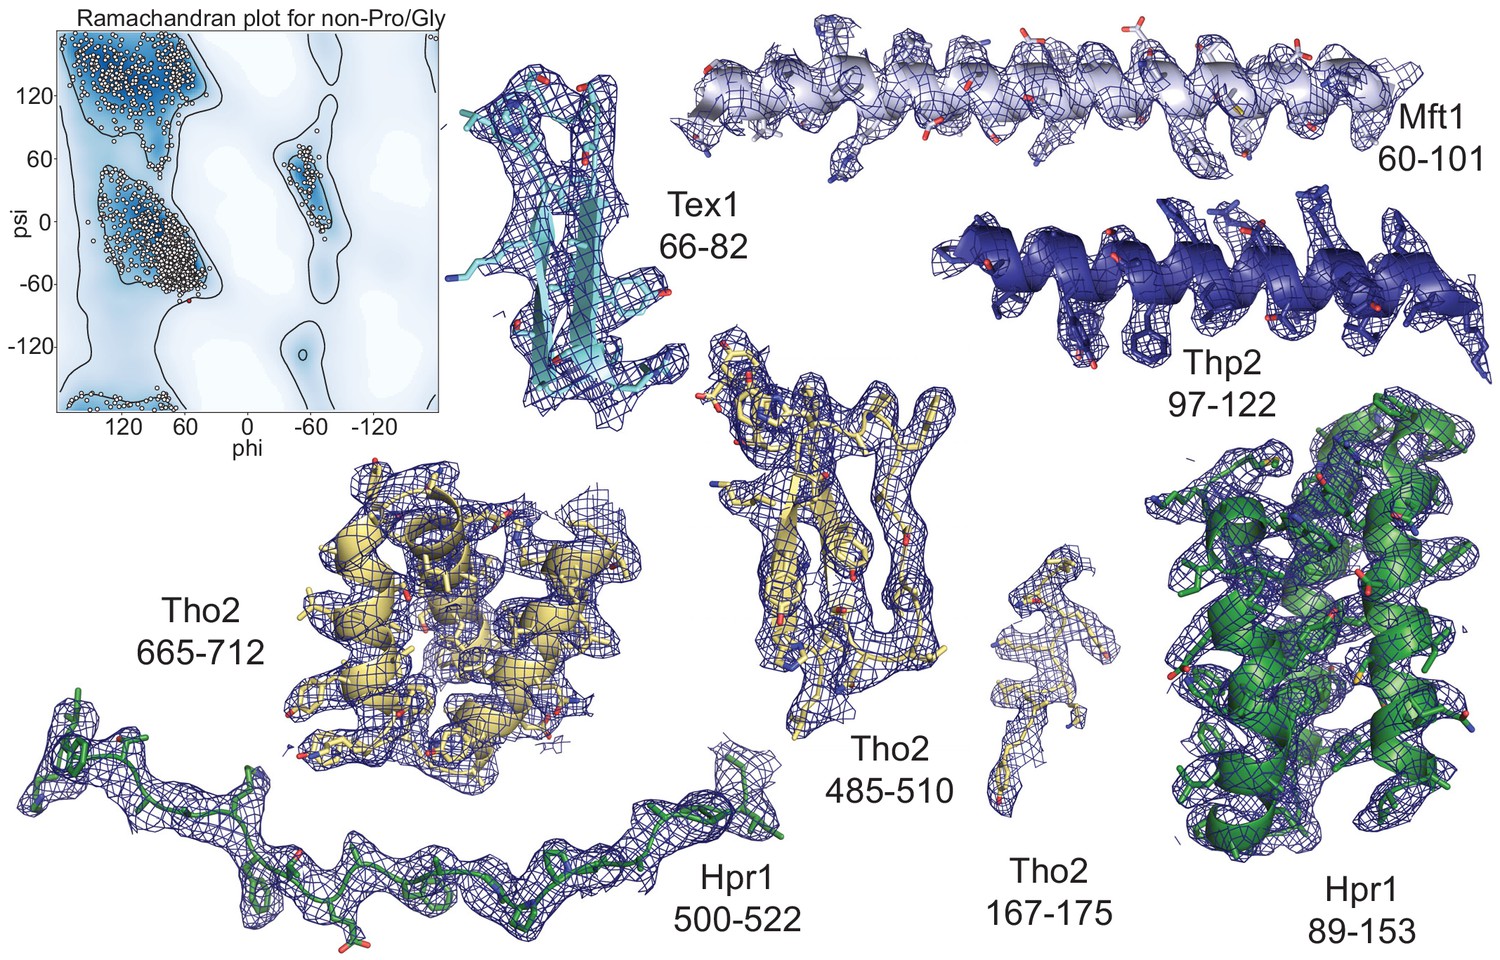
Model quality.
Left: Ramachandran plot of the main-chain φ and ψ torsional angles of the rigid protomer THO-Sub2 atomic model. Areas of favored φ and ψ combinations are defined in dark blue (see also Supplementary file 1). Right: Representative regions of the THO-Sub2 (same colors as in Figure 2) and surrounding electron density maps are shown. Subunits and residue numbers are specified. Snapshots are shown for the density of both folded regions and extended regions.
Figure 2—figure supplement 4
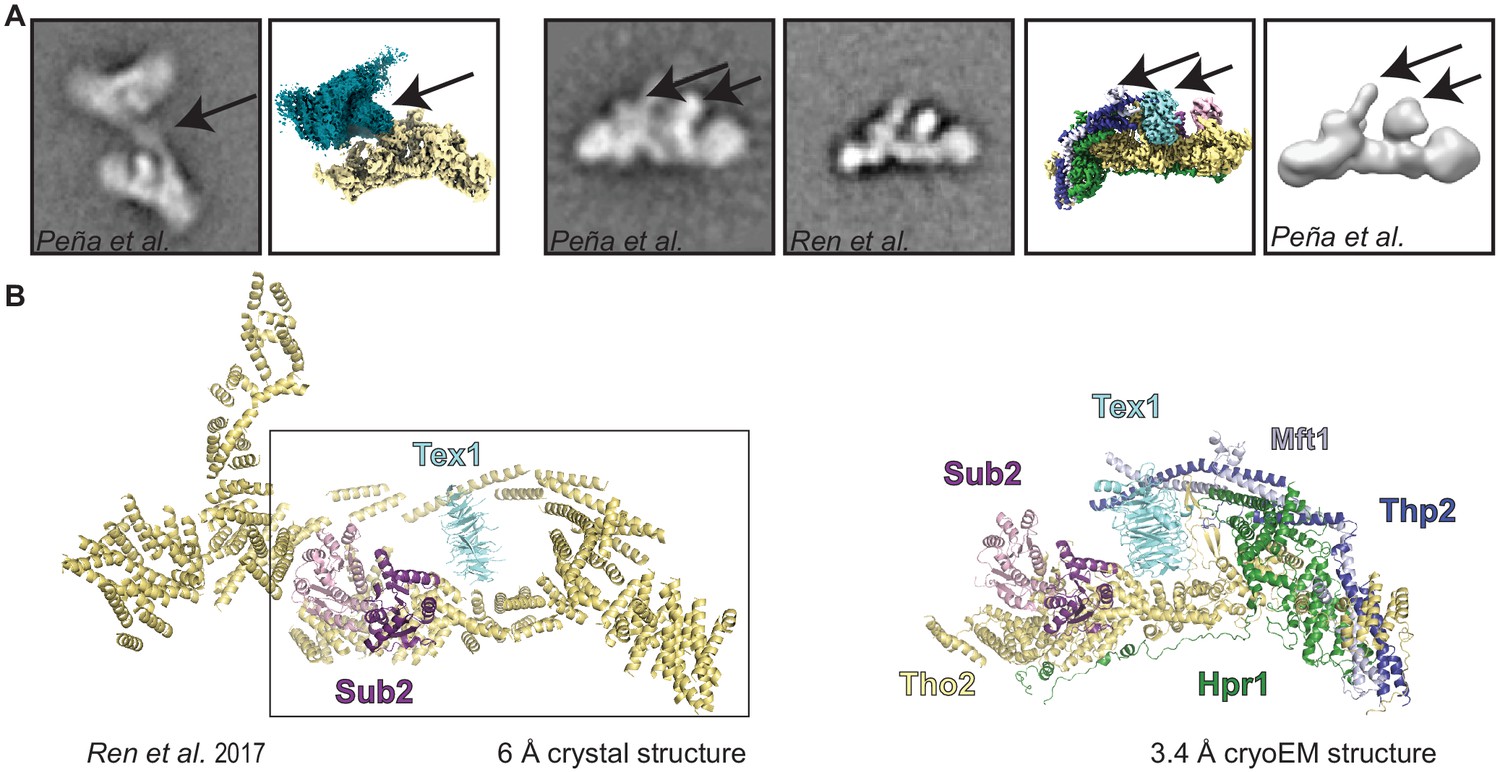
Comparison of our cryo-electron microscopy structure with previous structural studies.
(A) Comparison with a previous negative-stain analyses of the THO complex (Peña et al., 2012; Ren et al., 2017). Arrows highlight areas with distinctive features in the 2D class-averages and our reconstruction. Overall there is a good agreement between the negative stain electron microscopy analysis and our structure. (B) Comparison with a previously published low-resolution X-ray structure (Ren et al., 2017), where the polypeptides for Tho2, Hpr1, Mft1, and Thp2 could not be distinguished, and are therefore all colored the same. The rectangle comprises the portion of the previous model that corresponds to a protomer. The other region of the previous model resulted from misinterpretation of the crystal lattice.
Figure 3 with 5 supplements
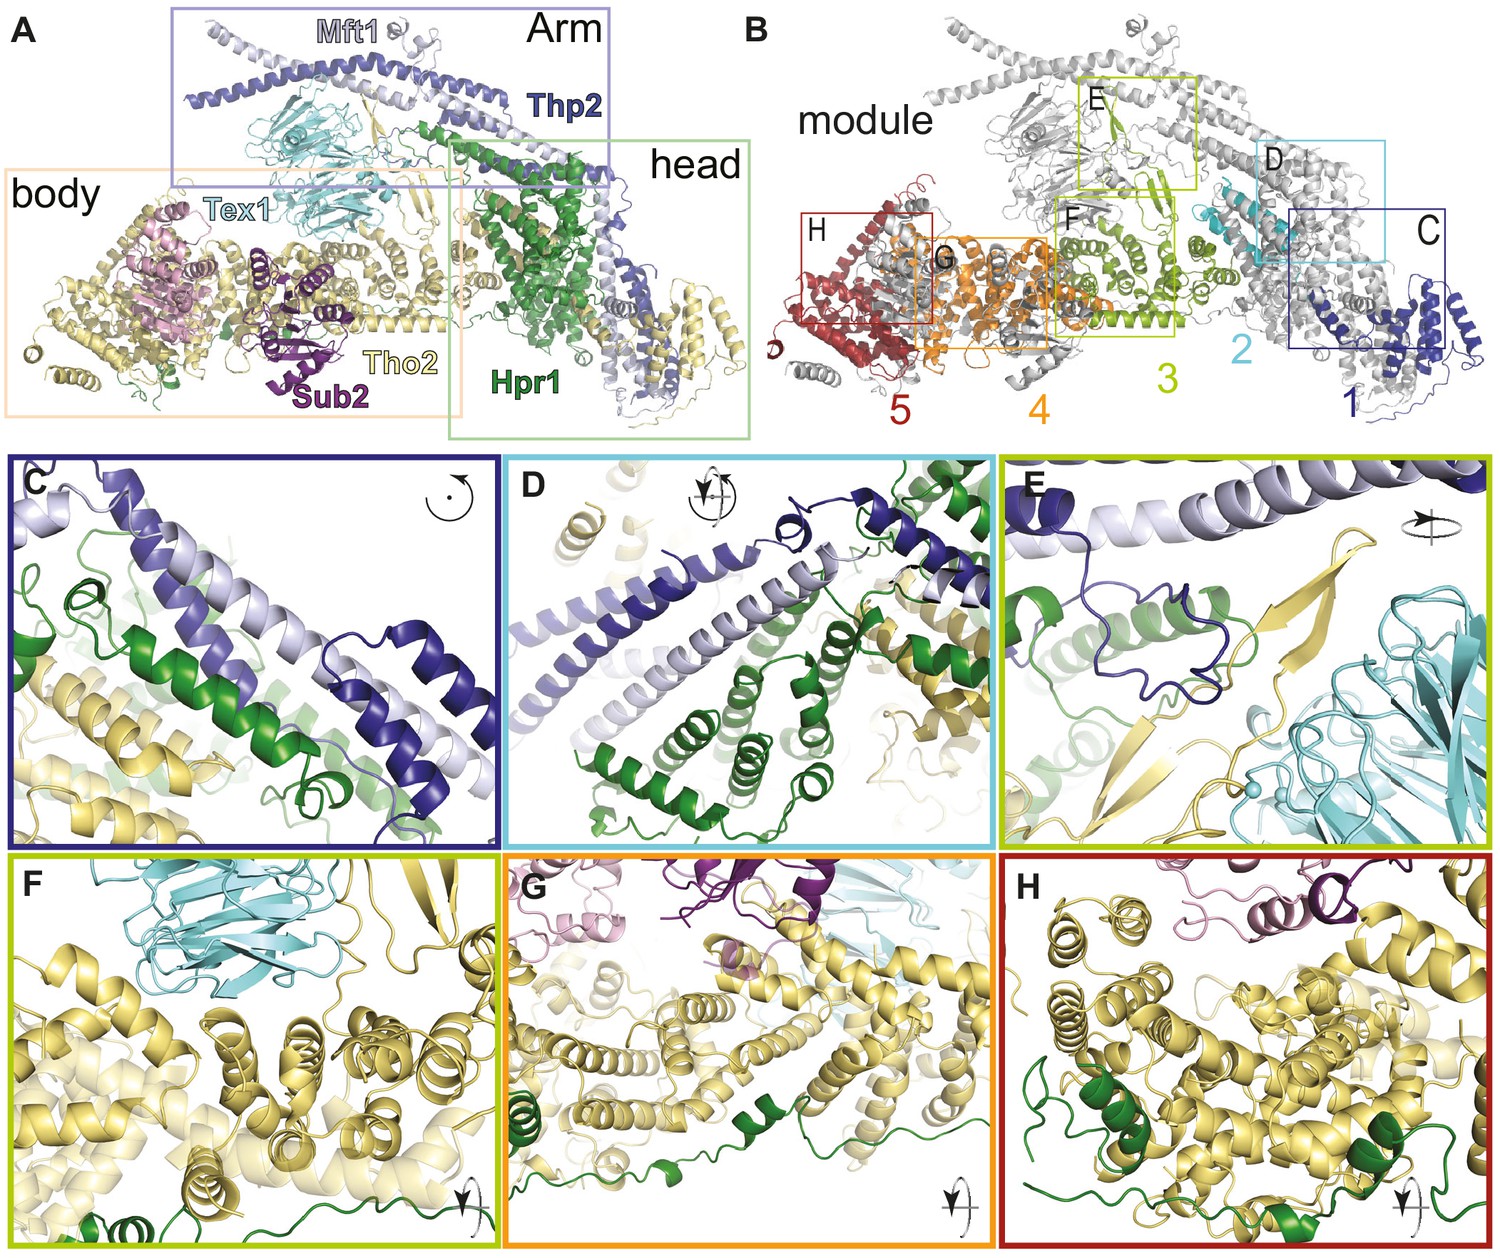
THO complex is built from intertwined conserved interactions.
(A) Front view of the THO-Sub2 rigid protomer shown as a cartoon backbone representation. (B) Same view as A with the five modules of the Tho2-Hpr1 platform in different colors. The rectangles highlight the position of the zoom-ins shown in panels C–H. (C–H) Zoom-in views showing the intermolecular interactions between different subunits of a THO-Sub2 protomer as discussed in the text. The cartoon representations show the molecule either in the same view as panel A or after the indicated rotation. Interactions are shown between: (C) Tho2-Hpr1 module-1 and the N-terminal portion of the Mft1-Thp2 coiled-coil; (D) module-2 and central portion of the Mft1-Thp2 coiled-coil; (E) module-3 interactions: Tho2 β-hairpin, bottom surface of Tex1, and loop from the C-terminal Mft1-Thp2 coiled-coil region; (F) Tho2-Hpr1 module-3 and curved surface of Tex1 β-propeller; (G) Tho2-Hpr1 module-4 and Sub2 RecA2 domain; (H) Tho2-Hpr1 module-5 and Sub2 RecA1 domain.
Figure 3—figure supplement 1
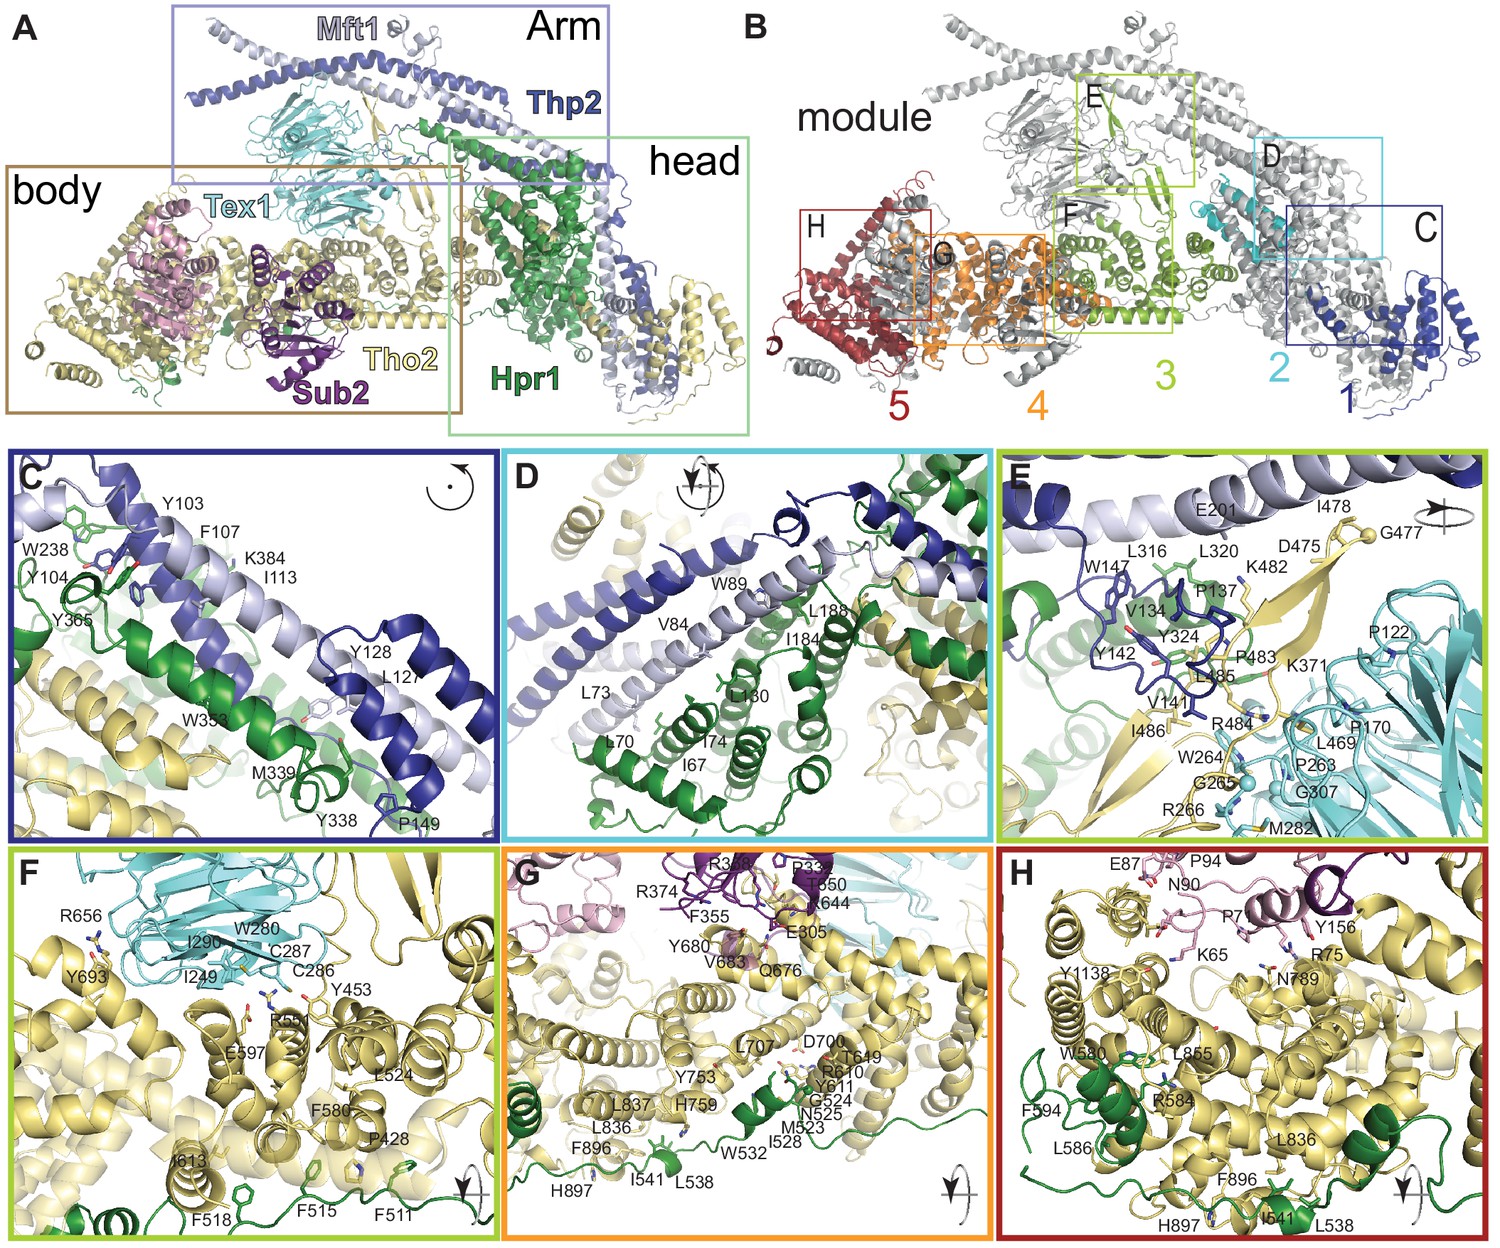
Structural features of the THO complex.
THO-Sub2 rigid protomer (front view) shown in cartoon backbone representation (colors are as in Figure 2). The rectangles highlight the position of the zoom-ins shown in panels C–H (identical to Figure 3). Interacting and evolutionary conserved residues (see alignments in Figure 3—figure supplements 2–5 are shown as sticks and labeled. Although Mft1 and Thp2 share little conservation with their metazoan orthologues, the surfaces to which they bind on Tho2-Hpr1 contain evolutionary conserved residues (Figure 3—figure supplements 1–5), suggesting they may share conserved architectural features.
Figure 3—figure supplement 2
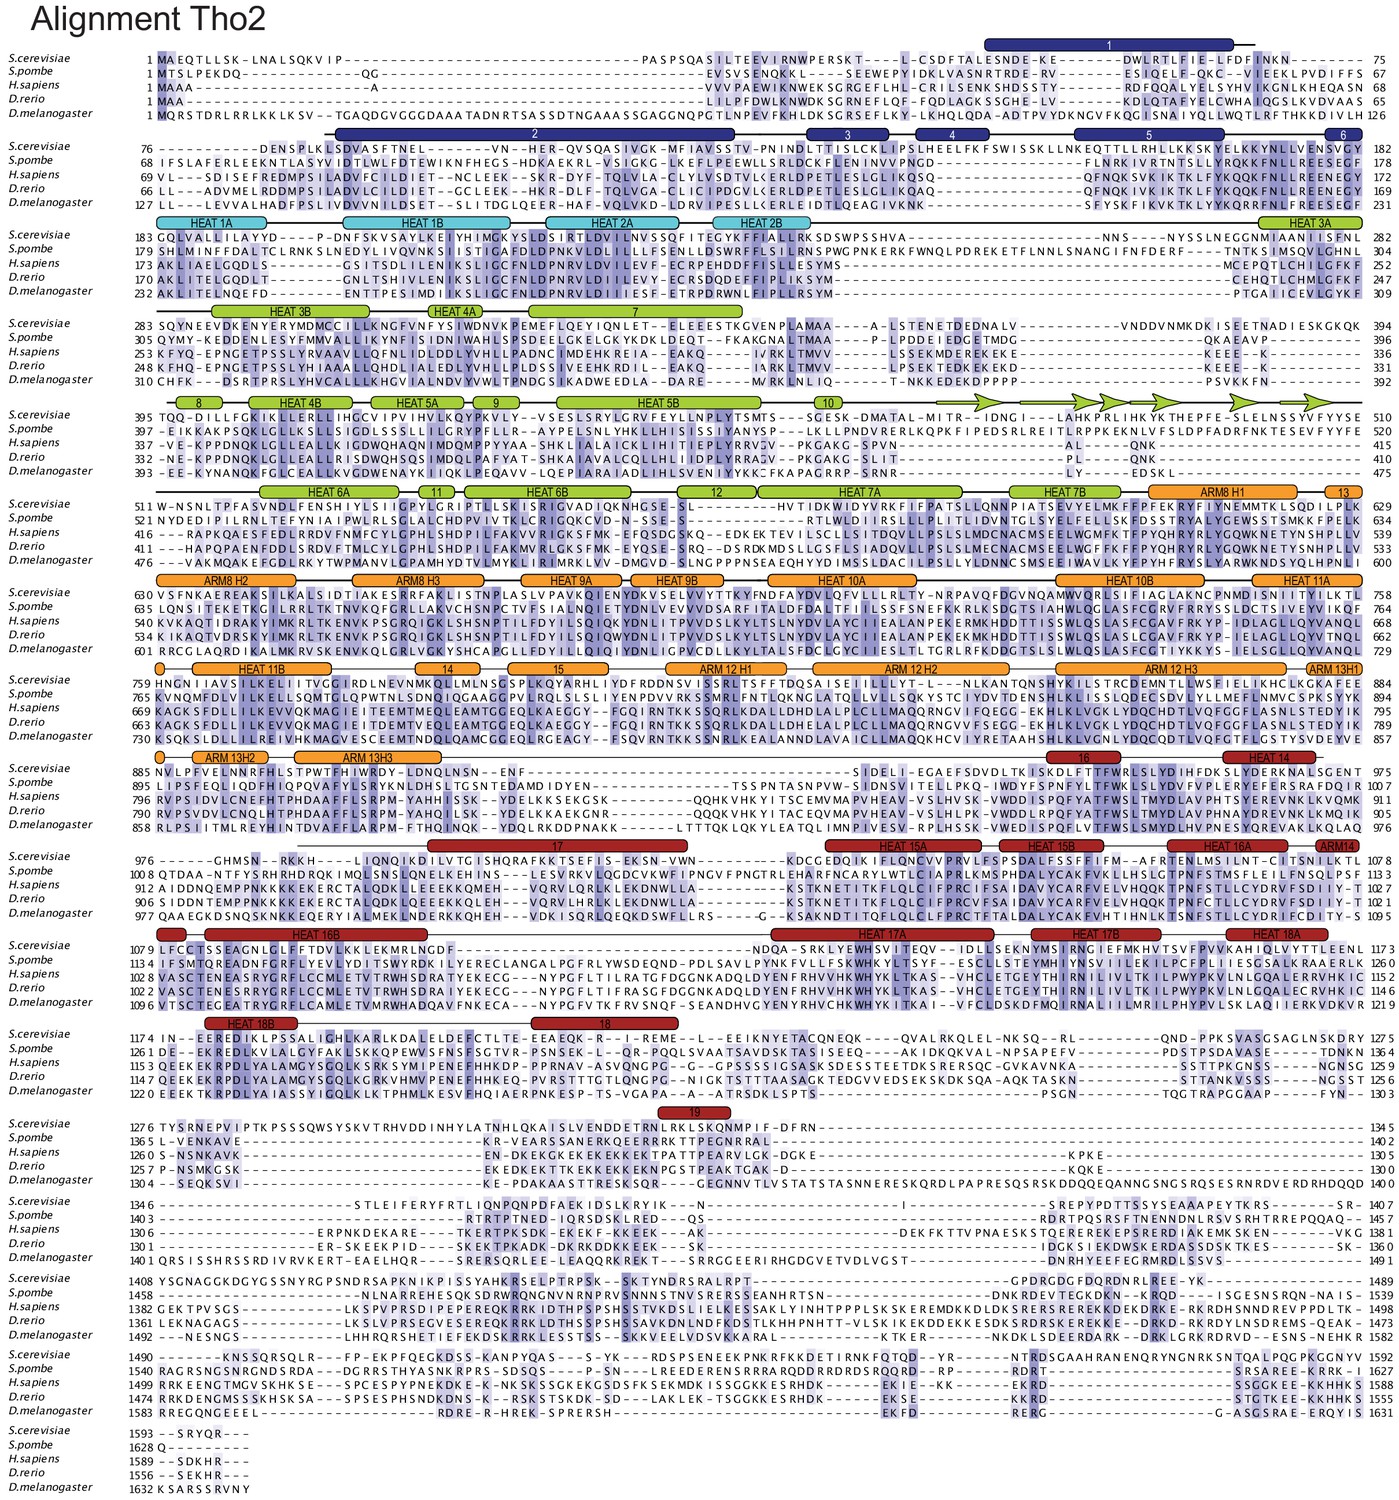
Tho2 structure-based sequence alignment.
The sequence alignment includes Tho2 orthologues from Saccharomyces cerevisiae (P53552), Schizosaccharomyces pombe (Q09779), Homo sapiens (Q8NI27), Danio rerio (F1R5B5), and Drosophila melanogaster (E2QCS8). The secondary structure elements are shown above the sequences, labeled, and colored according to the modules (module-1 to -5) as in Figure 3B Conserved residues are highlighted with color, with darker shades of slate-blue indicating high conservation. This and all other sequence alignments were generated using T-coffee (Notredame et al., 2000).
Figure 3—figure supplement 3
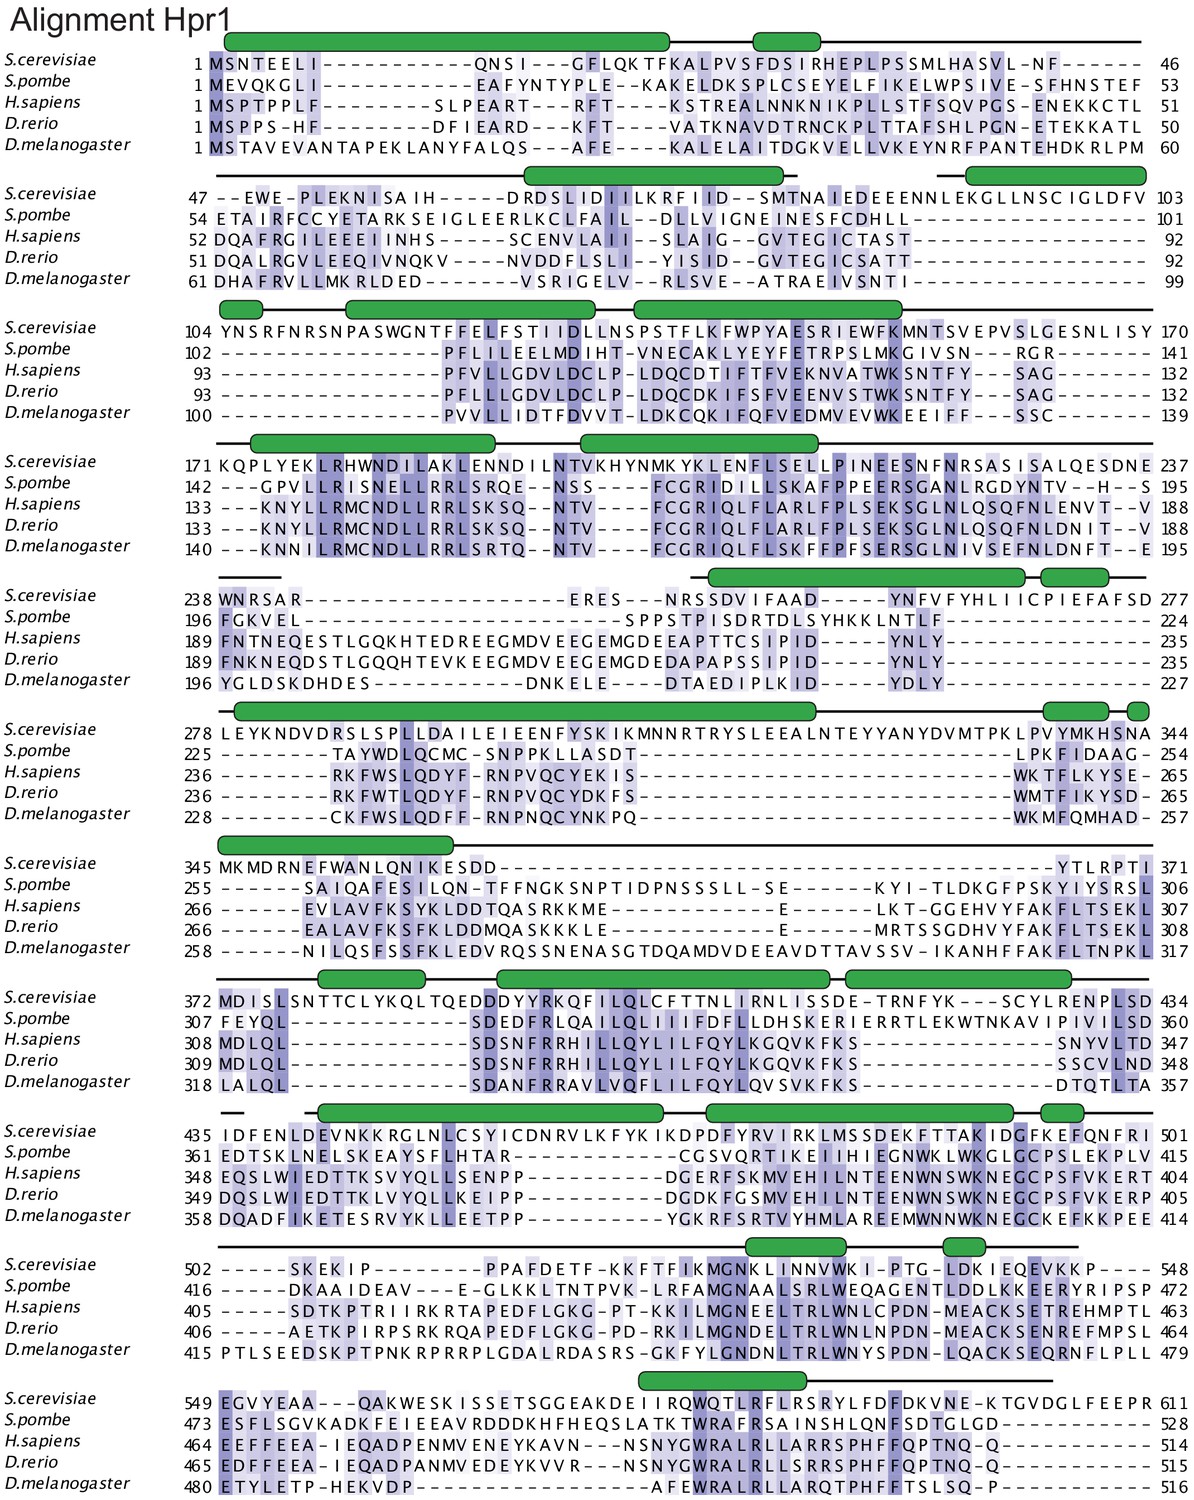
Hpr1 structure-based sequence alignment.
The sequence alignment includes the structured elements of Hpr1 orthologues from Saccharomyces cerevisiae (P17629), Schizosaccharomyces pombe (Q9URT2), Homo sapiens (Q96FV9), Danio rerio (Q7SYB2), and Drosophila melanogaster (Q9VNI8). The secondary structure elements are shown above the sequences and colored in green. The HEAT repeats of the small lobe are labeled. Conserved residues are highlighted with color, with darker shades of slate-blue indicating high conservation.
Figure 3—figure supplement 4
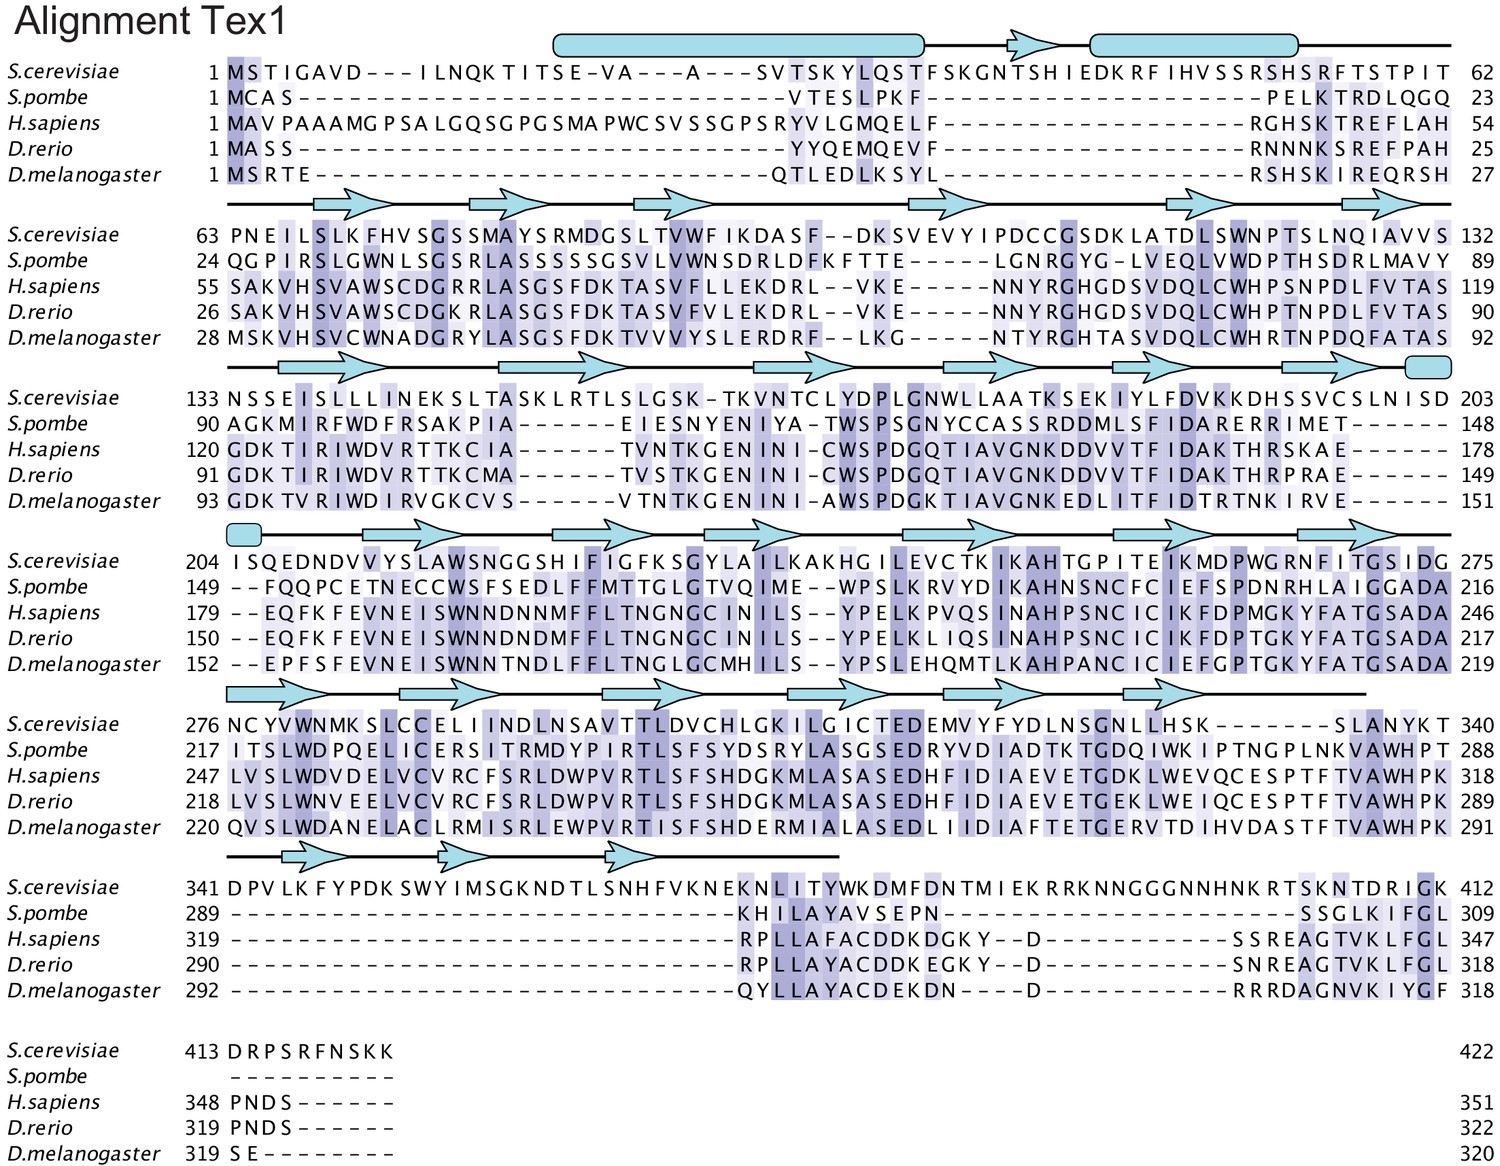
Tex1 structure-based sequence alignment.
The sequence alignment includes Tex1 orthologues from Saccharomyces cerevisiae (P53851), Schizosaccharomyces pombe (Q9USL1), Homo sapiens (Q96J01), Danio rerio (Q6AXK9), and Drosophila melanogaster (Q9VHT2). The secondary structure elements are shown above the sequences, labeled and colored in cyan. Conserved residues are highlighted with color, with darker shades of slate-blue indicating high conservation.
Figure 3—figure supplement 5
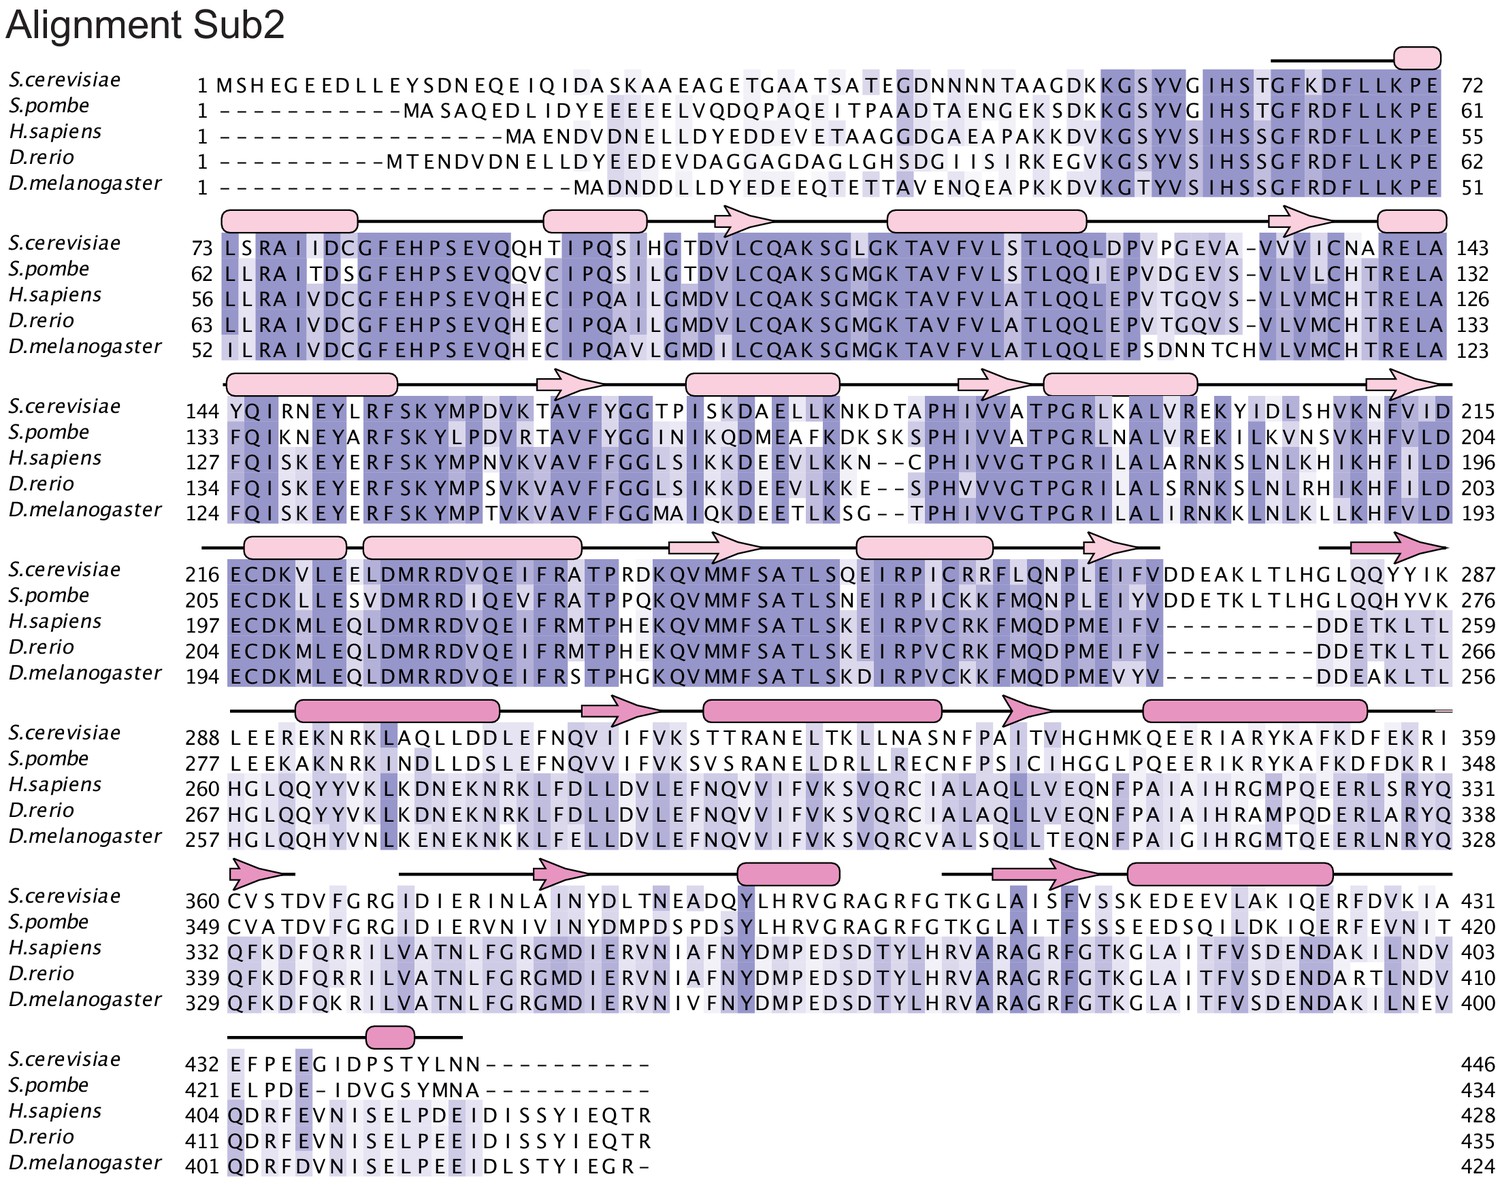
Sub2 structure-based sequence alignment.
The sequence alignment includes Sub2 orthologues from Saccharomyces cerevisiae (Q07478), Schizosaccharomyces pombe (O13792), Homo sapiens (Q13838), Danio rerio (Q7SXU7), and Drosophila melanogaster (Q27268). The secondary structure elements are shown above the sequences and colored in light pink for RecA1 and dark pink for RecA2. Conserved residues are highlighted with color, with darker shades of slate-blue indicating high conservation.
Figure 4 with 1 supplement
THO homodimerization properties.
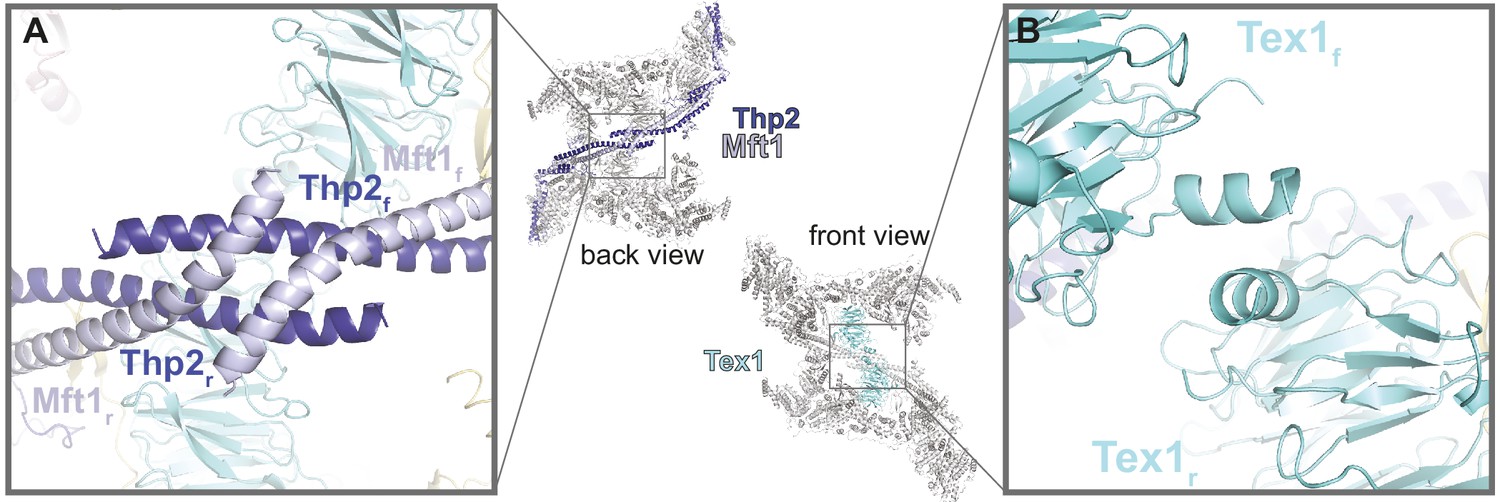
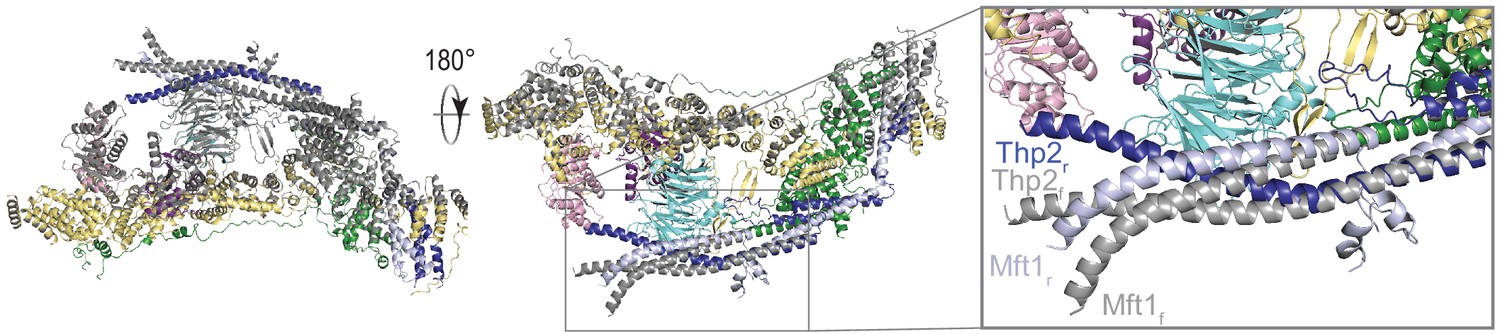
The central panel shows the back and front views of the THO-Sub2 homodimer, with the whole complex in gray except the dimerization elements highlighted in color: the two Mft1-Thp2 protomers (back view) and the two Tex1 protomers (front view). (A) Zoom-in view of the dimerization interface between the C-terminal coiled-coil portions of Mft1 and Thp2 rigid (r) and flexible (f) protomers (back view of the complex). (B) Zoom-in view of the dimerization interface between the N-terminal helices of the two Tex1 protomers (front view of the complex).
Figure 4—figure supplement 1
Superposition of the two THO protomers.
The flexible protomer (colored in gray) is aligned on the rigid protomer (colored as in Figure 2). The coiled-coils of Mft1-Thp2 start to bend at the point where the Tho2 β-hairpin is close to Mft1 and then cross over to form the dimerization interface.
Figure 5 with 1 supplement
Sub2-activated conformation at the proximal side of the THO homodimer.
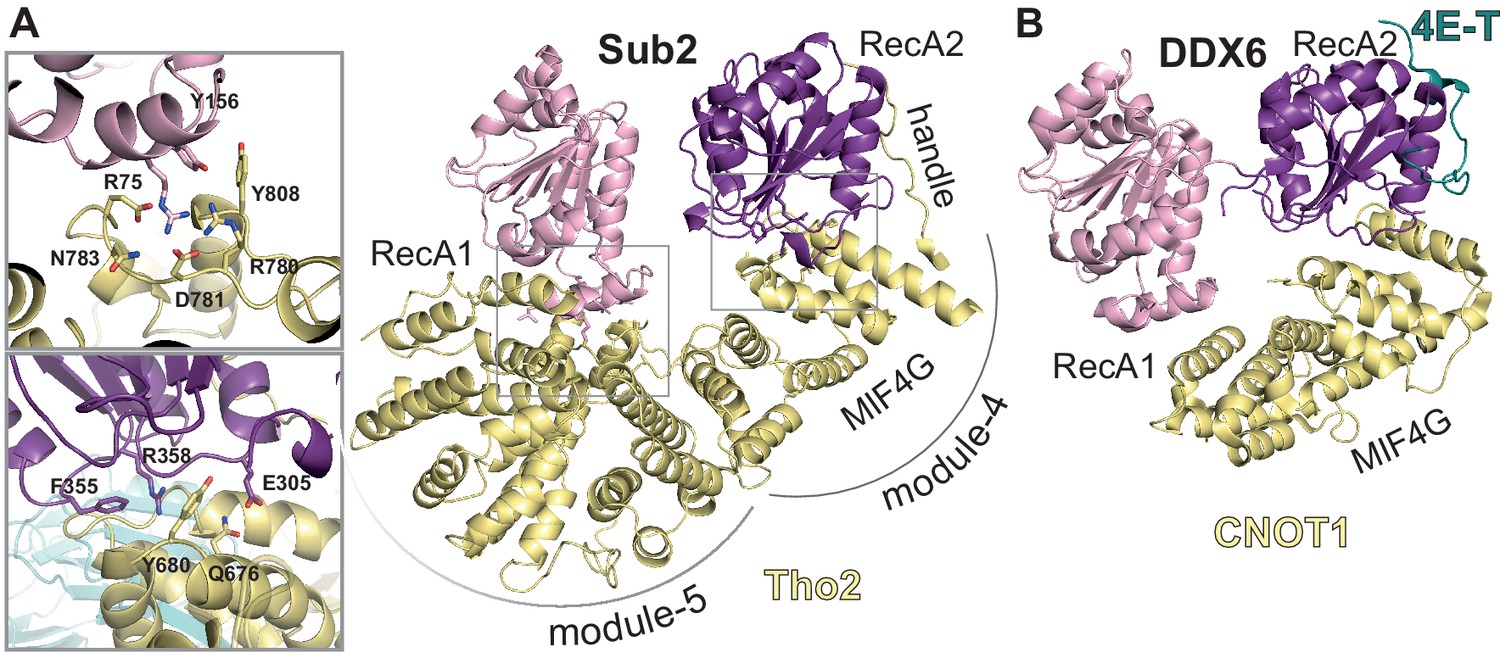
(A) Sub2-Tho2 interaction at the proximal side. The zoom views show a subset of conserved interacting residues. See also Figure 3—figure supplements 2 and 5. (B) Structure of DDX6-CNOT1-4ET (Ozgur et al., 2015a) shown in the same orientation as Sub2-Tho2 in panel A after superposition of their RecA2 domains. Note that the Tho2 ‘handle’ binds RecA2 at the equivalent position as protein 4E-T.
Figure 5—figure supplement 1
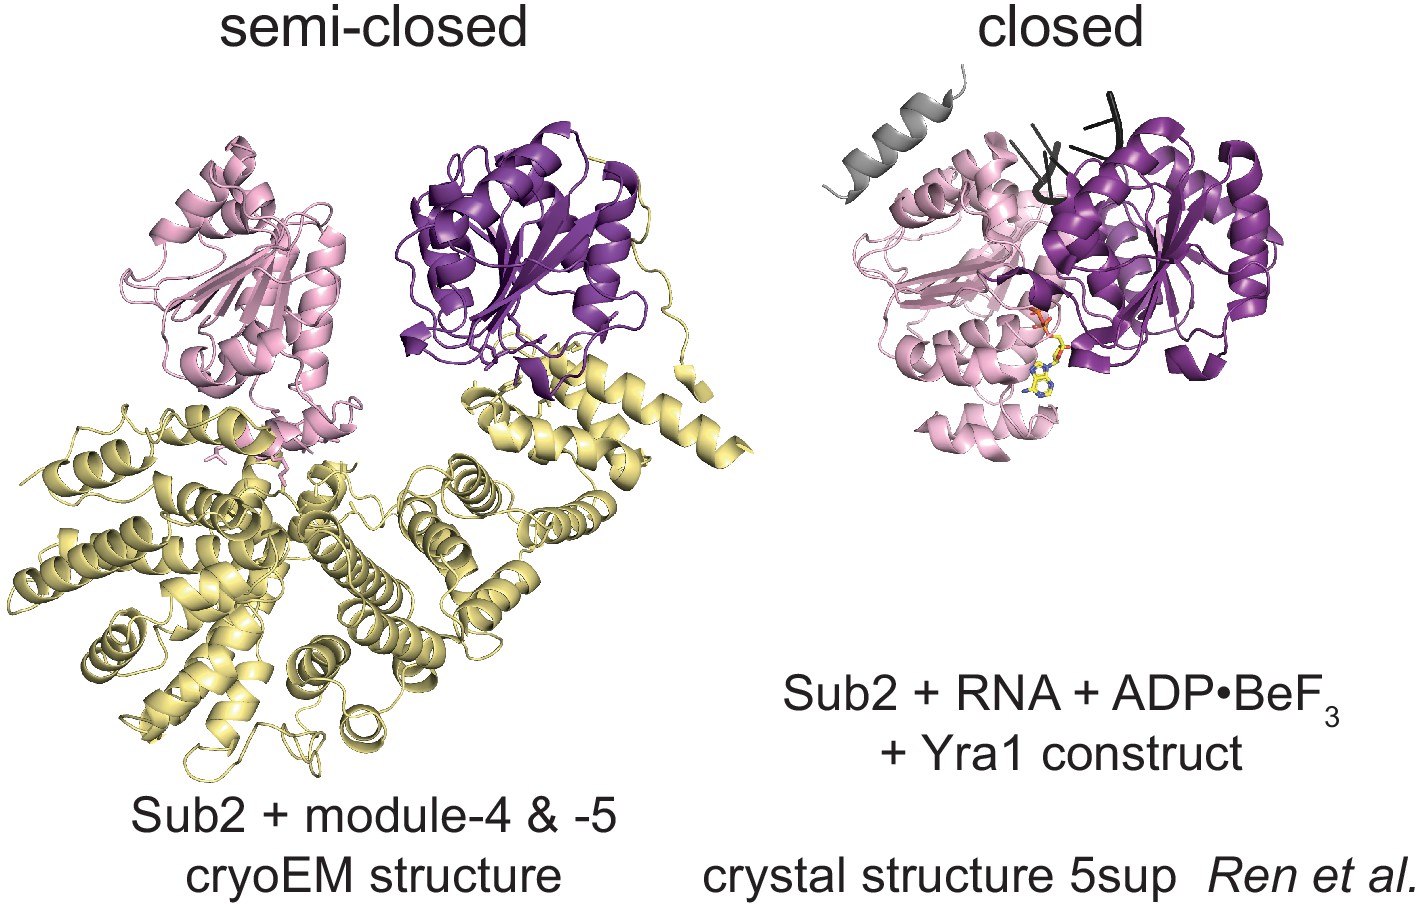
Conformational states of Sub2.
Comparison of the activated semi-closed Sub2 structure as found at the proximal side of the THO homodimer cryo-electron microscopy structure with the conformation of active Sub2, bound to RNA, nucleotide, and the C-terminal motif of Yra1 (C-box) (Ren et al., 2017). All structures are aligned on the N-terminal RecA1 domain. The RecA1 domain is colored in light-pink, the RecA2 in purple, and Yra1 in gray. RNA is shown in black and nucleotide in yellow.
Figure 6 with 1 supplement
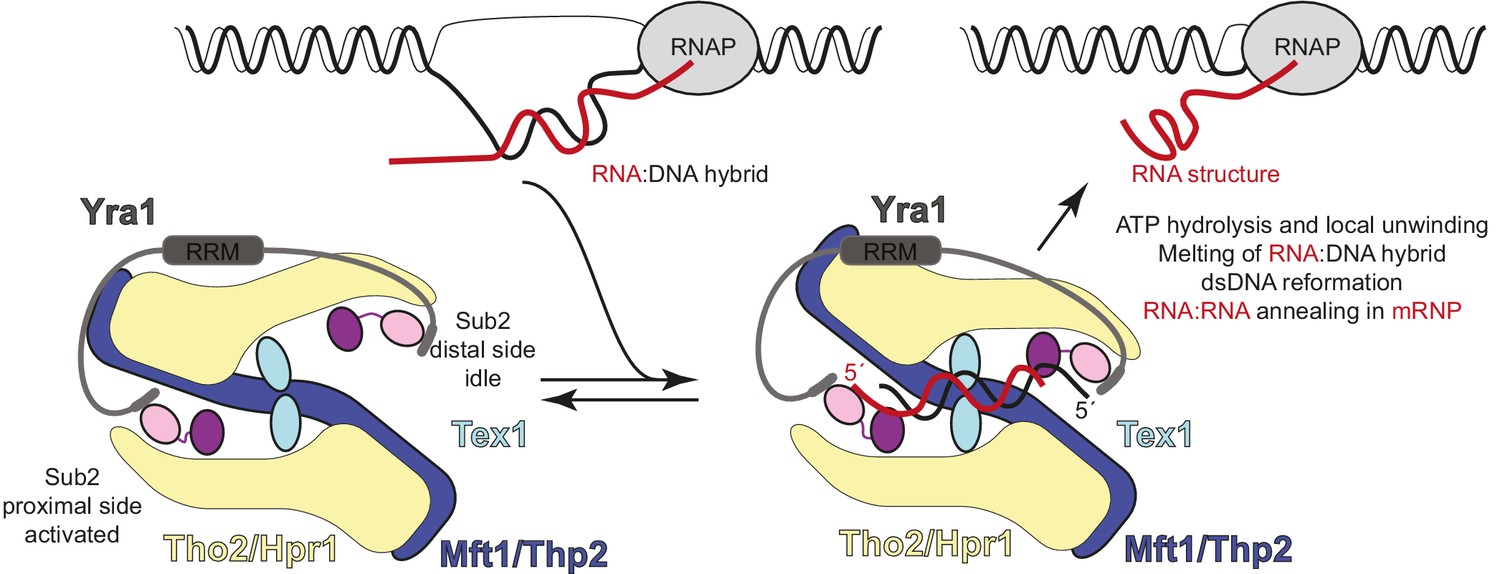
Hypothetical model of transcription-export (TREX) molecular mechanisms.
Schematic depicts the TREX complex: on the left at resting state, with Yra1 bound to the Sub2 RecA1 domains via its N-box and C-box motifs (Ren et al., 2017); on the right in a substrate-binding state, with an RNA:DNA hybrid positioning the 5’ ends of the RNA (red) and DNA (black) strands at the two opposite RecA1 domains (see also Figure 6—figure supplement 1). Binding of the RNA strand to the activated Sub2 would require changes in their relative orientation. In this hypothetical model, the energy released at the RNA-dependent ATP hydrolysis step is harnessed in a mechanical movement as the separated strands are dissociated and the complex returns to the resting state. The involvement of such mechanical force explains how incorporation in the complex may allow Sub2 to resolve RNA:DNA hybrids that would otherwise be too long to be melted by a DEAD-box protein in isolation (García-Pichardo et al., 2017; Linder and Jankowsky, 2011).
Figure 6—figure supplement 1
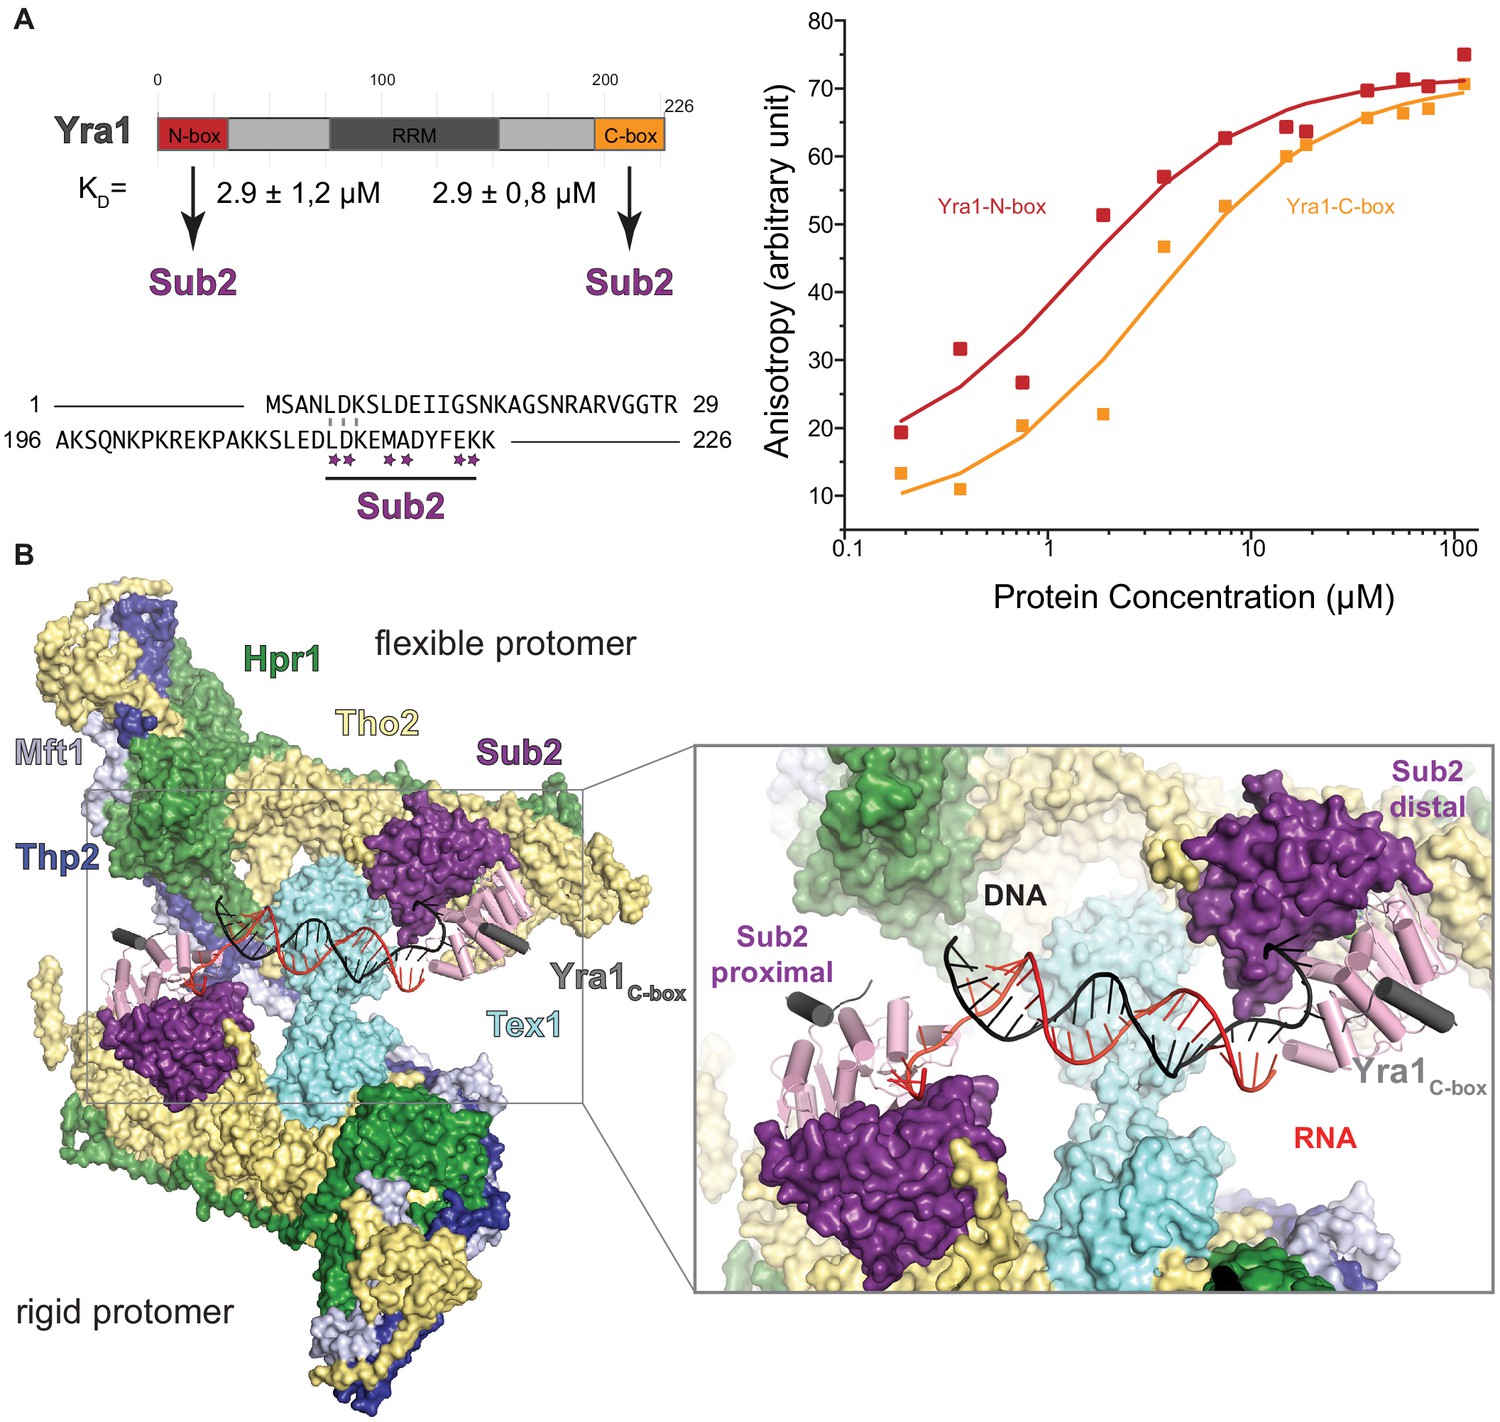
Hypothetical model of THO-Sub2-Yra1 (transcription-export) in binding RNA:DNA hybrids.
(A) The scheme on the top left shows the domain organization of Yra1. The N-terminal and C-terminal regions of Yra1 bind to Sub2 with similar affinities as measured in the fluorescence anisotropy experiment on the right panel. In this experiment, we used fluorescent peptides corresponding to the N-terminal and C-terminal regions flanking the RRM, with sequences shown at the bottom right panel, in an alignment that highlights the similarities between the two motifs. Stars indicate residues that are involved in binding the C-box to Sub2 (Ren et al., 2017). The peptides were labeled with a 5’−6-carboxy-fluorescein (6-FAM), dissolved to a concentration of 10 nM and incubated with Sub2 for 20 min at different concentrations in a buffer containing 20 mM Tris-HCl (pH 7.4), 250 mM NaCl, and 2 mM dithiothreitol, at 20°C in 50 µl reactions on an Infinite (Tecan). The excitation and emission wavelengths were 485 and 535 nm, respectively. Each titration point was measured three times using 10 reads with an integration time of 40 µs. The data were analyzed by nonlinear regression fitting using the BIOEQS software. Both peptides bound Sub2 with a similarity affinity, with a Kd of 2.9 μM. (B) Hypothetical model of RNA:DNA hybrid recognition by THO. The cryo-EM structure of THO and Sub2 RecA2 is presented in surface representation. In the cartoon surface representation, the model is based on the superposition with the Sub2–RNA–ADP BeFx structure with Yra1 C-box (in gray, [Ren et al., 2017]) and fitted with an RNA:DNA hybrid (pdb code 1hys) as it positions the 5’ ends of the RNA (red) and DNA (black) strands at the two opposite RecA1 domains. The duplex could bind Sub2 similarly to what has been reported for the DEAD-box protein Mss16 (Mallam et al., 2012) and consistently with the properties of the human orthologue (Pérez-Calero et al., 2020).
Videos
Video 1
Dynamic character of the complex extracted from cryo-electron microscopy data.
Variance analysis of the THO-Sub2 complex structure, showing the swiveling motion of the two protomers with respect to each other.
Tables
Key resources table
| Reagent type (species) or resource | Designation | Source or reference | Identifiers | Additional information |
|---|---|---|---|---|
| Strain, strain background (Escherichia coli) | BL21 Star (DE3) pRARE | EMBL Heidelberg Core Facility | Electrocompetent cells | |
| Cell line (Spodoptera frugiperda) | IPLB-Sf21-AE | Gibco | ||
| Cell line (Trichoplusia ni) | BTI-Tn-5B1-4 | Gibco | ||
| Strain, strain background (Saccharomyces cerevisiae) | BY4741 (MATa) yeast | Euroscarf | Y00000 | |
| Strain, strain background (Saccharomyces cerevisiae) | BY4743 (MATa/α) yeast | Euroscarf | Y20000 | |
| Antibody | Anti-protein-A IgG (mouse, monoclonal) | Sigma Aldrich | P2921 | (1:333 dilution) |
| Recombinant DNA reagent | Tho2 | This paper (Materials and methods) | Uniprot P53552 | pFastBac Hta-Tho2 Conti Lab |
| Recombinant DNA reagent | Hpr1 | This paper (Materials and methods) | Uniprot P17629 | pFastBac Hta-Hpr1 Conti Lab |
| Recombinant DNA reagent | Mft1 | This paper (Materials and methods) | Uniprot P33441 | pFastBac Hta-Mft1 Conti Lab |
| Recombinant DNA reagent | Thp2 | This paper (Materials and methods) | Uniprot O13539 | pFastBac Hta-Thp2 Conti Lab |
| Recombinant DNA reagent | Tex1 | This paper (Materials and methods) | Uniprot P53851 | pFastBac Hta-Tex1 Conti Lab |
| Recombinant DNA reagent | Sub2 | This paper (Materials and methods) | Uniprot Q07478 | 3C-GST-fusion Conti Lab |
| Recombinant DNA reagent | GFP-Sub2 | This paper (Materials and methods) | Conti Lab | |
| Commercial assay or kit | Bac-to-Bac Baculovirus Expression System | ThermoFisher Scientific | ||
| Software, algorithm | SerialEM | https://bio3d.colorado.edu/SerialEM/ | SerialEM_3-8- 0beta8_64 & SerialEM_3-8- 0beta11_64 | |
| Software, algorithm | Focus | https://focus.c-cina.unibas.ch/ wiki/doku.php | v 1.1.0 | |
| Software, algorithm | cryosparc | doi: 10.1038/nmeth.4169 | Cryosparc2 | |
| Software, algorithm | CTFfind4 | doi: 10.1016/j.jsb.2015.08.008 | ||
| Software, algorithm | TOPAZ | doi: 10.1038/s41592-019-0575-8 | ||
| Software, algorithm | UCSF Chimera | UCSF, https://www.cgl.ucsf.edu/chimera/ | ||
| Software, algorithm | UCSF ChimeraX | UCSF, https://www.rbvi.ucsf.edu/chimerax/ | ||
| Software, algorithm | COOT | http://www2.mrc-lmb.cam.ac.uk/ personal/pemsley/coot/ | 0.9 | |
| Software, algorithm | Phenix | https://www.phenix-online.org/ | PHENIX 1.18 | |
| Software, algorithm | Molprobity | Duke Biochemistry, http://molprobity.biochem.duke.edu/ | ||
| Software, algorithm | PyMol 2 | PyMOL Molecular Graphics System, Schrodinger LLC | PyMOL 2.1 |
Additional files
-
Supplementary file 1
Cryo-electron microscopy data collection, refinement, and validation statistics.
- https://cdn.elifesciences.org/articles/61467/elife-61467-supp1-v3.docx
-
Transparent reporting form
- https://cdn.elifesciences.org/articles/61467/elife-61467-transrepform-v3.docx
Download links
A two-part list of links to download the article, or parts of the article, in various formats.
Downloads (link to download the article as PDF)
Open citations (links to open the citations from this article in various online reference manager services)
Cite this article (links to download the citations from this article in formats compatible with various reference manager tools)
Structural insights into the nucleic acid remodeling mechanisms of the yeast THO-Sub2 complex
eLife 9:e61467.
https://doi.org/10.7554/eLife.61467


