Loss of FLCN-FNIP1/2 induces a non-canonical interferon response in human renal tubular epithelial cells
- Amsterdam UMC, location VUmc, Vrije Universiteit Amsterdam, Clinical Genetics, Cancer Center Amsterdam, Netherlands
- Amsterdam UMC, location VUmc, Vrije Universiteit Amsterdam, Medical Oncology, Cancer Center Amsterdam, Netherlands
- University Medical Center Utrecht, Center for Molecular Medicine, Molecular Cancer Research, Universiteitsweg, Netherlands
- Princess Máxima Center for Pediatric Oncology, Oncode Institute, Heidelberglaan, Netherlands
- Amsterdam UMC, location VUmc, Vrije Universiteit Amsterdam, Clinical Genetics, Netherlands
- NKI-AvL, Biostatistics Unit, Netherlands
Figures
Figure 1 with 1 supplement
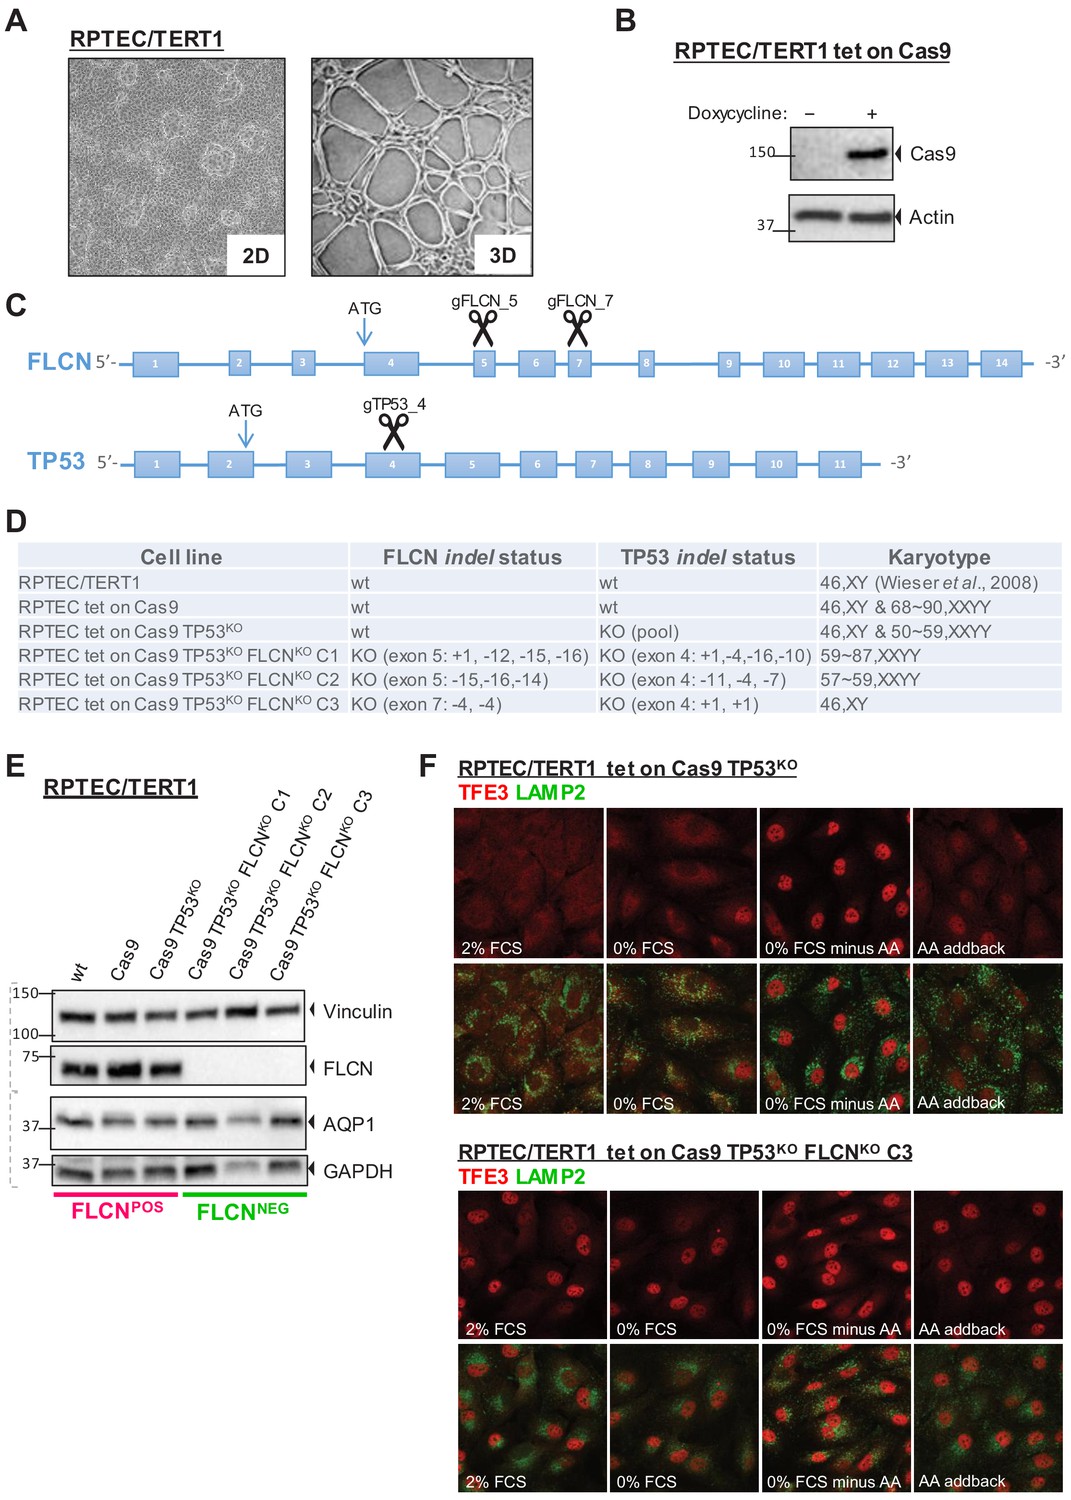
Renal proximal tubular epithelial cells as a model for FLCN loss.
(A) Brightfield images (×50 magnification) of a human renal proximal tubular epithelial cell model (RPTEC/TERT1). Left image shows 2D culture of cells with typical dome formation. Right image shows 3D tubular structures that form when RPTECs are cultured according to Secker, 2018. (B) Doxycycline-inducible Cas9 expression of RPTEC tet-on Cas9 cell line. Cas9 protein expression after 24 hr treatment with 10 ng/ml doxycycline was assessed by immunoblotting. Experiment was performed twice. (C) CRISPR/Cas9-mediated knockout strategy of FLCN and TP53 in RPTEC/TERT1 cells; gRNAs were designed to target early exons of FLCN and TP53 coding regions. (D) Overview of FLCN and TP53 indel status and karyotype per selected cell line clone. Cell-line-specific Sanger sequence chromatograms are shown in Figure 1—figure supplement 1A. (E) Western blot of FLCN protein levels of indicated cell line clones. Expression of renal proximal tubular-specific marker AQP1 is shown as a control. Dotted lines indicate separate blots. Western blot of TP53 protein levels is shown in Figure 1—figure supplement 1B. (F) Immunofluorescence staining of TFE3 and lysosomal marker LAMP2 show enhanced nuclear TFE3 upon FLCN loss independent of nutrient availability. FCS = fetal calf serum, AA = amino acids. Staining of FLCNKO RPTEC C1 and C2 are shown in Figure 1—figure supplement 1C.
Figure 1—figure supplement 1
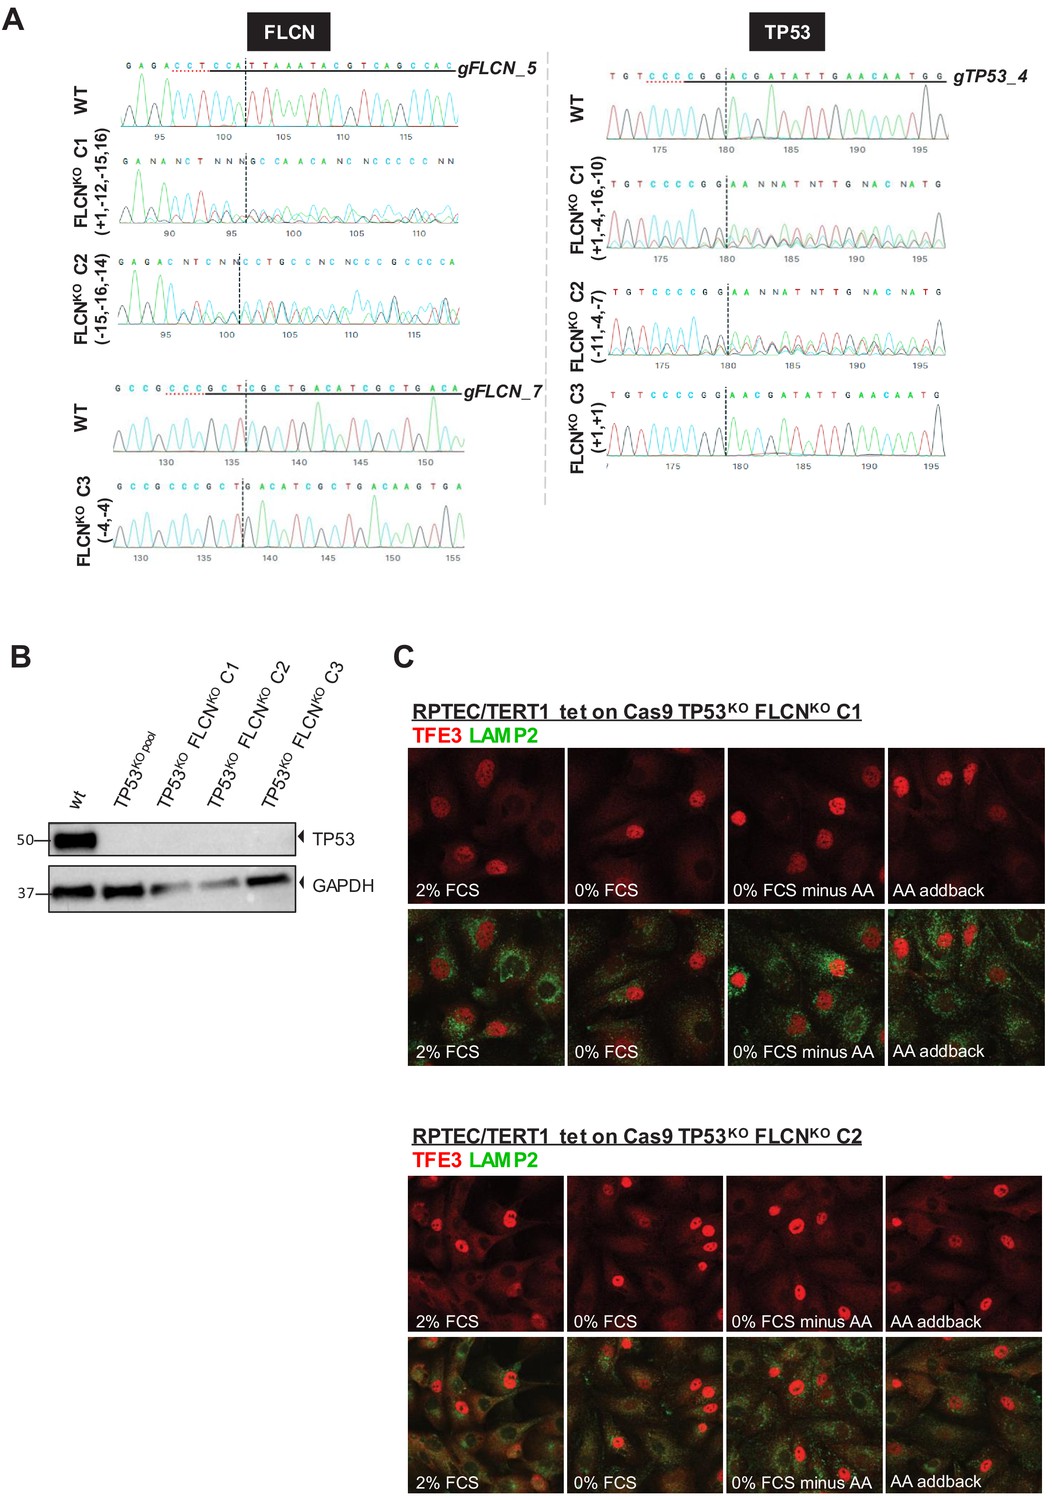
Characterization of TP53KO and FLCNKO cell lines.
(A) Sanger sequence chromatograms of genomic DNA isolated from each modified RPTEC cell line. Indel analysis was performed with the on-line Inference of CRISPR Editing (ICE) tool of Synthego. Left column shows FLCN sequences, right column shows TP53 sequences. (B) Western blot of TP53 protein levels of selected cell line clones upon activation of p53 pathway by Nutlin-3 treatment. Western blot was performed twice. (C) Immunofluorescence staining of TFE3 and lysosomal marker LAMP2 show enhanced nuclear TFE3 independent of nutrient availability in FLCNKO clones C1 and C2. FCS = fetal calf serum, AA = amino acids.
Figure 2 with 2 supplements
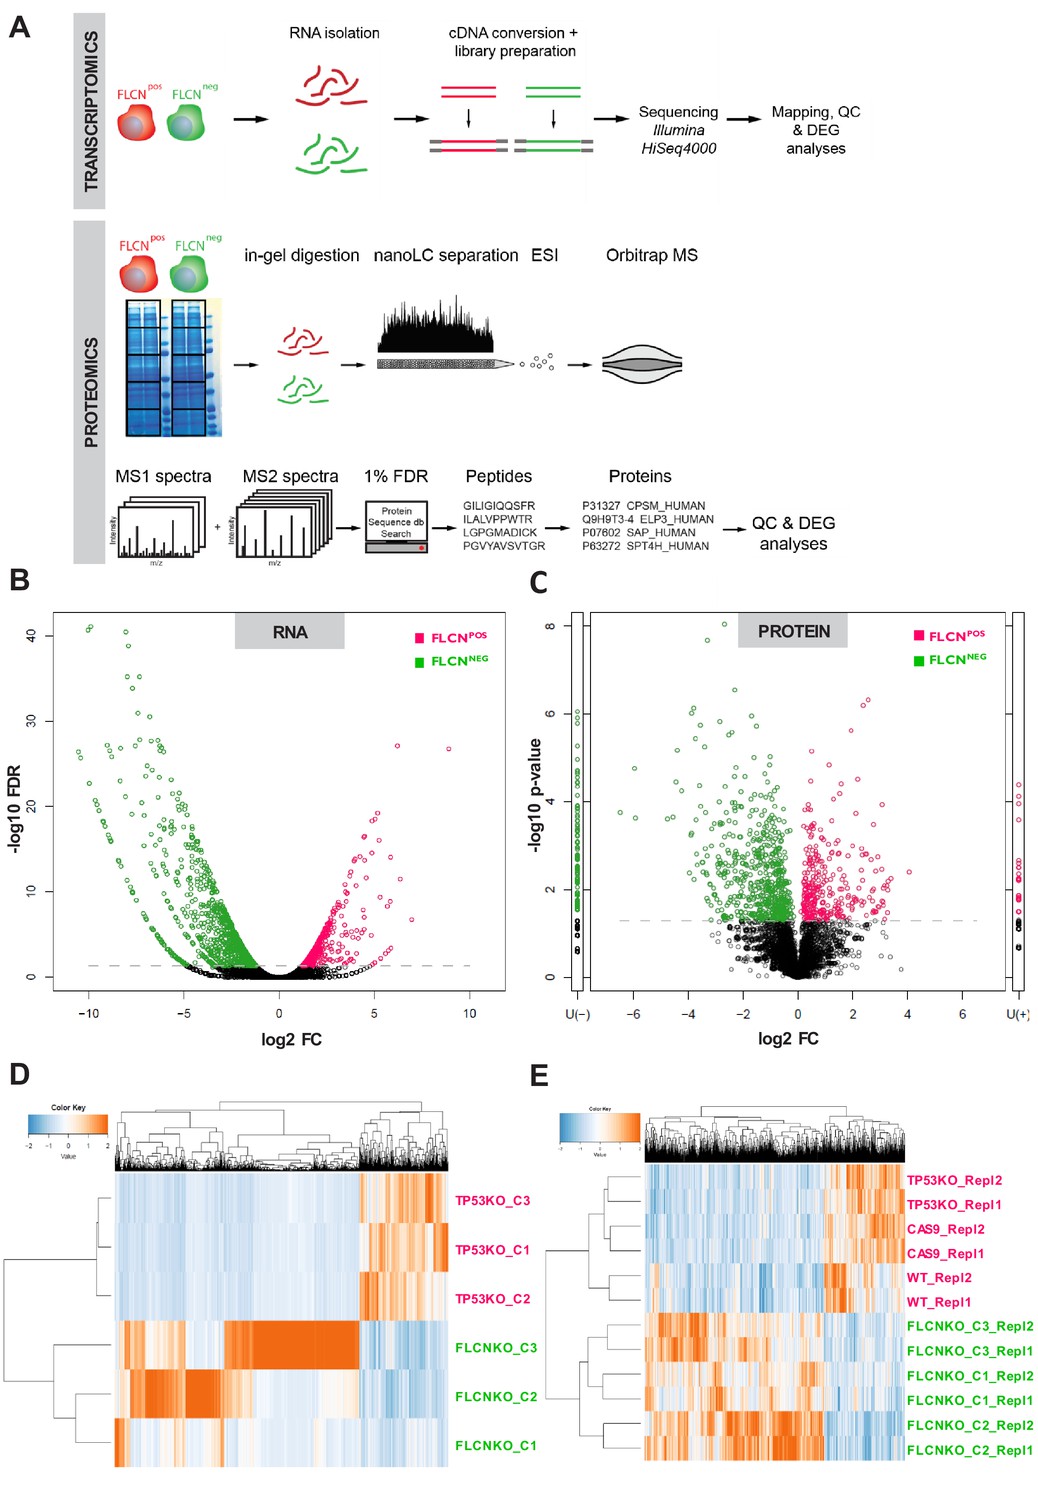
Integrated transcriptomic and proteomic analyses of renal tubular FLCN loss.
(A) Schematic overview of transcriptomic and proteomic workflows. (B) Volcano plot showing significantly increased or decreased expression of genes in FLCNPOS vs. FLCNNEG comparison derived from transcriptomic analysis. Colored circles above threshold line are FDR < 0.05; statistical details can be found in Materials and methods section. (C) Volcano plot showing (significantly) increased or decreased expression of proteins in FLCNPOS vs. FLCNNEG comparison derived from proteomic analysis. Colored circles above threshold line are p<0.05. U(-) column shows proteins uniquely detected in FLCNNEG, U(+) column shows proteins uniquely detected in FLCNPOS. Statistical details can be found in the Materials and methods section. (D) Hierarchical clustering based on FLCN-dependent differential mRNA expression. (E) Hierarchical clustering based on FLCN-dependent differential protein expression.
Figure 2—figure supplement 1
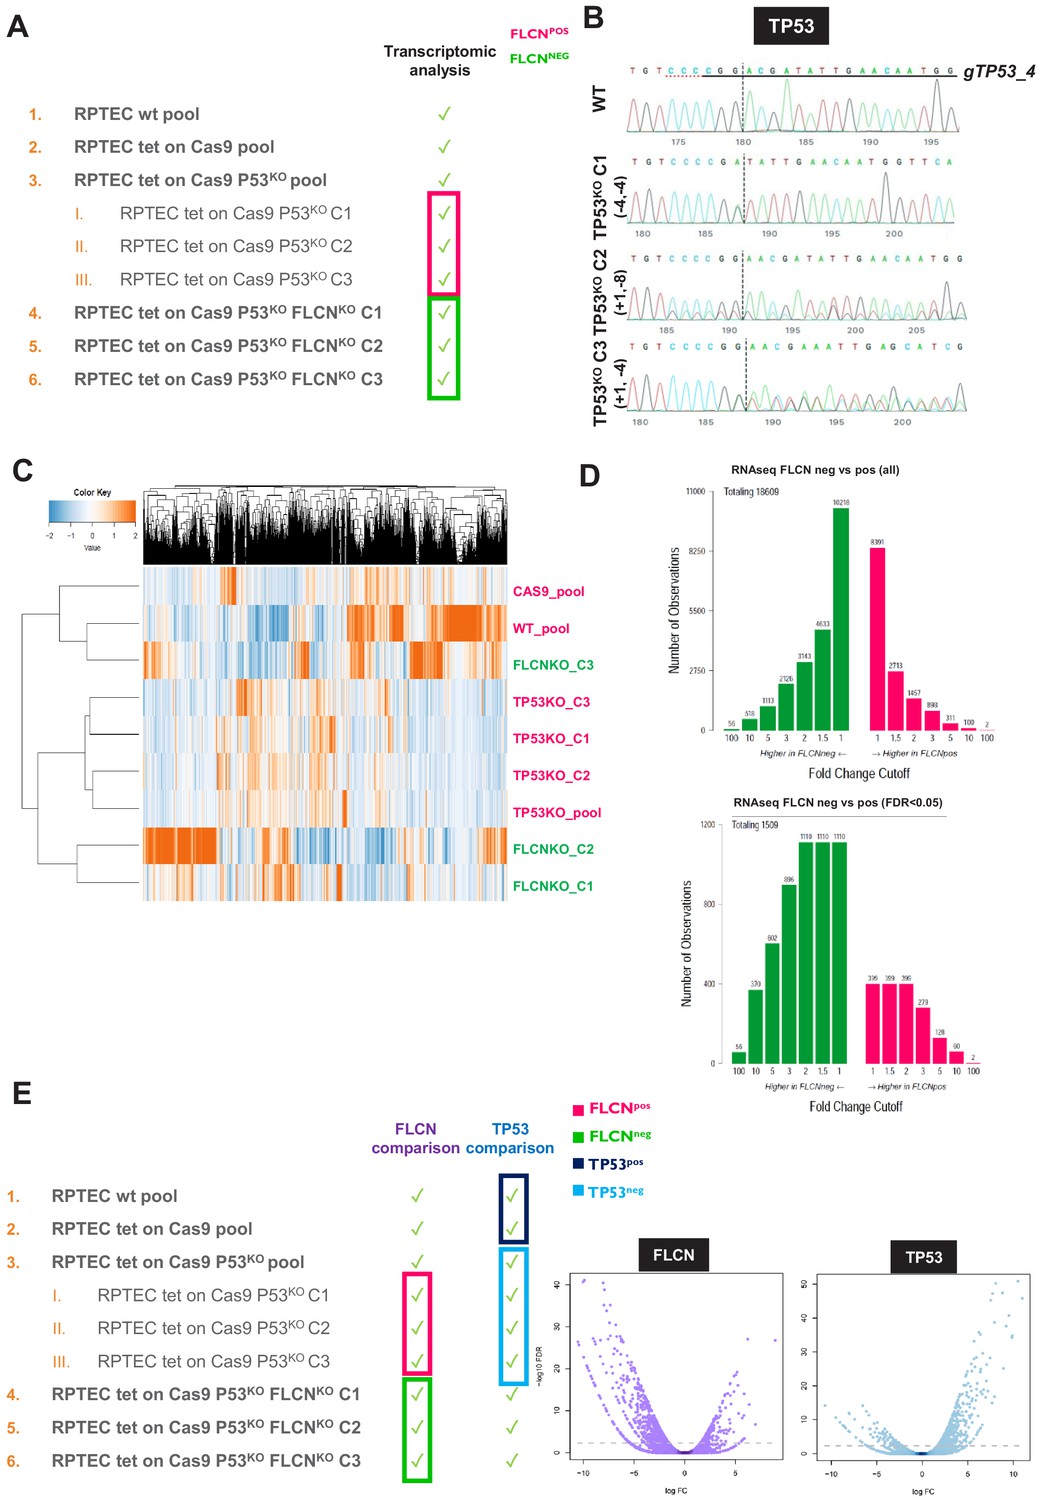
Comparative analyses of RPTEC FLCNPOS vs. FLCNNEG cell line pairs.
(A) FLCNPOS and FLCNNEG RPTEC cell lines used for RNAseq. To correct for possible clonal effects on global transcription levels, three single-cell clones (C1, C2, and C3 respectively, derived from TP53KO pool) were added to the comparison. (B) Sanger sequence chromatogram of genomic DNA isolated from TP53KO single cell line clones C1, C2, and C3. Indel analysis was performed with the Synthego CRISPR Editing (ICE) tool. (C) Unsupervised hierarchical clustering of all genes identified in RNAseq experiment of FLCNPOS vs. FLCNNEG RPTEC cell lines (TMM-normalized values). (D) Numbers of (significant, FDR < 0.05) differential genes observed in FLCNNEG and FLCNPOS RPTECs, ranked by fold change. (E) Overview of comparisons made for differential expression analyses. The purple volcano plot represents the FLCNPOS vs. FLCNNEG comparison and shows that most significant differentially expressed mRNAs are upregulated in FLCNNEG cells, identifying FLCN as a transcriptional suppressor. The blue volcano represents the TP53POS vs. TP53NEG analysis and shows, for comparison, that loss of the transcriptional activator TP53 reduces expression of the most significant differentially expressed mRNAs. Statistical details can be found in the Materials and methods section.
Figure 2—figure supplement 2
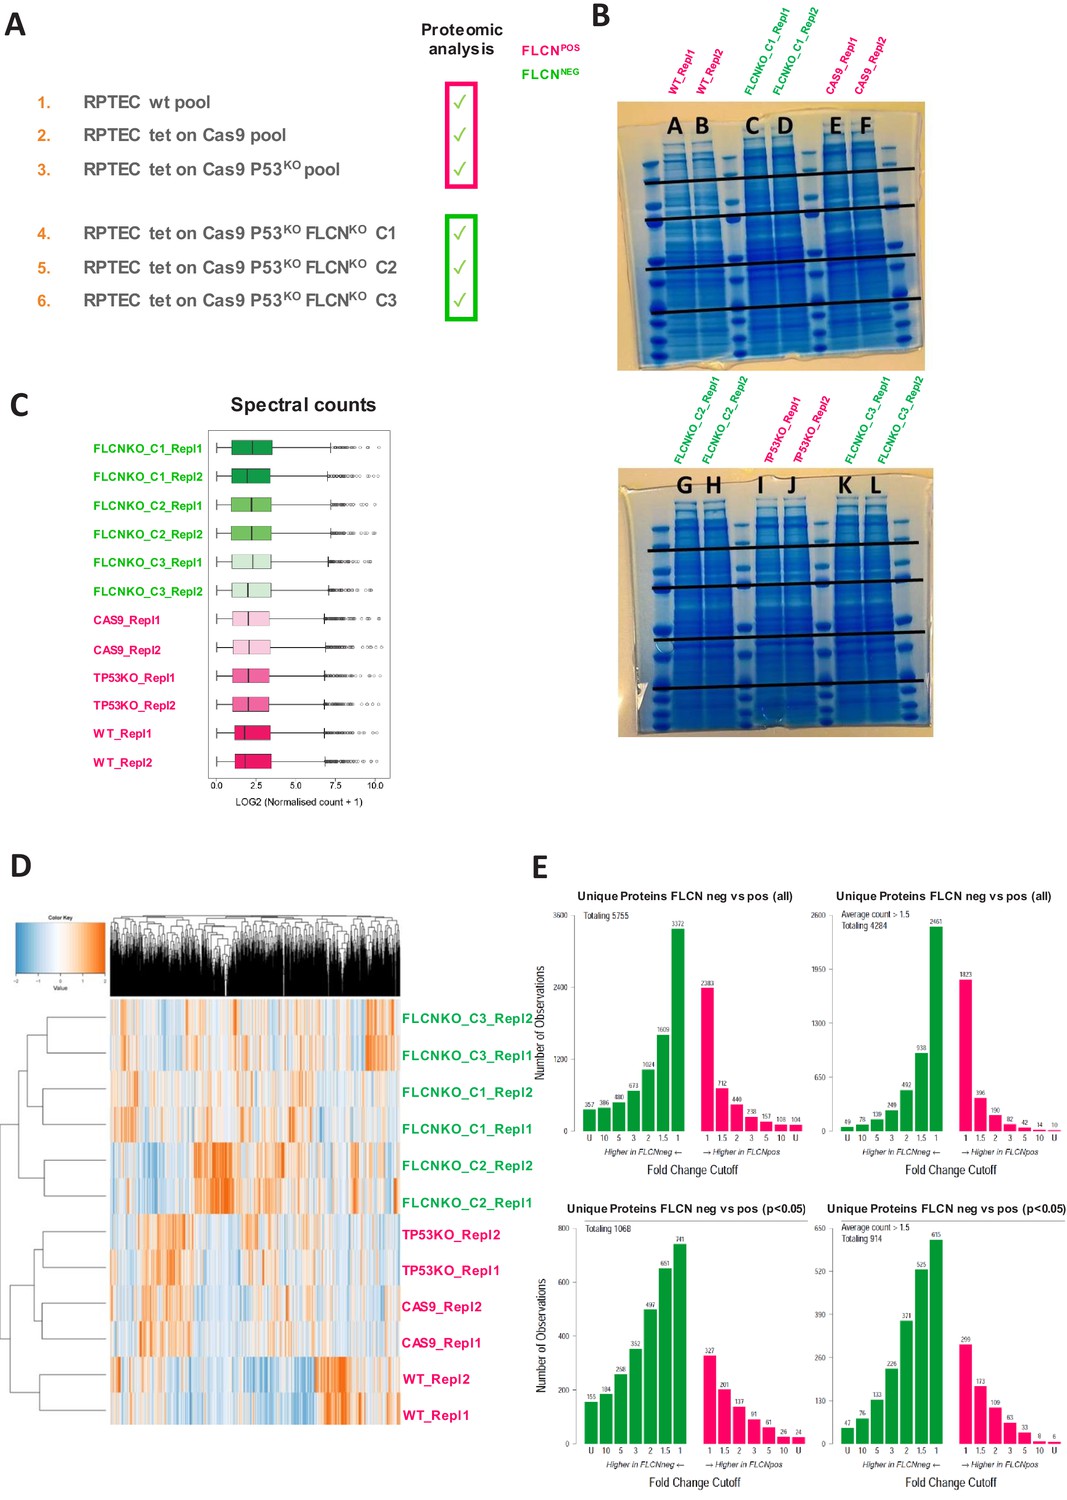
GeLC-MS/MS-based proteomics of RPTEC FLCNPOS vs. FLCNNEG cell line pairs.
(A) Cell lines used as input lysates for proteomic analyses FLCNPOS vs. FLCNNEG RPTECs. (B) Coomassie staining of gel containing samples for proteomic analyses, 5-band fractionation, two technical replicates per cell line were measured. (C) Overview of the normalized spectral counts per cell line. (D) Unsupervised hierarchical clustering of all proteins identified in MS experiment (normalized counts). (E) Numbers of all (top plots) or p<0.05 (lower plots) differential proteins observed in FLCNNEG or FLCNPOS RPTECs, ranked by fold change. Left: no threshold counts; right: average count >1,5. The data show upregulated protein expression by FLCN loss. Statistical details can be found in Materials and methods section.
Figure 3 with 1 supplement
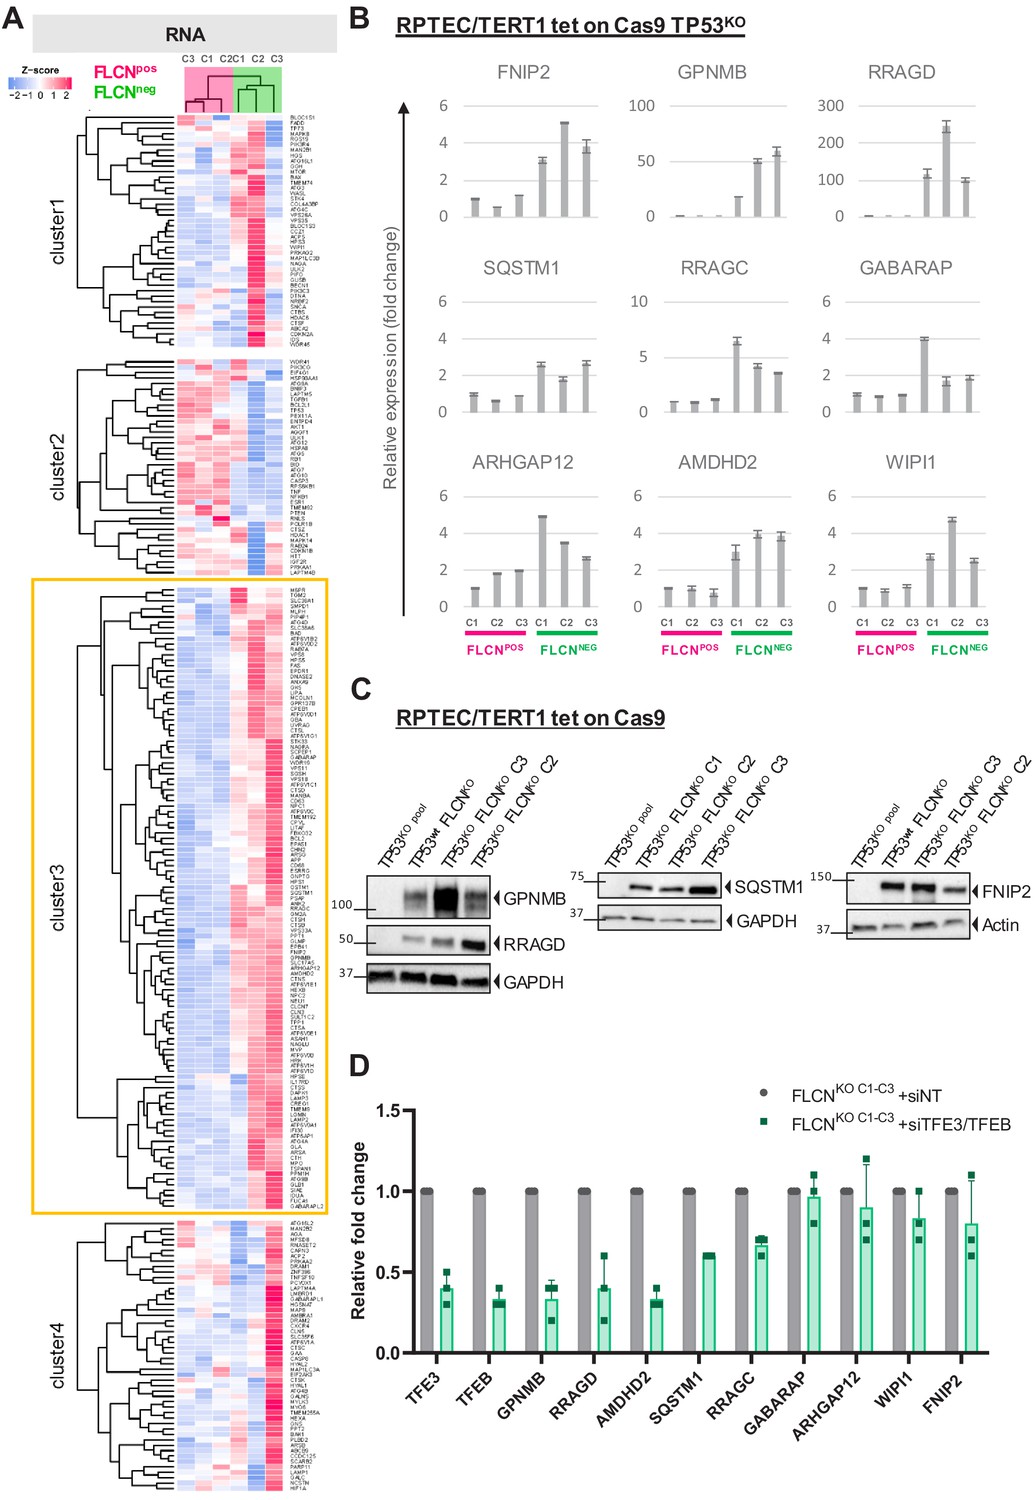
FLCN loss results in upregulation of subset of TFE target genes.
(A) Heat map showing k-means Pearson correlation clustering of TMM-normalized RNAseq data of FLCNpos versus FLCNneg RPTECs. We analyzed published TFEB/TFE3 target genes. Yellow boxed cluster three shows the subset (n = 115) of TFEB/TFE3 targets upregulated in all three FLCNNEG clones. (B) Upregulation of TFE target genes FNIP2, GPNMB, RRAGD, SQSTM1, RRAGC, GABARAP, ARHGAP12, AMDHD2, and WIPI1 in FLCNNEG RPTECs. Results of three independent experiments with three technical replicates. To determine quantitative gene expression levels, data were normalized to the geometric mean of two housekeeping genes. See Figure 3—source data 1 for raw qRT-PCR values and fold change calculations. (C) Western blots of RPTEC/TERT1 tet-on Cas9 cell lines. All FLCNNEG clones show strong induction of protein expression of TFE targets GPNMB, RRAGD, SQSTM1, and FNIP2. GAPDH and Actin were used as loading controls. Western blots were performed three times. (D) Knock down of TFE3/TFEB (10 nM siRNA, 72 hr) ameliorates the TFE expression gene signature induced by FLCN loss in three FLCNNEG clones. Expression levels were determined by qRT-PCR, normalized to siNT-treated clones and are representative of three independent experiments. To determine quantitative gene expression data levels were normalized to the geometric mean of two housekeeping genes. Also see Figure 8—figure supplement 1C. Effects of siTFE3 alone are shown in Figure 3—figure supplement 1C. See Figure 3—source data 1 for raw qRT-PCR values and fold change calculations.
-
Figure 3—source data 1
Raw qRT-PCR values and fold change calculations belonging to Figure 3B and D and Figure —figure supplement 1C.
- https://cdn.elifesciences.org/articles/61630/elife-61630-fig3-data1-v2.xlsx
Figure 3—figure supplement 1
Comparative analyses of RPTEC FLCNPOS vs. FLCNNEG cell line pairs and validations of TP53WT FLCNKO RPTEC cell line.
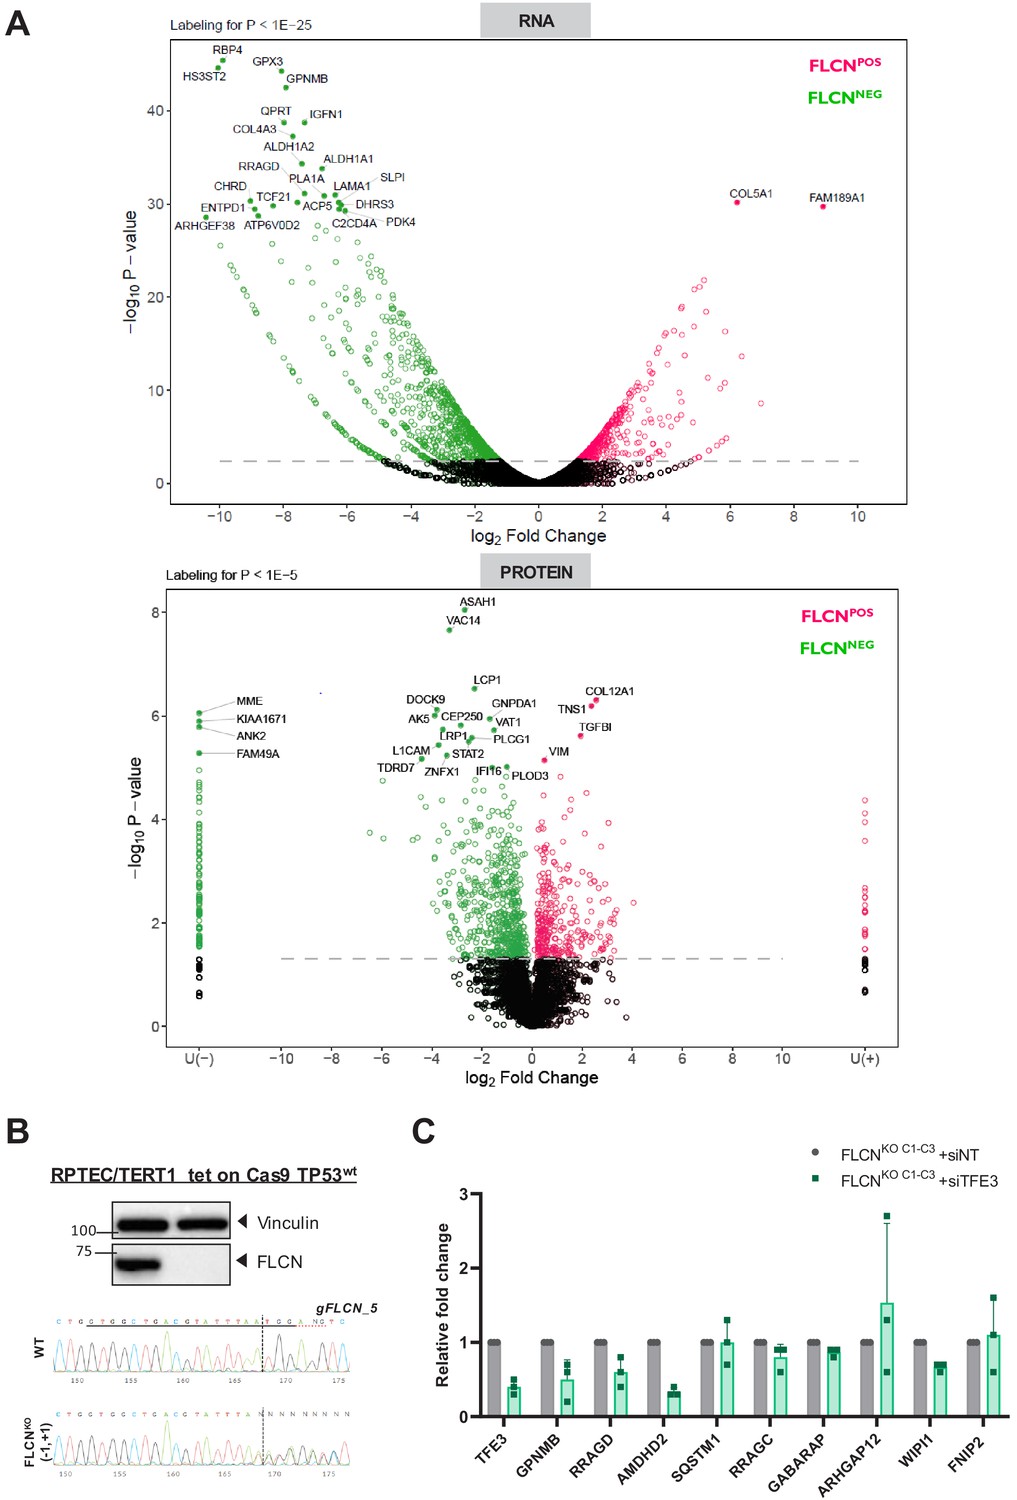
(A) Similar volcano plots are shown as described in Figure 2B and C, while here the most significant genes for RNA (p-value<1 ~ E-25) and protein (p-value<1E-5) are annotated. Statistical details can be found in the materials and methods section. (B) Western blot and Sanger sequence chromatogram confirm FLCN knockout in RPTEC tet on Cas9 TP53WT cell line. Vinculin was used as a loading control and western blot was performed three times. (C) Knock down of TFE3 (siRNA, 10 nM, 72 hr) in three FLCNNEG clones. Expression levels were determined by qRT-PCR, normalized to siNT-treated clones and are representative of three independent experiments. To determine quantitative gene expression data levels were normalized to the geometric mean of two housekeeping genes. See Figure 3—source data 1 for raw qRT-PCR values and fold change calculations.
Figure 4

mTOR localization and signaling in response to starvation does not change upon FLCN loss in RPTEC.
(A) To detect changes in canonical mTOR signaling, phosphorylation levels of S6 kinase (S6K_T389) and AKT/PKB (PKB_S473) and total protein levels of S6K, AKT/PKB, 4E-BP1 were assessed by western blot. Serum starved FLCNPOS and FLCNNEG RPTEC cell lines with and without additional amino acids (AA) depletion were analyzed three times. (B) Immunofluorescence staining of mTOR and lysosomal marker LAMP2 show no FLCN dependent difference of mTOR localization in response to starvation. FCS = fetal calf serum, AA = amino acids. Staining of FLCNNEG RPTEC C3 is representative for three independent FLCNNEG clones.
Figure 5
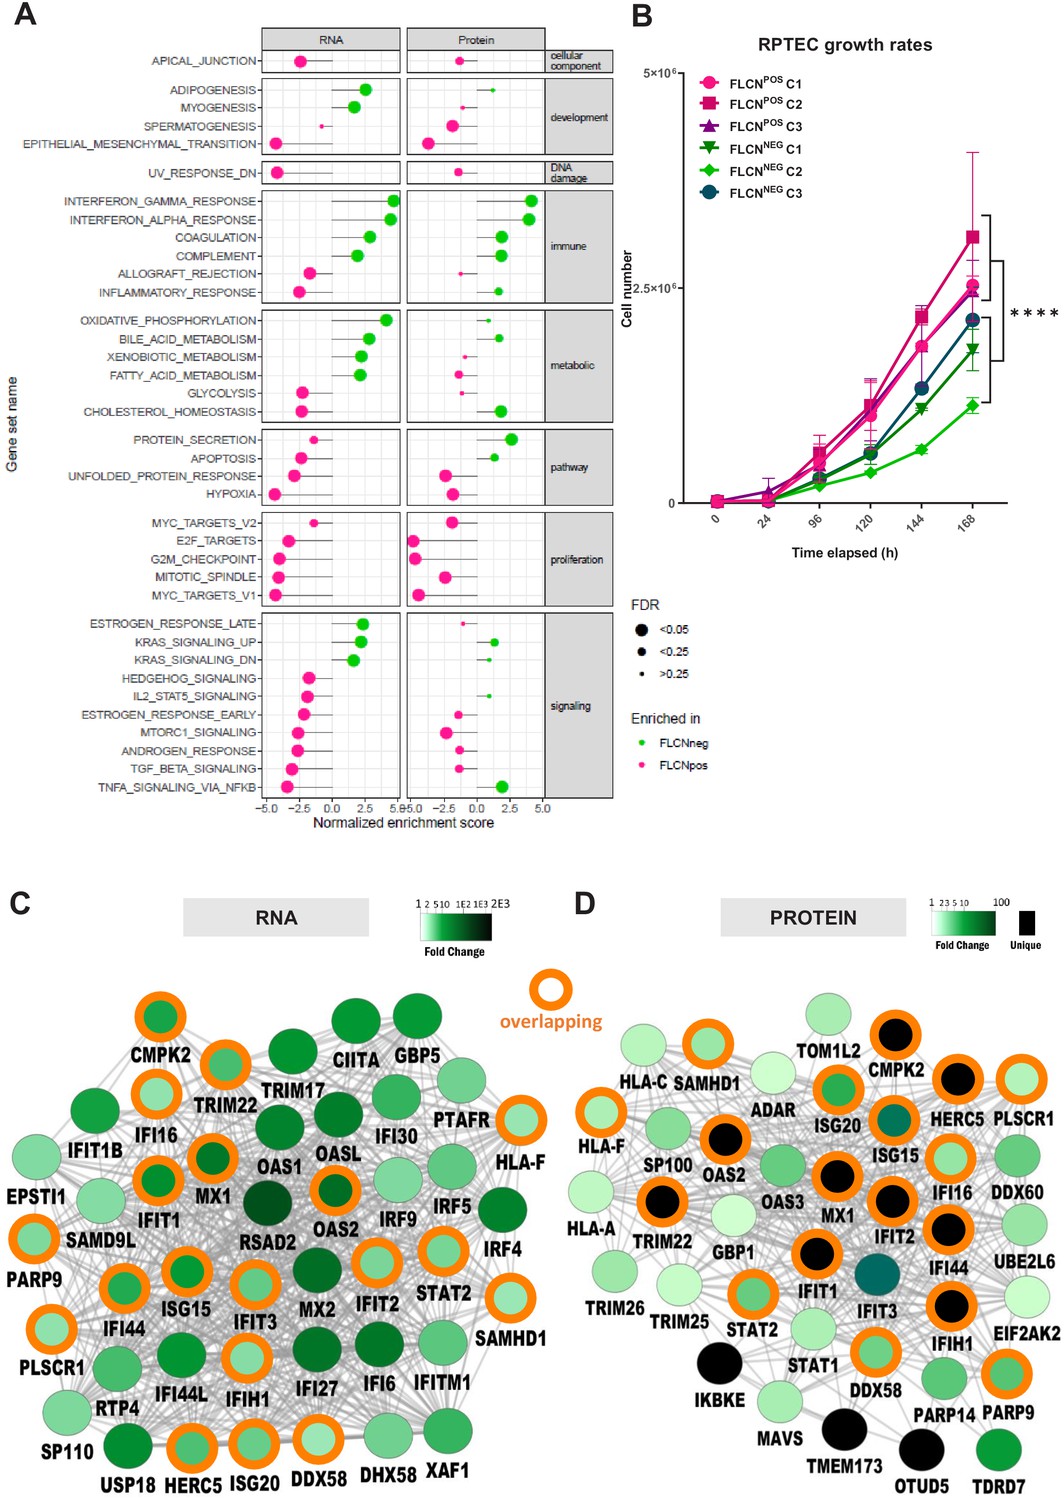
Gene set enrichment analysis reveals FLCN-dependent biological processes.
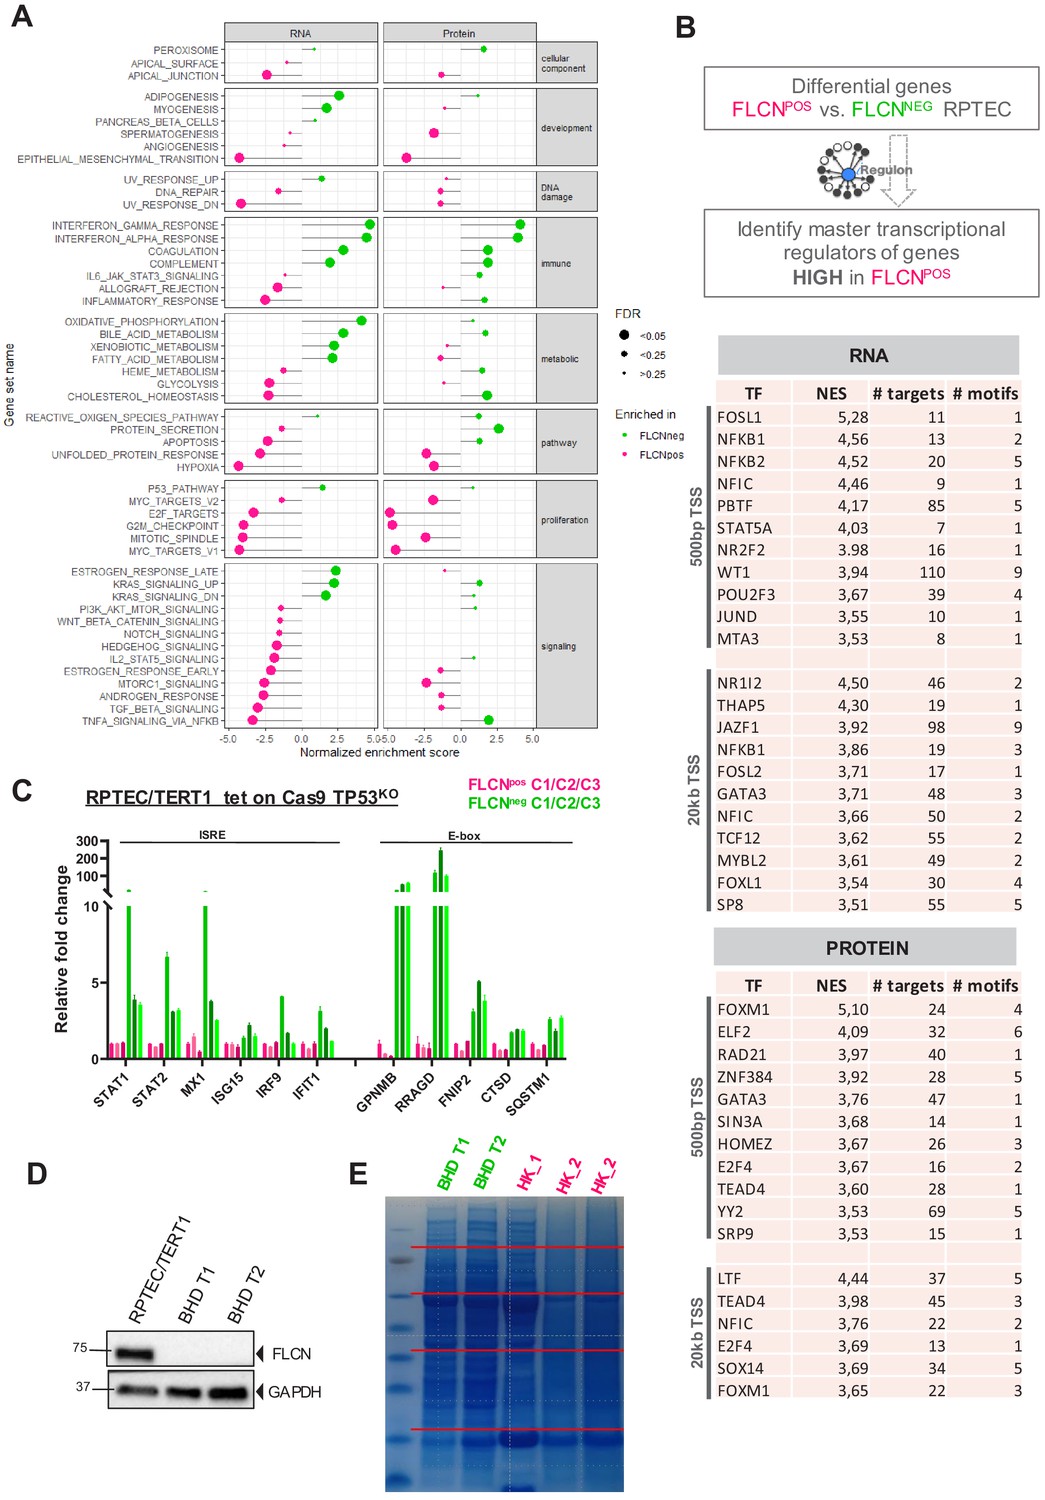
(A) For Gene Set Enrichment Analysis (GSEA) genes or proteins were ranked based on p‐values, with genes/proteins that are expressed significantly higher in FLCNNEG RPTECs shown on top of the list (hallmark gene sets, classic ES). Enriched hallmark gene sets are ranked by normalized enrichment score (NES). Gene sets enriched in FLCNNEG are shown in green and gene sets enriched in FLCNPOS in pink. The size of the dot reflects the significance of the enrichment (FDR=false discovery rate). Only biological processes that were significant in either RNA and/or protein data are depicted in this Figure. An extended version with all identified gene sets is shown in Figure 6—figure supplement 1A. (B) FLCNNEG RPTECs grow significantly slower (p=8.31E-11) when compared to FLCNPOS RPTEC. Cell lines were seeded in equal densities and total cell number was counted for 7 consecutive days. Results shown are representative for two independent experiments. (C) Gene Ontology (biological processes, BinGO) analysis of mRNAs higher expressed in FLCNNEG RPTECs reveals highly overlapping (orange circles) clusters of immune- and interferon-response-related genes between both data sets. Shade of green nodes represents fold change. (D) Gene Ontology (biological processes, BinGO) analysis of proteins higher expressed in FLCNNEG RPTECs reveals highly overlapping (orange circles) clusters of immune and interferon response related genes between both data sets. Shades of green nodes represent different levels of fold change. Black nodes indicate uniquely detected proteins in FLCNNEG RPTEC.
Figure 6 with 1 supplement

Identification of regulatory elements activated by FLCN loss in RPTEC and BHD tumors.
(A) Identification of transcriptional regulatory elements associated with loss of FLCN expression. Regulons were identified by iRegulon (Janky et al., 2014), using an input a list of differential expressed genes (Figure 3). (B) Upstream regulons enriched in FLCNNEG RPTEC based on significantly upregulated genes derived from our transcriptomic data set (n = 711, FDR < 0.05 and logFC > 2). Transcription factors with normalized enrichment scores (NES) higher than 3.5 are shown, together with detected number of targets, motifs, and elements. ISREs are highlighted in orange. Upper part shows motifs enriched 500 bp upstream from transcription start site (TSS), lower part shows motifs enriched 20 kb around TSS. (C) Upstream regulons enriched in FLCNNEG RPTEC based on significantly upregulated proteins derived from our proteomic data set (n = 498, p<0.05 and FC > 2). Transcription factors with normalized enrichment score (NES) higher than 3.5 are shown, together with number of targets, motifs, and elements detected. ISREs are highlighted in orange and E-boxes in purple. STAT1 appears twice due to the fact that iRegulon ranks this transcription factor to be the most likely upstream regulator for two sets of targets genes, containing slightly different ISRE-motifs 20 kb upstream from the TSS. (D) Two major enriched motif elements detected in iRegulon analysis of genes upregulated in FLCNNEG RPTEC. Regulons can be assigned to E-box (in purple) or ISRE (in orange) motif group. (E) Bar graphs of RNA expression levels of genes associated with an E-box motif, derived from RPTEC transcriptomic data set. FLCNPOS values are shown in pink and FLCNNEG values are shown in green. Significant p-values are indicated as *≤0.05, **≤0.01, ***≤0.001, ****≤0.0001. (F) Bar graphs of protein expression levels of genes associated with an E-box motif, derived from RPTEC proteomic data set. FLCNPOS values are shown in pink and FLCNNEG values are shown in green. FNIP2 peptides were not detected in our proteomic experiment and therefore absent in the bar graph. Significant p-values are indicated as *≤0.05, **≤0.01, ***≤0.001, ****≤0.0001. (G) Bar graphs of RNA expression levels of genes associated with an ISRE motif derived from RPTEC transcriptomic data set. FLCNPOS values are shown in pink and FLCNNEG values are shown in green. Significant p-values are indicated as *≤0.05, **≤0.01, ***≤0.001, ****≤0.0001. (H) Bar graphs of protein expression levels of genes associated with an ISRE motif derived from RPTEC proteomic data set. FLCNPOS values are shown in pink and FLCNNEG values are shown in green. IRF9 and IRF4 peptides were not detected in our proteomic experiment and therefore absent in the bar graph. Significant p-values are indicated as *≤0.05, **≤0.01, ***≤0.001, ****≤0.0001. (I) Dot plot of protein expression levels of genes associated with an E-box (left) or ISRE motif (right) derived from BHD kidney tumor proteomic data sets (see Figure 6—figure supplement 1D and E), as compared to normal kidney tissue. FLCNPOS values are shown in pink and FLCNNEG values are shown in green. STAT2 levels were below detection levels in these protein extracts.
Figure 6—figure supplement 1
Extended GSEA and iRegulon analysis of FLCN loss in RPTEC and BHD tumors.
(A) For Gene Set Enrichment Analysis (GSEA) genes or proteins were ranked based on p‐values, with genes/proteins significantly higher expressed in FLCNNEG RPTEC on top of the list (hallmark gene sets, classic ES). Enriched hallmark gene sets are ranked by normalized enrichment score (NES), with gene sets enriched in FLCNNEG marked in green and gene sets enriched in FLCNPOS marked pink. The size of the dot reflects the significance of the enrichment (FDR=false discovery rate). (B) Identification of master transcriptional regulators associated with FLCN expression. Regulons were identified with iRegulon tool (Janky et al., 2014), using an input a list of FLCN differential expressed genes derived from our transcriptomic and proteomic analyses (Figures 2 and 3). Tables showing upstream regulons enriched in FLCNPOS RPTEC based on significantly upregulated genes (n = 62, FDR < 0.05 and logFC > 2) and proteins (n = 138, p<0.05 and FC > 2). Transcription factors with normalized enrichment score (NES) higher than 3.5 are shown, together with detected number of targets, motifs, and elements. Upper part of table shows motifs enriched 500 bp upstream from transcription start site (TSS), lower part shows motifs enriched 20 kb around TSS. (C) Upregulation of target genes with an ISRE or E-box motif in FLCNNEG RPTEC cell lines was validated by qRT-PCR. Results shown are representative for three independent experiments with three technical replicates. To determine quantitative gene expression, data levels were normalized to the geometric mean of two housekeeping genes. See Figure 6—figure supplement 1—source data 1 for raw qRT-PCR values and fold change calculations. (D) Absence of FLCN protein expression in two BHD tumors (BHD T1 and BHD T2) was verified by western blotting. GAPDH was used as loading control and western blot was performed three times. (E) Coomassie staining of gel containing samples for proteomic analyses of BHD T1, BHD T2 and two normal kidney lysates (HK_1 and HK_2). For measurements, 5-band fractionation was applied to all samples and two lanes of HK_2 were combined.
-
Figure 6—figure supplement 1—source data 1
Raw qRT-PCR values and fold change calculations belonging to Figure 6—figure supplement 1C.
- https://cdn.elifesciences.org/articles/61630/elife-61630-fig6-figsupp1-data1-v2.xlsx
Figure 7 with 1 supplement
Inactivation of the FLCN-FNIP1/2 axis activates STAT2 in renal cells.
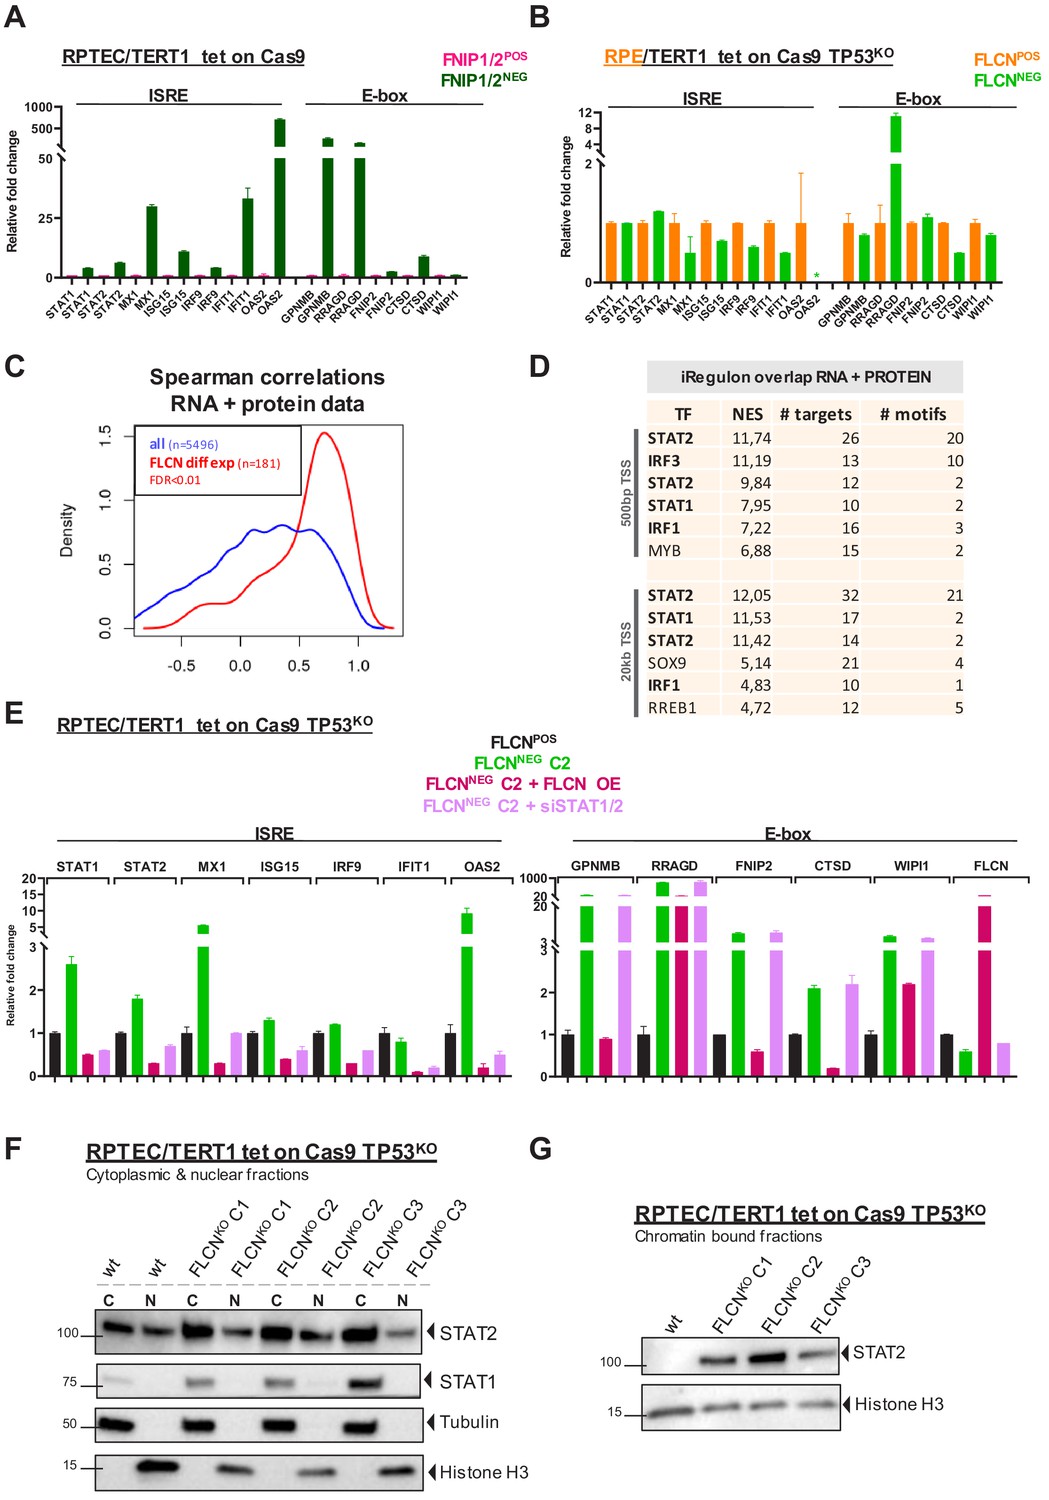
(A) qRT-PCR levels of genes with ISRE or E-box motif in FNIP1POS/FNIP2POS and FNIP1NEG/FNIP2NEG RPTEC cells reveal that the identified FLCN-dependent gene signature is also induced upon loss of FLCN interacting proteins FNIP1 and FNIP2. Results shown are representative for two independent experiments with three technical replicates. To determine quantitative gene expression data levels were normalized to the geometric mean of two housekeeping genes. See Figure 7—source data 1 for raw qRT-PCR values and fold change calculations. (B) qRT-PCR levels of genes with ISRE or E-box motif in FLCNPOS and FLCNNEG retinal pigment epithelial cells (RPE/TERT1 tet on Cas9 TP53KO) reveal that the identified FLCN dependent gene signature is absent in an epithelial cell type of another tissue origin. Results shown are representative for two independent experiments. To determine quantitative gene expression data levels were normalized to the geometric mean of two housekeeping genes. *OAS2 level in FLCNNEG RPE was too low to detect using qRT-PCR. See Figure 7—source data 1 for raw qRT-PCR values and fold change calculations. (C) Spearman correlation analysis reveals overlapping FLCN-dependent RNA and protein data. FLCN differential mRNAs and proteins (FDR < 0.01, n = 181, red line) showed a higher correlation than the overlap of all identified mRNAs and proteins in our datasets (blue line). Statistical methods are described in Materials and methods section. (D) iRegulon analysis of differentially expressed genes (FDR < 0.01) with highest correlation with differentially expressed proteins (r > 0.8, n = 49) reveal STAT1, STAT2, IRF1, and IRF3 as most obvious upstream transcriptional regulators. Only regulons displaying normalized enrichment scores (NES) > 4.5 are shown. STAT2 appears twice due to the fact that iRegulon ranks this transcription factor to be the most likely upstream regulator for two sets of targets genes, containing slightly different ISRE-motifs upstream from the transcription start site (TSS). (E) Reintroducing FLCN (overexpression, OE) or siRNA-mediated knock down of STAT1/STAT2 (10 nM, 72 hr) revert the IFN expression gene signature induced by FLCN loss in RPTEC FLCNNEG C2. FLCN OE also lowers the enhanced expression of E-box-associated target genes but knock down of STAT1/2 has no effect on E-box-associated genes. Expression levels were determined by qRT-PCR and are representative of two independent experiments. To determine quantitative gene expression data levels were normalized to the geometric mean of two housekeeping genes. See Figure 7—source data 1 for raw qRT-PCR values and fold change calculations. (F) Western blots of subcellular fractionated samples show higher expression of STAT1 and STAT2 in FLCNNEG RPTEC as compared to FLCNPOS RPTEC. STAT2 was also detected in both cytoplasmic and nuclear fractions. Tubulin and histone H3 levels were used as loading control and to distinguish each fraction (N=nuclear, C=cytoplasmic). Results shown are representative of two independent fractionations. (G) Western blot of subcellular fractionated samples shows enhanced STAT2 DNA binding in FLCNNEG RPTEC. Results shown are representative of three independent fractionations.
-
Figure 7—source data 1
Raw qRT-PCR values and fold change calculations belonging to 7A, 7B and 7E.
- https://cdn.elifesciences.org/articles/61630/elife-61630-fig7-data1-v2.xlsx
Figure 7—figure supplement 1
Validation of FLCNs role in the IFN response in additional cell models.
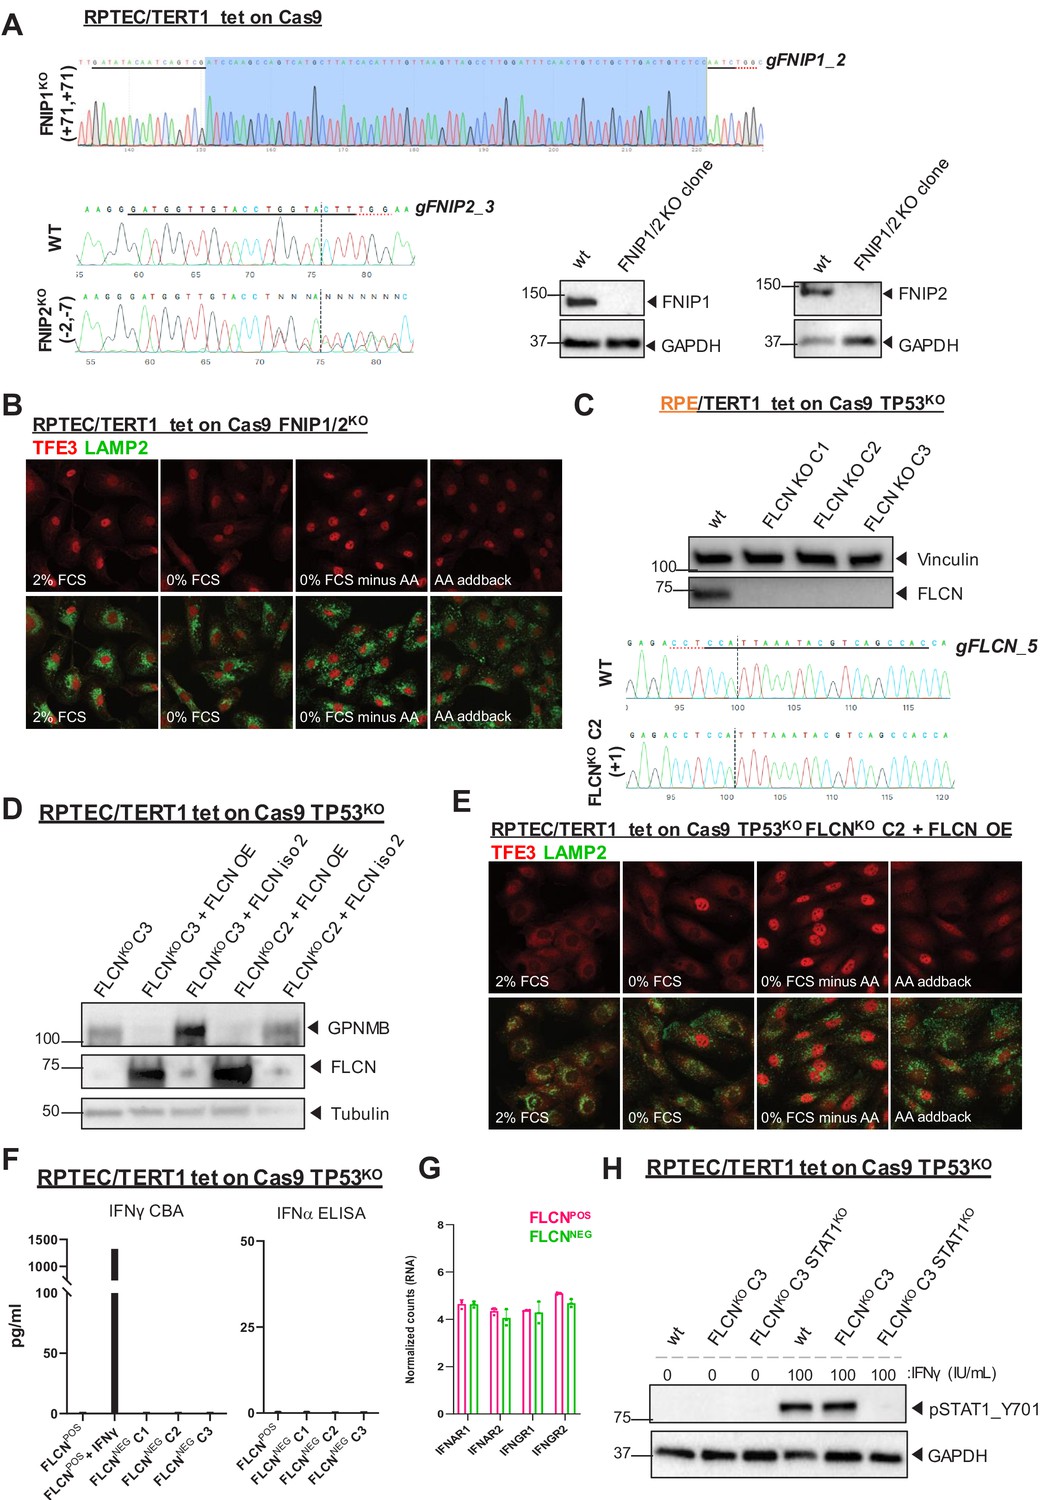
(A) Validation of FNIP1/FNIP2 knock out in RPTEC/TERT1 tet-on Cas9 TP53KO cells by FNIP1 and FNIP2 sequencing and immunoblotting. Sanger sequence chromatograms of genomic DNA isolated from FNIP1wt /FNIP2wt and FNIP1KO/FNIP2KO RPTEC cell lines. Indel analysis for FNIP2 was performed with the on-line ICE tool of Synthego. FNIP1 sequence chromatograms were aligned and revealed a homozygous insertion of 71 nucleotides in FNIP1KO. (B) Immunofluorescence staining of TFE3 and lysosomal marker LAMP2 show enhanced nuclear TFE3 upon FNIP1/2 loss independent of nutrient availability. FCS = fetal calf serum, AA = amino acids. (C) Validation of FLCN knock out in retinal pigment epithelial cells (RPE/TERT1 tet on Cas TP53KO) by immunoblot and sequencing. Clone two was used for further validations. Sanger sequence chromatograms of genomic DNA isolated from FLCNwt and FLCNKO C2 RPE cell line. Indel analysis was performed with the on-line Inference of CRISPR Editing (ICE) tool of Synthego. (D) Validation of FLCN isoform one re-expression in RPTEC tet on Cas9 TP53KO FLCNKO C2 and C3 by immunoblot. Higher protein expression of E-box associated target GPNMB was reverted upon restored FLCN expression. Tubulin was used as loading control and western blot was performed twice. Re-expression of FLCN isoform two did not revert the phenotype. (E) Immunofluorescence staining of TFE3 and lysosomal marker LAMP2 show rescue of TFE3 nuclear localization and responsiveness on nutrient availability when FLCN expression is restored in FLCNNEG RPTEC C2. FCS = fetal calf serum, AA = amino acids. (F) IFNγ Cytometric Bead Array (CBA) or IFNα ELISA detect no FLCN-dependent alterations of both cytokines in supernatant of FLCNPOS and FLCNNEG RPTEC cells. Results shown are representative for two independent experiments. (G) Bar graphs of RNA expression levels (derived from our transcriptomic data) of IFN receptor genes show no differential expression between FLCNPOS versus FLCNNEG RPTEC cell lines. (H) Western blot of pSTAT1_Y701 shows no induction of canonical IFN signaling in FLCNNEG RPTEC. As positive control, cell lines were treated with 100IU/ml IFNγ for 1 hr. GAPDH was used as loading control. A STAT1KO RPTEC was taken along as negative control.
Figure 8 with 1 supplement
FLCN loss induces an interferon signature which counteracts growth promoting effects of active TFE3 in renal tubular cells.
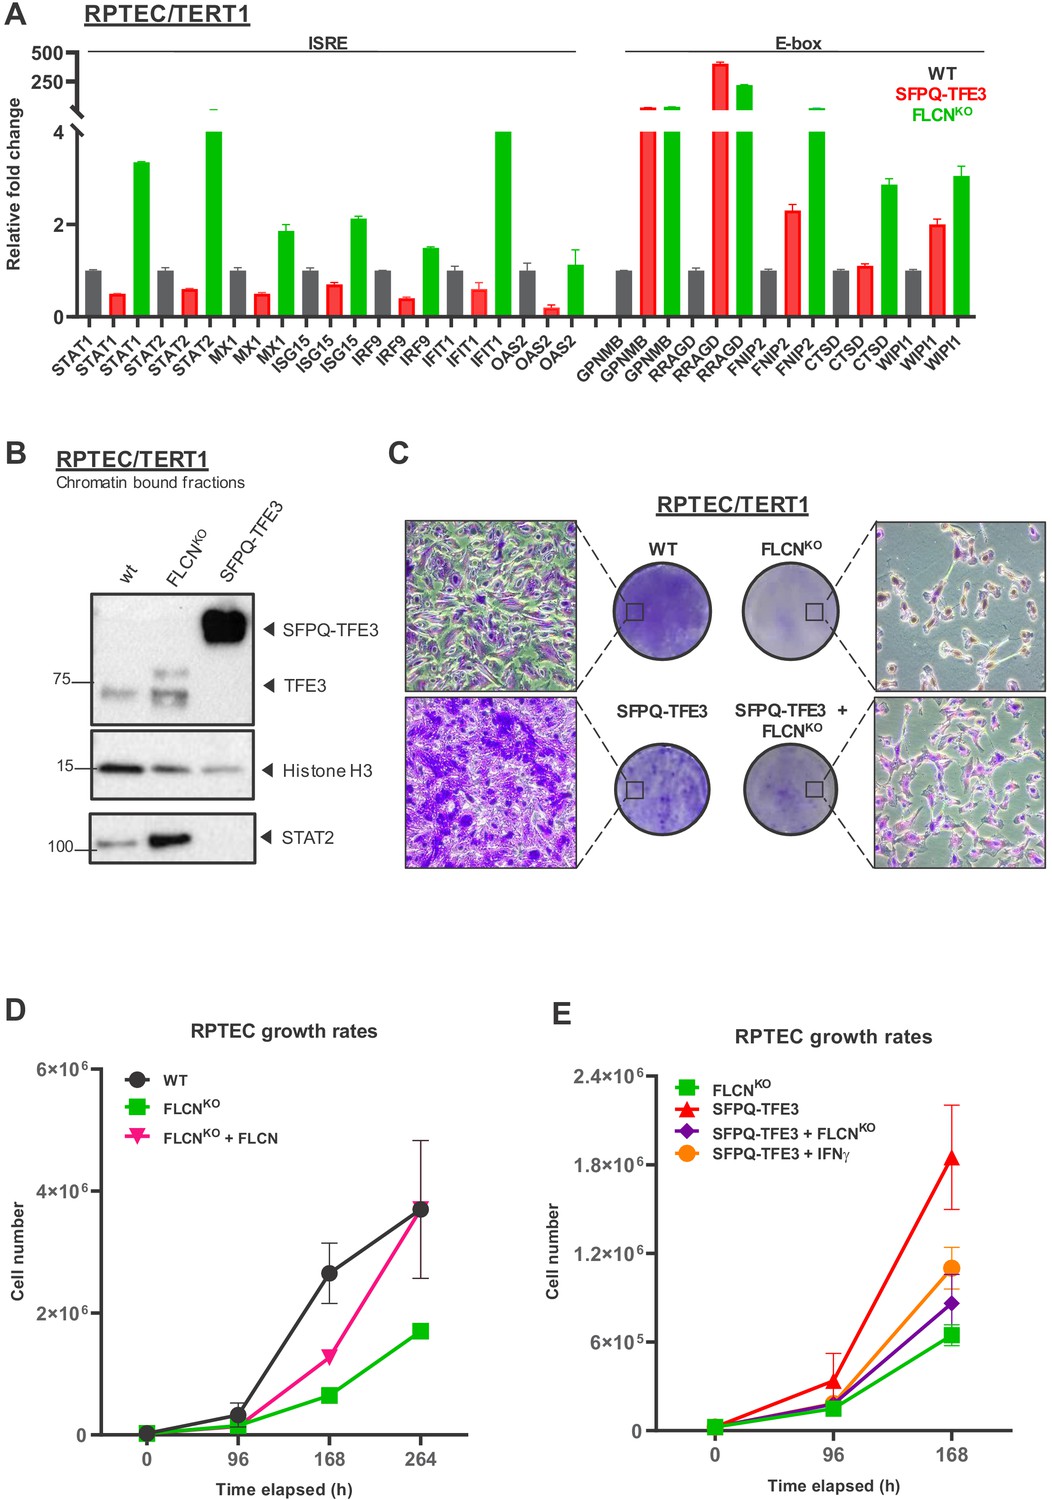
(A) Expression of a constitutively active SFPQ-TFE3 fusion protein in RPTEC results in upregulation of E-box-associated targets but does not induce enhanced expression of ISRE-associated genes. FLCNKO RPTEC cells show both upregulation of E-box and ISRE-associated genes. Expression levels were determined by qPCR and are representative of two independent experiments. To determine quantitative gene expression data, levels were normalized to the geometric mean of two housekeeping genes. See Figure 8—source data 1 for raw qRT-PCR values and fold change calculations. (B) Western blots of subcellular fractions show enhanced binding of TFE3 to DNA in FLCNNEG RPTEC and SFPQ-TFE3 RPTEC. STAT2 DNA-binding was enhanced upon FLCN loss but reduced by SFPQ-TFE3 over-expression in RPTEC. STAT2 was blotted on separate blots of the same lysates. Histone H3 levels were used as loading control and as marker for chromatin fraction. Western blot was performed two times, using independent fractionations. (C) Colony formation assays show that loss of FLCN in wild-type or SFPQ-TFE3 RPTEC reduces colony outgrowth. SFPQ-TFE3 RPTEC show more colonies than wild type RPTEC after 10 days. Insets show bright field images (×20 magnification). Cells were seeded in three technical replicates and experiment was performed twice. (D) Loss of FLCN in RPTEC results in slower growth, which is reverted when FLCN expression is restored by over-expression. Cell lines were seeded in equal densities and total cell numbers were counted three times within 11 days. Results shown are representative for two independent experiments. (E) Treatment with IFNγ (100IU/ml) or combining FLCNKO in SFPQ-TFE3 RPTEC results in growth inhibition. Cell lines were seeded in equal densities and total cell number was counted twice within 7 days. Results shown are representative for two independent experiments. The growth curve of FLCNKO RPTEC (D) is added for comparison.
-
Figure 8—source data 1
Raw qRT-PCR values and fold change calculations belonging to Figure 8A and Figure 8—figure supplement 1C and D.
- https://cdn.elifesciences.org/articles/61630/elife-61630-fig8-data1-v2.xlsx
Figure 8—figure supplement 1
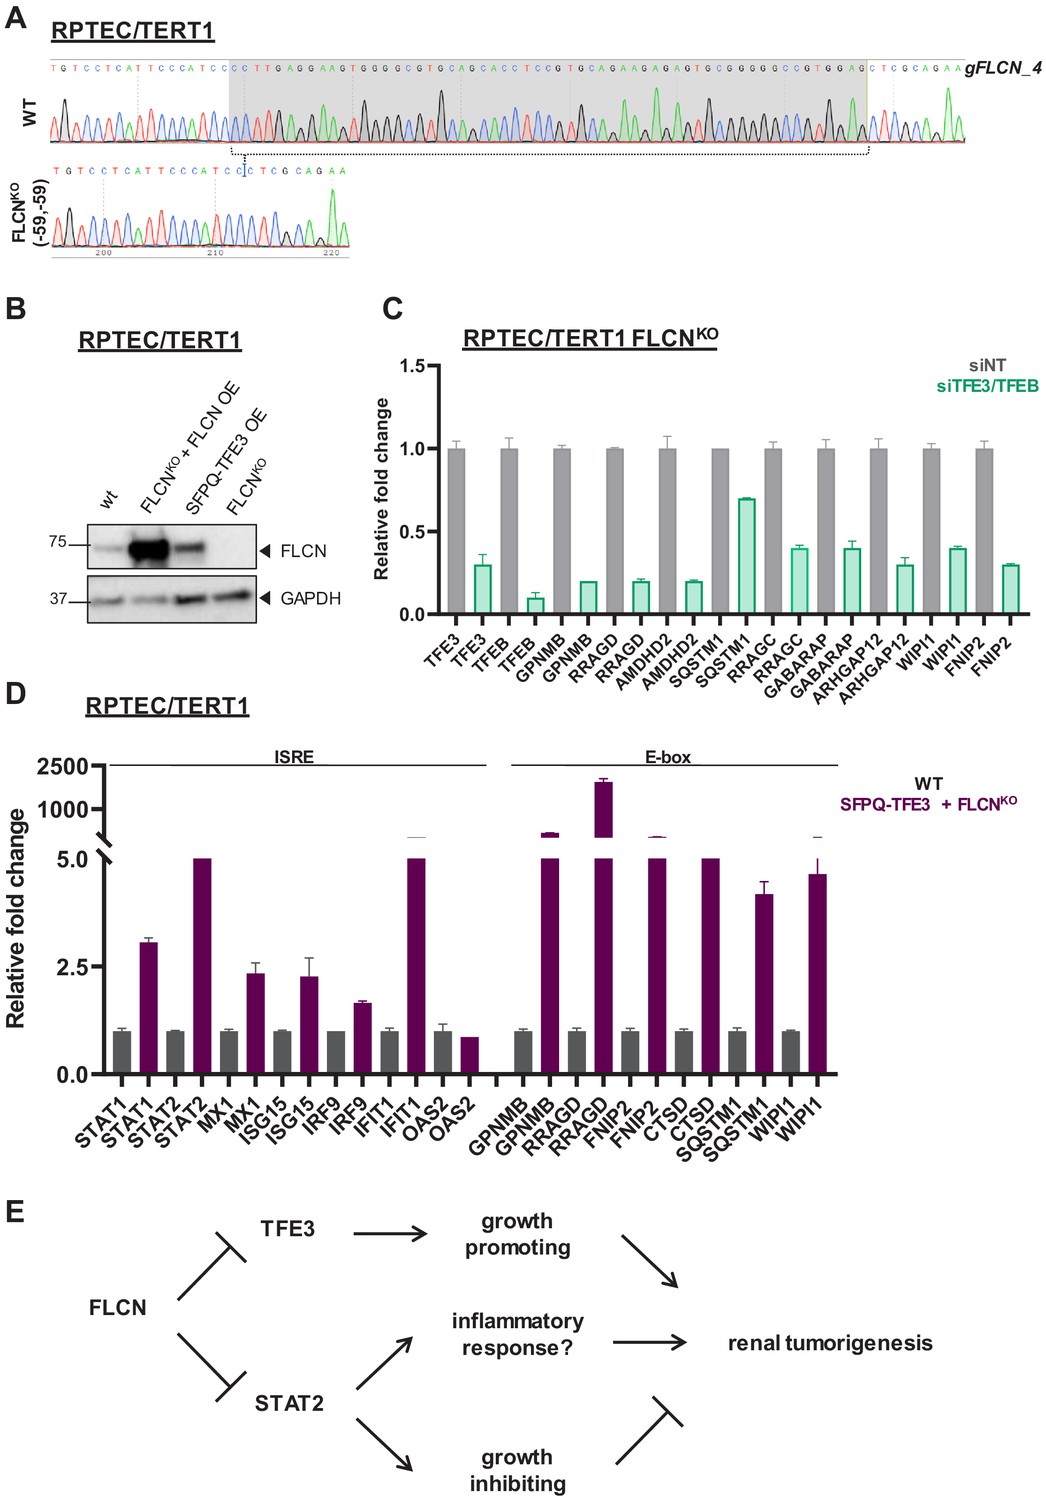
Creation and validation of FLCNNEG and SFPQ-TFE3 RPTECs.
(A) Validation of FLCN knock out in RPTEC by sequencing. Alignment of Sanger sequence chromatograms of FLCNWT and FLCNKO RPTEC cell line reveals homozygous deletion of 59 nucleotides in the diploid FLCNKO clone. (B) Western blot of FLCN expression levels in wild-type, FLCN re-expression (OE), SFPQ-TFE3, and FLCNKO RPTEC/TERT1 cell lines. GAPDH was used as loading control. (C) Knock down of TFE3/TFEB (siRNA, 10 nM, 72 hr) dampens the TFE expression gene signature induced in RPTEC FLCNKO cells. Expression levels were determined by qRT-PCR and are normalized to siNT and representative of three independent experiments. To determine quantitative gene expression levels the data were normalized to the geometric mean of two housekeeping genes. See Figure 8—source data 1 for raw qRT-PCR values and fold change calculations. (D) Combining SFPQ-TFE3 with FLCNKO in RPTEC results in upregulation of ISRE-associated genes as well as high expression of E-box target genes. Expression levels were determined by qPCR and are representative of two independent experiments. See Figure 8—source data 1 for raw qRT-PCR values and fold change calculations. (E) Diagram depicting our hypothesis that FLCN loss may induces a STAT2-mediated IFN signature which results in growth inhibition, counteracting the growth promoting function of constitutive activation of TFE3 in renal cells. Alternatively, a constitutively upregulated IFN signature may ultimately contribute to an inflammatory response that promotes tumorigenesis.
Scheme 1
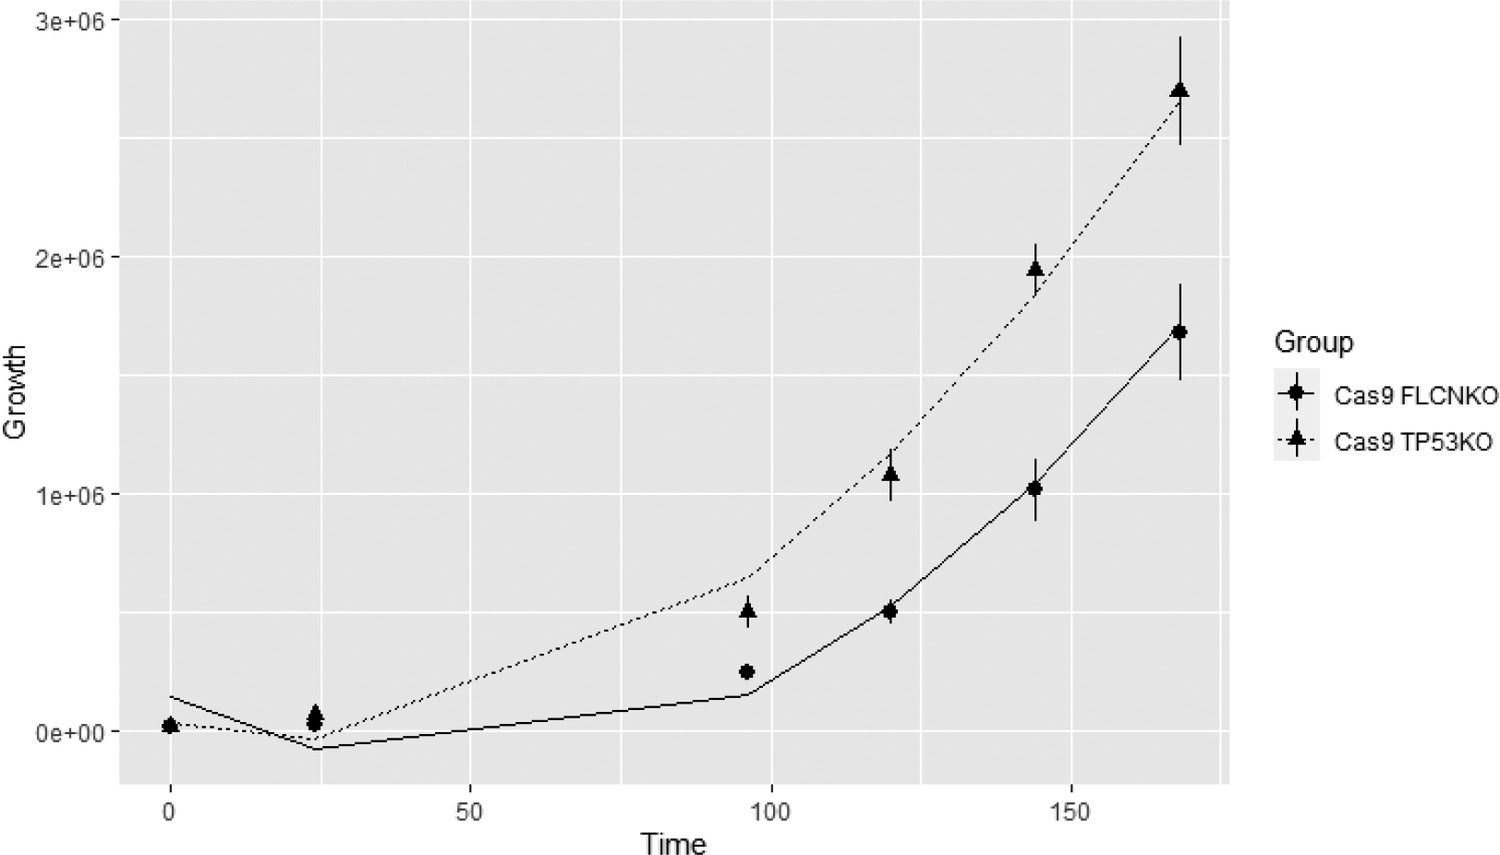
Growth curves of FLCNKO and TP53KO with the fitted curves.
Tables
Table 1
Estimated values and p-value of the random intercept model.
| Estimate | Standard error | p-Value | |
|---|---|---|---|
| (FLCNKO at time 0) | 1.414 × 10⁵ | 1.079 × 10⁵ | 0.215 |
| (Time) | −1.222 × 10⁴ | 1.966 × 10³ | 5.07 × 10⁻¹⁰ |
| (Time2) | 1.284 × 10² | 1.138 × 101 | <2×10⁻¹⁶ |
| (TP53KO) | −1.080 × 10⁵ | 1.462 × 10⁵ | 0.477 |
| (interaction between Time and TP53KO) | 6.262 × 10³ | 9.641 × 10² | 8.31 × 10⁻¹¹ |
| 1.506 × 10¹⁰ | |||
| 6.238 × 10¹⁰ |
Appendix 1—key resources table
| Reagent type (species) or resource | Designation | Source or reference | Identifiers | Additional information |
|---|---|---|---|---|
| Gene (Homo sapiens) | FLCN | HUGO Gene Nomenclature Committee | HGNC:27310 | |
| Gene (Homo sapiens) | FNIP1 | HUGO Gene Nomenclature Committee | HGNC:29418 | |
| Gene (Homo sapiens) | FNIP2 | HUGO Gene Nomenclature Committee | HGNC:29280 | |
| Gene (Homo sapiens) | TFE3 | HUGO Gene Nomenclature Committee | HGNC:11752 | |
| Gene (Homo sapiens) | TFEB | HUGO Gene Nomenclature Committee | HGNC:11753 | |
| Gene (Homo sapiens) | STAT1 | HUGO Gene Nomenclature Committee | HGNC:11362 | |
| Gene (Homo sapiens) | STAT2 | HUGO Gene Nomenclature Committee | HGNC:11363 | |
| Cell line (Homo sapiens) | RPE-1 tet on Cas9 TP53KO | Benedict et al., 2020 | PMID:32084359 | Originally derived from hTERT RPE-1 (ATCC Cat# CRL-4000, RRID:CVCL_4388) |
| Cell line (Homo sapiens) | RPE tet on Cas9 TP53KO FLCNKO C2 | This paper | knock out cell lines, see Material and methods section CRISPR/Cas9 gene editing | |
| Cell line (Homo sapiens) | RPTEC/TERT1 | ATCC | ATCC Cat# CRL-4031, RRID:CVCL_K278 | |
| Cell line (Homo sapiens) | - RPTEC tet on Cas9 - RPTEC tet on Cas9 TP53KO(pool and three clones) - RPTEC tet on Cas9 TP53KO FLCNKO C1-3 - RPTEC RPTEC tet on Cas9 TP53wt FLCNKO - RPTEC tet on Cas9 FNIP1/FNIP2KO - RPTEC FLCNKO | This paper | knock out cell lines, see Material and methods section CRISPR/Cas9 gene editing | |
| Cell line (Homo sapiens) | - RPTEC SFPQ-TFE3 - RPTEC SFPQ-TFE3 FLCNKO | This paper | Lentivirally transduced SFPQ-TFE3 mutant, with and without CRISPR mediated FLCN knock out | |
| Sequenced-based reagent (human) | siRNA STAT1 | Dharmacon, Horizon discovery | L-003543-00-0005 | siRNA pool used for gene knock down experiments |
| Sequenced-based reagent (human) | siRNA STAT2 | Dharmacon, Horizon discovery | L-012064-00-0005 | siRNA pool used for gene knock down experiments |
| Sequenced-based reagent (human) | siRNA TFEB | Dharmacon, Horizon discovery | L-009798-00-0005 | siRNA pool used for gene knock down experiments |
| Sequenced-based reagent (human) | siRNA TFE3 | Dharmacon, Horizon discovery | L-009363-00-0005 | siRNA pool used for gene knock down experiments |
| Sequenced-based reagent (human) | siRNA non-targeting control | Dharmacon, Horizon discovery | D-001210-04-05 | siRNA pool used for gene knock down experiments |
| Transfected construct (human) | pLenti CMVie-IRES-BlastR FLCN cDNA | This paper | FLCN rescue by overexpression of cDNA in Addgene plasmid #119863 (Puleo et al., 2019) | |
| Transfected construct (human) | pLKO-Ubc SFPQ-TFE3 | Fumagalli et al., 2017 | PMID:28270604 | Patient derived SFPQ-TFE3 fusion sequence transduced in RPTEC |
| Sequenced-based reagent (Homo sapiens) | crRNA FLCN_exon 5 (GTGGCTGACGTATTTAATGG) | Dharmacon, Horizon Discovery | Synthetic gRNA for CRISPR/Cas9 mediated gene knock out | |
| Sequenced-based reagent (Homo sapiens) | crRNA FLCN_exon 7 (TGTCAGCGATGTCAGCGAGC) | Dharmacon, Horizon Discovery | Synthetic gRNA for CRISPR/Cas9 mediated gene knock out | |
| Sequenced-based reagent (Homo sapiens) | crRNATP53_exon 4 (CCATTGTTCAATATCGTCCG) | Dharmacon, Horizon Discovery | Synthetic gRNA for CRISPR/Cas9 mediated gene knock out | |
| Sequenced-based reagent (Homo sapiens) | crRNA FNIP1_exon 2 (GATATACAATCAGTCGAATC) | Dharmacon, Horizon Discovery | Synthetic gRNA for CRISPR/Cas9 mediated gene knock out | |
| Sequenced-based reagent (Homo sapiens) | crRNA FNIP2_exon 3 (GATGGTTGTACCTGGTACTT) | Dharmacon, Horizon Discovery | Synthetic gRNA for CRISPR/Cas9 mediated gene knock out | |
| Sequenced-based reagent (Homo sapiens) | FLCN_exon 4 GAGAGCCACGAUGGCAUUCA + modified EZ scaffold | Synthego | Synthetic gRNA for CRISPR/Cas9 mediated gene knock out | |
| Biological sample (Homo sapiens) | BHD kidney tumor 1 | This paper | BHD T1 sample for mass spectrometry, see Material and methods section Patient material | |
| Biological sample (Homo sapiens) | BHD kidney tumor 2 | This paper | BHD T2 sample for mass spectrometry, see Material and methods section Patient material | |
| Biological sample (Homo sapiens) | Human kidney lysate 1 | Novus Bio | NB820-59231 | HK1 sample for mass spectrometry |
| Biological sample (Homo sapiens) | Human kidney lysate 2 | Santa Cruz | sc-363764 | HK2 sample for mass spectrometry |
| Antibodies (for westerns) | Vinculin (mouse mAb, H-10) | Santa Cruz | sc-25336 | (1:1000) |
| FLCN (rabbit mAb, D14G9) | Cell Signalling | CST 3697S | (1:1000) | |
| Cas9 (mouse mAb, 7A9) | Epigentek | A-9000–050 | (1:1000) | |
| AQP1 (mouse mAb, B11) | Santa Cruz | sc-25287 | (1:100) | |
| GPNMB (goat pAb) | R and D systems | AF2550-SP | (0.5 µg/mL) | |
| SQSTM1 (mouse mAb, D5L7G) | Cell Signalling | CST 88588 | (1:1000) | |
| RRAGD (rabbit pAb) | Cell Signalling | CST 4470S | (1:1000) | |
| FNIP1 (rabbit mAb) | Abcam | ab134969 | (1:1000) | |
| FNIP2 (rabbit pAb) | Atlas Antibodies | HPA042779 | (1:1000) | |
| STAT2 (rabbit pAb) | GeneTex | GTX103117 | (1:1000) | |
| pSTAT1 Y701 (rabbit mAb, D4A7) | Cell Signalling | CST 7649S | (1:1000) | |
| TFE3 (rabbit pAb) | Atlas Antibodies | HPA023881 | (1:1000) | |
| H3 (rabbit pAb) | Cell Signalling | CST 9715S | (1:1000) | |
| αTubulin (mouse mAb, B-5-1-2) | Santa Cruz | sc-23948 | (1:2000) | |
| p70S6Kinase T389 (rabbit pAb) | Cell Signalling | CST 9205 | (1:1000) | |
| pAKT S473 (rabbit mAb, D9E) | Cell Signalling | CST 4060 | (1:2000) | |
| total p70S6K (rabbit mAb, 49D7) | Cell Signalling | CST 2708 | (1:1000) | |
| panAKT (mouse mAb 40D4) | Cell Signalling | CST 2920 | (1:2000) | |
| 4E-BP1 (rabbit mAb 53H11) | Cell Signalling | CST 9644 | (1:1000) | |
| GAPDH (mouse mAb, 0411) | Santa Cruz | sc-47724 | (1:5000) | |
| GAPDH (mouse mAb, 6C5) | Merck Millipore | MAB374 | (1:200) | |
| Antibodies (for immunofluorescence) | mTOR (rabbit mAb, 7C10), | Cell Signalling | CST 2983 | (1:300) |
| Lamp2 (mouse mAb, H4B4) | Abcam | ab25631 | (1:400) | |
| TFE3 (rabbit pAb) | Cell Signalling | CST 14779 | (1:300) | |
| Sequence-based reagent | qRT-PCR and sequencing primers | Sigma-Aldrich | Described in corresponding material and method sections | |
| Commercial assay or kit | Lenti-X Tet-On 3G Inducible Expression System | Clontech, Takara Bio | 631187 | Creation of lentiviral constructs to generate Doxycycline inducible Cas9 cell line |
| Commercial assay or kit | High Pure RNA Isolation Kit | Roche | 11828665001 | RNA isolation kit for RNAseq and qRT-PCR analyses |
| Commercial assay or kit | iScript cDNA Synthesis Kit | Bio-Rad | 170–8891 | cDNA synthesis kit for qRT-PCR analyses |
| Commercial assay or kit | IFN-γ Flex Set CBA | BD Biosciences | 560111 | Flow cytometry based Cytometric bead array |
| Commercial assay or kit | VeriKine-HS Human IFN-α All Subtype ELISA kit | PBL assay science | 41115 | IFN-α Enzyme-Linked Immunosorbent Assay |
| Chemical compound, drug | Crystal Violet | 1014080025 | Stain clonogeniticy using a (0,05% solution) | |
| Software, algorithm | R/Rstudio | edgeR (Robinson et al., 2010) ggplot (Wickham, 2016) | ||
| Software, algorithm | Cytoscape | Shannon et al., 2003 | PMID:14597658 | iRegulon BinGO ClusterOne v1.0 (Nepusz et al., 2012) |
| Software, algorithm | GSEA MSigDB | Subramanian et al., 2005 Liberzon et al., 2011 | PMID:16199517 PMID:26771021 | Gene set enrichment analyses |
| Software, algorithm | GraphPad Prism | RRID:SCR_002798 | Rel. 8.2.2, plots and graph design | |
| Software, algorithm | AxioVision SE64 | Carl Zeiss | Rel. 4.9.1 | Microscope camera software |
Additional files
-
Supplementary file 1
Table showing differential expression analyses of FLCNPOS versus FLCNNEG RPTECs on RNA and protein level.
- https://cdn.elifesciences.org/articles/61630/elife-61630-supp1-v2.xlsx
-
Supplementary file 2
Table showing subset of TFE3 targets upregulated in FLCNNEG RPTEC (cluster 3, boxed yellow in Figure 3A).
- https://cdn.elifesciences.org/articles/61630/elife-61630-supp2-v2.xlsx
-
Transparent reporting form
- https://cdn.elifesciences.org/articles/61630/elife-61630-transrepform-v2.docx
Download links
A two-part list of links to download the article, or parts of the article, in various formats.
Downloads (link to download the article as PDF)
Open citations (links to open the citations from this article in various online reference manager services)
Cite this article (links to download the citations from this article in formats compatible with various reference manager tools)
Loss of FLCN-FNIP1/2 induces a non-canonical interferon response in human renal tubular epithelial cells
eLife 10:e61630.
https://doi.org/10.7554/eLife.61630


