Early life imprints the hierarchy of T cell clone sizes
- Lewis-Sigler Institute for Integrative Genomics, Princeton University, United States
- Arnold Sommerfeld Center for Theoretical Physics and Center for NanoScience, Department of Physics, Ludwig-Maximilians-Universität München, Germany
- NSF-Simons Center for Quantitative Biology, Northwestern University, United States
Figures
Figure 1 with 5 supplements
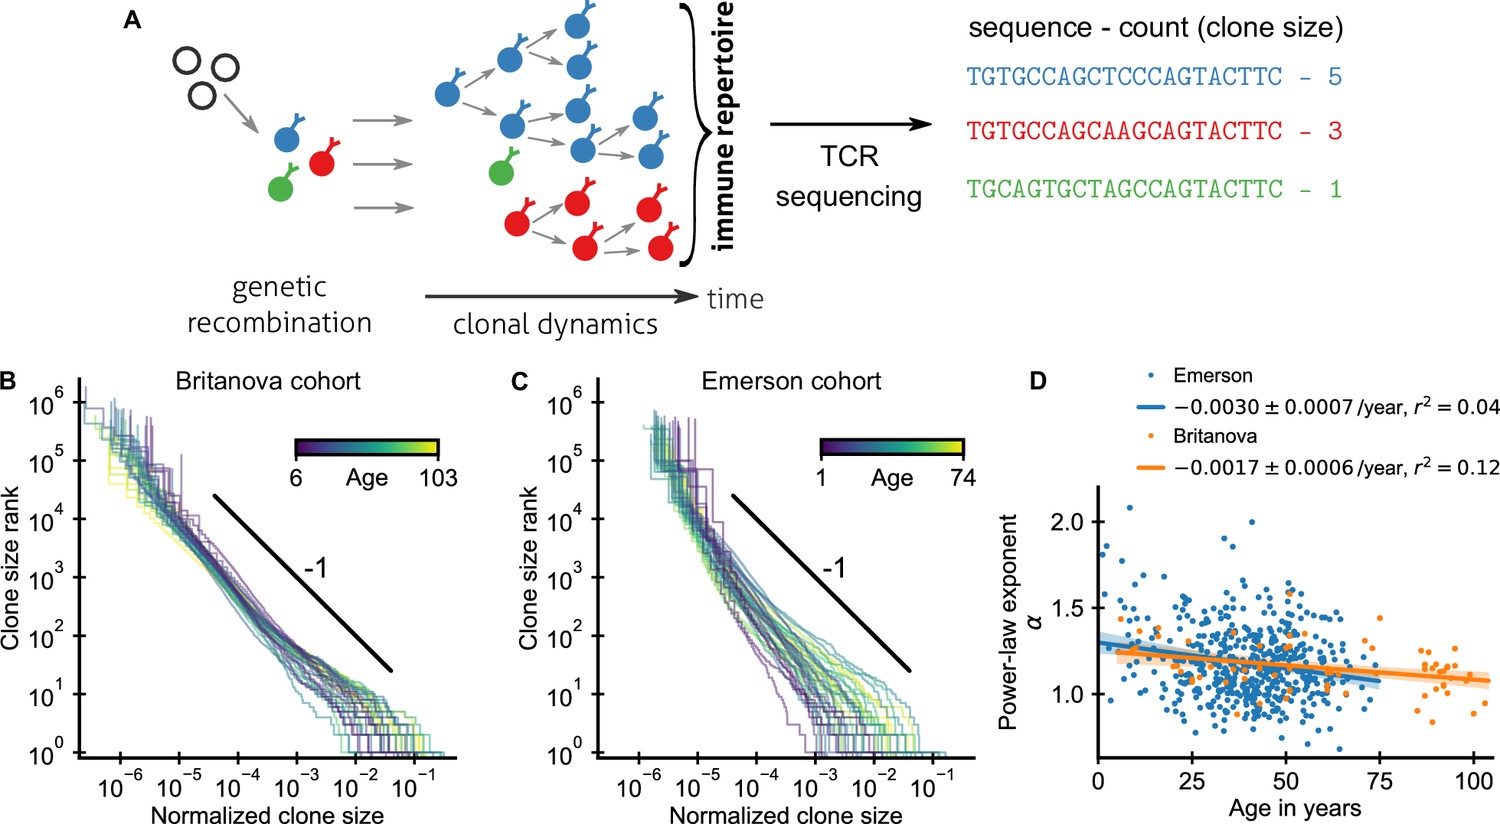
Statistics of human T cell repertoire organization.
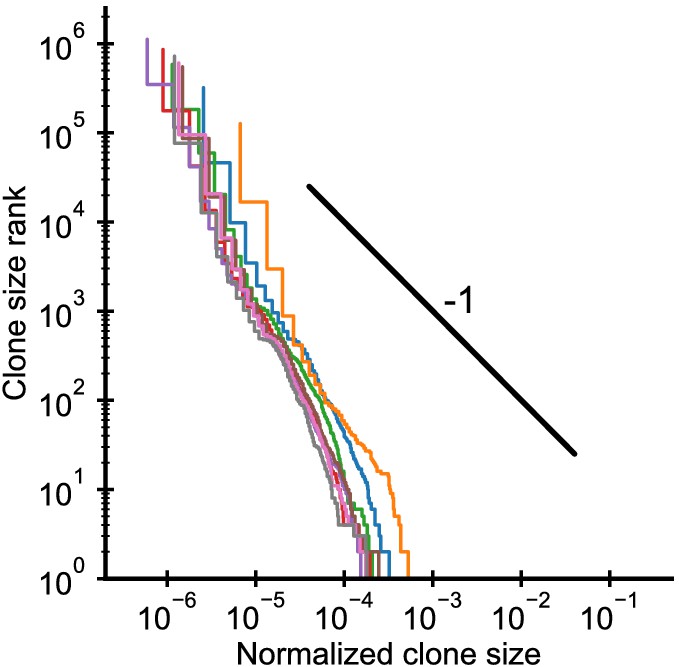
(A) T cells with highly diverse receptors are created from progenitor cells through genetic recombination (left), which then undergo clonal selection (middle) together shaping the immune repertoire. The T cell receptor (TCR) locus acts as a natural barcode for clonal lineages, which can be read out by sequencing (right). (B, C) Clone size distributions in two large cohort studies of human blood samples using disparate sequencing protocols display a power-law relationship between the rank and size of the largest clones. Each line shows the size distribution of all T cell clones in an individual in an unsorted blood sample, that is independently of the phenotypes of the cells making up the different clones. Ages are color coded as indicated in the legend. The black line shows a power law with a slope of -1 for visual comparison. Normalized clone sizes were defined as the number of reads of a given receptor’s sequence divided by the total number of reads within a sample and a factor equal to the average fraction of T cells with memory phenotype at different ages to account for variations in sampling depth and in the subset composition of peripheral blood, respectively (Figure 1—figure supplement 3). Only a single individual is displayed per 2-year age bracket to improve visibility. (D) Power-law exponents as a function of the age (legend: linear regression slope and coefficient of determination). Data sources: Britanova et al., 2016, Emerson et al., 2017.
Figure 1—figure supplement 1
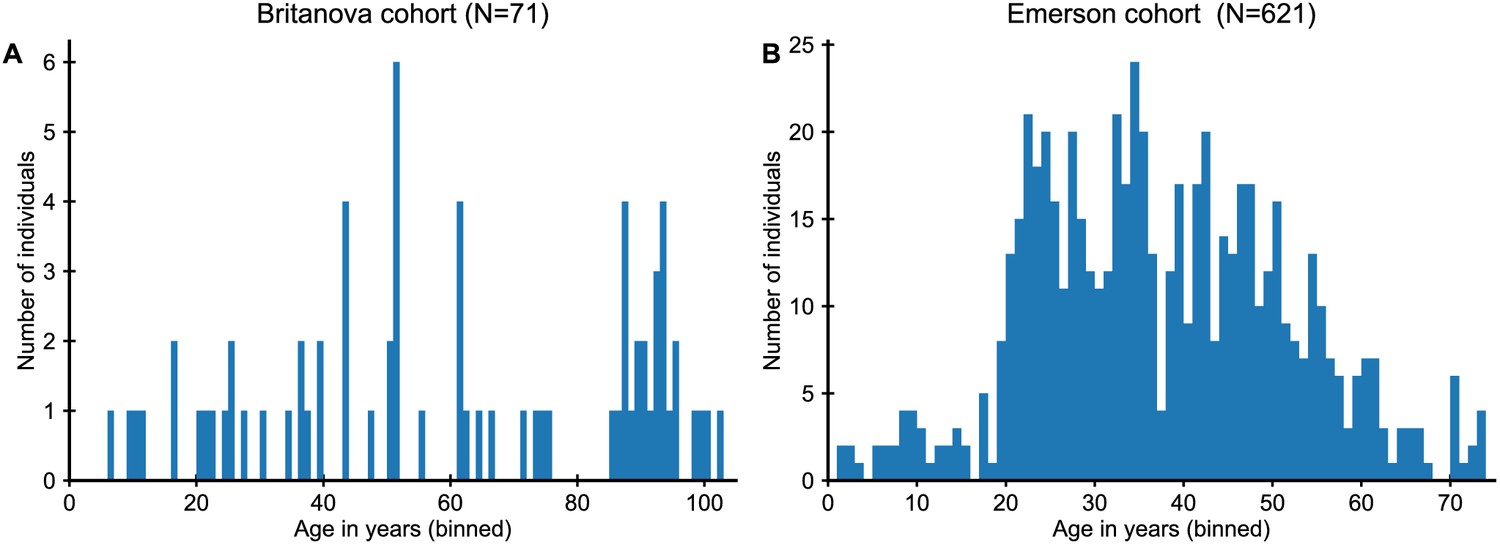
Cohort age distributions.
Figure 1—figure supplement 2
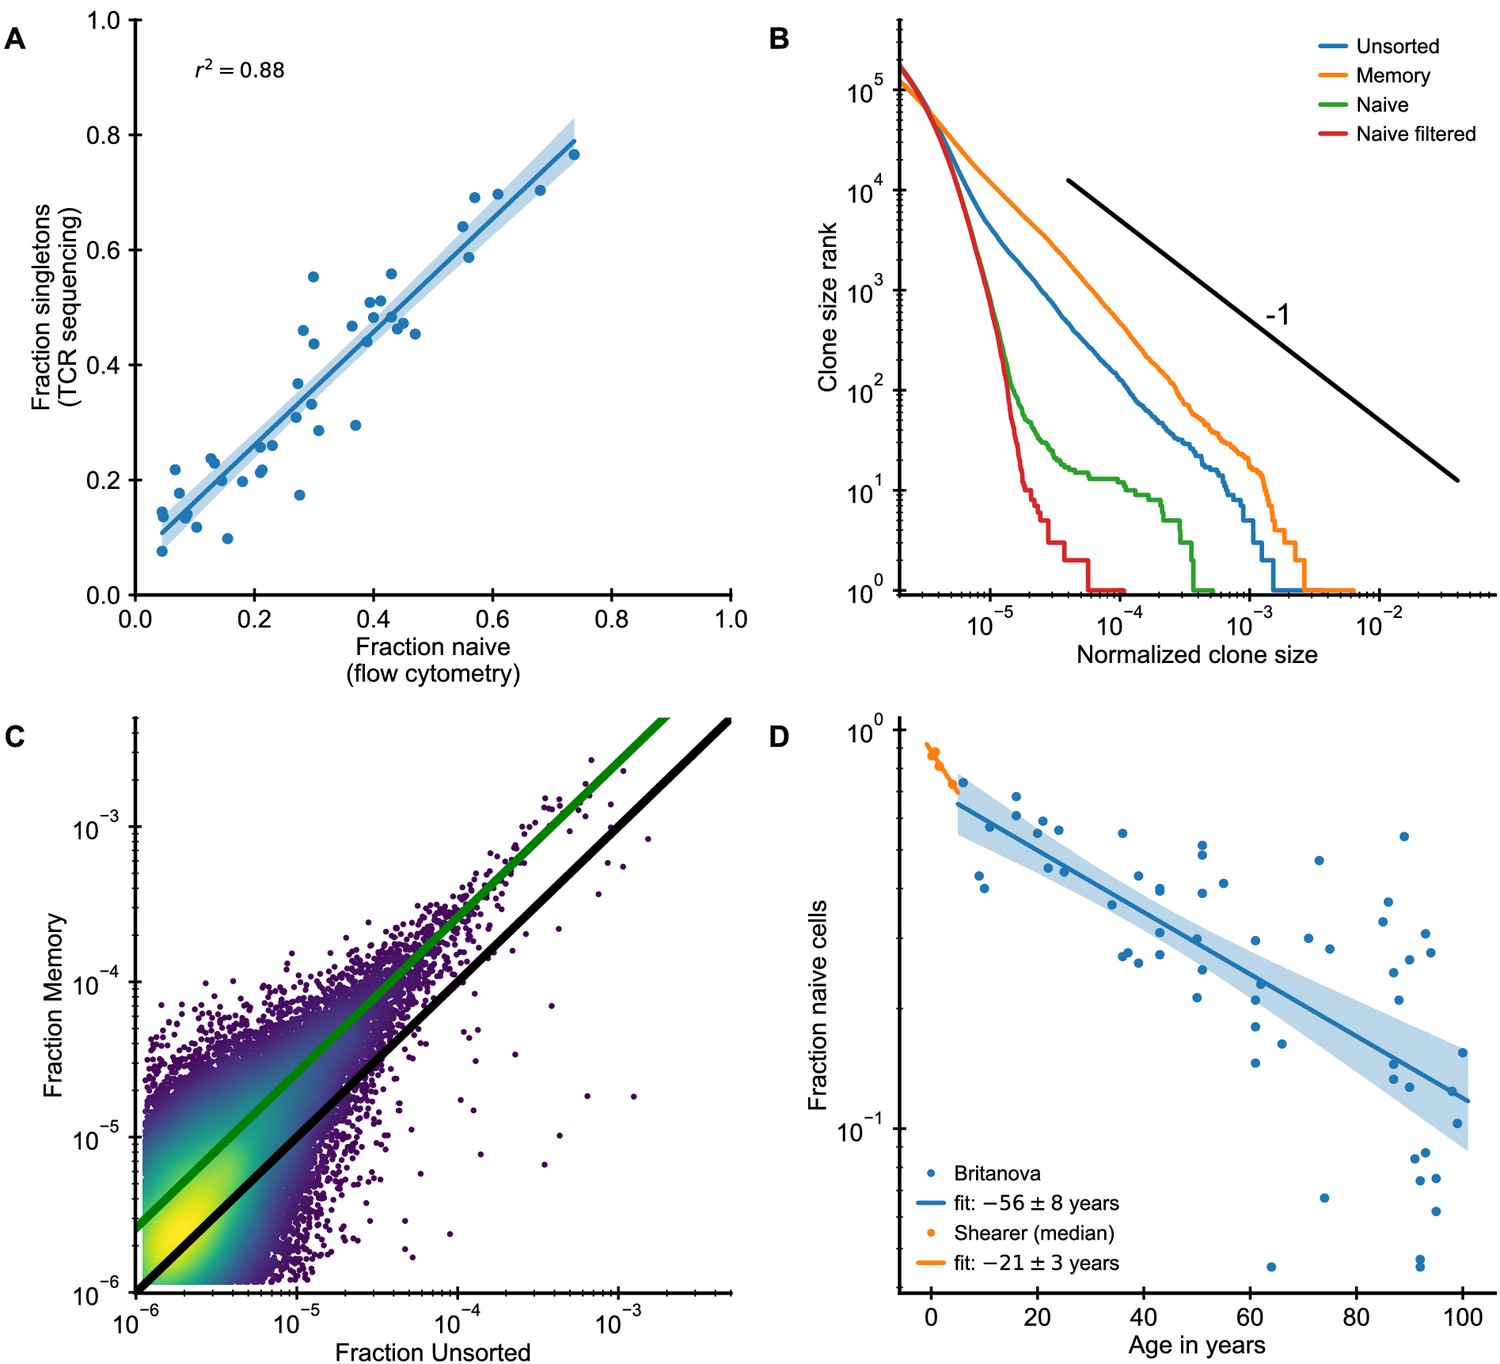
Clone size distributions in phenotypically sorted T cell subsets.
(A) The naive cell fraction as determined by flow cytometry and the fraction of singletons are closely correlated in the Britanova cohort. To diminish the influence of sampling depth variations, we computationally subsampled all repertoires to an equal sample size of 5 · 105 counts. (B,C) Analysis of unsorted (TCR sequencing from all peripheral blood mononuclear cells), memory (CD3+, CD45+), and naive (CD3+, CD45RA+) blood samples from the same individual (Data source: Chu et al., 2019). (B) Clone size distributions in the different T cell compartments. Filtering naive clones that are also found in the memory compartment removes most large naive clones. (C) Frequency of large clones in the memory sample is shifted upwards relative to their frequency within the unsorted sample. Color represents logarithm of local kernel density estimate in regions with overplotting. The solid lines are guides to the eye (black line represents equal frequency, green line 2.6-fold higher frequency in the memory compartment). (D) The fraction of naive cells decreases with age (Data source: Britanova et al., 2016) starting in early infancy (Data source: Pediatric AIDS Clinical Trials Group et al., 2003). The legend shows the fitted time constant of exponential decay (± SE).
Figure 1—figure supplement 3
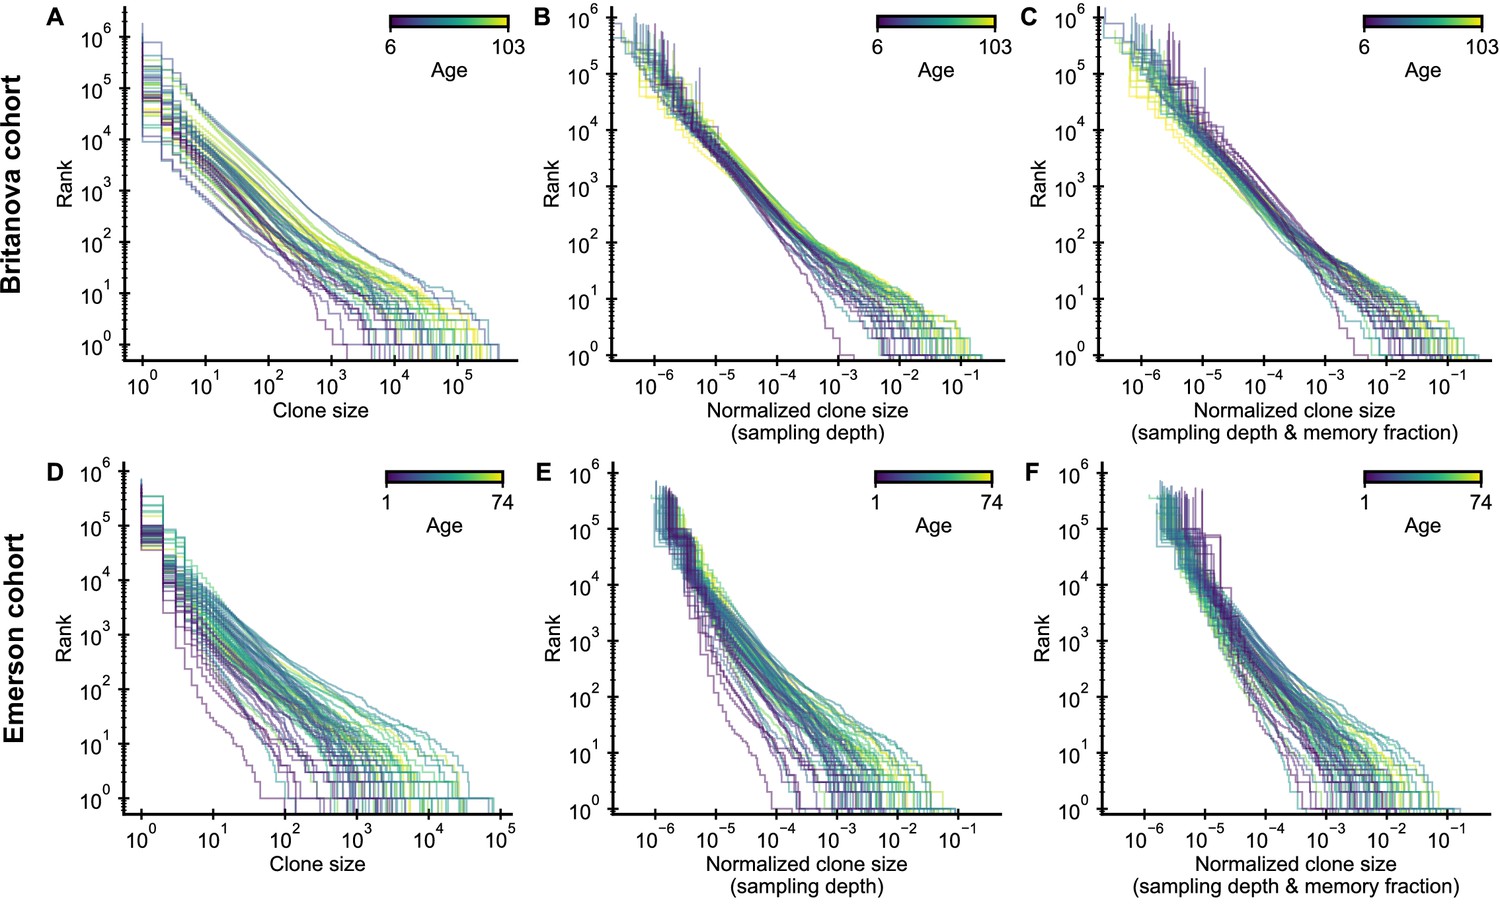
Influence of normalization procedure on clone size distributions.
(A,D) Raw clone size distributions show large variability due to different sample sizes. (B,E) A normalization by sampling depth removes much of this variation. (C,F) A normalization by the fraction of memory cells at different ages further collapses the tails of the clone size distributions.
Figure 1—figure supplement 4
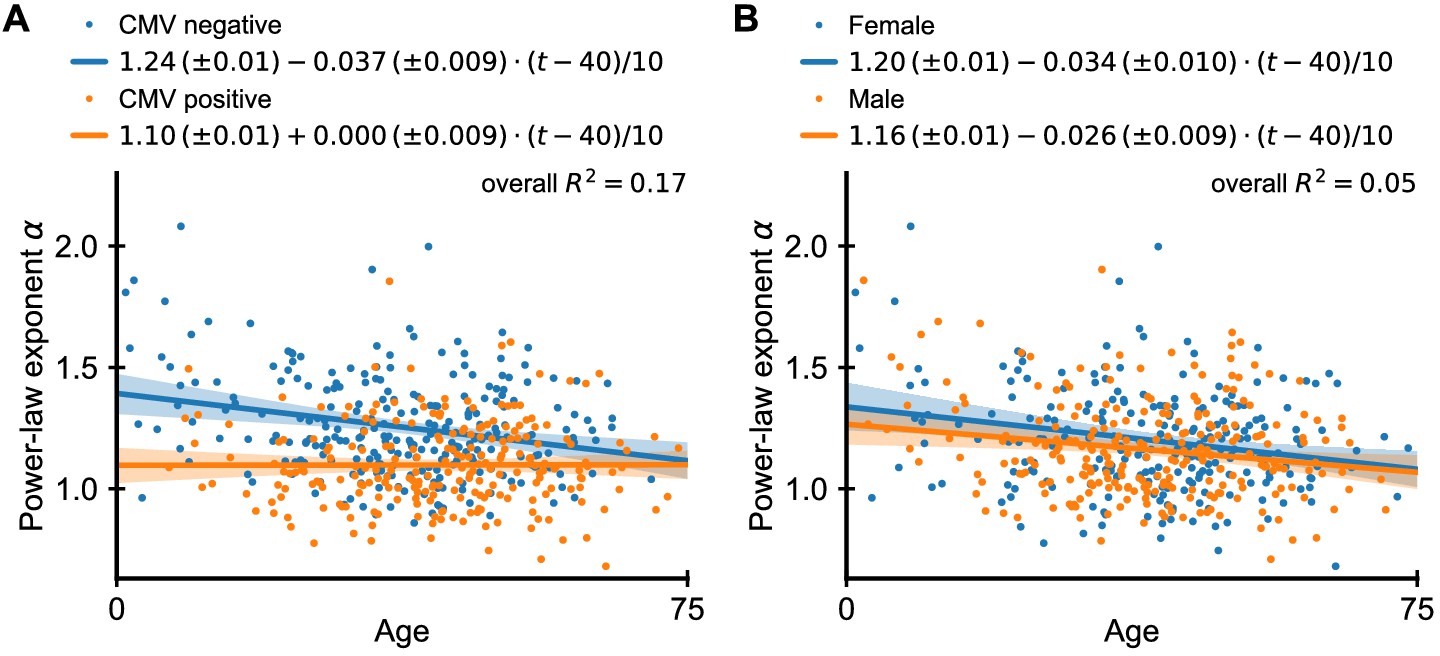
Dependence of power-law exponent on age by cytomegalovirus (CMV) infection status and sex.
(A) Chronic infection with CMV drives large clonal expansions (Lindau et al., 2019; Sylwester et al., 2005). We thus repeated the analysis of Figure 1C separating individuals based on their CMV infection status (fitted lines shown in legend, regression results displayed as offset + slope · (age in years - 40)/10). Overall, CMV-positive individuals have a smaller α than uninfected individuals, which is independent of age. The average exponent in CMV-negative individuals decreases slowly with age, and in old age coincides those of CMV-positive individuals. Combining CMV infection status and age explained a significantly larger proportion of the variance in scaling exponents (17%) than age alone. (B) Many immune determinants differ markedly between the sexes (Klein and Flanagan, 2016). We thus analyzed whether α depends on sex. We find that the dependence on age is similar among the sexes, but men have on average a slightly smaller exponent than women indicating a more skewed repertoire organization. Data source: Emerson et al., 2017.
Figure 1—figure supplement 5
Clone size distributions in cordblood.
Each line shows the distribution in one individual. The black line shows a power law with a slope of -1 for visual comparison. The fitted power-law exponents α = 2.1 ± 0.1 (mean ± SE) are larger than in adult repertoires, but clone sizes are already remarkably broad. Data source: Britanova et al., 2016.
Figure 2 with 3 supplements
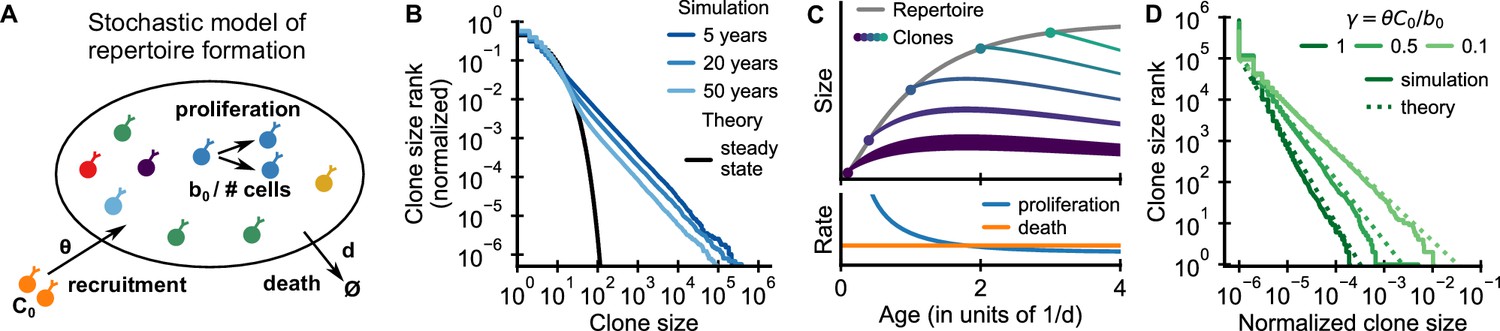
Emergence of power-law scaling of clone sizes in a minimal model of repertoire formation.
(A) Sketch of the stochastic dynamics of recruitment, proliferation, and death of T cells. Proliferation is inversely proportional to total repertoire size, which reflects increased competition as the repertoire grows. (B) Clone size distributions in simulated repertoires display power-law scaling (blue lines), in contrast to steady-state predictions that conform with those of a null model based only on demographic stochasticity (black line, Equation 48). (C) Illustration of the mechanism: early in life rates of proliferation exceed clonal turnover (lower panel). As the total repertoire size increases (gray line, upper panel) the proliferation rate decreases due to increased competition. The dynamics of selected clones after their recruitment marked by a dot is indicated by colored lines (upper panel). The line position shows the cumulative size of all prior clones, while the line width indicates the size of the clone (not to scale). The earlier a clones is recruited the larger it expands during the period of overall repertoire growth. (D) Dependence of the clone size distribution on parameters. Simulated repertoires at 5 years of age were subsampled to 106 cells to mimick the experimental sampling depth (solid lines). The simulated data closely follow predictions from a continuum theory of repertoire formation (dashed lines). Model parameters: (B,D) clonal death rate d = 0.2/year, clonal recruitment rate θ = 106/year, clone size at recruitment C0 = 1; (B) total proliferation rate b0 = 107/year (implying a recruitment to proliferation ratio γ = 0.1), (D) variable b0 as indicated in the legend by the ratio γ.
Figure 2—figure supplement 1
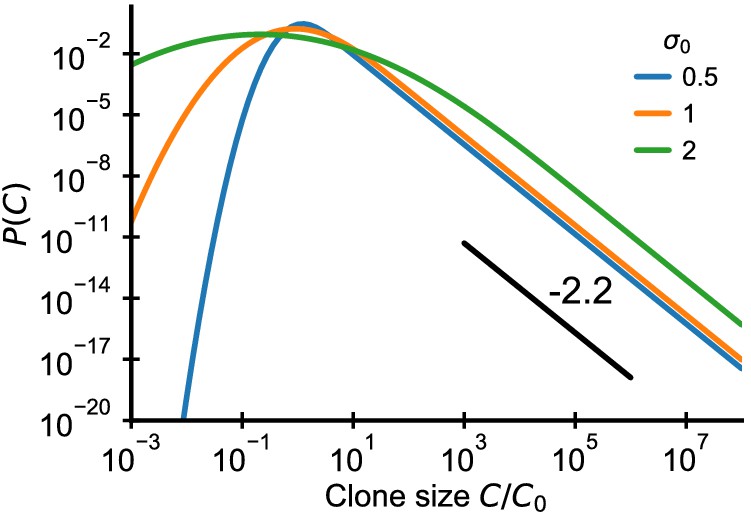
Analytical predictions for clone size distributions in a model with variable recruitment sizes.
Clone size distributions resulting from a variable recruitment size C0 (lognormal with standard deviation as indicated in legend) and repertoire growth (Equation 52). The black line shows a power law with a slope of -2.2 for visual comparison. Parameter: γ = 0.2.
Figure 2—figure supplement 2
Simulated clone size distributions in a model with saturation of proliferation rates.
Influence of a saturation of the proliferation rate, , on the clone size distribution. The saturation induces a change of the scaling behavior at the largest clone sizes. Parameter: b0 = 2 · 104/year, d = 0.2/year, θ = 2 · 103/year (implying γ = 0.1), simulation length 5 years.
Figure 2—figure supplement 3
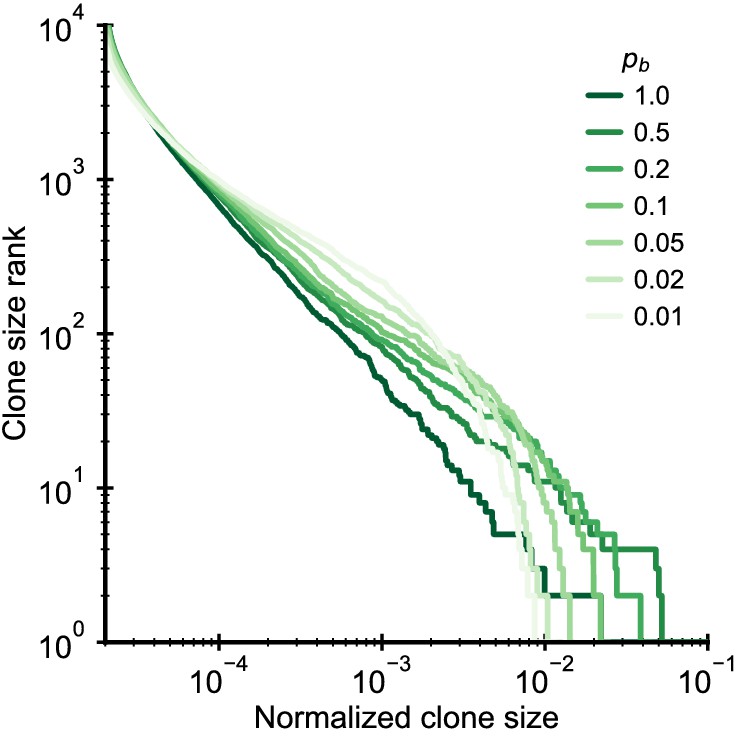
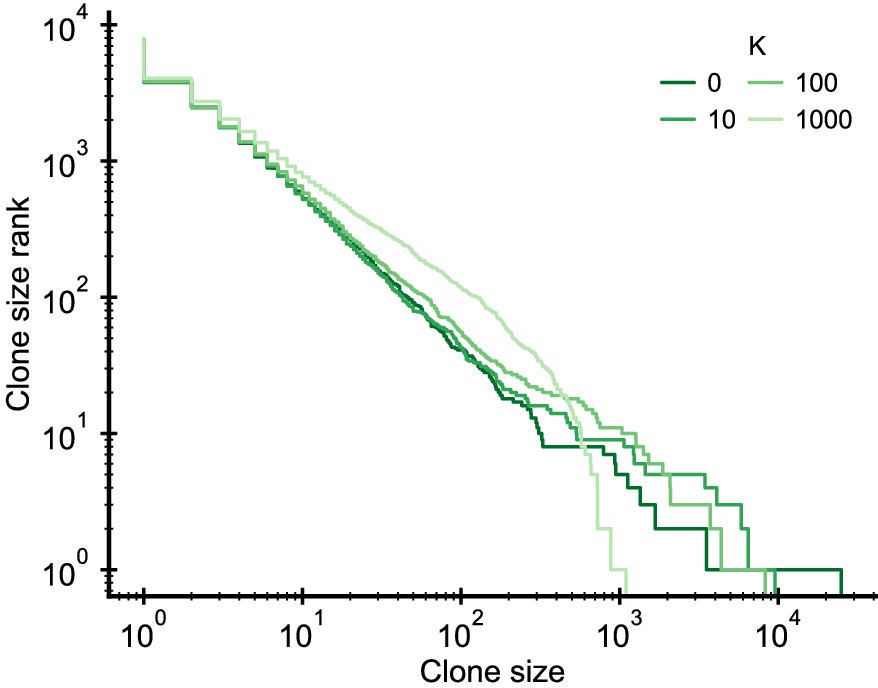
Simulated clone size distributions in a model with competition for clone-specific resources.
Clone size distributions in a simulated model where clones compete for specific antigens to which they bind with a probability pb. Model parameter: b0 = 104/year, θ = 103/year (implying γ = 0.1), Na = 1000, d = 0.2/year, simulation length 10 years.
Figure 3 with 4 supplements
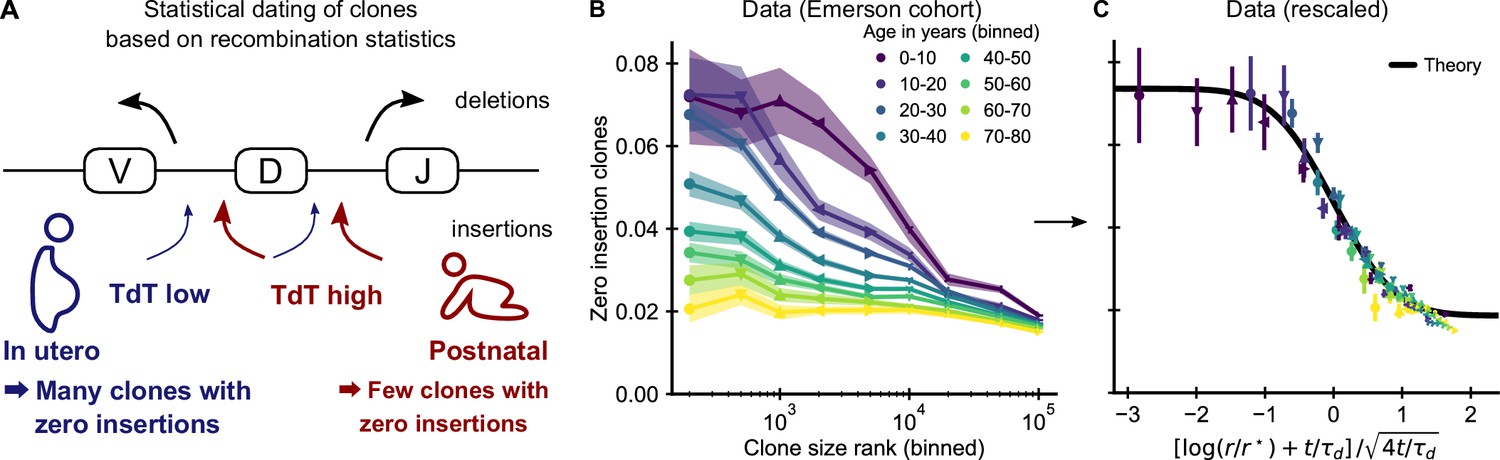
Statistical dating of clones reveals that early expansions have a long-lasting effect.
(A) Genetic recombination of a TCR involves the choice of a V, D, and J region among multiple genomically-encoded templates as well as the deletion and insertion of nucleotides at both the VD and DJ junctions. The enzyme TdT, which is responsible for nucleotide insertions, is not expressed during early fetal development. This allows a statistical dating of clonal ages, as clones with zero insertions at both junctions constitute a much larger fraction of all clones during a fetal and perinatal time window. (B) Fraction (± SE) of clones with zero insertions as a function of age and clone size. Clones are binned by their size into non-overlapping bins (rank 1–500, 501–1000, and so on; upper values are indicated on the x-axis). (C) Same data as in B displayed with a rescaled x-axis using fitted parameters τd = 9.1 ± 0.5 years, r* = 1.2 ± 0.2 ⋅ 104. The data collapses onto a sigmoidal function predicted by theory (Equation 3) with fitted p0,- = 0.074 ± 0.004, p0,+ = 0.0187 ± 0.0005 (black line). Data source: Emerson et al., 2017.
Figure 3—figure supplement 1
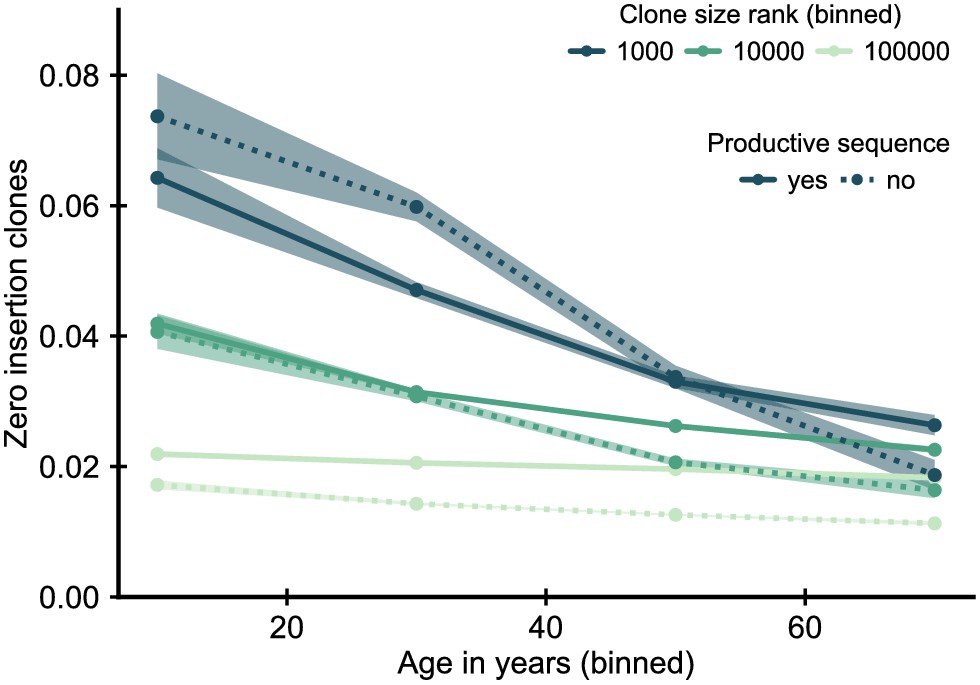
Fraction of zero insertion clones within productive and unproductive sequences.
Sequences with zero insertions code for a particular subset of all possible T cell receptors (TCRs), and some of their enrichment might represent a peripheral selective advantage of this subset of receptors. We thus asked how the enrichment depends on whether the sequence used to define the clone represents a productive or unproductive rearrangement. An unproductive rearrangement, in which the recombination process introduces a frameshift or stop codon, can be rescued by a second productive rearrangement, but is not expressed and thus not selected upon. Under the adult recombination statistics an unproductive zero insertion sequence is likely to be paired with a productive sequence with many insertions, and thus we would not expect to see a similar enrichment for unproductive sequences if a general peripheral selective advantage was causing the enrichment. Data source: Emerson et al., 2017.
Figure 3—figure supplement 2
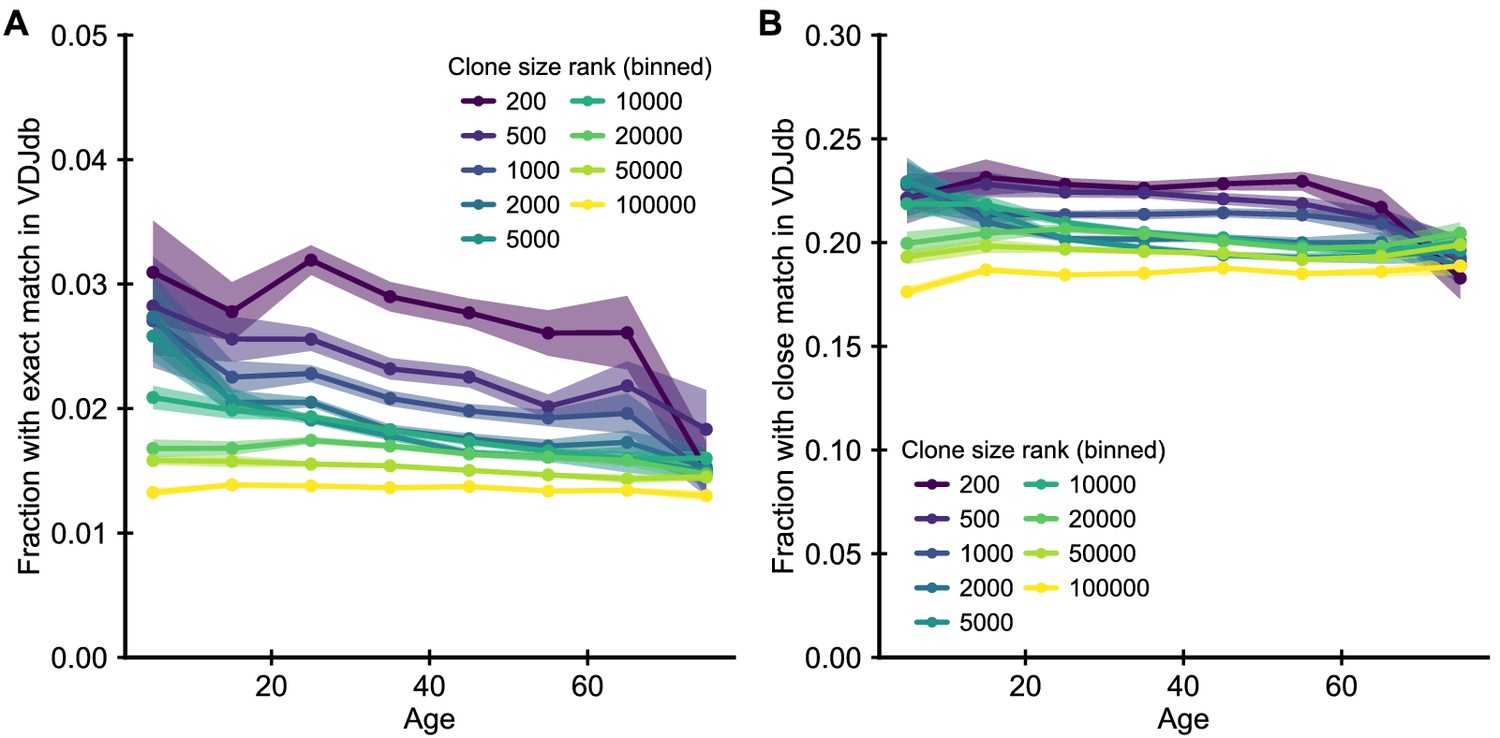
Enrichment of clones with known specificity.
(A) Fraction of clones with TCRs that have exact matches in the VDJdb (Shugay et al., 2018) of known antigen specificities. (B) Fraction of clones with close matches (defined as nearest neighbor sequences in a Levenshtein distance sense, that is sequences with a single amino acid substitution, insertion or deletion). T cells known to be specific to particular antigens are enriched among the most abundant clones. However, there is little change in this enrichment as a function of age. Data source: Emerson et al., 2017.
Figure 3—figure supplement 3
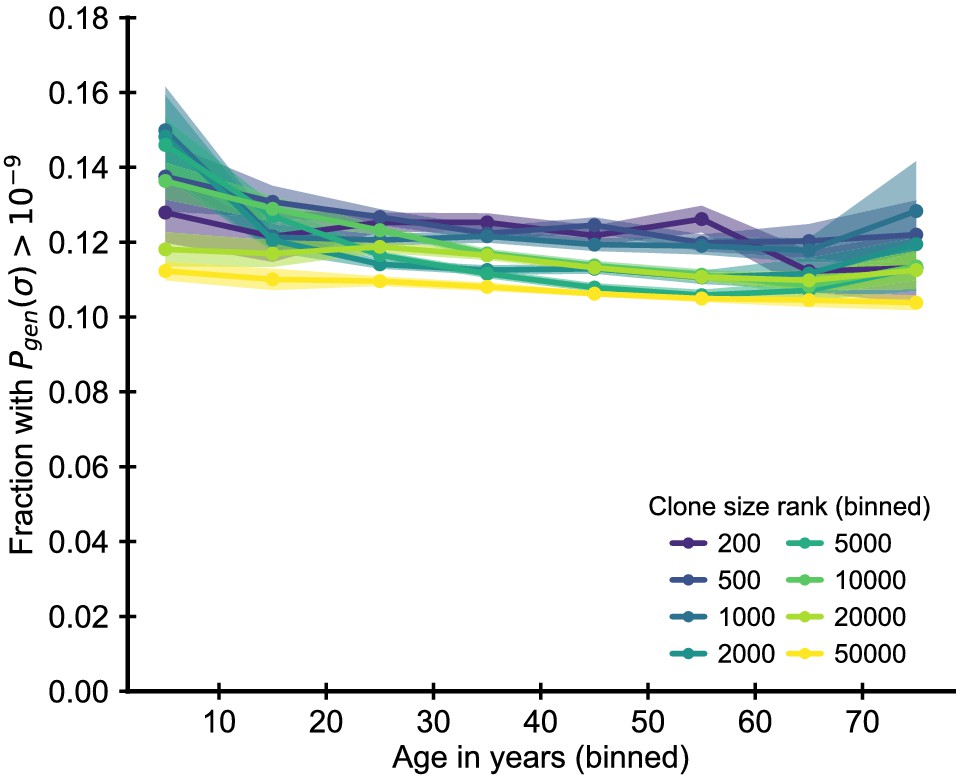
Enrichment of clones with high probability of generation.
Fraction of clones with T cell receptor (TCR) sequences with a probability of generation higher than 10-9. The probability of generation was calculated based on the nucleotide sequence using a probabilistic model of recombination with default parameters for human TCR sequences (Sethna et al., 2019). To remove confounding by the early expansionary dynamics, we excluded zero insertion clones as most of these clones also have high probability of generation. We find that clones with high are moderately more likely to be large. In comparison to the zero insertion clones, there is little change in their enrichment as a function of age. Data source: Emerson et al., 2017.
Figure 3—figure supplement 4
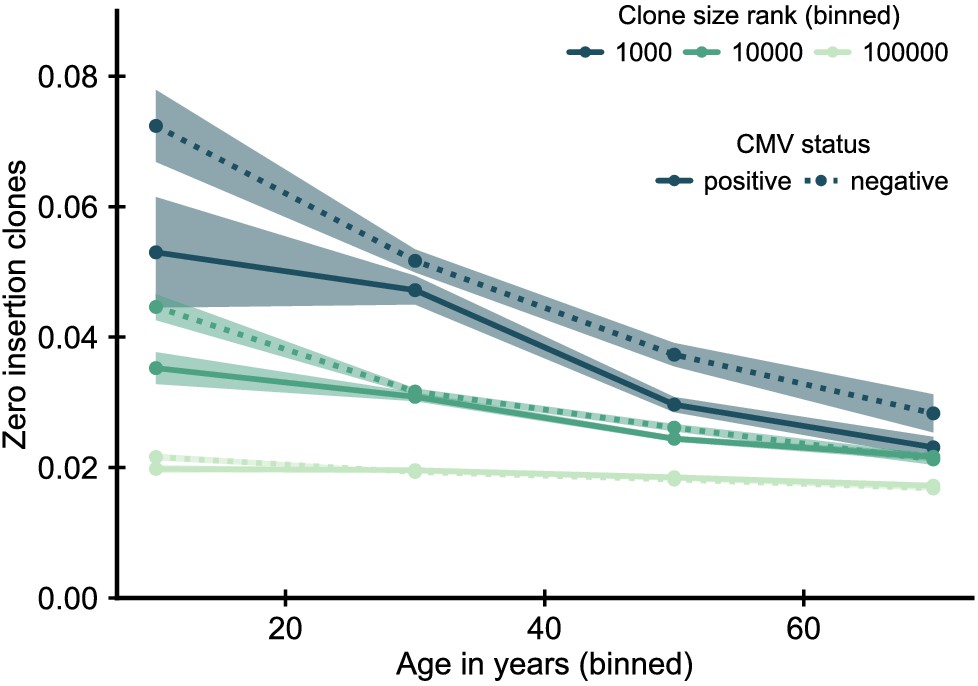
Fraction of zero insertion clones as function of age and clone size by cytomegalovirus (CMV) infection status.
In CMV positive individuals zero insertion clones are less enriched among the largest clones. Data source: Emerson et al., 2017.
Figure 4 with 3 supplements
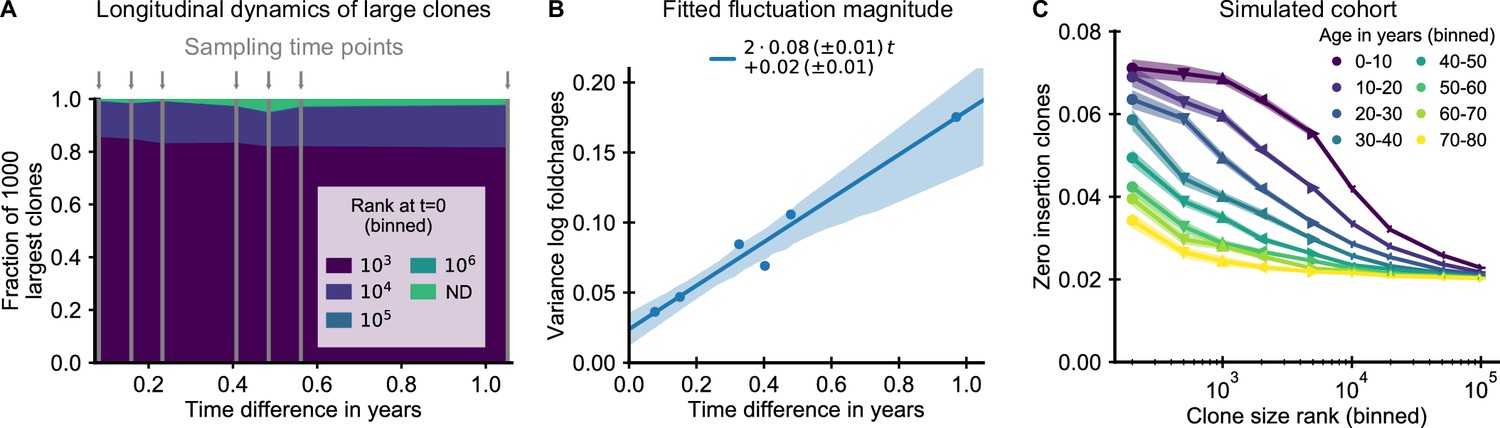
The small magnitude of longitudinal clone size fluctuations implies a slow reordering of the clone size hierarchy.
(A,B) Longitudinal clonal dynamics in a healthy adult over a one year time span. (A) Fraction of the 1000 largest clones that fall within a specific clone size rank bin at the earliest time point. A small number of clones was not detected at all at the first time point (ND) likely representing recently expanded clones. All other clones were already among the largest clones initially. (B) Variance of log-foldchanges in clone size as a function of time difference for the 250 largest clones. (C) Fraction of clones with zero insertions as a function of age and clone size in a simulated cohort using a magnitude of clonal growth rate fluctuations inferred from the longitudinal data. Data source: Chu et al., 2019.
Figure 4—figure supplement 1

Provenance of large T cell clones for all subjects.
Longitudinal analysis of the origin of the 1000 largest clones at each time point (indicated by arrows) in three healthy adults over a 1-year time frame. For each clone, we determined whether it was also sampled at the earliest time point, and if so at what clone size. The plot displays the fraction of clones that fall within a specific clone size rank bin at the first time point. At all times, a majority of clones was already large initially. A small fraction was not detected at all at the first time point (ND) likely representing recently expanded clones. (Supplement to Figure 4A which corresponds to panel C.) Data source: Chu et al., 2019.
Figure 4—figure supplement 2

Dynamics of large persistent clones for all subjects.
Dynamics of the 250 largest clones from second time point onwards excluding those not sampled at the first time point. (A-C) Fraction of the repertoire represented by these clones (sum of their normalized clone sizes); (D-F) mean and (G-I) variance of the log-foldchanges of their normalized clone sizes relative to time point 2. (Supplement to Figure 4B which corresponds to panel I.) Data source: Chu et al., 2019.
Figure 4—figure supplement 3

Data collapse by parameter rescaling for the simulated cohort.
Same data as in Figure 3F displayed with a rescaled x-axis using fitted parameters . The data collapses onto a sigmoidal function predicted by theory (Equation 3) with fitted , (black line).
Figure 5

Validation of the mean-field approximation.
Comparison of full stochastic simulations and simulations using mean-field competition. Parameter: /year, /year, /year (implying = 0.1), simulation length 5 years.
Figure 6
Fluctuating fitness model out-of-steady state.
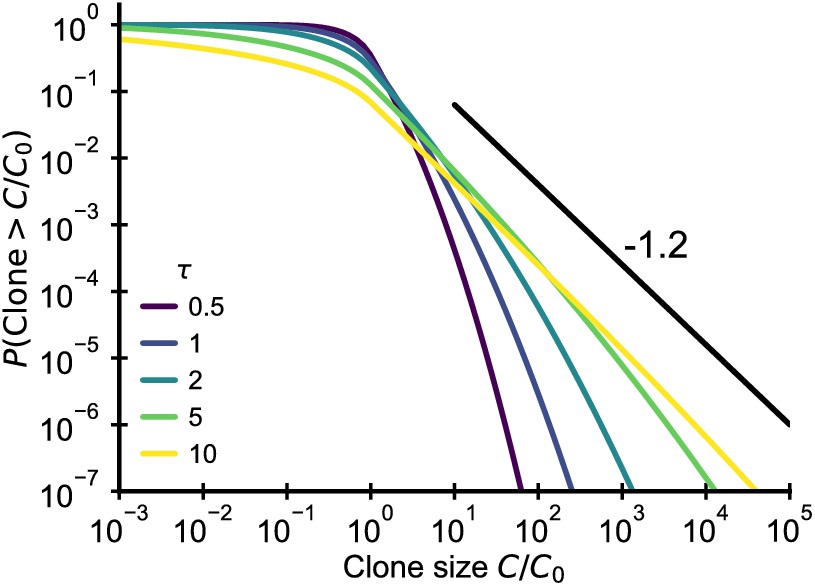
Analytical predictions for the clone size distributions in a geometric Brownian motion fluctuating fitness model (Integral of Equation 26) as a function of effective age . The black line shows the asymptotic prediction for the steady-state scaling. Parameter: .
Appendix 1—figure 1

Estimated power-law exponents converge to correct value using trimming method.
Fitted exponent as a function of the cutoff choice in simulated data (errorbars ±2 SE over 50 independent draws). The fitted exponent changes drastically for small before leveling off indicating deviations from true power-law scaling at the smallest clone sizes. Such a deviation is expected due to subsampling despite the true power-law scaling in the underlying distribution (see text). Simulations: 107 clones were drawn from a discrete power-law distribution with . A sample of size cells was then drawn from the underlying power law based on a Poisson (blue dots) or negative binomial sampling (orange and green dots show two choices of the overdispersion coefficient a).
Appendix 1—figure 2
Influence of choice of on fitted power-law exponent for empirical data.
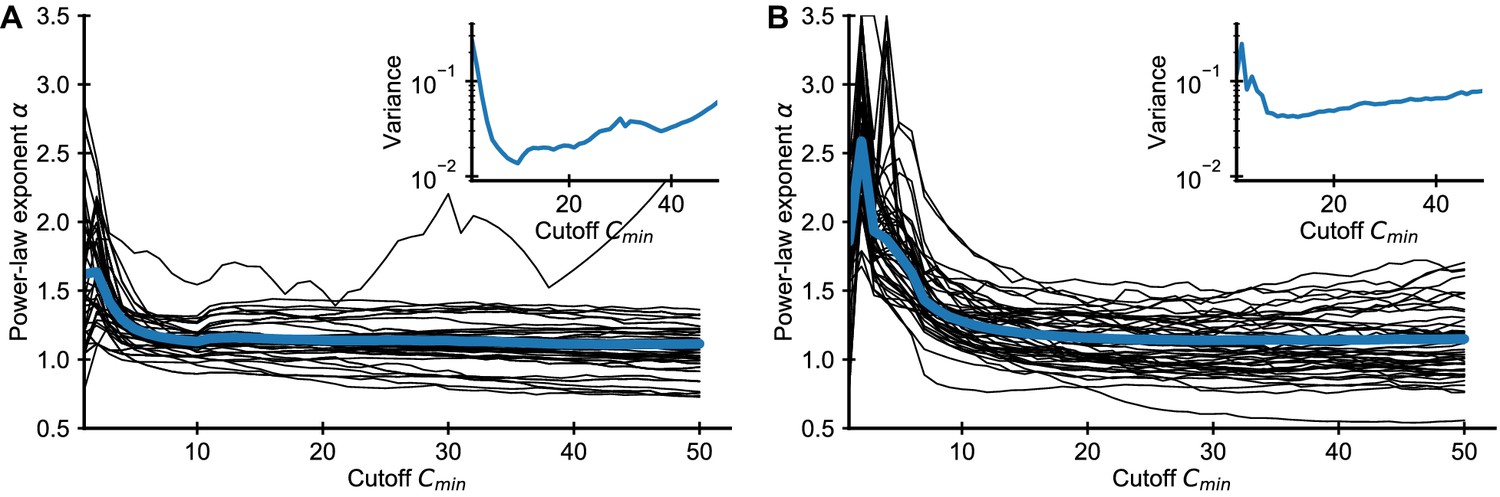
Fitted exponent as a function of the cutoff choice (black lines: 50 random repertoires, blue line: mean) in the (A) Britanova et al. and (B) Emerson et al. datasets. The fitted exponent changes drastically for small before leveling off indicating deviations from true power-law scaling at the smallest clone sizes, similarly to those seen in simulated data (Figure 1). To alleviate the bias induced by finite sampling, we choose a cutoff value , for which the power-law exponent estimates have leveled off. For large the variance of fitted exponent increases as more and more data is excluded from the fit (A, B inset), which sets a practical upper bound for choosing .
Appendix 1—figure 3
Graphical display of subsampled power-law distributions.
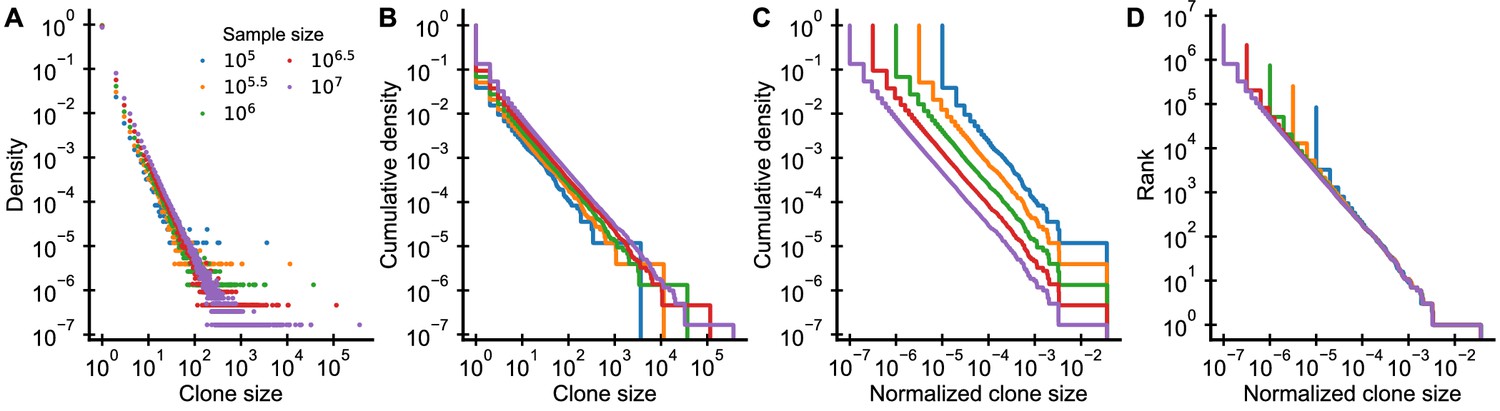
(A-D) Show various ways of displaying clone size distributions obtained by subsampling an underlying clone size distribution consisting of 108 clones drawn according to to various sampling depths. (A) The empirical probability density function of clone sizes, (B) its cumulative density, as well as (C) the cumulative density of normalized clone sizes are not invariant under changes of the sampling depth. Only the tail behavior of relative frequencies of finding cells from large clones is reproducibly captured, which makes rank-frequency plots (displays of unnormalized cumulative distributions of normalized clone sizes) the method of choice for collapsing clone size distributions at various sampling depths.
Tables
Table 1
Repertoire sequencing data used in this study.
Table 2
Parameters of the minimal model of repertoire formation (Figure 2B).
| Parameter | Explanation | Value |
|---|---|---|
| d | death rate | 0.2/year |
| recruitment to proliferation ratio | 0.1 | |
| recruitment rate | 106/year | |
| C0 | recruitment size | 1 |
Table 3
Parameters of the simulated cohort (Figure 3C).
| Parameter | Explanation | Value |
|---|---|---|
| Magnitude of clone size fluctuations | 0.08/year | |
| d | Death rate | 0.2/year |
| Recruitment to proliferation ratio | 0.1 | |
| Recruitment rate | 105/year | |
| Zero insertion fraction early in life | 0.07 | |
| Adult zero insertion fraction | 0.02 | |
| Time of recombination statistics switch | 0.05 years | |
| Simulated sample size | 5 ⋅ 105 |
Additional files
Download links
A two-part list of links to download the article, or parts of the article, in various formats.
Downloads (link to download the article as PDF)
Open citations (links to open the citations from this article in various online reference manager services)
Cite this article (links to download the citations from this article in formats compatible with various reference manager tools)
Early life imprints the hierarchy of T cell clone sizes
eLife 9:e61639.
https://doi.org/10.7554/eLife.61639


