A Bayesian analysis of the association between Leukotriene A4 Hydrolase genotype and survival in tuberculous meningitis
- Molecular Immunity Unit, Department of Medicine, University of Cambridge, MRC Laboratory of Molecular Biology, United Kingdom
- Trinity College, United Kingdom
- Department of Internal Medicine and Radboud Center for Infectious Diseases (RCI), Radboud Institute for Molecular Life Sciences (RIMLS), Radboud University Medical Center, Netherlands
- Oxford University Clinical Research Unit, Viet Nam
- Universitas Padjadjaran, TB-HIV Research Center, Faculty of Medicine, Indonesia
- Department of Neurology, Faculty of Medicine/Hasan Sadikin Hospital, Universitas Padjadjaran, Indonesia
- Centre for Tropical Medicine and Global Health, Nuffield Department of Medicine, University of Oxford, United Kingdom
- Department of Pathology and Laboratory Medicine, Perelman School of Medicine, University of Pennsylvania, United States
Figures
Figure 1
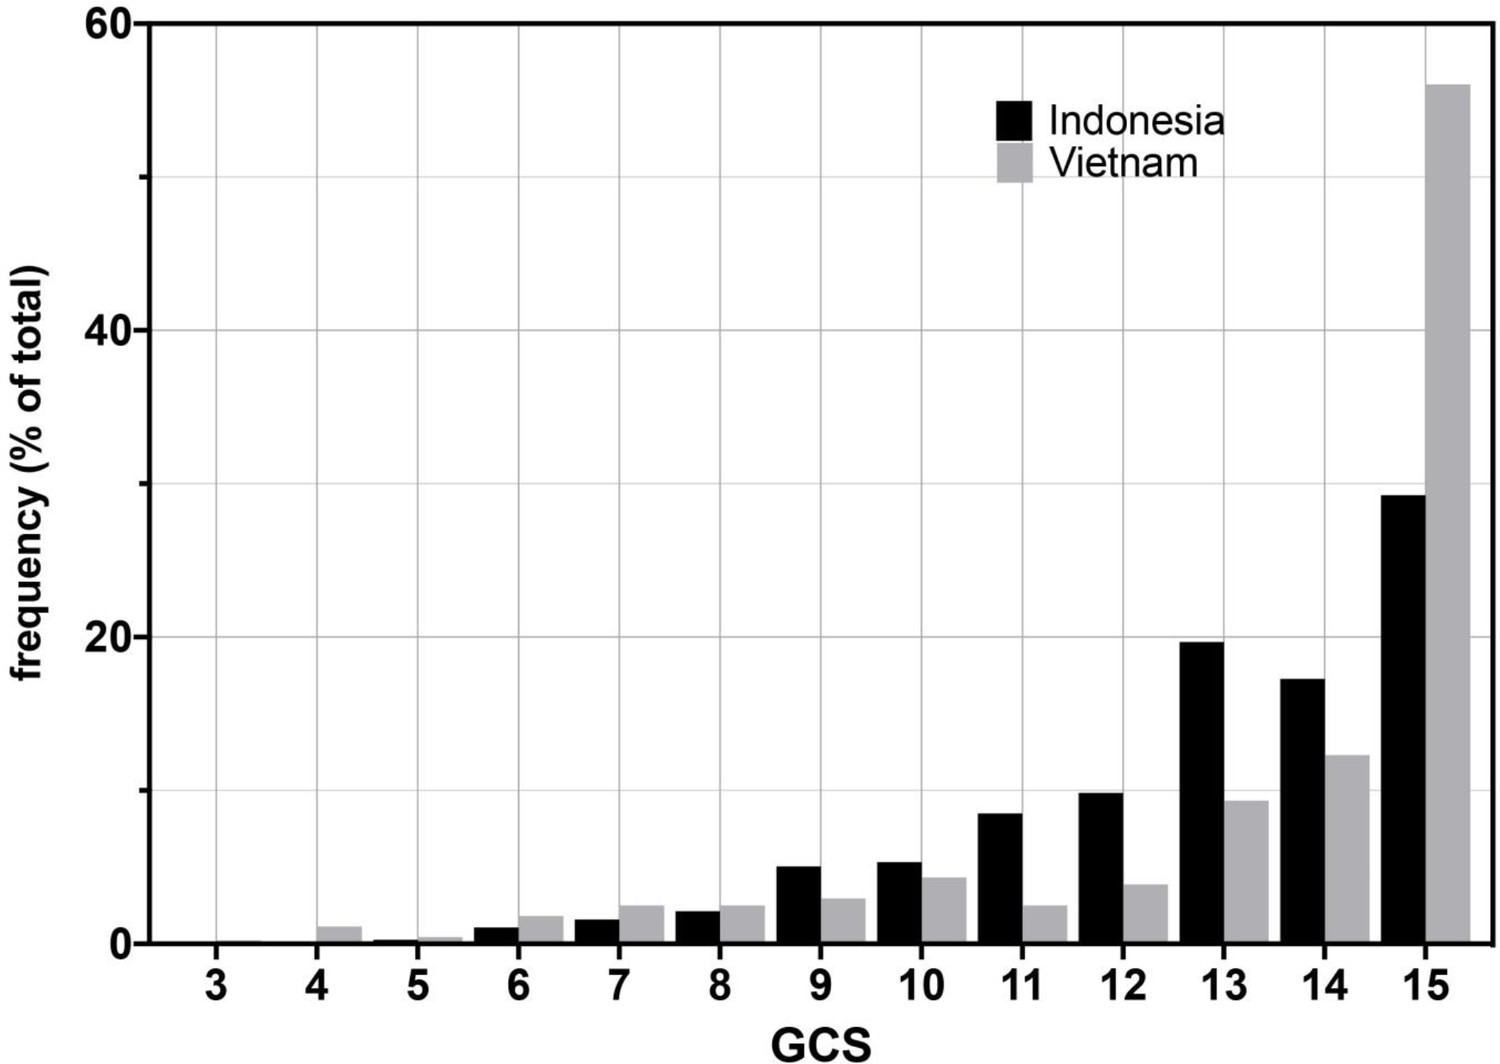
Glasgow Coma Scores (GCS) for Vietnam and Indonesia patients.
Frequency of GCS values indicated on the Y-axis as a percentage of the total cohort (n = 376 Indonesia, n = 439 Vietnam). Bayesian posterior probabilities of significant differences between Vietnam (VN) and Indonesia (IN) for mean GCS comprising Grade 2, VN > IN P 0.99996 (15 VN > IN p=0.99999; 11–14 VN < IN P ranging from 0.99985 (13) to 0.98 (14); rest of the values non-significant); for GCS comprising Grade 3, VN > IN, P 0.01 (GCS4, 0.98; GCS9, 0.04; all others not significant).
Figure 2
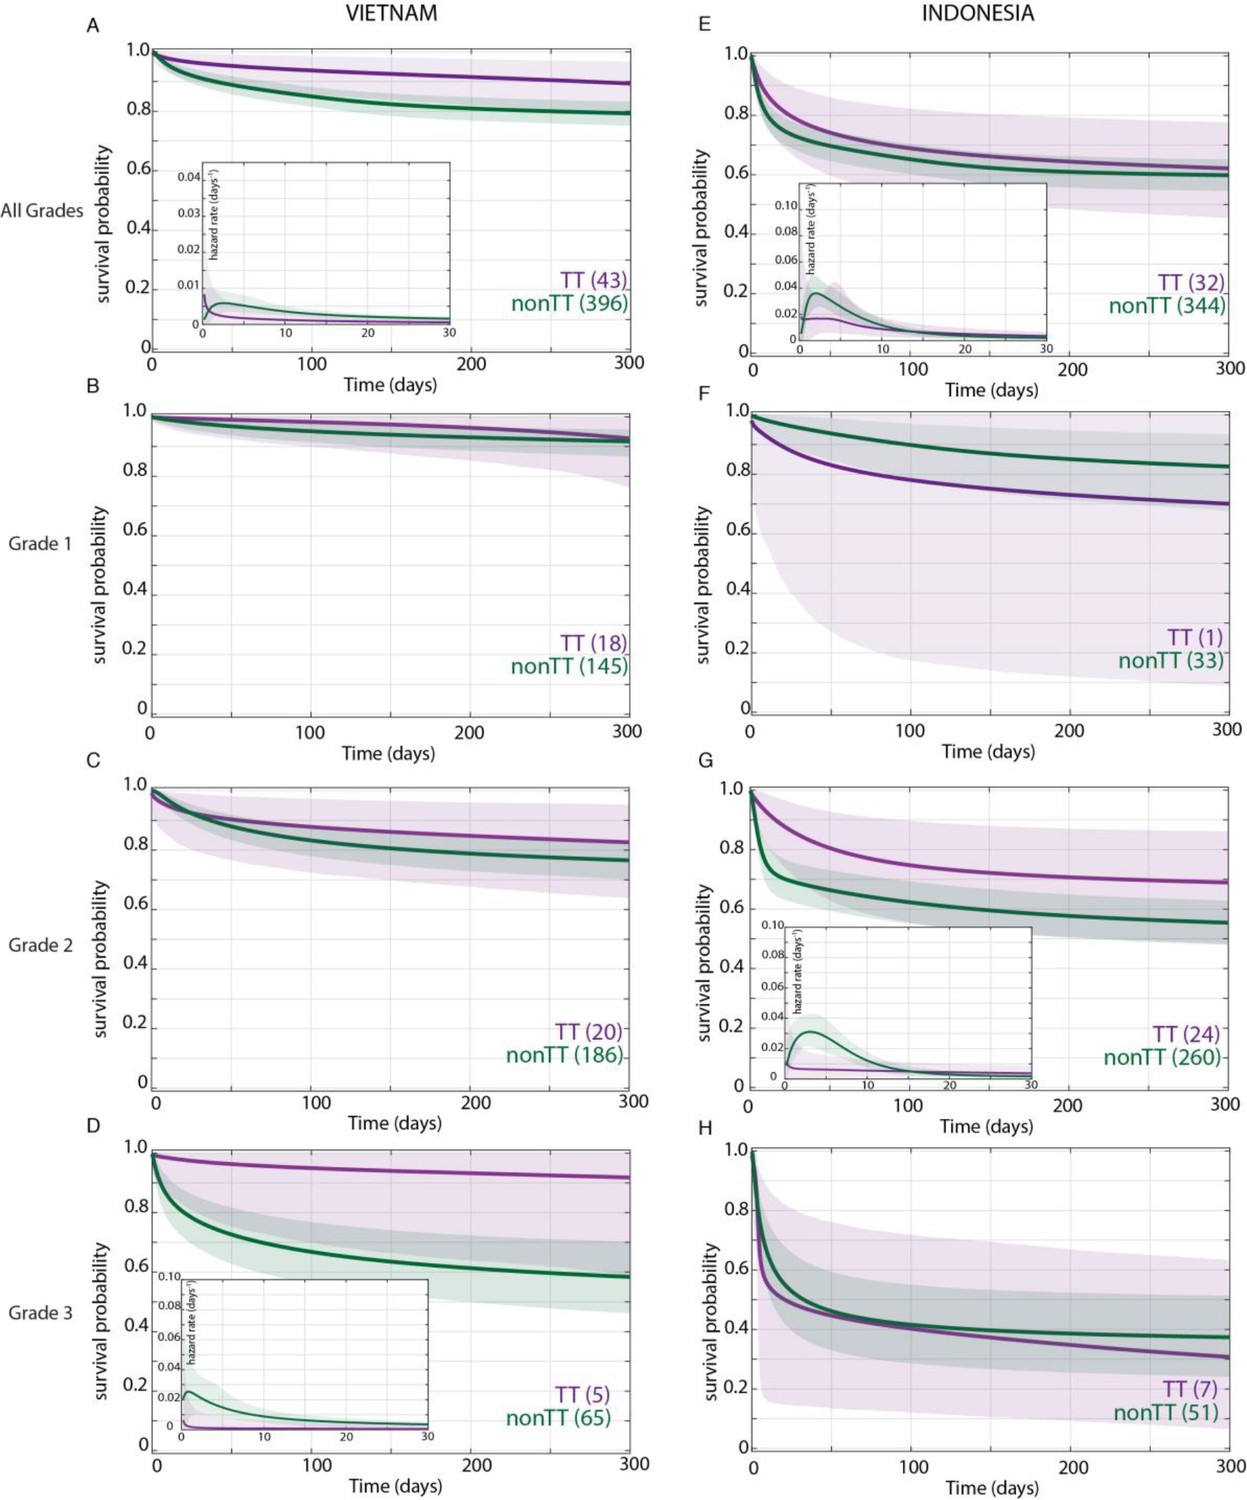
Effect of LTA4H rs17525495 genotype on patient survival.
Survival probability over all grades in Vietnam (A) and Indonesia (E), and stratified by grade (B–D, F–H). Coloured lines represent mean posterior survival probability curves for the nine-month observation period. Shaded areas represent 95% Bayesian confidence limits for posterior probability. Comparisons where TT (purple) to non-TT (green) differences were significant have boxed insets showing hazard rates for the first 30 days; all other comparisons, not significant. The number of patients at the starting time point are indicated in parentheses. In Vietnam, overall (A), TT survival was significantly higher than non-TT from day 39 onwards with maximum probability 0.98, survival gap 11%; non-TT hazard rate was significantly higher than TT from day 4 to day 120, with their ratio peaking at 3 on day six and remaining >1 until day 223. (D) Grade 3 TT survival was significantly higher from day 3 onwards with maximum probability 0.97, survival gap 30%. The TT hazard rate dropped from the start, while the non-TT hazard peaked at 16 times higher than TT on day 3; non-TT over TT hazard rate ratio remained >1 throughout. In Indonesia, overall (E), TT survival was non-significantly higher than non-TT (maximum probability 0.92); the non-TT hazard rate was greater than the TT hazard rate from day 1 to day 13, significantly so (and by 2-fold) on days 2 and 3 (maximum probability 0.97). (F) Grade 1 comparisons were uninformative due to TT sample size (n = 1). (G) Grade 2 TT survival was significantly higher on days 4–32 with maximum probability 0.99, survival gap 9%. The TT hazard rate dropped from the start, while the non-TT hazard peaked at five times higher than TT on day 3. The non-TT over TT hazard rate ratio remained >1 until day 15.
Figure 3
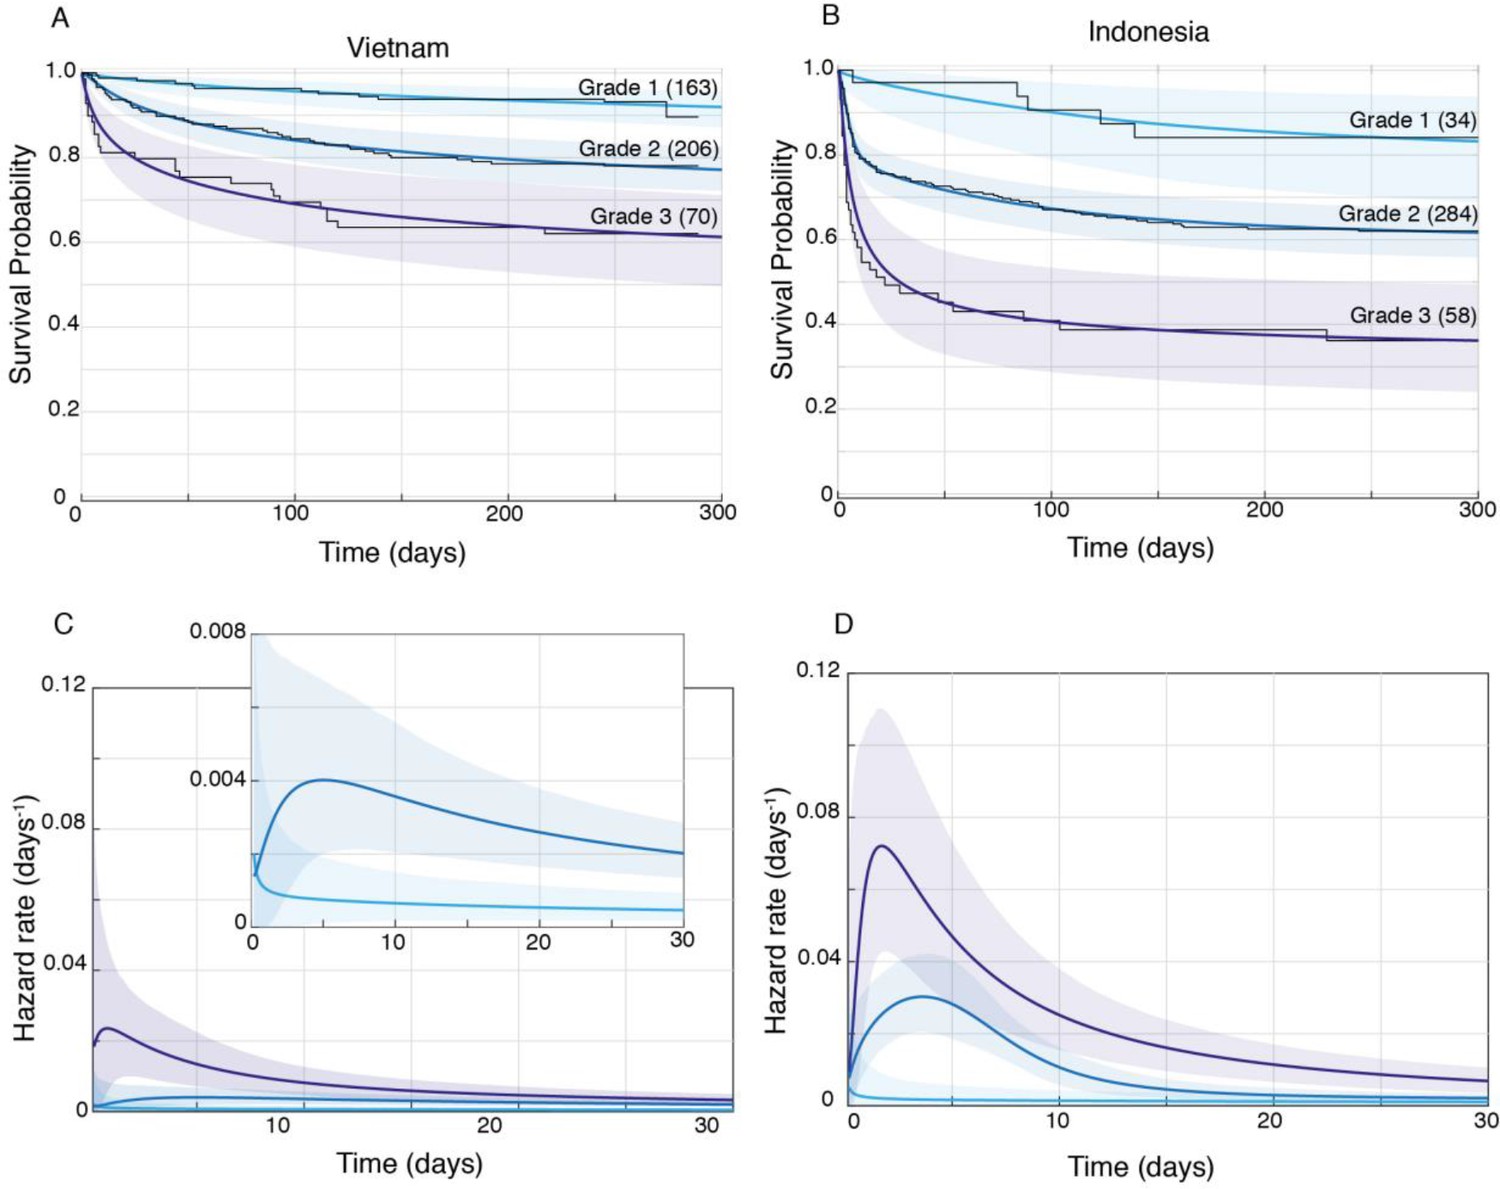
Patient survival, stratified by grade.
Mean posterior survival probability curves (coloured lines) overlaid by Kaplan-Meier survival plots (black lines) for Vietnam (A) and Indonesia (B), and mean posterior hazard rate curves for the first 30 days for Vietnam (C) and Indonesia (D). Shaded areas represent the 95% Bayesian confidence limits for posterior probability. The number of patients in each group at the starting time point are indicated in parentheses. (A) Vietnam Grade 1 over Grade 2 survival was significantly greater from day 7 onwards with maximum probability 0.999, survival gap 14%; Grade 2 over Grade 3 survival was significantly greater from day 1 onwards with maximum probability 0.999, survival gap 16%. (B) Indonesia Grade 1 over Grade 2 survival was significantly greater from day 2 onwards with maximum probability 0.999, survival gap 21%; Grade 2 over Grade 3 survival was significantly greater from day 2 onwards with maximum probability 0.999, survival gap 25%. (C) Vietnam hazard rate ratio was >1 for both grade comparisons (inset magnifies Grade 1 and Grade 2 differences) with Grade 2 over 1 ratio peaking at 5.5 on day 7 and Grade 3 over 2 ratio peaking at 13.9 on day 1. (D) Indonesia Grade 2 over 1 hazard rate ratio was >1 up to day 215 and Grade 3 over 2 ratio was >1 throughout, peaking at 11.2 on day 1 for Grade 2 over 1, and at 2.3 on day 5 for Grades 3 over 2.
Figure 4
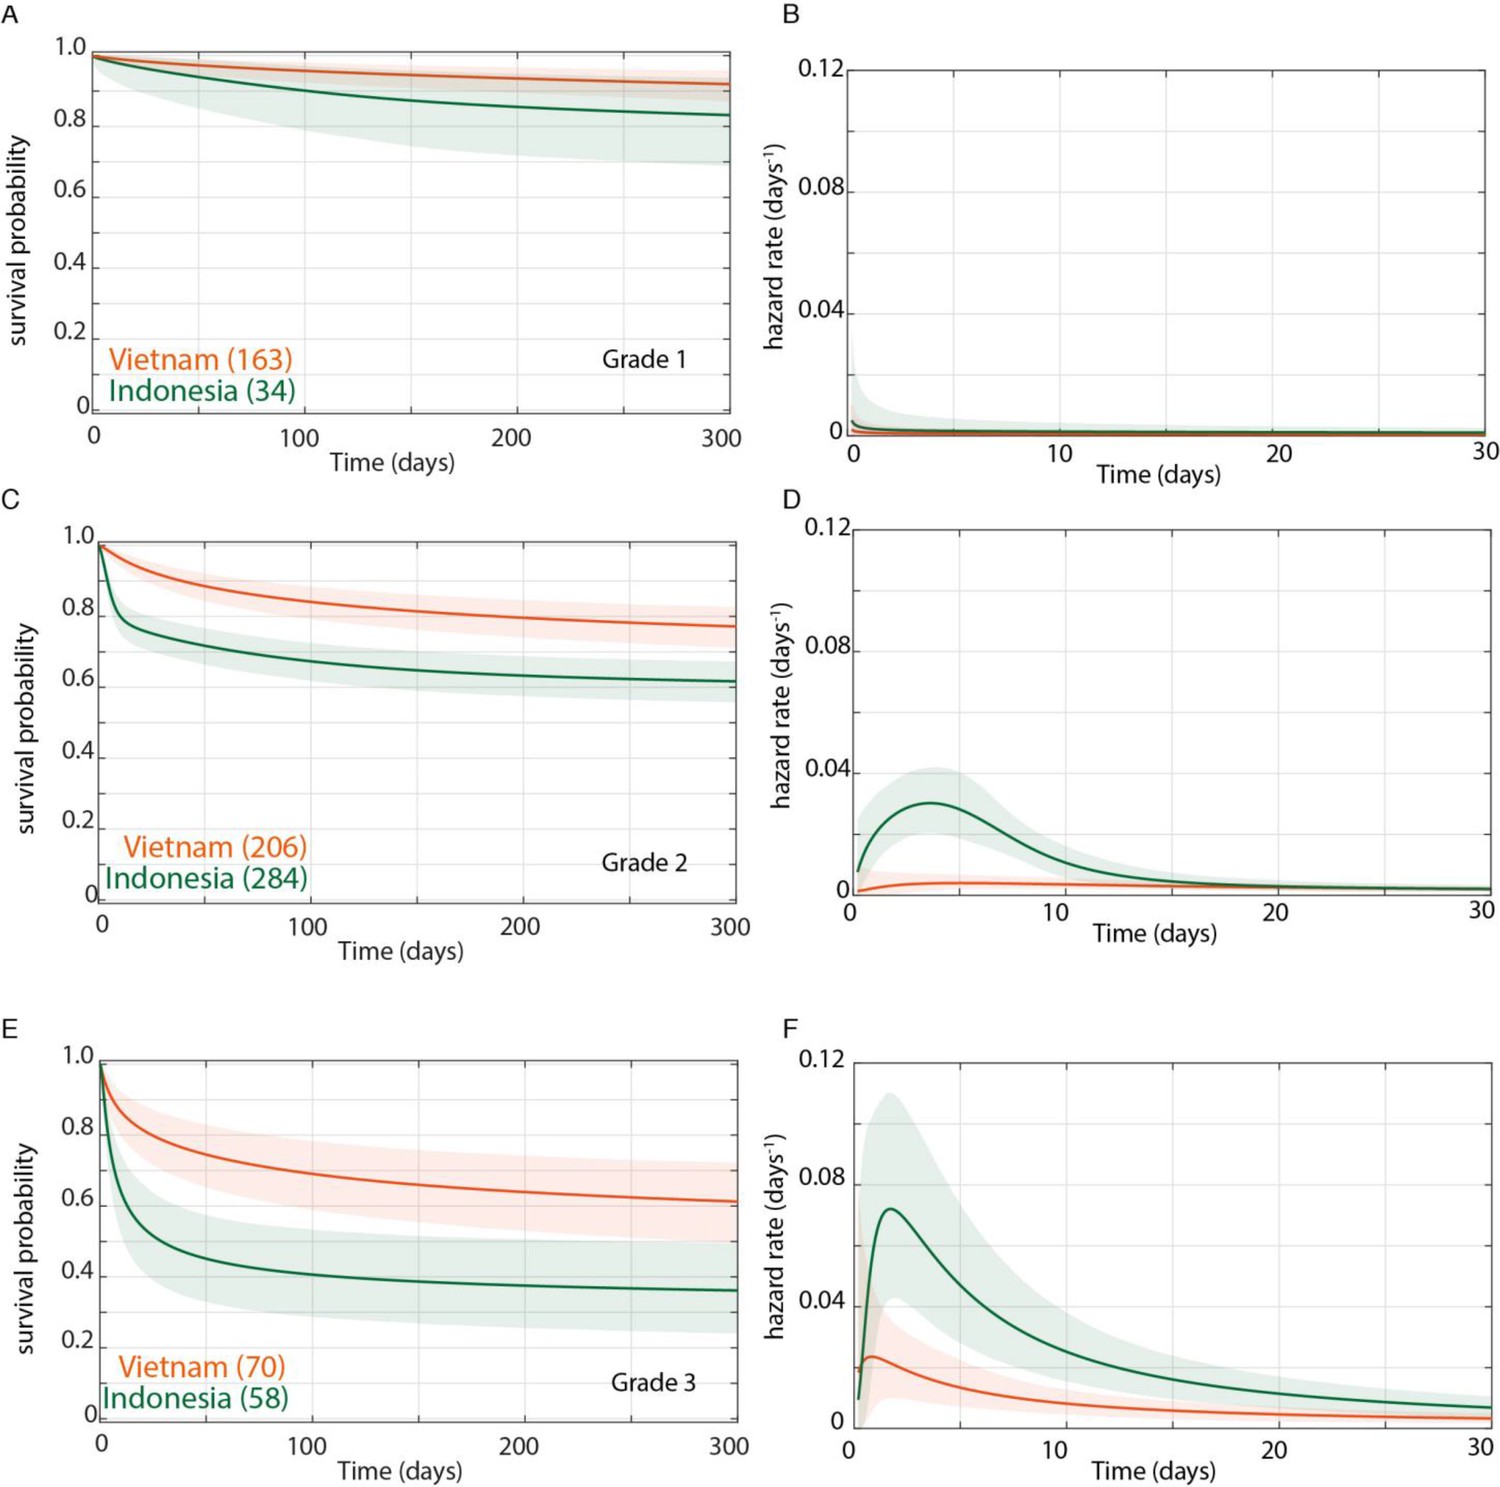
Direct comparison of grade-stratified survival of Vietnam and Indonesia patients.
Comparison of survival curves (A, C, E) and hazard rate curves for the first 30 days (B, D, F) in Vietnam (orange lines) and Indonesia (green lines). The number of patients at the starting time point are indicated in parentheses. (A) Grade 1 survival did not differ significantly between Vietnam and Indonesia. (B) Indonesia hazard rate was ~2 fold higher than Vietnam in Grade 1 from day 0 to day 150, but the difference did not reach significance. (C) Grade 2 survival was significantly lower in Indonesia than Vietnam from day 1 onwards with maximum probability 0.999, survival gap 18%. (D) The hazard rate ratio in Grade 2 for Indonesia over Vietnam peaked at 8.4 on day 1 and remained >1 until day 180. (E) Grade 3 survival was significantly lower in Indonesia than Vietnam from day 2 onwards with maximum probability 0.999, survival gap 24%. (F) Grade 3 hazard rate ratio for Indonesia over Vietnam peaked at 3.6 on day 3 and remained >1 until day 165.
Figure 5
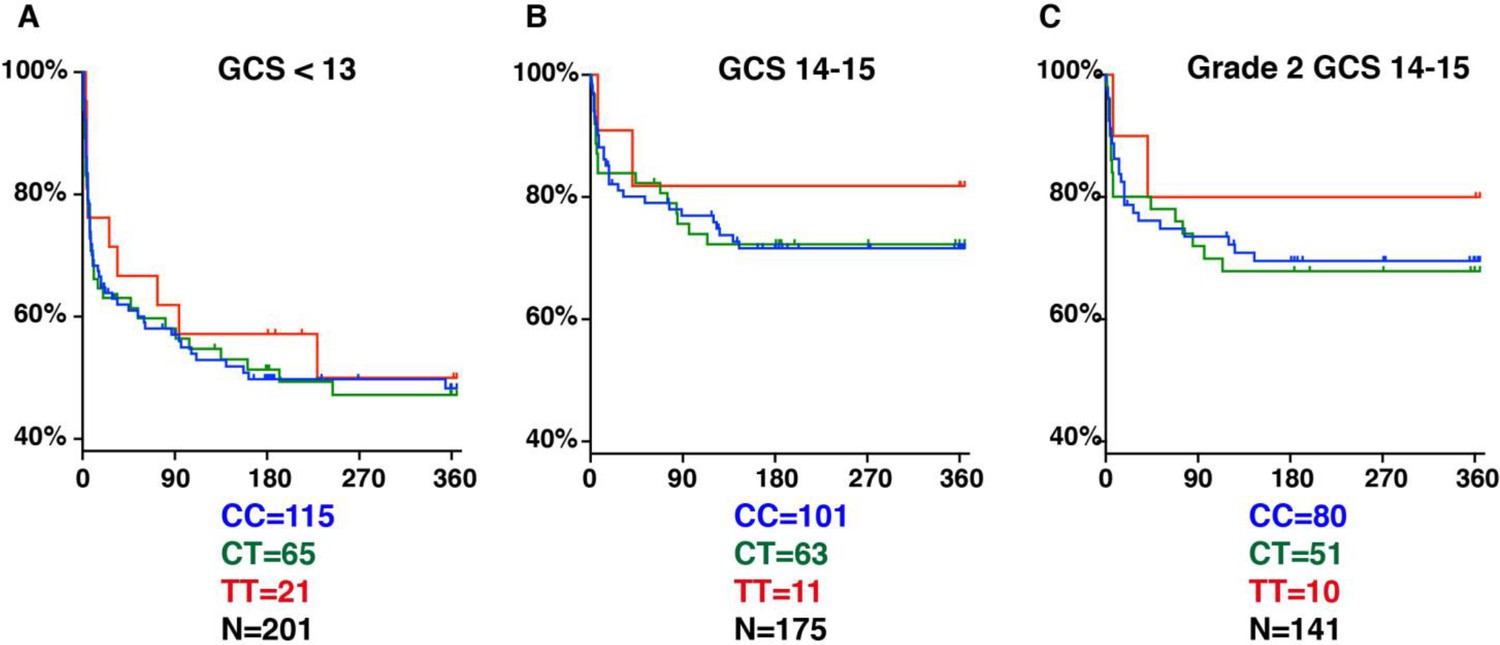
LTA4H rs17525495 genotype as predictor for 365 day mortality in HIV-negative TBM patients in Indonesia.
Panels A and B are comparable to Figure S2B of van Laarhoven et al., 2017. (A) All patients with GCS < 13. (B) Patients with GCS = 14 or 15 (note that one patient with TT genotype, GCS = 15 was censored on day 30 in the original data set but later found to have died on day 41). (C) The subset of patients from (B) with GCS 14 or 15 excluding those in BMRC Grade 1 (GCS 15 without neurological signs).
Appendix 2—figure 1
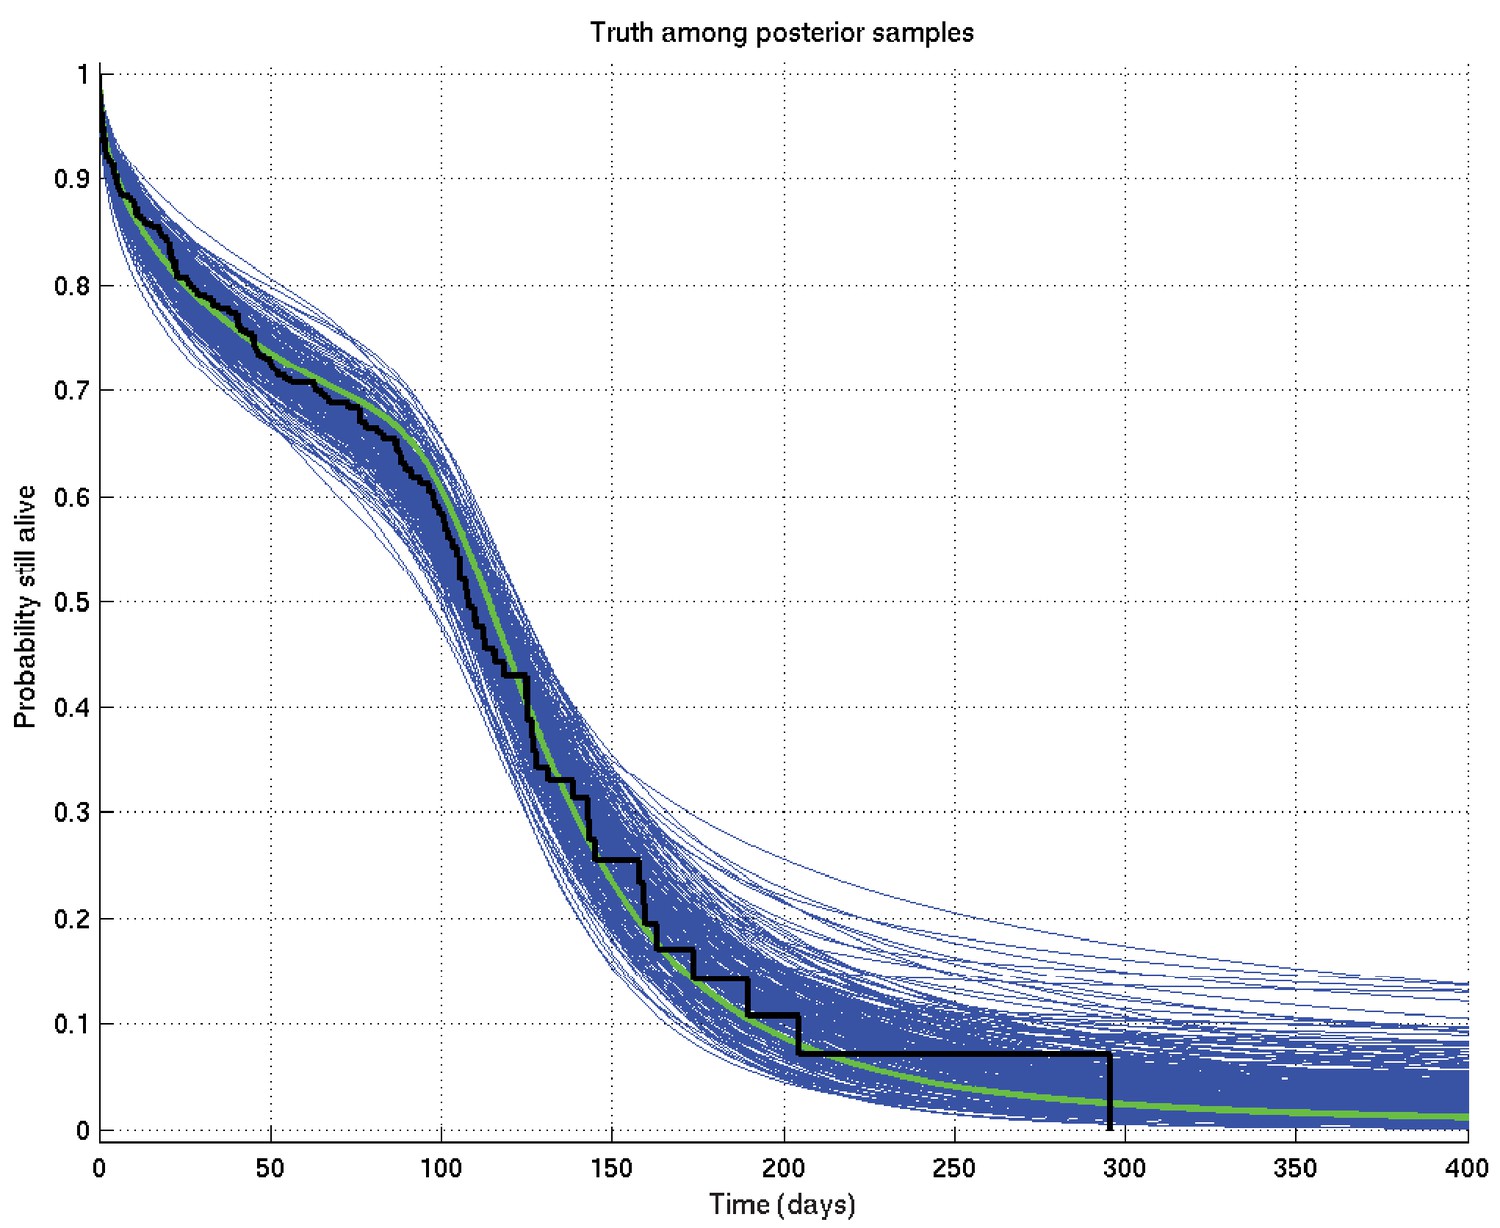
Output of test run using synthetic data for which the right answer is known.
The true survival probability curve is shown in green, with the Kaplan-Meier plot for the generated data in black. In blue are shown many samples from the posterior distribution on the survival probability curve, calculated from , which indicate the uncertainty in the inferred distribution. The synthetic dataset comprised 300 hypothetical patients of whom the time of death of 153 was censored.
Appendix 2—figure 2
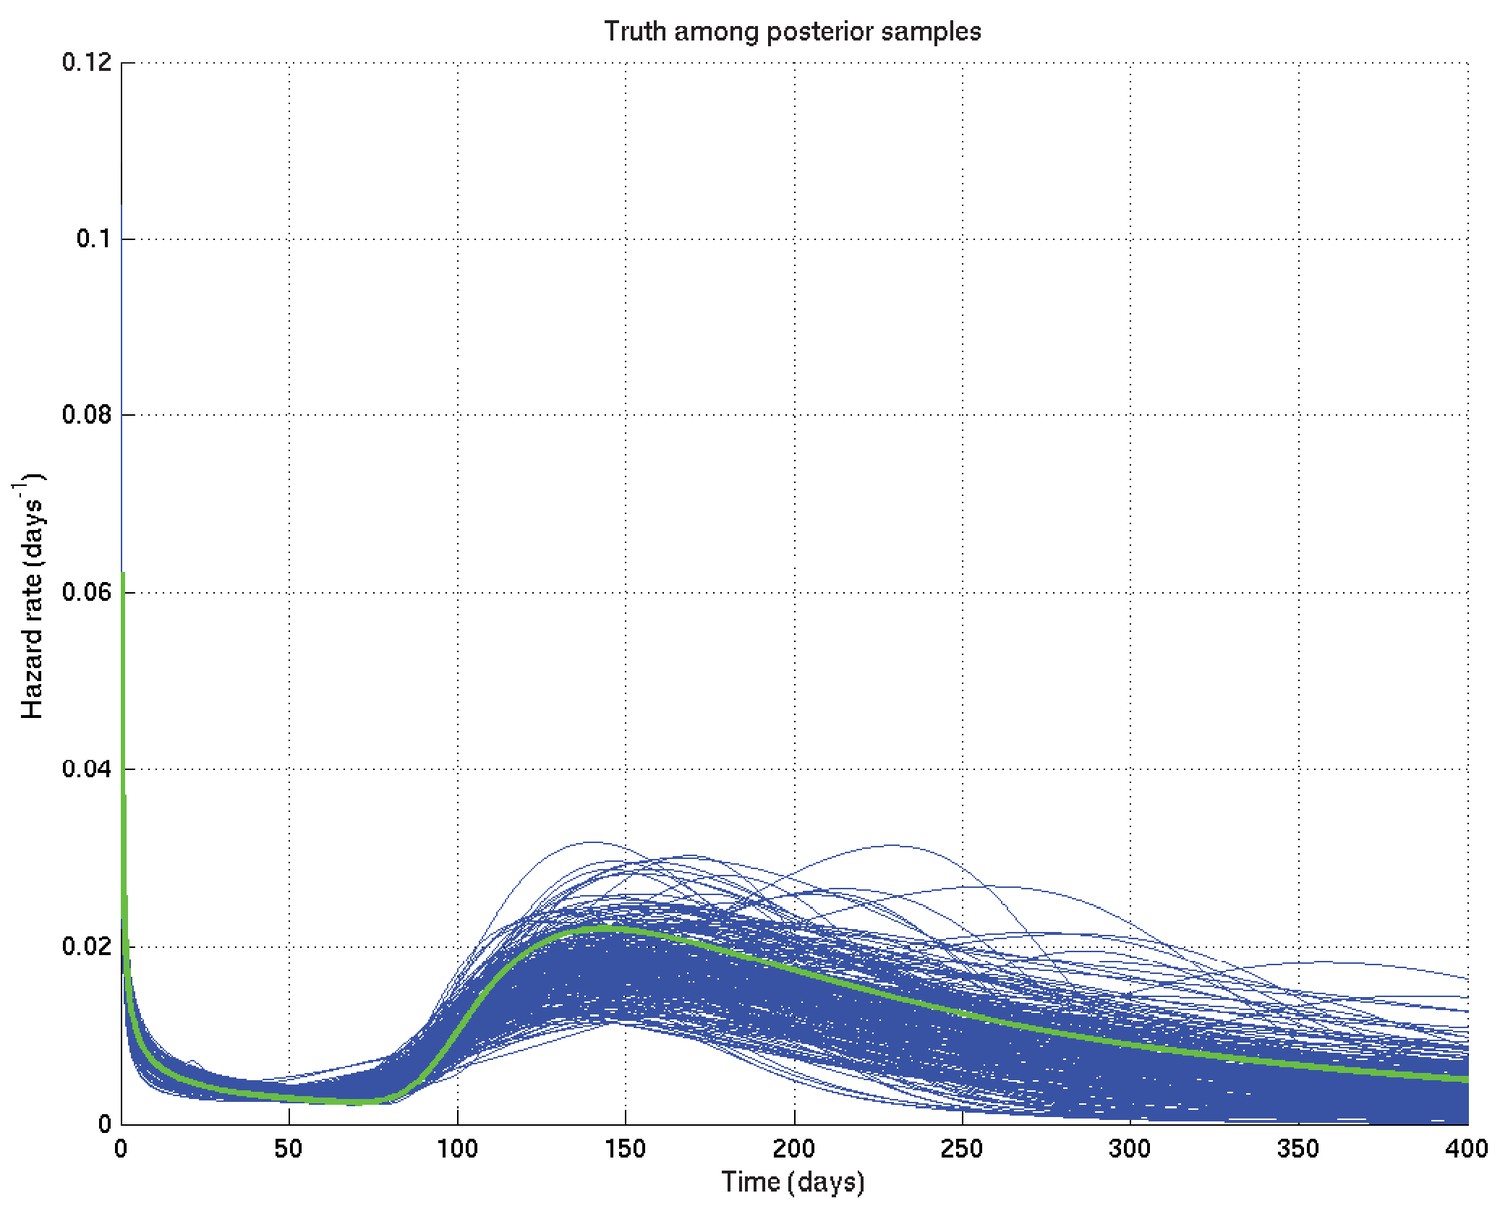
Output of test run using synthetic data for which the right answer is known.
The true hazard rate curve is shown in green. In blue are shown many samples from the posterior distribution on the hazard rate curve, calculated from , which indicate the uncertainty in the inferred distribution. The synthetic dataset comprised 300 hypothetical patients of whom the time of death of 153 was censored.
Appendix 2—figure 3
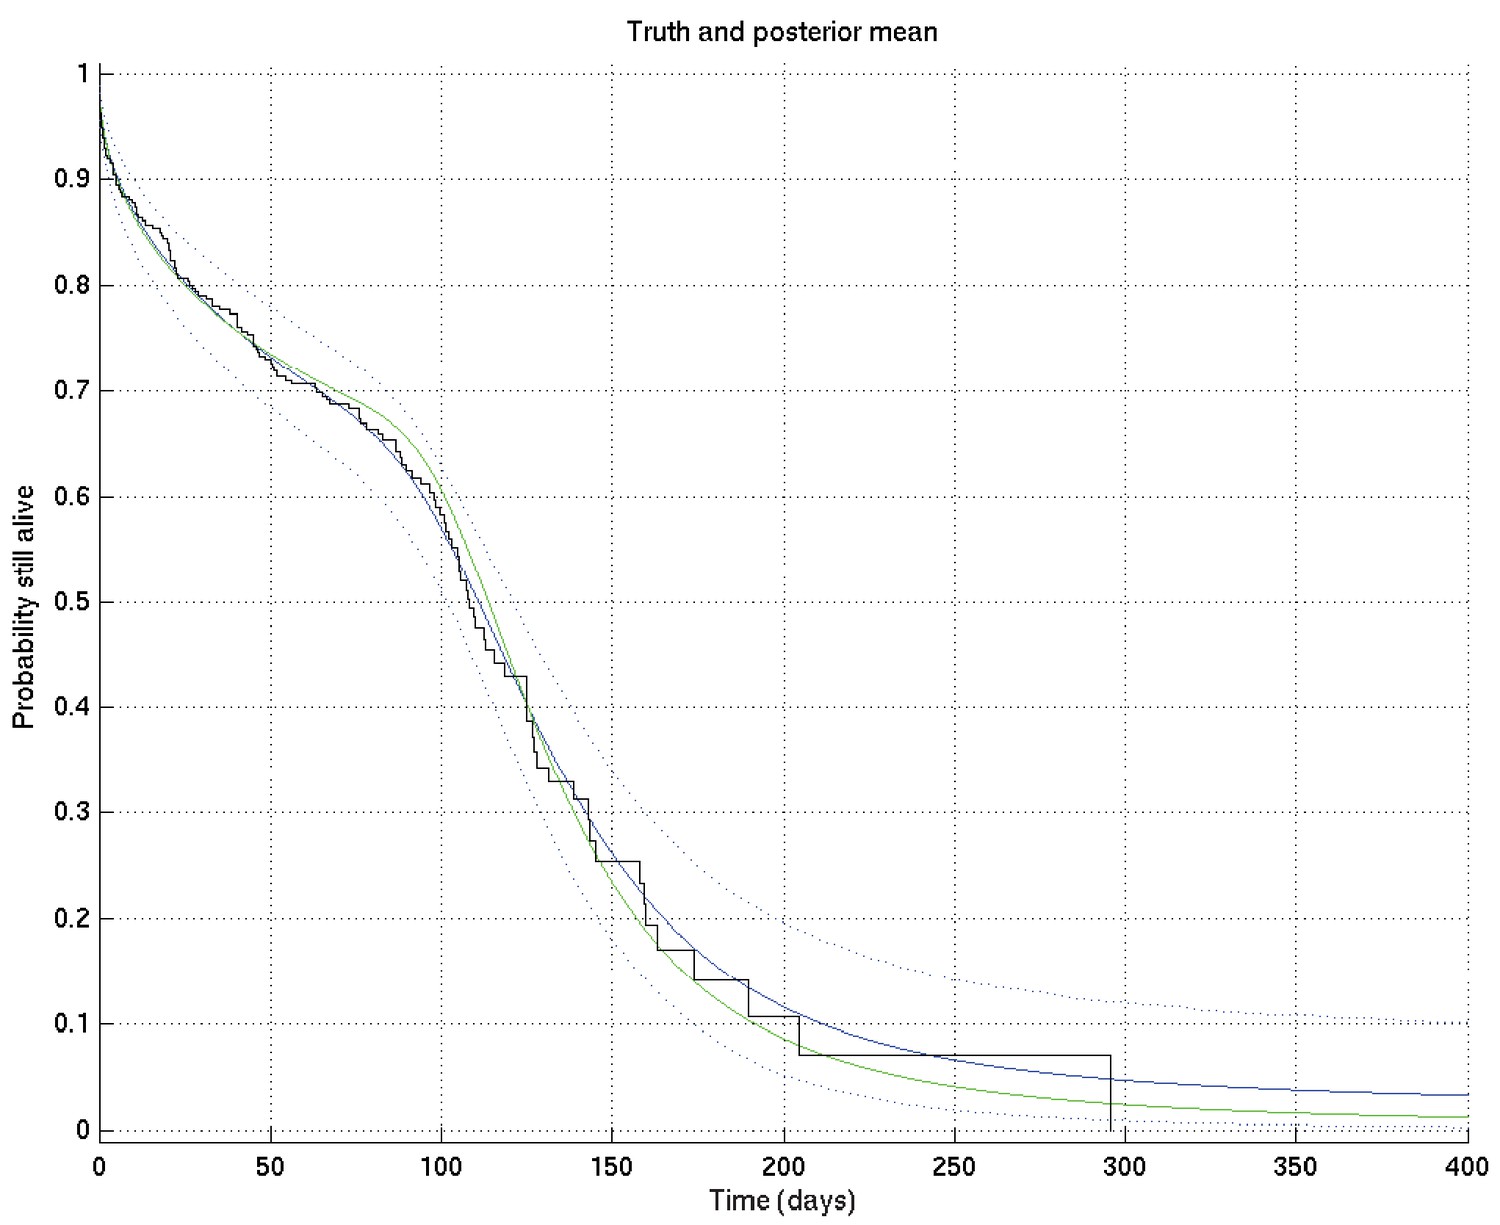
Output of test run using synthetic data for which the right answer is known.
The true survival probability curve is shown in green, with the Kaplan-Meier plot corresponding to the generated data in black. In blue is the posterior mean survival probability against time, calculated from , and in dotted lines the 2.5% and 97.5% centiles, which indicate the uncertainty in the inferred distribution. The synthetic dataset comprised 300 hypothetical patients of whom the time of death of 153 was censored.
Appendix 2—figure 4
Comparison of two runs generated independently from two subsets of patients, subset 1 (red) consisting of 20 patients and subset 2 (green) consisting of 182 patients.
The Kaplan-Meier plot for subset 1 is in solid black and that for subset 2 in dot-dashed black. Since there were many more patients in subset 2 than in subset 1, we expect greater variance in the inferred survival probabilities for subset 1 than for subset 2.
Appendix 2—figure 5
As for Appendix 2—figure 4 but zoomed in to the top left hand corner, showing greater separation and less overlap of the red and green curves at 10 days than at 1 day or 100 days.
Appendix 2—figure 6
Corresponding to Appendix 2—figures 4 and 5 this shows the probability that survival for subset 1 is greater than that for subset 2 at each time point.
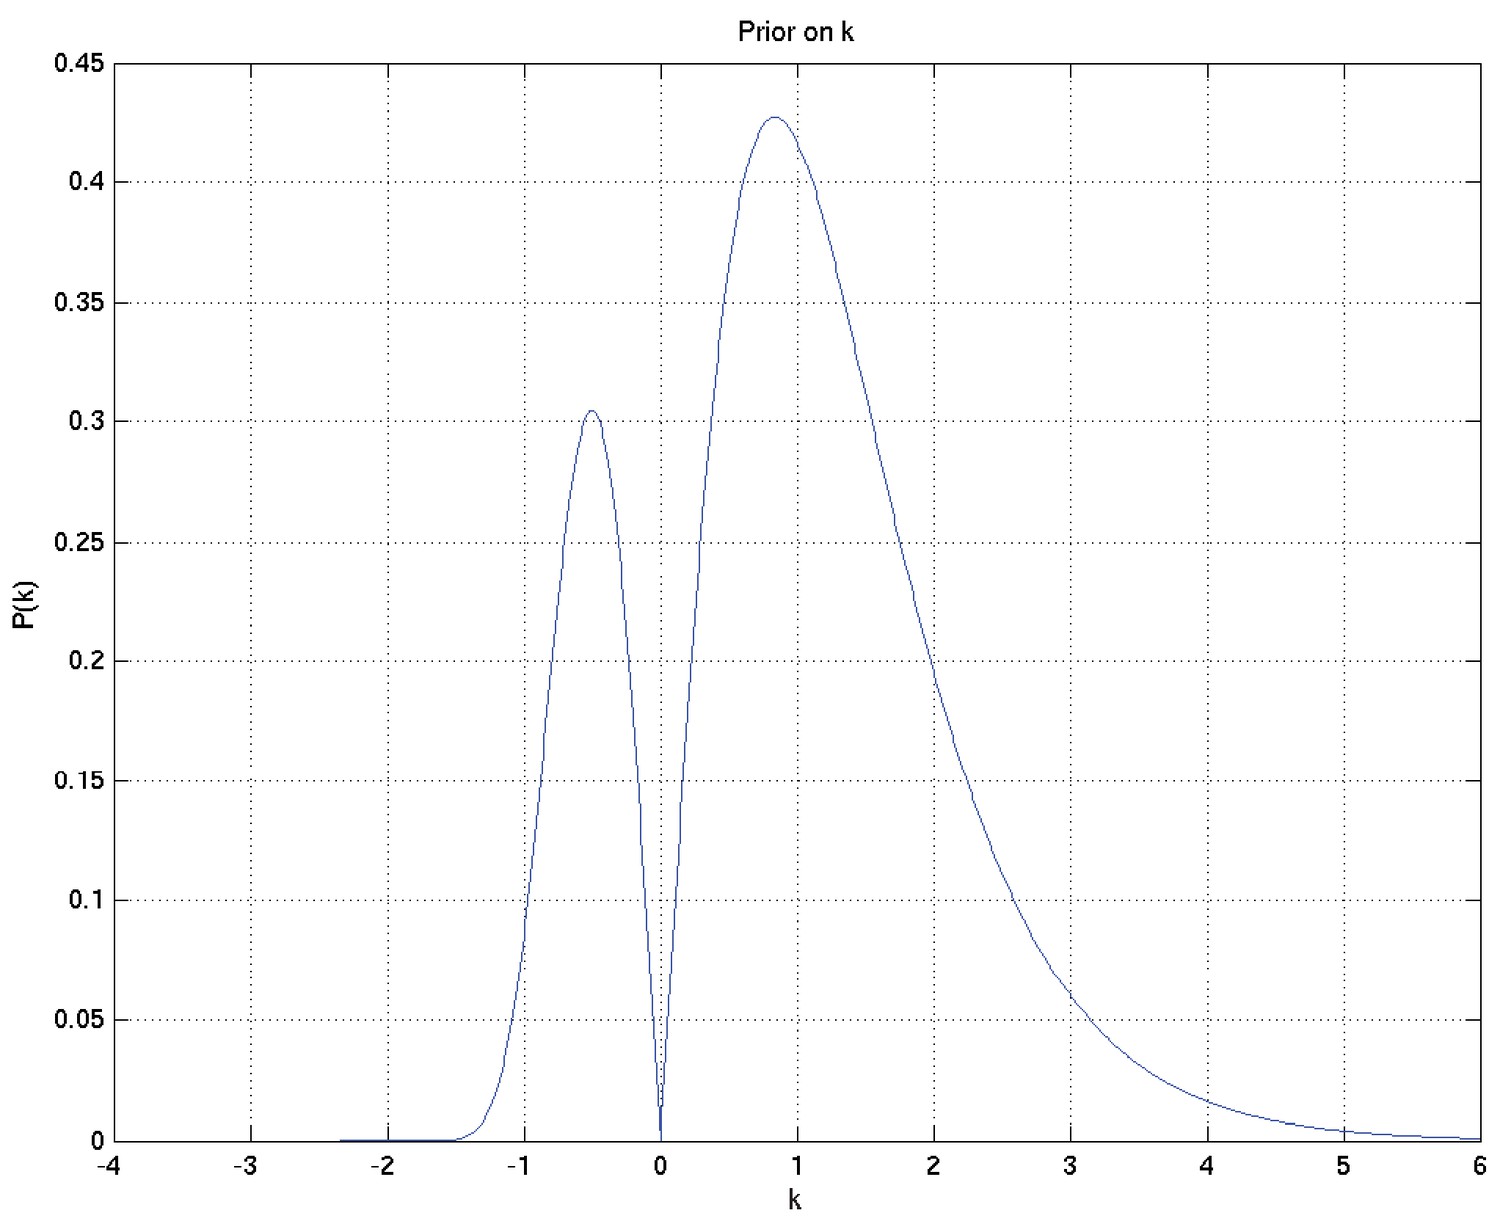
Appendix 2—figure 7
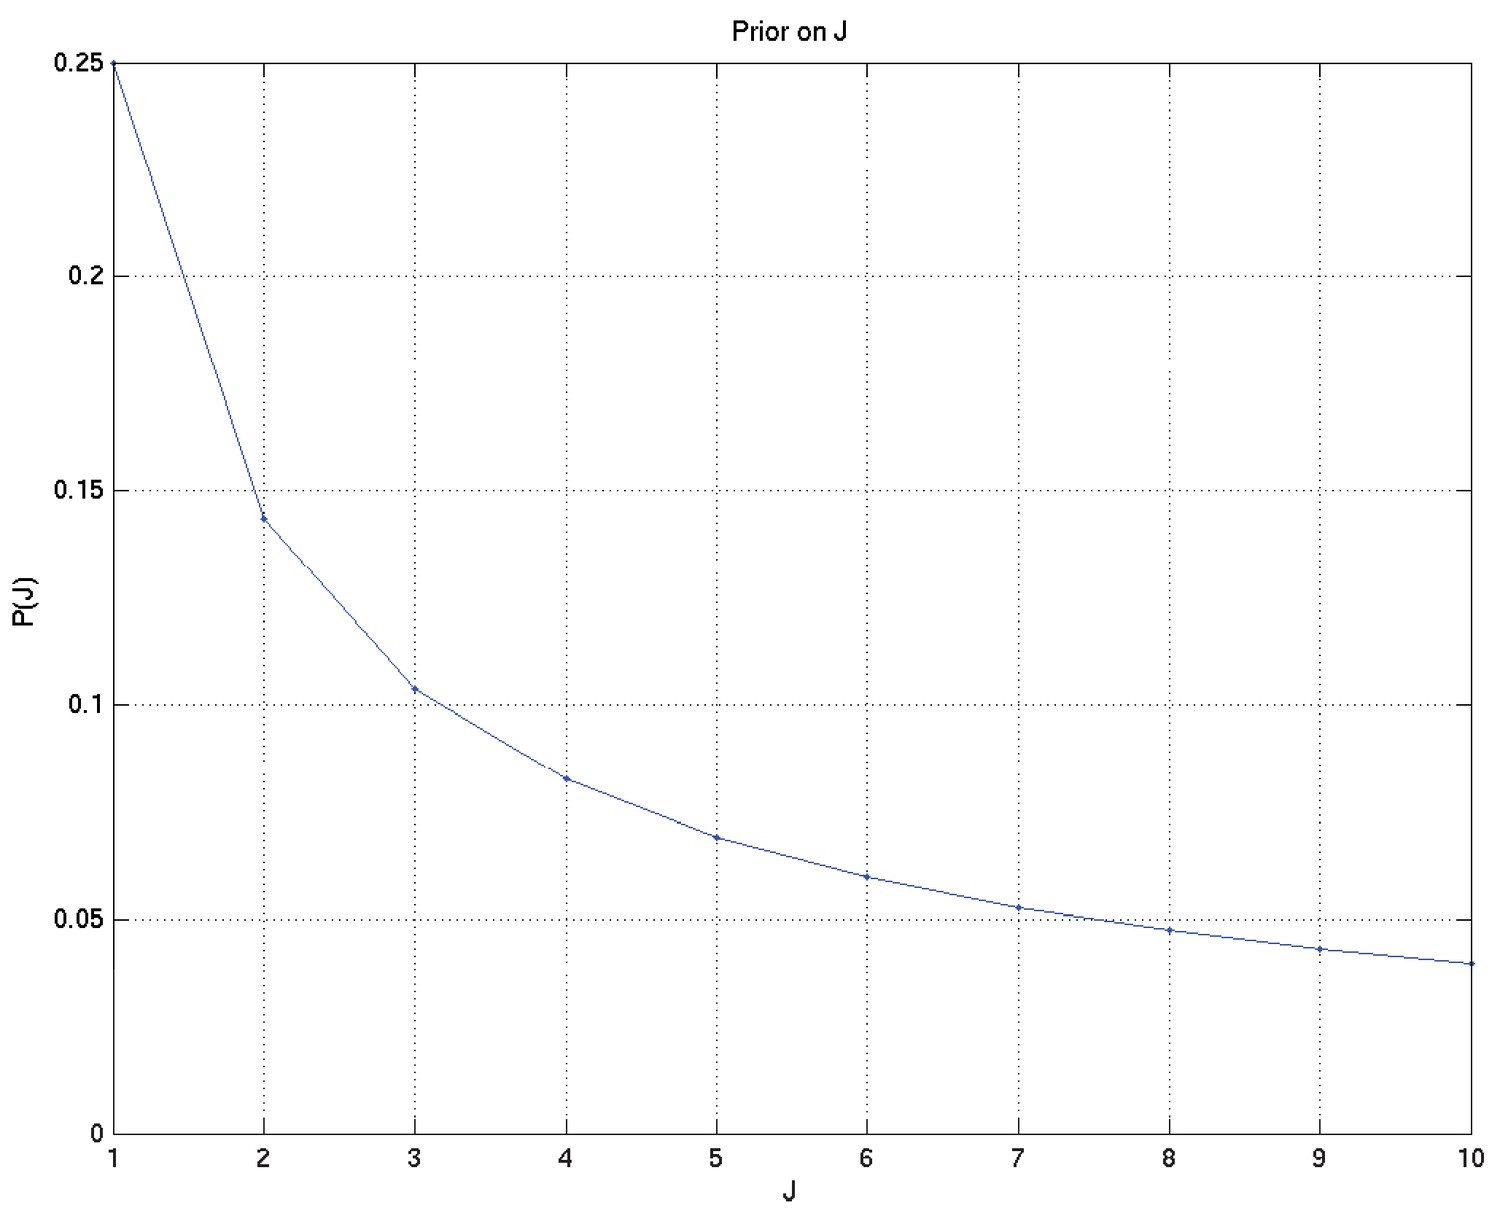
Prior on , the number of different modes of death.
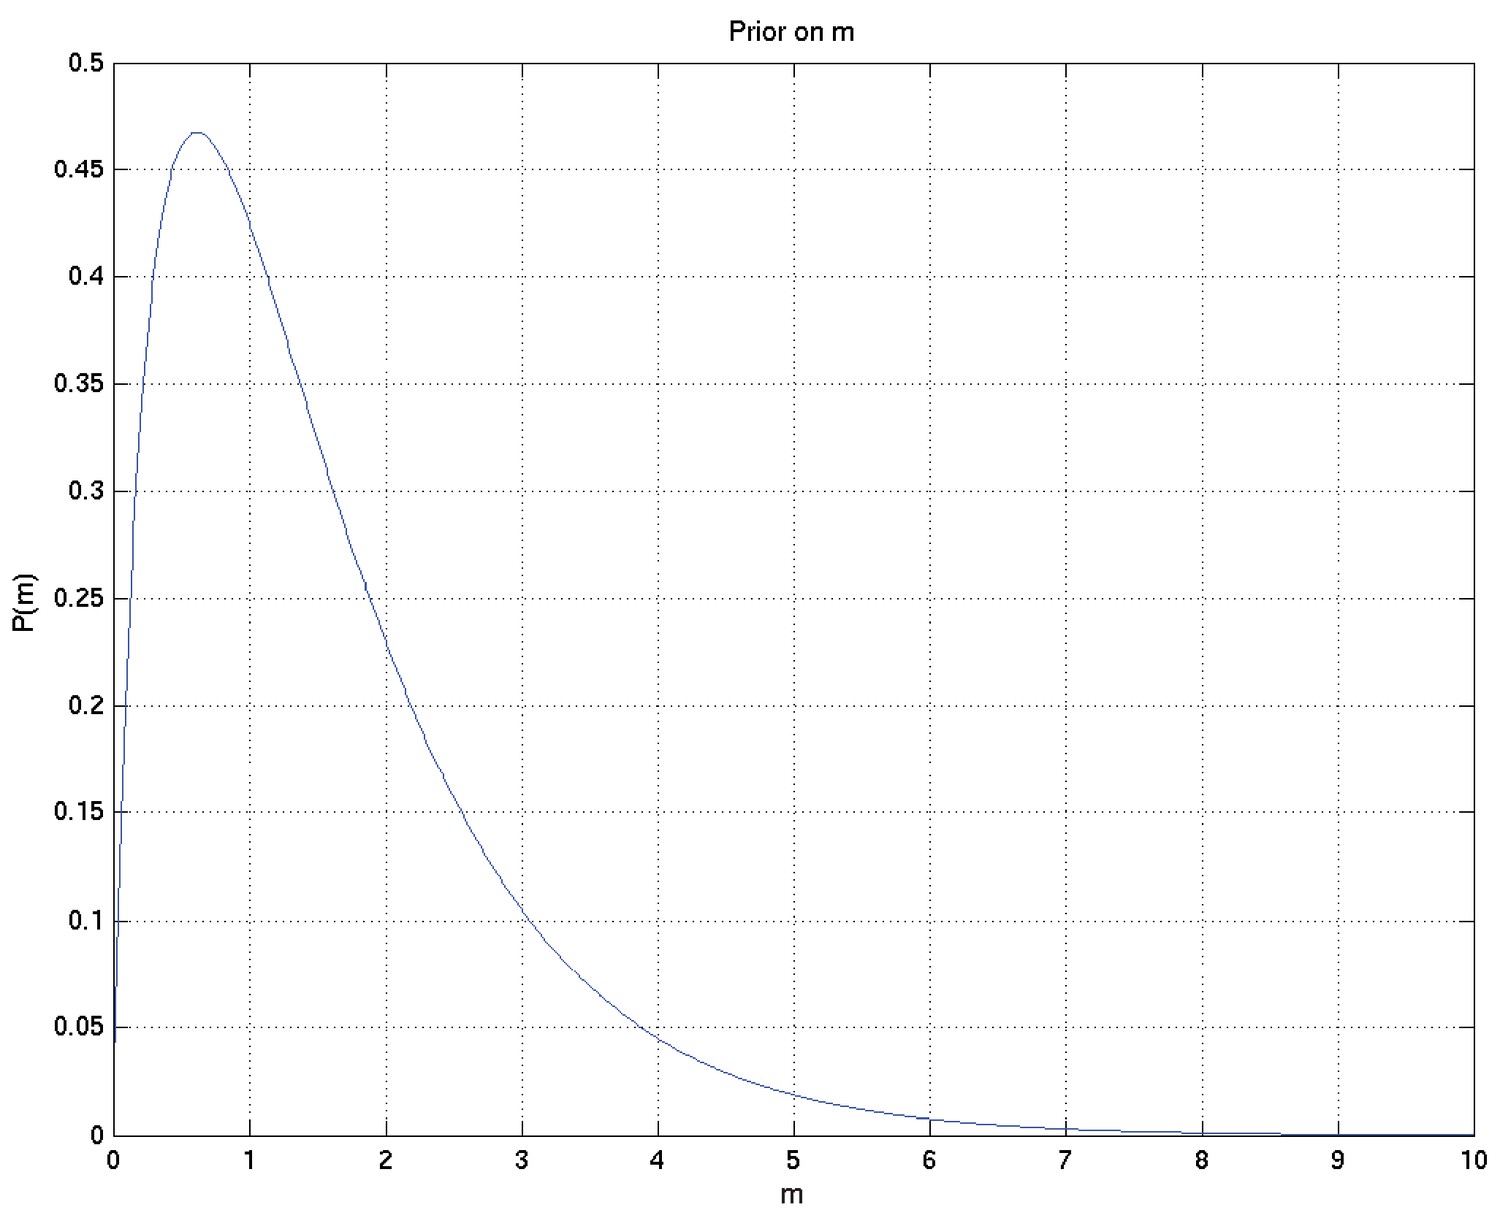
Appendix 2—figure 8
Prior on .
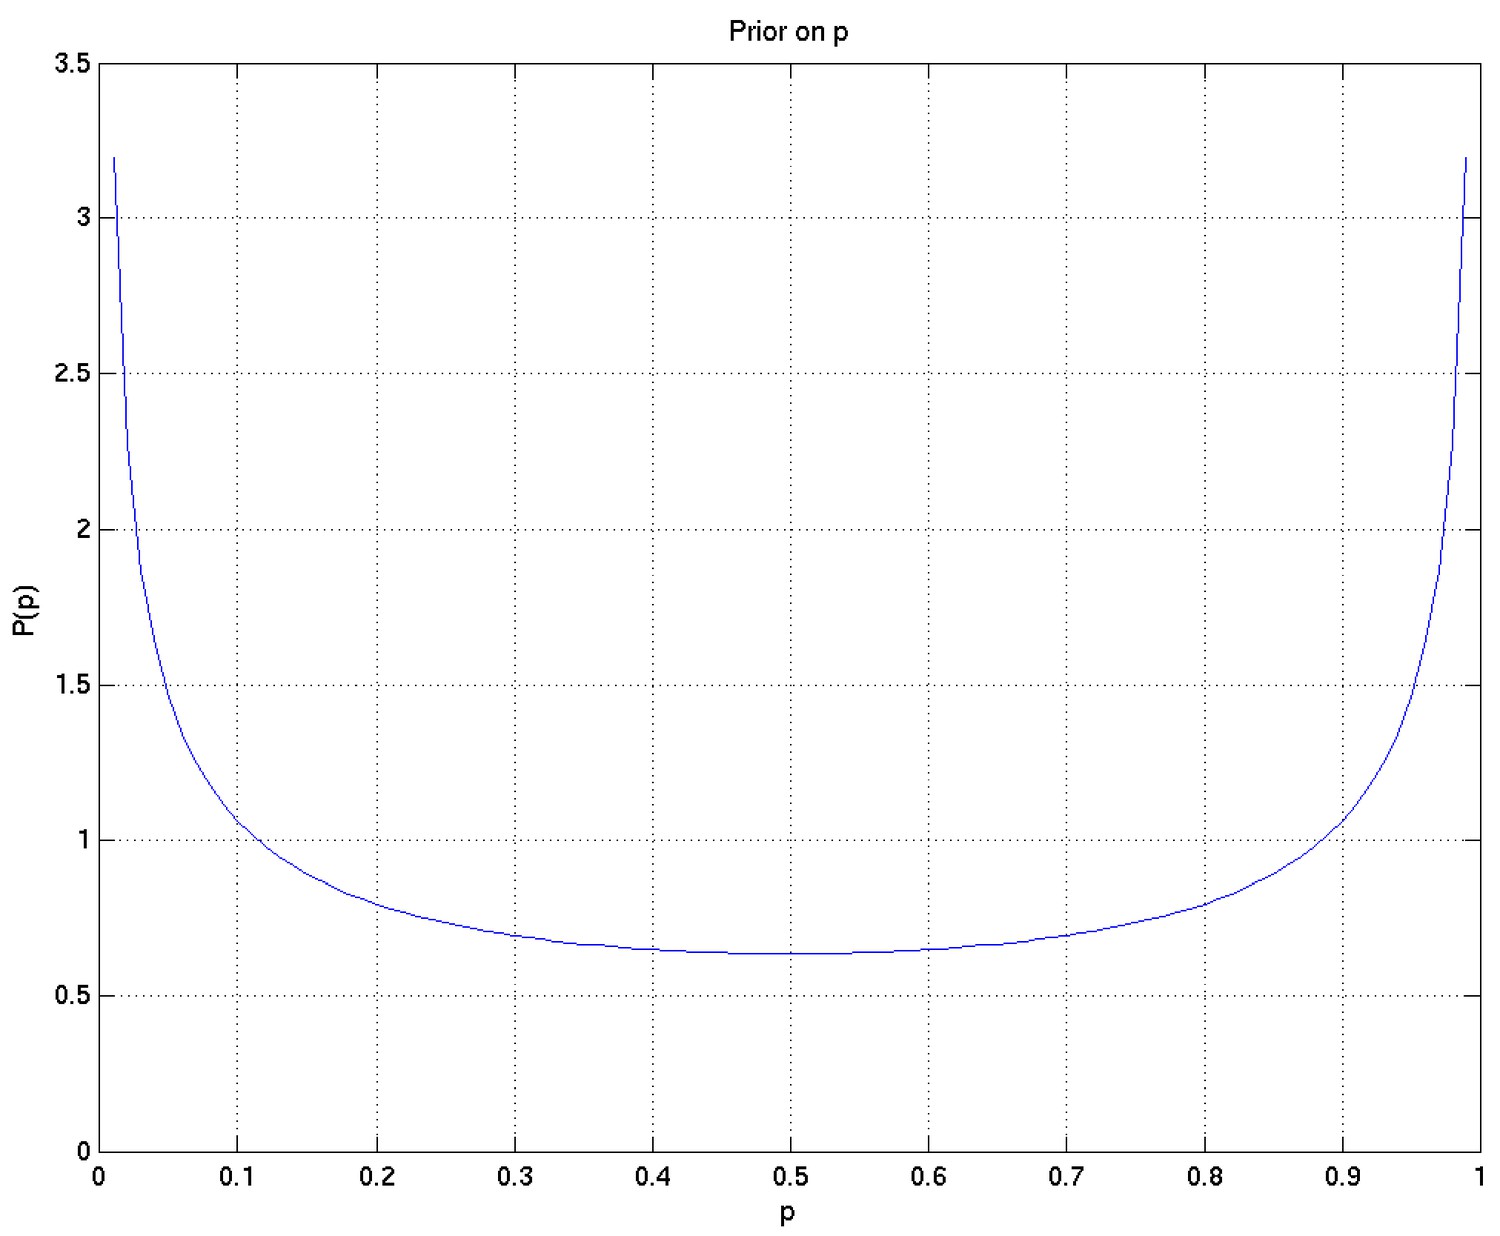
Appendix 2—figure 9
Prior on .
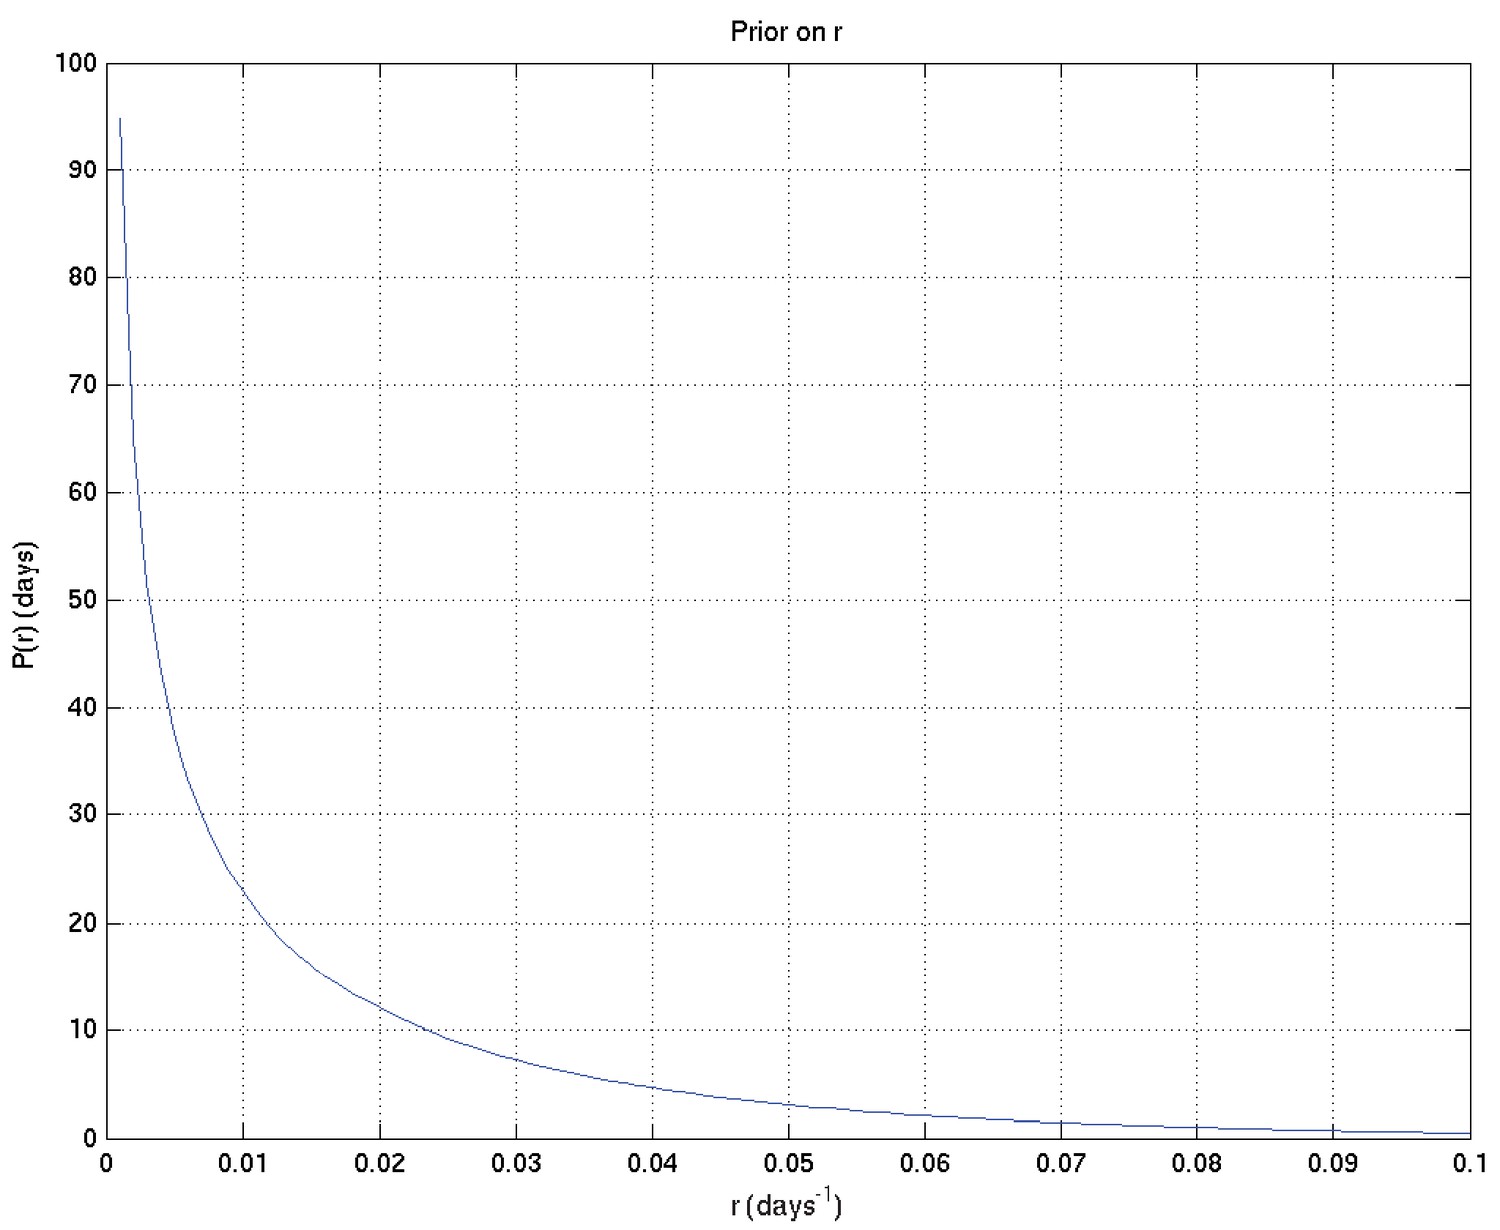
Appendix 2—figure 10
Prior on .
Appendix 2—figure 11
Prior on .
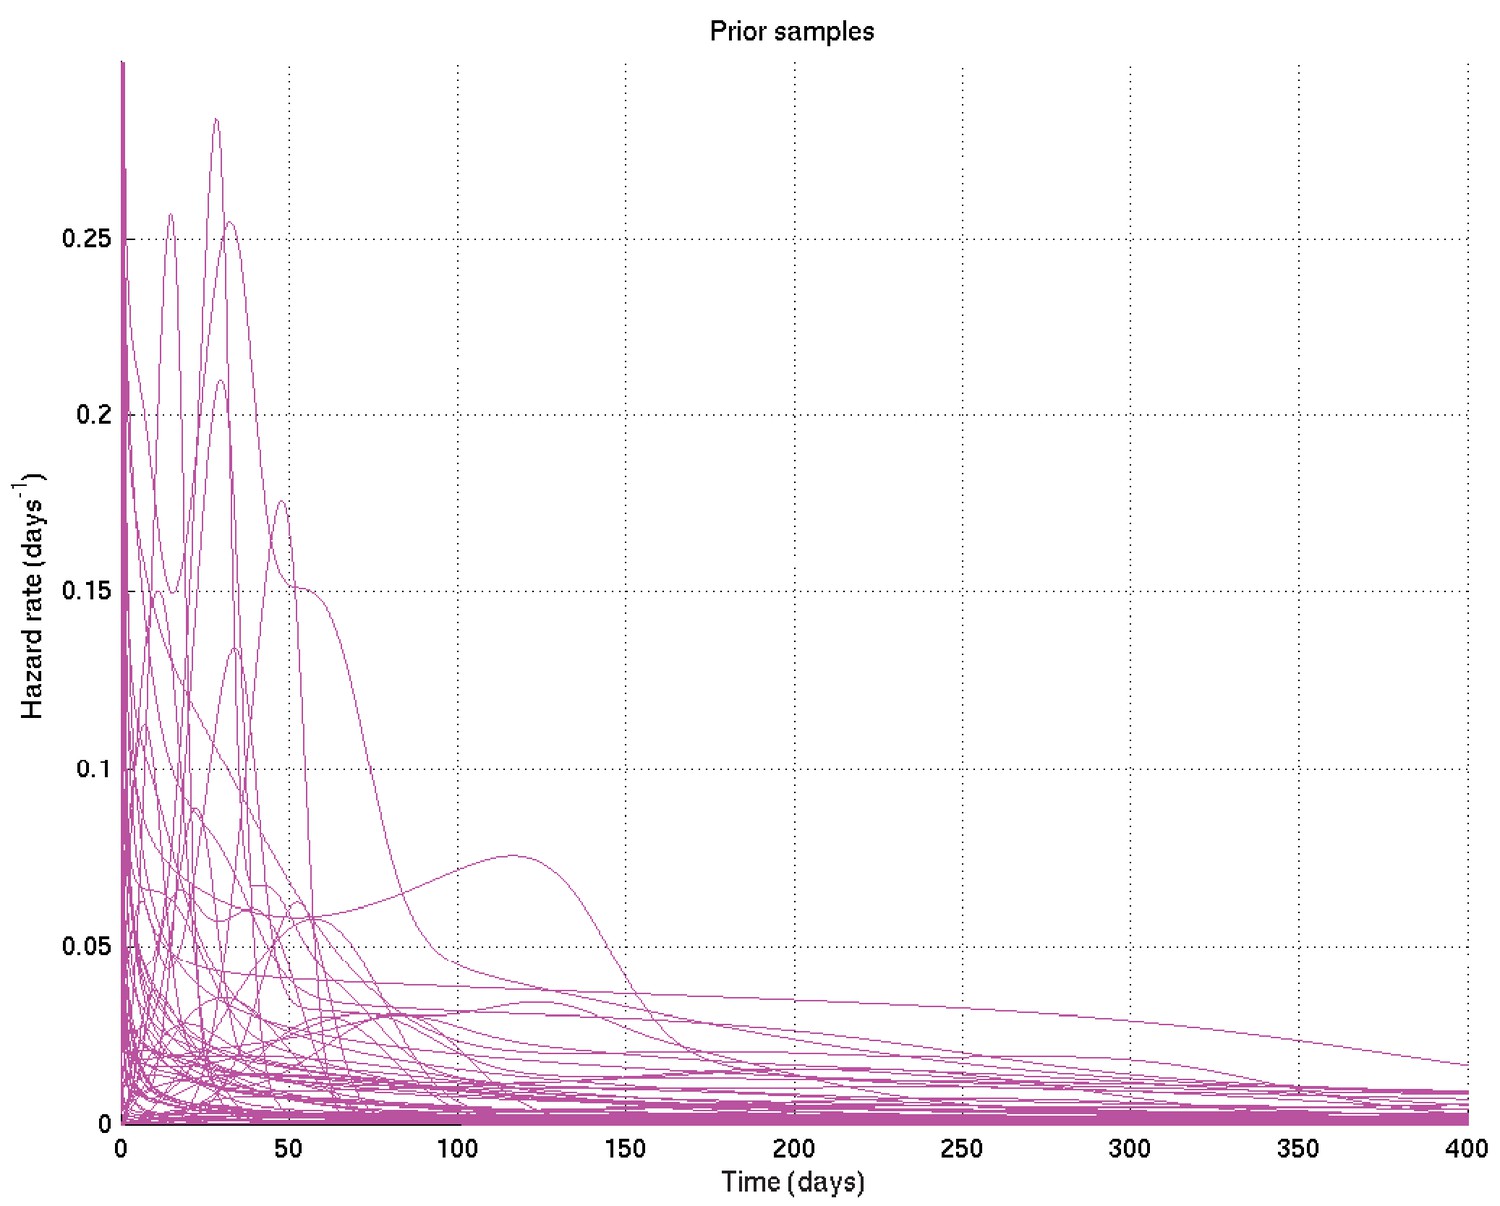
Appendix 2—figure 12
Samples from resulting prior on survival probability against time.
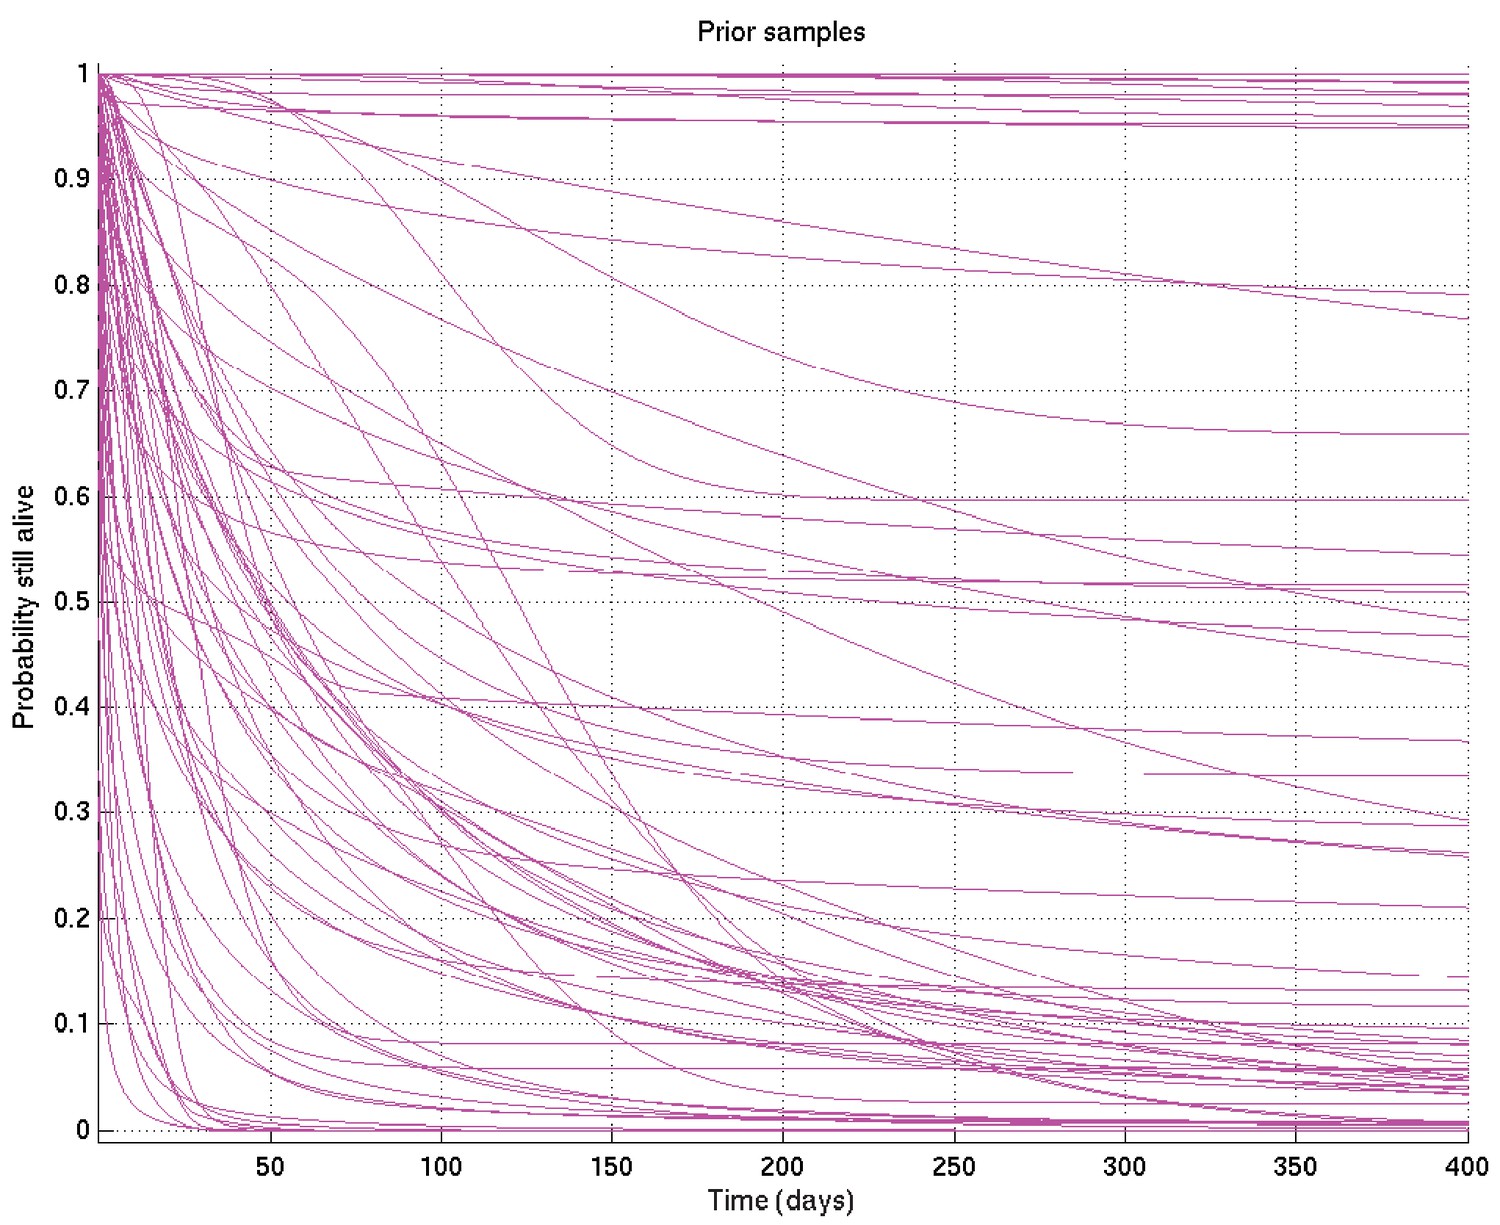
Appendix 2—figure 13
Samples from resulting prior on hazard rate against time.
Appendix 2—figure 14
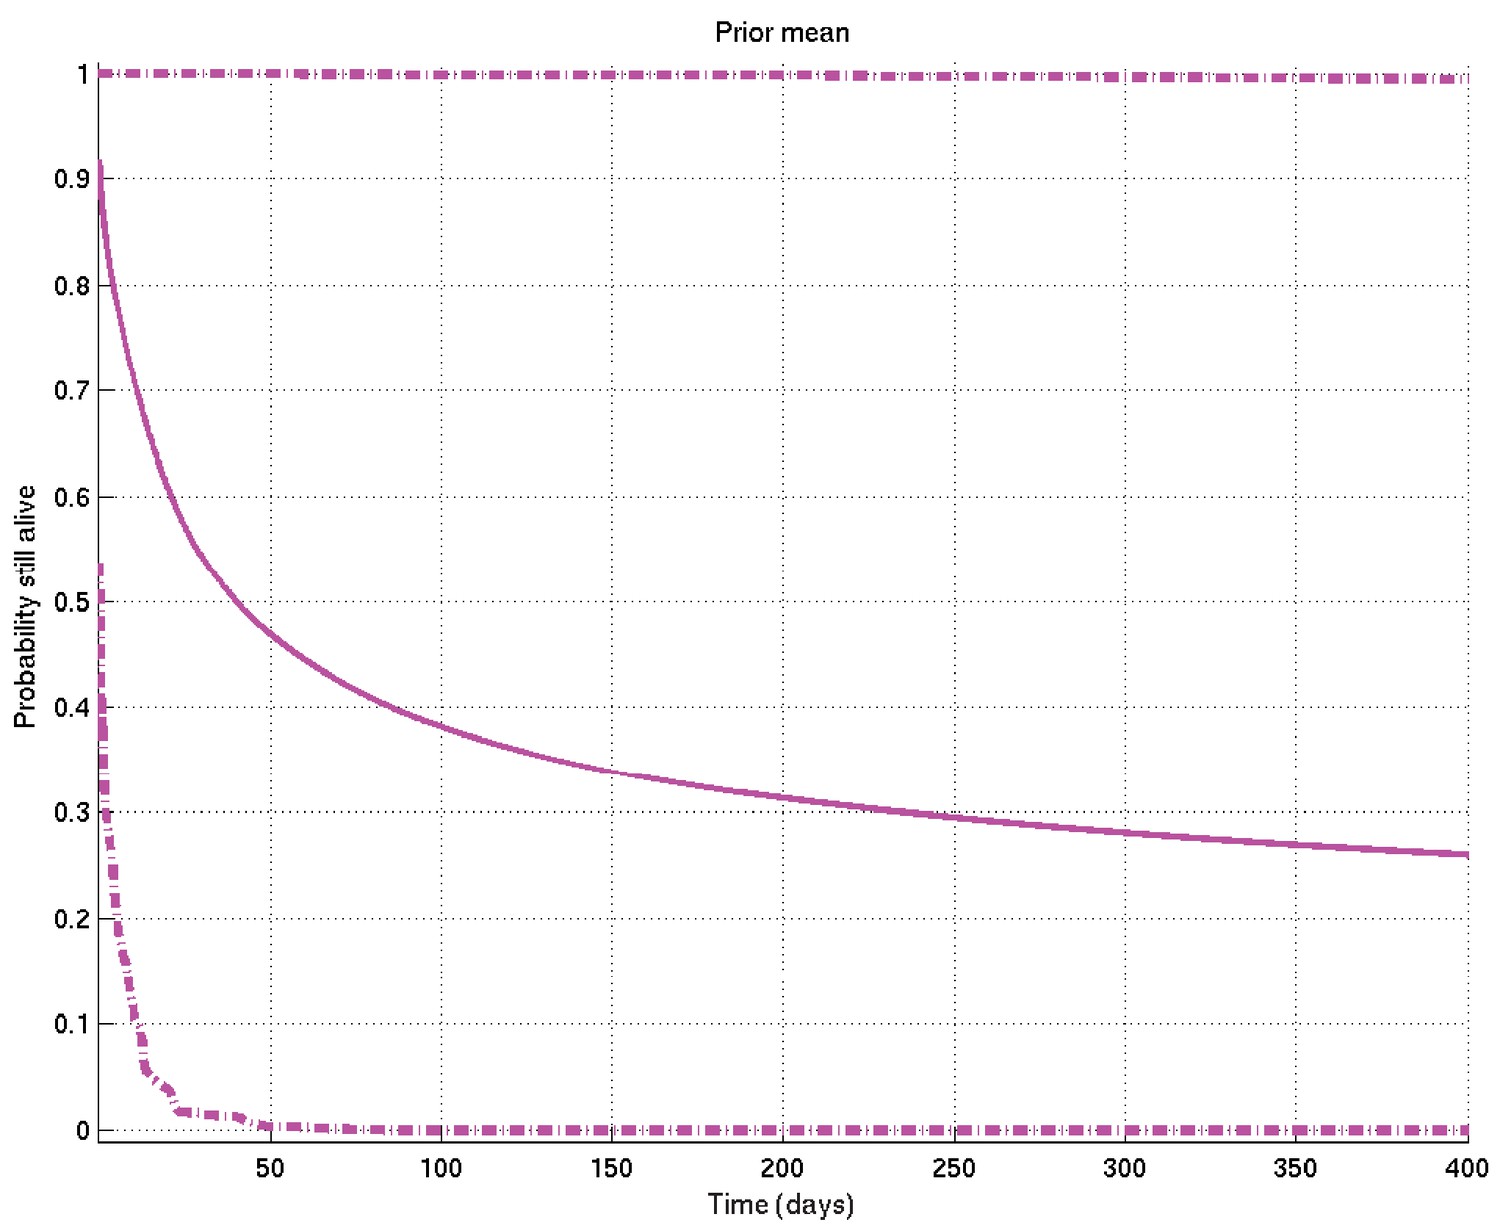
Mean and 2.5% and 97.5% centiles of prior on survival probability against time.
Appendix 2—figure 15

Mean and 2.5% and 97.5% centiles of prior on hazard rate against time.
Appendix 2—figure 16
Samples captured from two runs on the same data started from different random values of the parameters, illustrating that the resulting distributions are essentially identical.
Appendix 2—figure 17

Comparison probabilities (analogous to Appendix 2—figure 6) for survival probability against time from two runs on the same data (and the same priors) started from different random values of the parameters.
If the two distributions are identical (as they should be up to uncertainty caused by the non-infinite number of samples drawn during the MCMC runs), then at each time the probability that the ‘red’ distribution is greater than the ‘green’ (see Appendix 2—figure 16) should be 0.5 . Thus this plot, together with Appendix 2—figure 16, shows that the two distributions are essentially identical, and that the runs have converged to a common distribution.
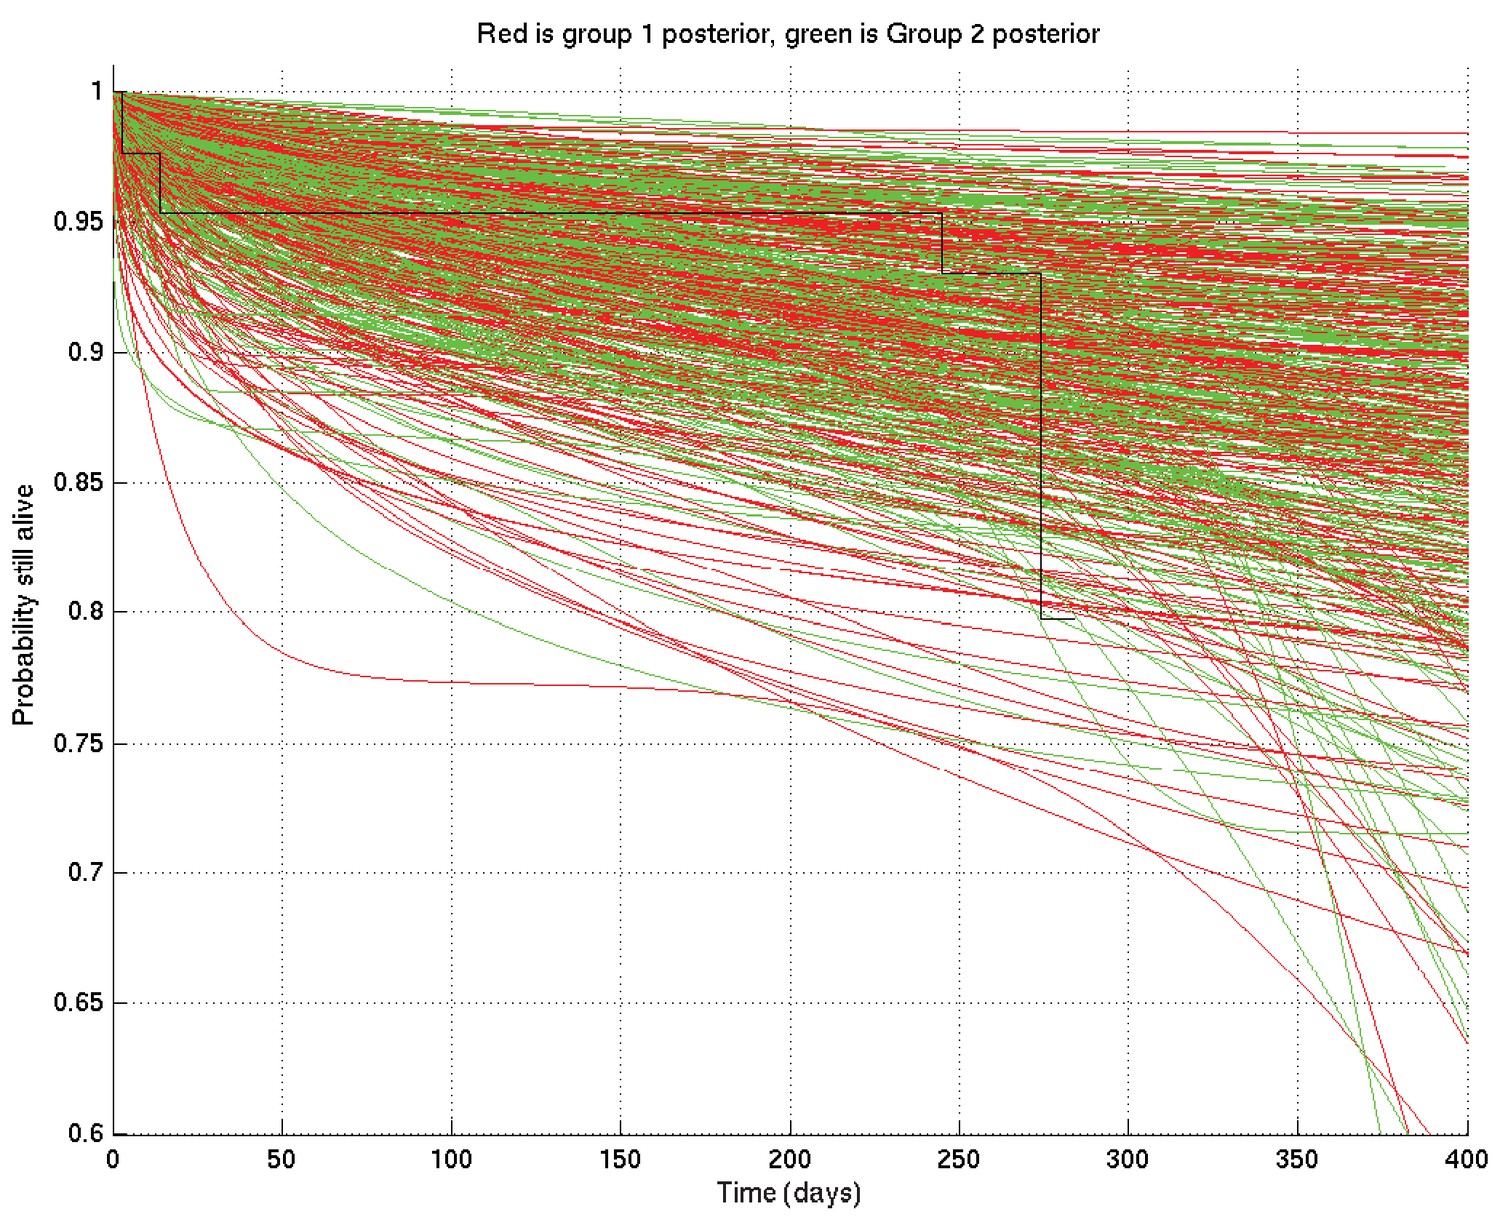
Appendix 2—figure 18
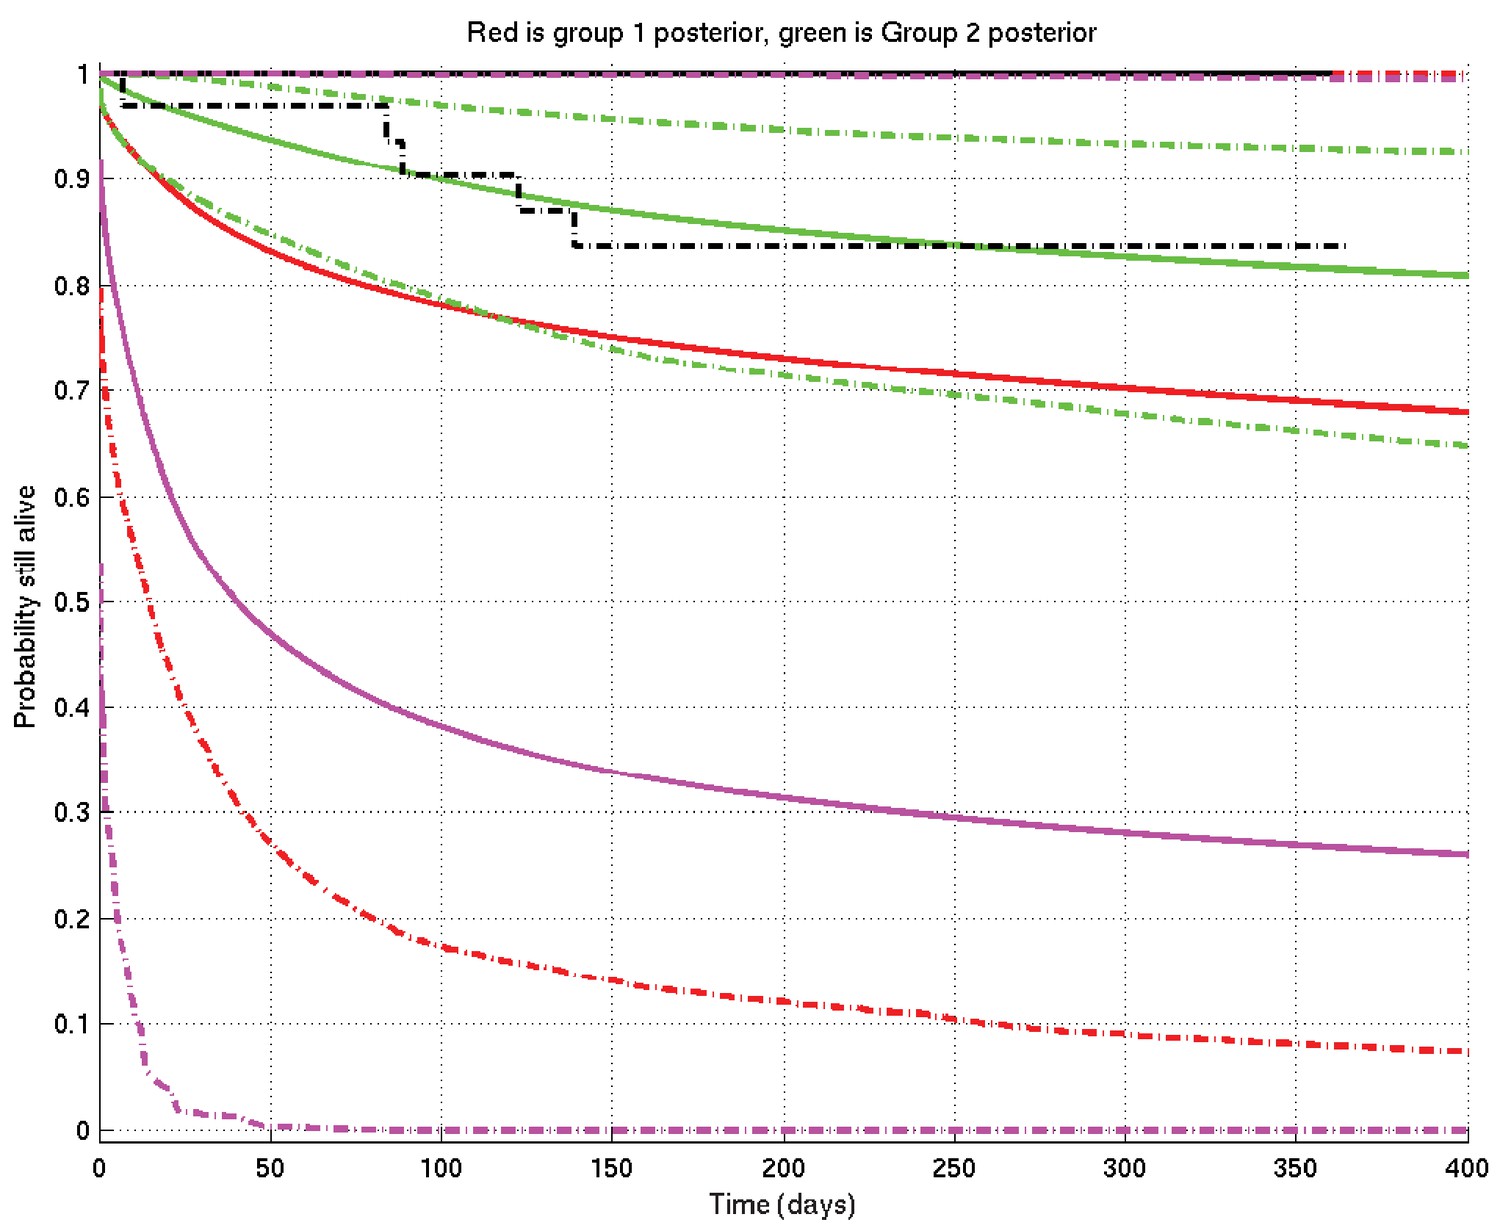
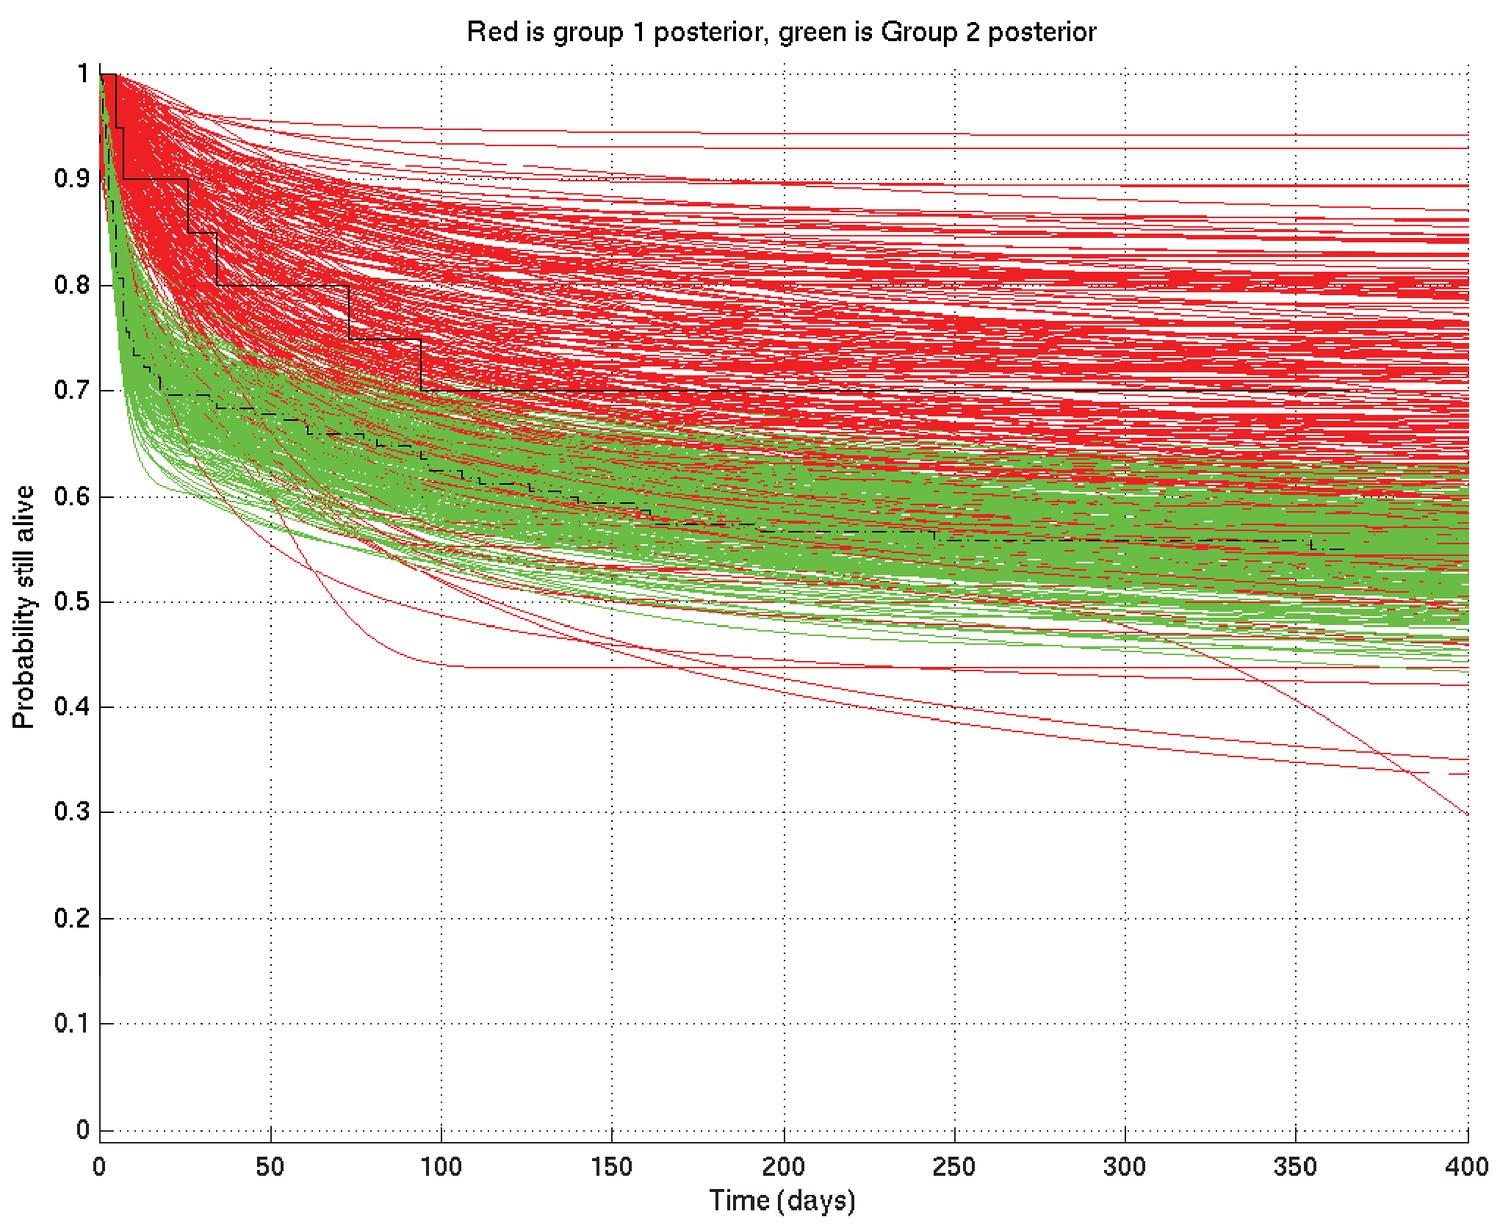
Example of inference whose interpretation is explained in detail in section 4 of this document.
See also Appendix 2—figure 19. Prior mean and 2.5% and 97.5% centiles in magenta; posterior TT mean and centiles in red; posterior non-TT mean and centiles in green; Kaplan-Meier plots for TT in solid black and for non-TT in dash-dot black. There are 1 TT patient and 33 non-TT patients. (The Kaplan-Meier plot for group 1 (TT) and the upper centile plots for both prior and group 1 posterior are approximately coincident along the top of the graph).
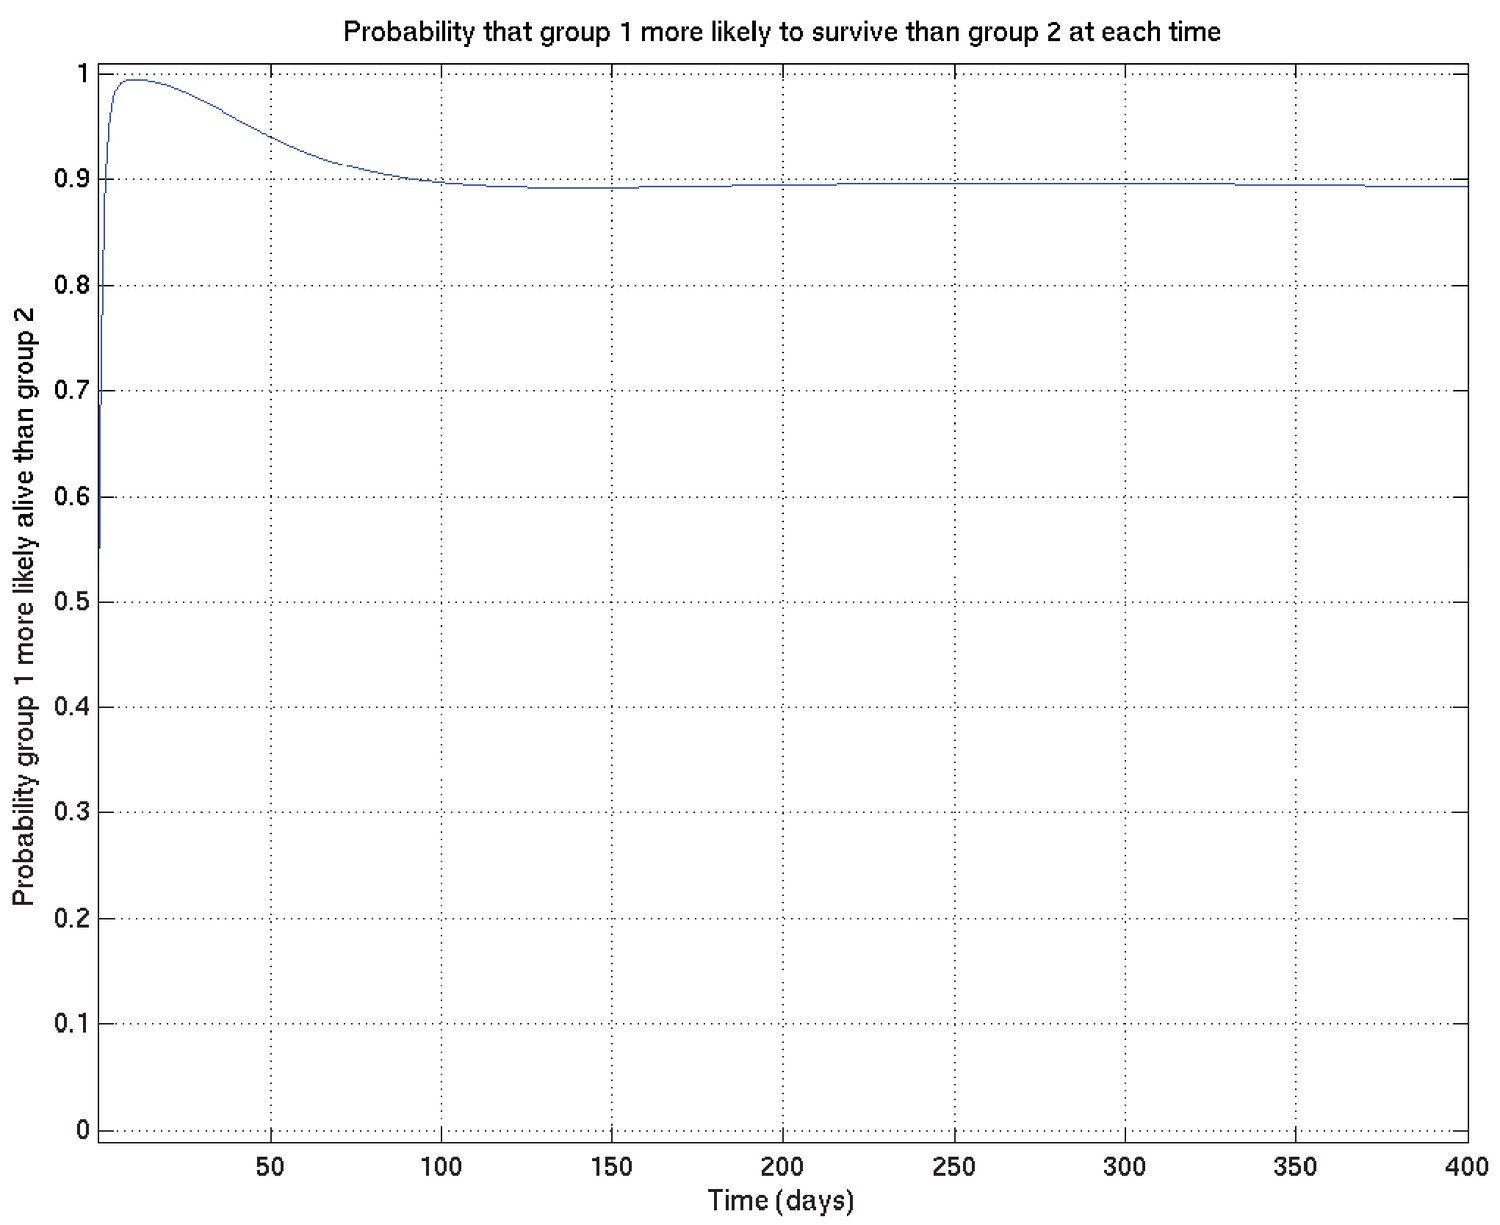
Appendix 2—figure 19
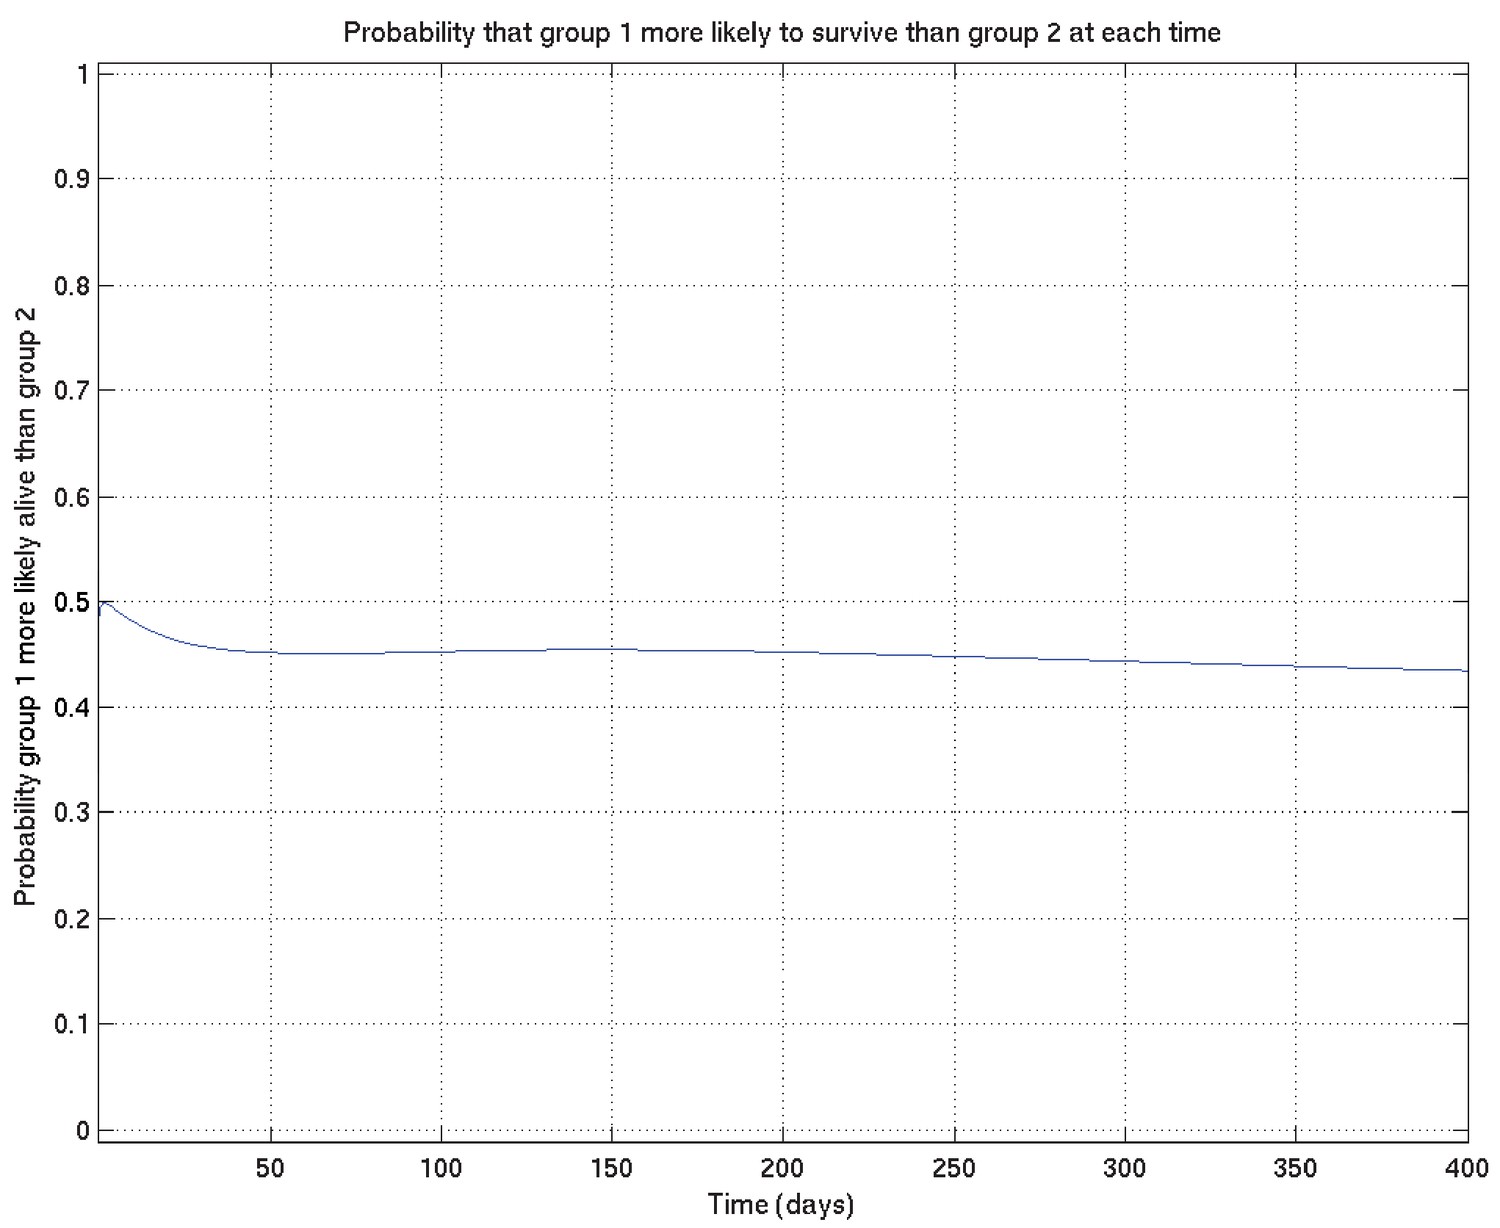
Example of comparison probabilities for inference whose interpretation is explained in detail in section 4 of this document.
See also Appendix 2—figure 18.
Appendix 2—figure 20
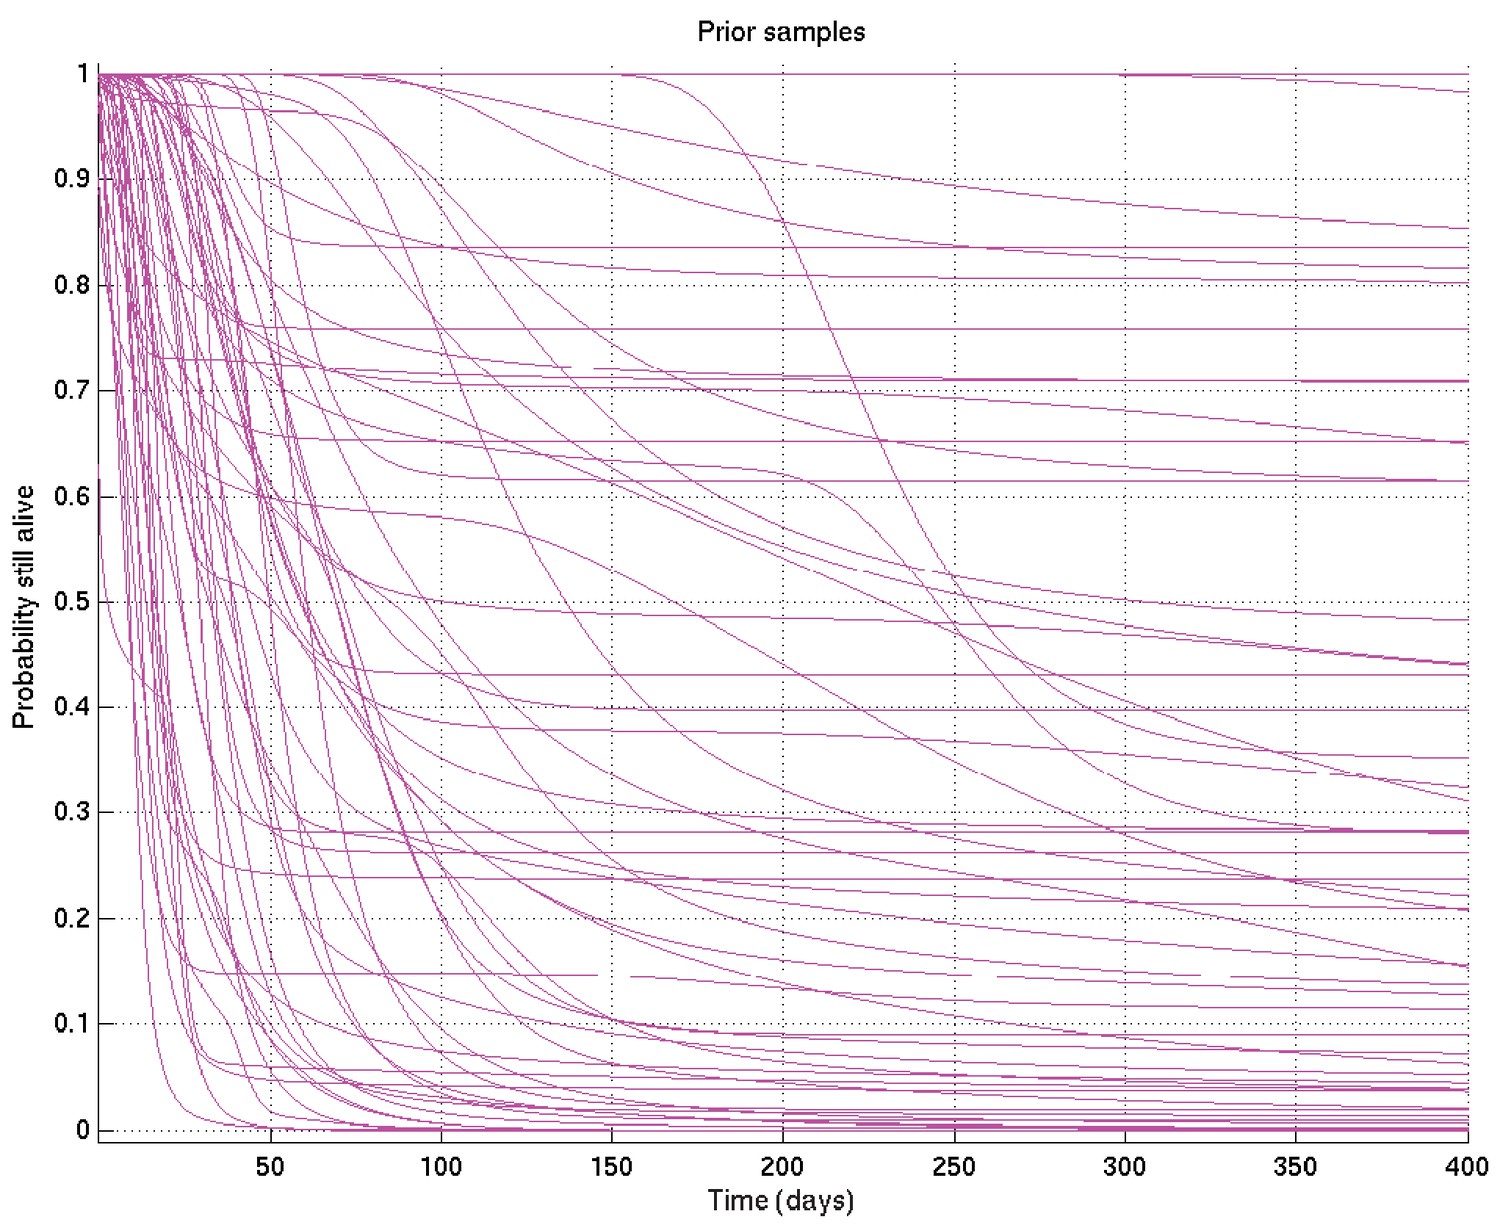
Samples of the survival probability against time for an alternative prior.
Appendix 2—figure 21
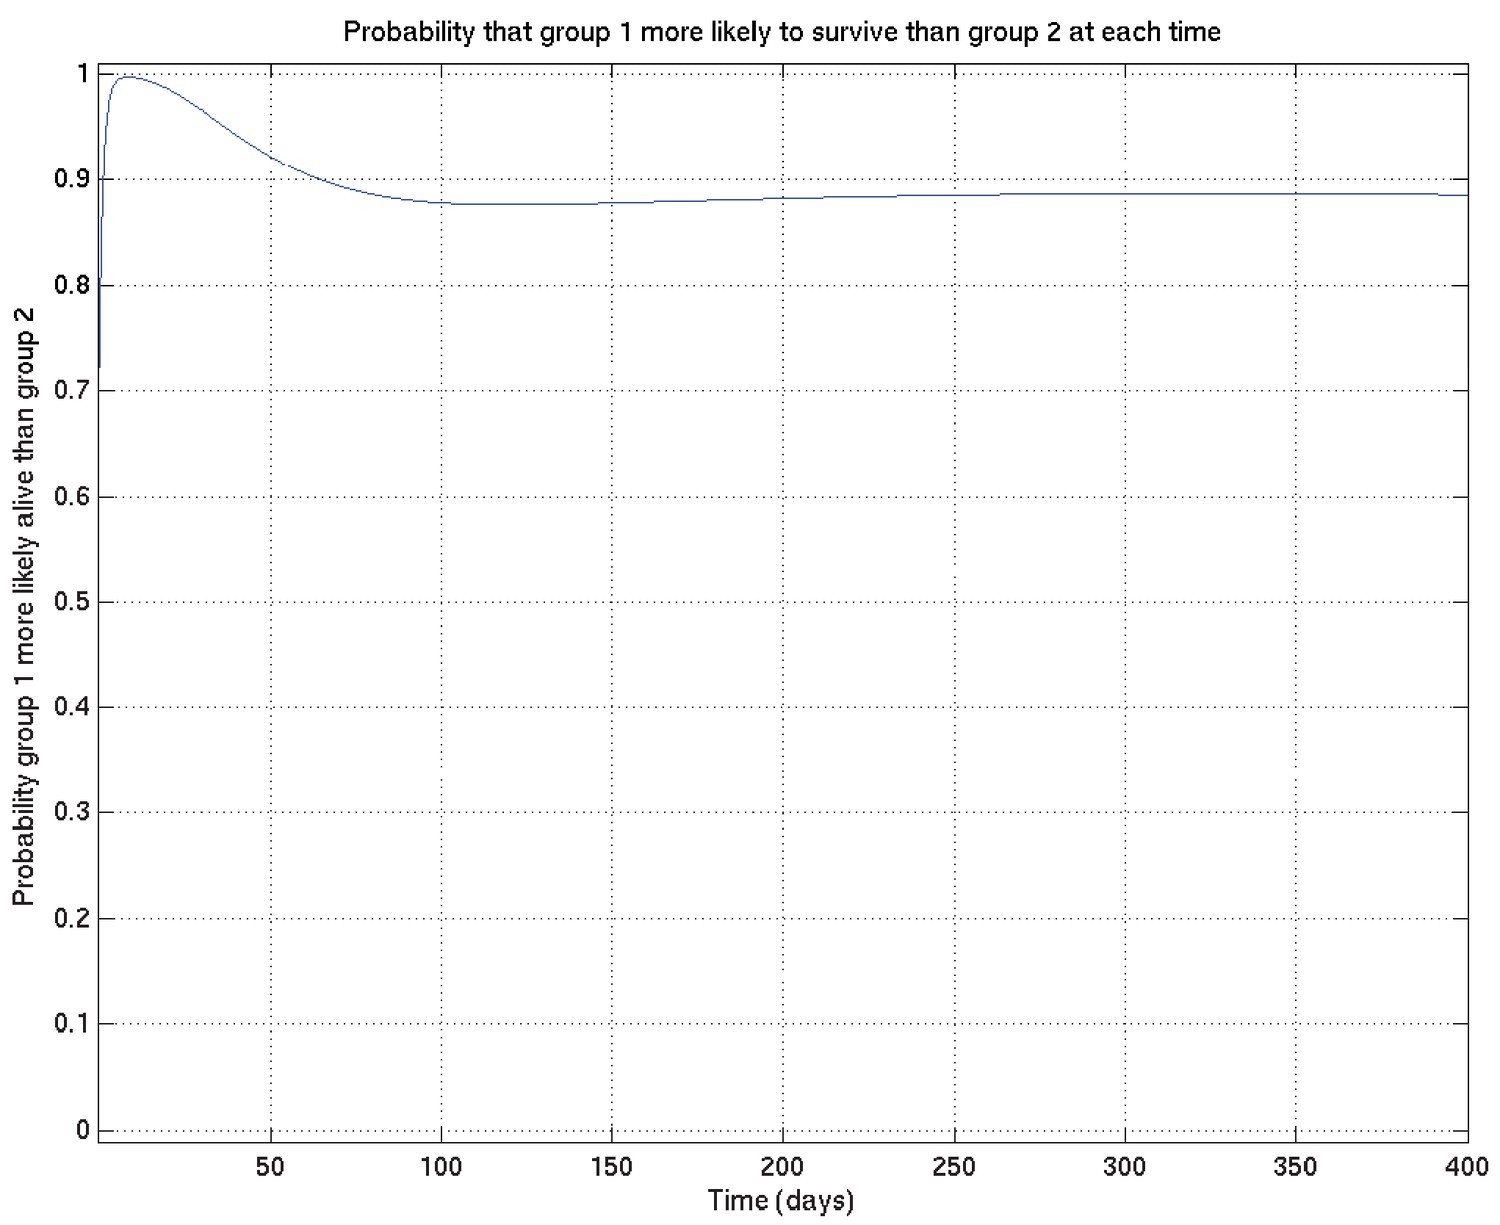
As for Appendix 2—figure 6, showing samples of the survival probability against time for an alternative prior.
Tables
Table 1
Characteristics of the Vietnam and Indonesia cohorts.
Bayesian posterior probabilities comparing the two cohorts are shown (probability that mean of starred group is higher, ** > 0.99, *** > 0.999, all other comparisons, not significant). See also Figure S1 for probability differences for each GCS.
| Vietnam | Indonesia | |
|---|---|---|
| Total | 439 | 376 |
| Glasgow Coma Score mean (range) | 13.3 ** (3-15) | 12.8 (5-15) |
| BMRC TBM grade no. (% of total) 1 2 3 | 163 (37.1) *** 206 (47.0) 70 (15.9) | 34 (9.0) 284 (75.5) *** 58 (15.4) |
| Age in years median (range) | 41 *** (18-93) | 28 (14-90) |
| Age in years by TBM grade median (range) 1 2 3 | 39 (18-85) *** 47 (18-93) *** 33 (18-86) *** | 27 (16-45) 29 (14-90) 26 (14-64) |
| Overall mortality no. (%) | 83 (18.8) | 146 (39.9) *** |
| Time to median mortality (days) | 50 *** | 8 |
Mortality by BMRC TBM grade No. dead (% of grade) 1 2 3 | 12 (6.8) 45 (21.9) 26 (37.9) | 5 (15.9) 106 (38.0) *** 35 (63.8) ** |
Table 2
LTA4H genotype frequency in Vietnam and Indonesia.
Bayesian posterior probabilities comparing the two cohorts (probability that starred group is higher, * > 0.95, ** > 0.99, *** > 0.999, all other comparisons, not significant). Comparisons within each cohort yielded no significant differences in LTA4H genotype frequencies by grade.
| Vietnam | Indonesia | |
|---|---|---|
| rs17525495 LTA4H no. (% total) CC CT TT | 184 (41.9) 212 (48.3)*** 43 (9.8) | 216 (57.5)*** 128 (34.0) 32 (8.5) |
| No. (% of grade total) Grade 1 CC CT TT | 64/163 (39.3) 81/163 (49.7) 18/163 (11.0) | 21/34 (61.8)* 12/34 (35.3) 1/34 (2.9) |
Grade 2 CC CT TT | 86/206 (41.8) 100/206 (48.5)*** 20/206 (9.7) | 161/284 (56.7)*** 99/284 (34.9) 24/284 (8.5) |
Grade 3 CC CT TT | 34/70 (48.6) 31/70 (44.3) 5/70 (7.1) | 34/58 (58.6) 17/58 (29.3) 7/58 (12.1) |
Additional files
-
Source code 1
Inference software.
- https://cdn.elifesciences.org/articles/61722/elife-61722-code1-v2.tar.gz
-
Source data 1
Anonymised patient dataset.
- https://cdn.elifesciences.org/articles/61722/elife-61722-data1-v2.xlsx
-
Supplementary file 1
Characteristics of included and excluded Indonesia patients.
- https://cdn.elifesciences.org/articles/61722/elife-61722-supp1-v2.doc
-
Transparent reporting form
- https://cdn.elifesciences.org/articles/61722/elife-61722-transrepform-v2.pdf
Download links
A two-part list of links to download the article, or parts of the article, in various formats.
Downloads (link to download the article as PDF)
Open citations (links to open the citations from this article in various online reference manager services)
Cite this article (links to download the citations from this article in formats compatible with various reference manager tools)
A Bayesian analysis of the association between Leukotriene A4 Hydrolase genotype and survival in tuberculous meningitis
eLife 10:e61722.
https://doi.org/10.7554/eLife.61722


