Twisting of the zebrafish heart tube during cardiac looping is a tbx5-dependent and tissue-intrinsic process
- Hubrecht Institute-KNAW and University Medical Center Utrecht, Netherlands
- Mathematical Institute, Leiden University, Netherlands
- Origins Center, Leiden University, Netherlands
- Amsterdam UMC, University of Amsterdam, Department of Medical Biology, Amsterdam Cardiovascular Sciences, Netherlands
- Institute of Biology, Leiden University, Netherlands
- Department of Pediatric Cardiology, Division of Pediatrics, University Medical Center Utrecht, Netherlands
Figures
Figure 1 with 1 supplement
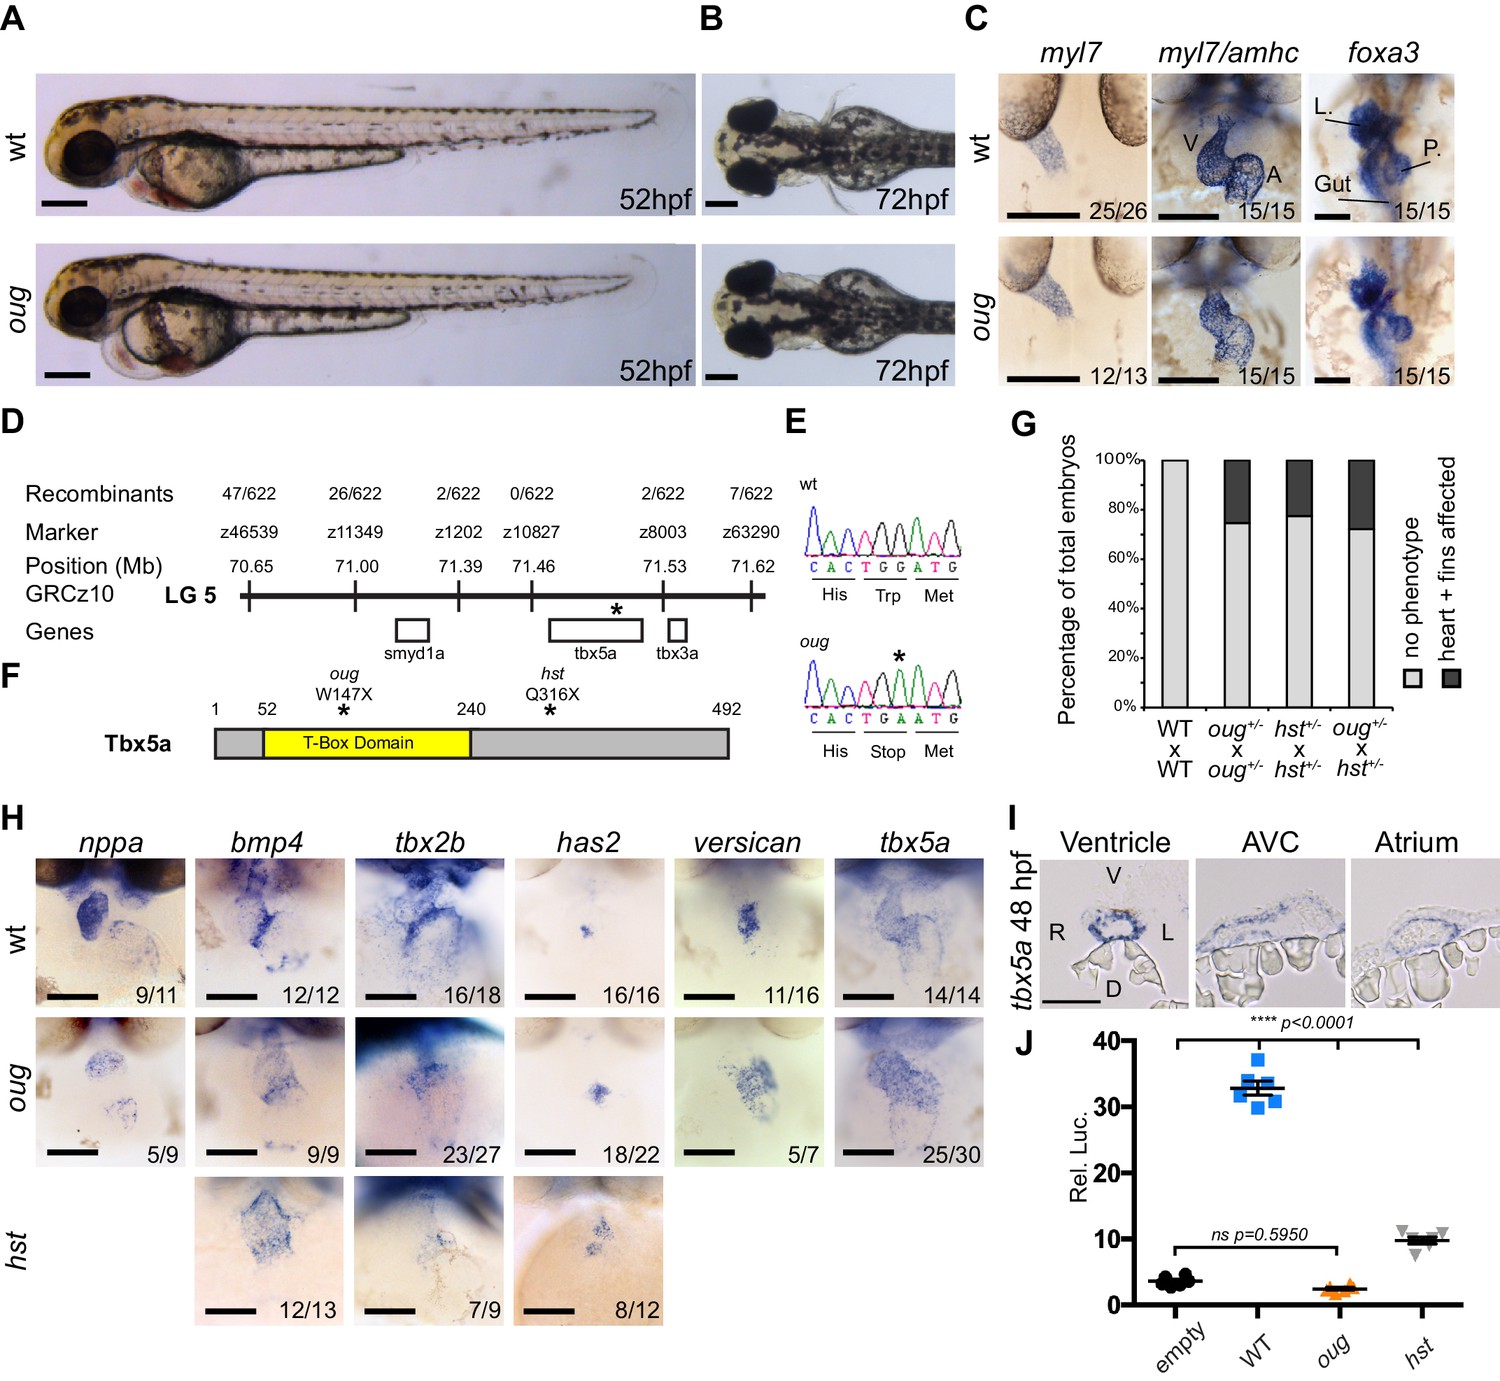
The oudegracht (oug) mutant carries a tbx5a null allele and displays defective cardiac looping.
(A) Lateral view of wt and oug mutant embryos at 52 hpf. Note the cardiac edema in oug. (B) At 72 hpf dorsal observation of oug mutant embryos reveals absence of lateral fins. (C) Two dpf oug mutant embryos display defective cardiac looping but normal asymmetric positioning of the internal organs. L, liver; P, pancreas (D) Mapping and genomic position of the oug mutation (indicated by the asterix). (E) A single-nucleotide substitution in tbx5a (G to A) resulting in a tryptophan (Trp; TGG) to stop (TGA) mutation segregates with the oug phenotype. (F) Tbx5a is truncated at amino acid 147 in oug, in its T-Box domain. The hst allele (Q316X; Garrity et al., 2002) is included for comparison (G) Complementation test. Outcross of oug+/- to hst+/- fails to complement the oug cardiac and pectoral fin bud phenotype. (H) Gene patterning is affected in oug hearts at 2dpf. Expression of nppa is reduced in the cardiac chambers while expression of bmp4 and tbx2b is expanded in the AV canal. Cardiac cushion markers has2 and versican also show expanded expression domains. ISH for hst is shown for comparison: while bmp4 and has2 display expanded expression domains as in oug, tbx2b is barely detectable. Transcripts for tbx5a are detected in wt and oug mutants. (I) Transcripts for tbx5a can be detected evenly in transversal sections through the entire 2 dpf heart tube. (J) Luciferase assay establishes that oug retains virtually no activity. Mean values ± SEM are shown. Scale bars (A,B,C,H): 100 µm; (I): 50 µm.
-
Figure 1—source data 1
Source files for data presented in panels G and J.
- https://cdn.elifesciences.org/articles/61733/elife-61733-fig1-data1-v1.xlsx
Figure 1—figure supplement 1
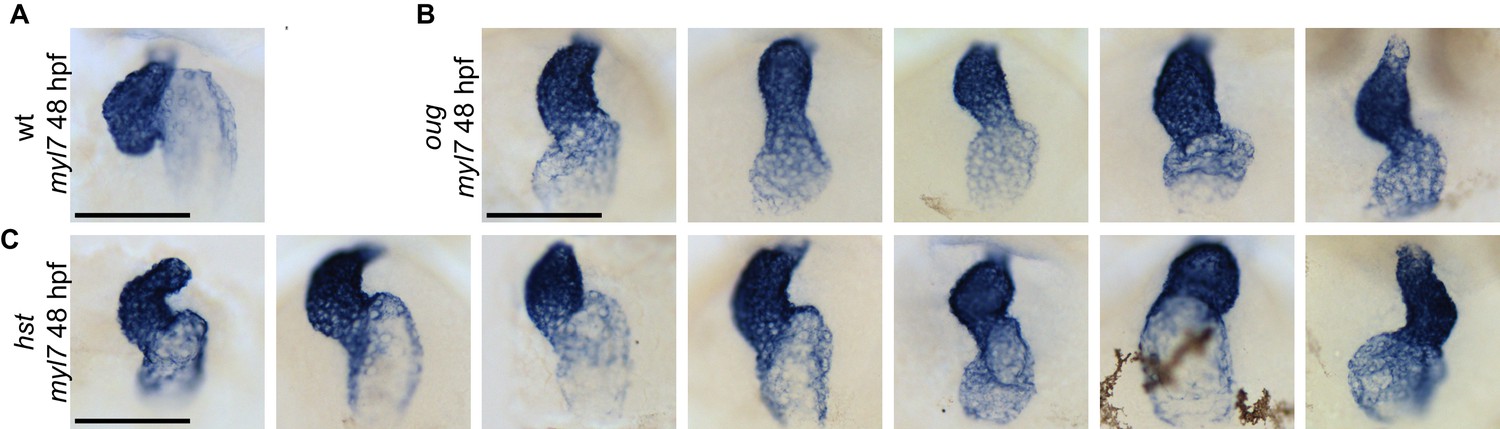
Variability of the looping phenotype in oug and hst zebrafish alleles of tbx5a.
ISH for the cardiomyocyte marker myl7 in 48 hpf embryos. A wild-type heart which has completed dextral looping is shown for comparison in (A). (B) Representative images of oug mutant hearts at 48 hpf. All hearts display mild dextral looping (compare with (A)). (C) Looping phenotypes in the hst mutant range from substantial dextral looping (left panels) to moderate sinistral looping (right panels). Scale bar: 100 µm.
Figure 2 with 17 supplements
Cardiac looping is accompanied by opposite rotation of the cardiac chambers.
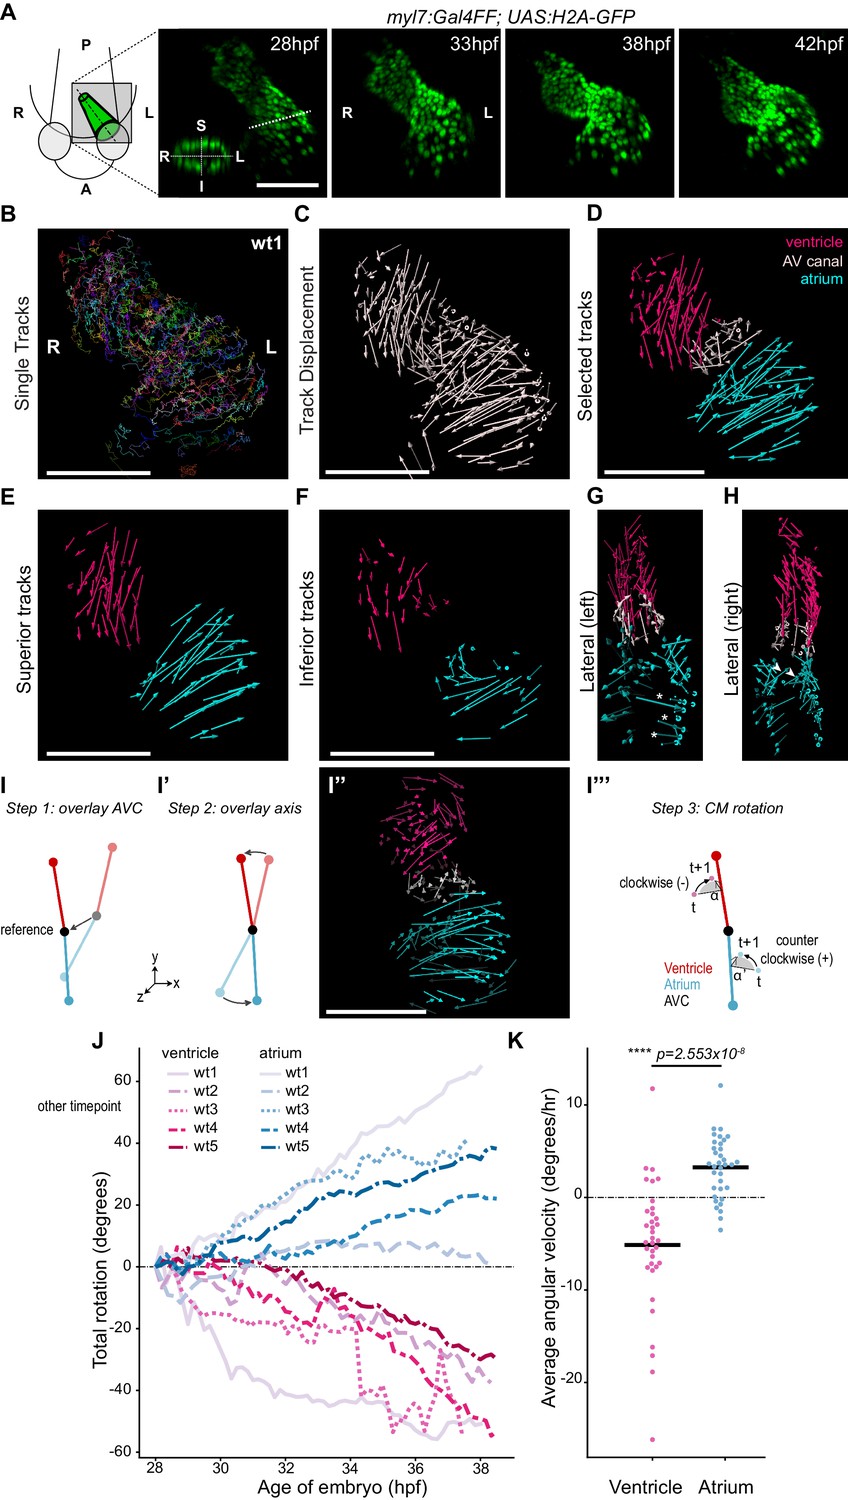
(A) Time-lapse imaging is carried out on tg(myl7:Gal4FF; UAS:H2A-GFP) embryos. In the 28 hpf panel, the dashed line indicates the position of the transversal section shown in the bottom left corner, in which the superior (S), inferior (I), right (R) and left (L) sides of the heart tube are defined. One representative heart is shown. A: anterior; P: posterior. (B) Total tracks (Ventral View). Each track is color-coded and is assigned an ID number. (C) Track displacement vectors for each single trace. (D) Track displacement vectors to be analyzed are selected, categorized by visual inspection and color-labeled accordingly. (E) Cardiac displacement vectors on the superior side of the ventricle and atrium and (F) on the inferior side of the cardiac chambers. (G) Displacement of cardiomyocytes at the outer curvature (asterisks) and (H) at the inner curvature (arrowheads) of the atrium are compatible with rotation of the chamber. (I–I’’') Computational unfolding and angular velocity measurement. (I-I'') Steps 1 and 2 (I, I') taken to computationally unfold the heart tube, resulting in the vector map shown in I''. The angular velocity of the cardiomyocytes is then calculated in the plane perpendicular to the axis (I'''). A detailed description of the methodology is available in the SI (J) Cumulative rotation angle for the ventricle (shades of red) and atrium (shades of blue) in wild-type hearts. Note the opposite direction of rotation of the two chambers. Positive values represent anti-clockwise rotation and negative values represent clockwise rotation with respect to the outflow of the heart. (K) Comparison of the average angular velocity for each replicate per 1.5 hr time window displayed by the chambers analyzed in (J). Horizontal bars: mean values. Scale bars: 100 µm.
-
Figure 2—source data 1
Source files for data presented in panels J and K.
- https://cdn.elifesciences.org/articles/61733/elife-61733-fig2-data1-v1.xlsx
Figure 2—figure supplement 1
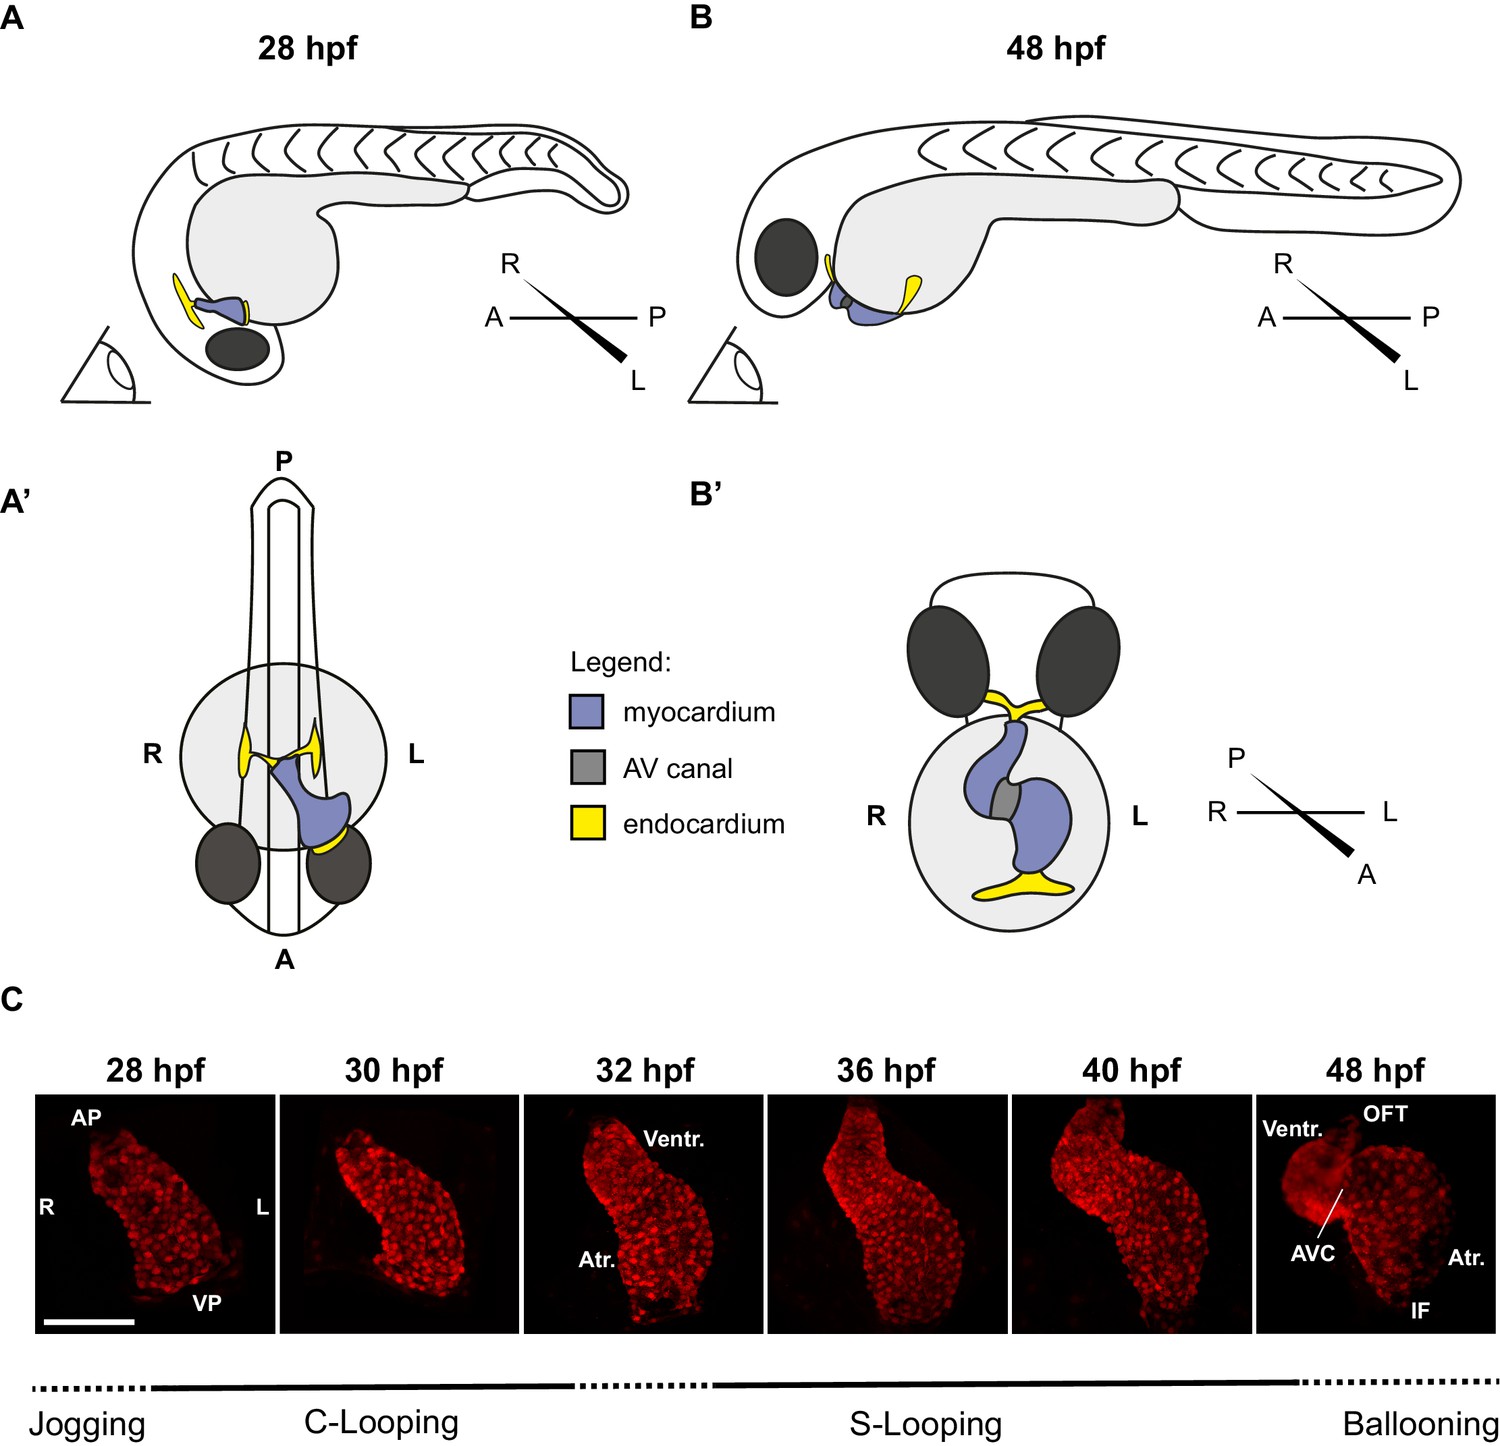
Zebrafish cardiac looping.
Explanatory cartoons illustrating the change in orientation of the heart in the zebrafish embryo between 28 hpf and 48 hpf. (A) Lateral (left) view of the embryo at 28 hpf. The heart tube has completed cardiac jogging. It has elongated leftwards (see dorsal view in A’) and roughly has a conical shape, with a narrow opening at the anterior pole (AP) and a broader opening at the venous pole (VP) (see also C). Note that the venous pole is located anteriorly in relation to the arterial pole (B–B’) As development proceeds, the heart tube shifts forward with respect to the general anterior-posterior axis of the embryo (compare A and B) and positions itself ventrally (B’) with respect to such axis. Hence, from an unchanged position (eye cartoon in A and B) the heart tube position flips with respect to the axis of the embryo. Note that by 48 hpf the venous pole is now located posteriorly in relation to the arterial pole (C) Representative Z-stack projections of tg(myl7:Gal4FF; UAS:RFP) hearts at 28 hpf, 30 hpf, 32 hpf, 36 hpf, 40 hpf, and 48 hpf. VP: Venous Pole; AP: Arterial Pole; Atr.: Atrium; Ventr.:Ventricle; IF: Inflow; OFT: Outflow Tract; AV canal: Atrio-Ventricular Canal. Scale bar: 100 µm.
Figure 2—figure supplement 2
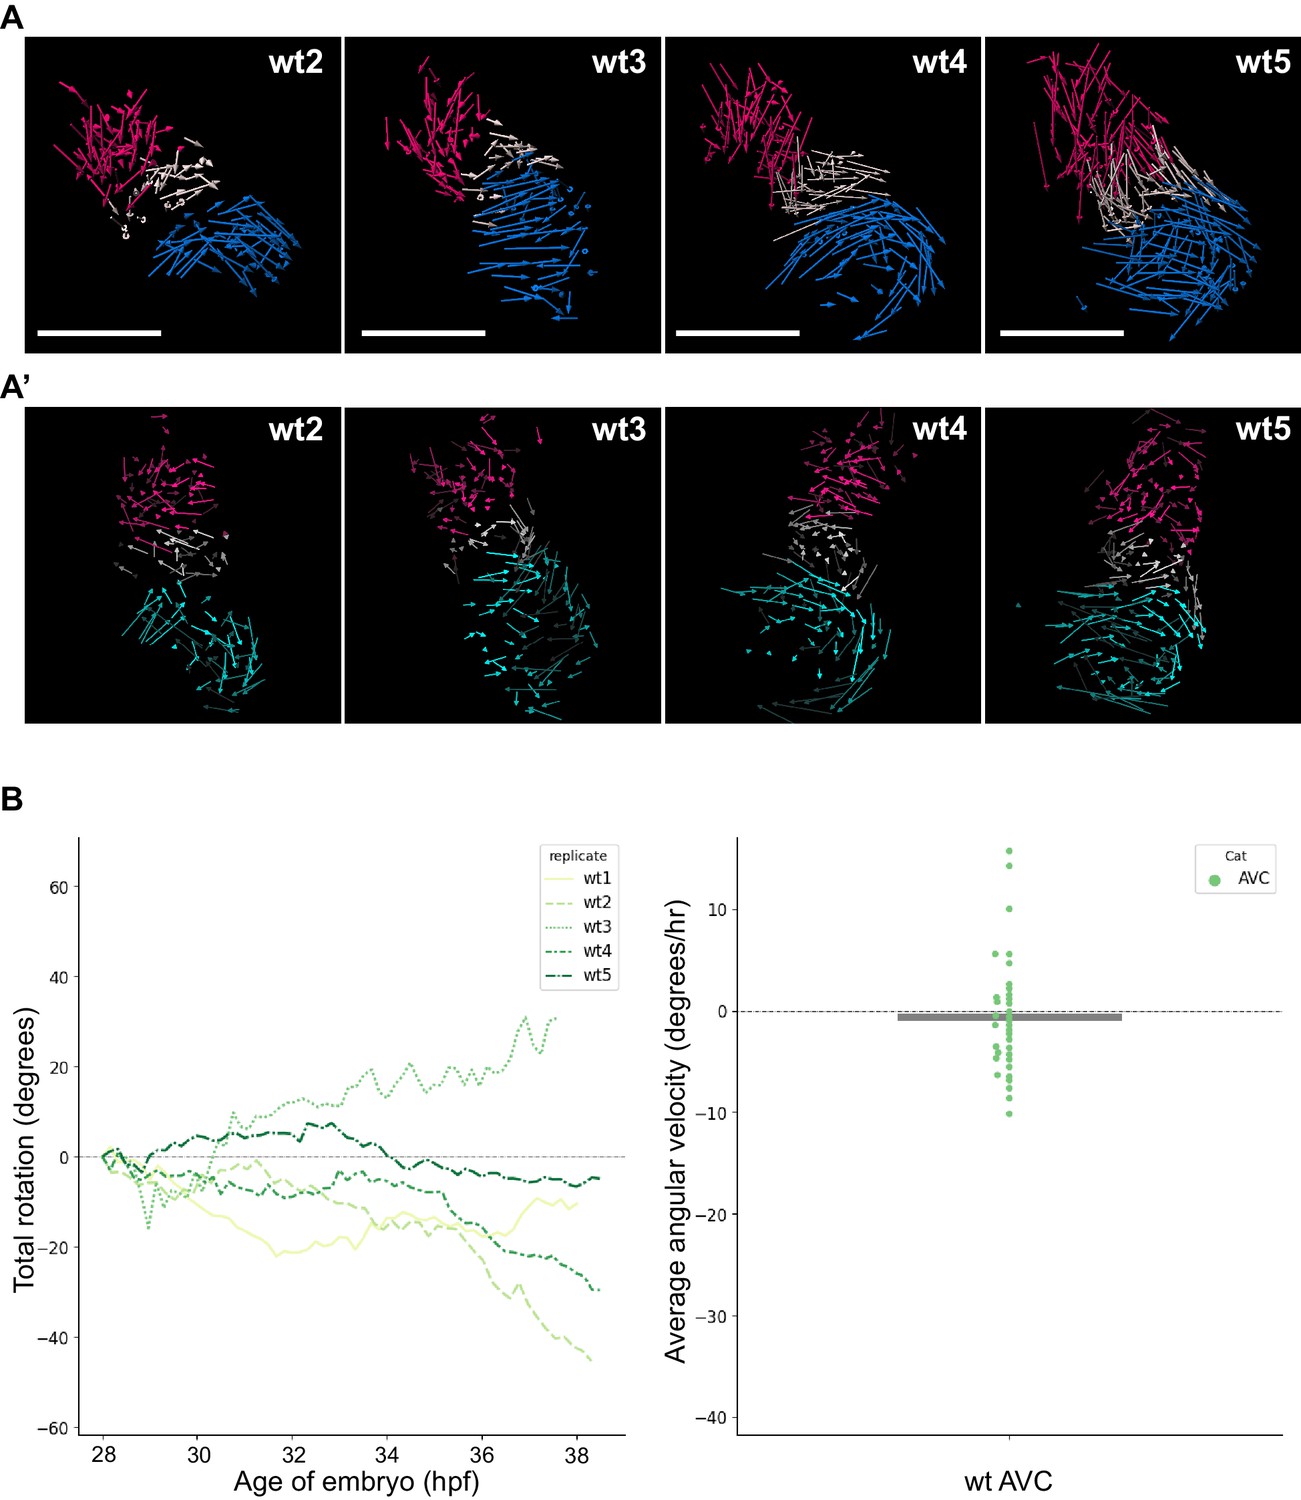
Analyzed wt hearts and AV canal analysis.
(A) Track displacement vectors for wildtype hearts wt2, wt3, wt4, and wt5. (A’) Vector maps for wildtype hearts wt2, wt3, wt4 and wt5 after computational unfolding. Ventricle (red), Atrium (blue/cyan) and AV canal (white) vectors are reported as for wt1 in Figure 2. For all hearts presented in this figure supplement: timelapses for tg(myl7:Gal4FF; UAS:H2A-GFP) are available as Figure 2—videos 4–7; displacement vectors (360° rotation) as Figure 2—videos 8–11; computational processing of heart timelapses as Figure 2—videos 12–15. (B) Left panel: Total cumulative rotation angle for the AV canal in the analyzed wildtype hearts. Right panel: average angular velocity per 1.5 hr time window displayed by the AV canal (AVC) of the hearts analyzed in the left panel. Scale bar: 100 µm.
-
Figure 2—figure supplement 2—source data 1
Source files for data presented in panel B of Figure 2—figure supplement 2.
- https://cdn.elifesciences.org/articles/61733/elife-61733-fig2-figsupp2-data1-v1.xlsx
Figure 2—video 1
Timelapse of wt1 tg(myl7:Gal4FF; UAS:H2A-GFP) heart.
Figure 2—video 2
Displacement vectors for wt1 heart (360° rotation).
Figure 2—video 3
Computational processing of wt1 heart timelapse.
Figure 2—video 4
Timelapse of wt2 tg(myl7:Gal4FF; UAS:H2A-GFP) heart.
Figure 2—video 5
Timelapse of wt3 tg(myl7:Gal4FF; UAS:H2A-GFP) heart.
Figure 2—video 6
Timelapse of wt4 tg(myl7:Gal4FF; UAS:H2A-GFP) heart.
Figure 2—video 7
Timelapse of wt5 tg(myl7:Gal4FF; UAS:H2A-GFP) heart.
Figure 2—video 8
Displacement vectors for wt2 heart (360° rotation).
Figure 2—video 9
Displacement vectors for wt3 heart (360° rotation).
Figure 2—video 10
Displacement vectors for wt4 heart (360° rotation).
Figure 2—video 11
Displacement vectors for wt5 heart (360° rotation).
Figure 2—video 12
Computational processing of wt2 heart timelapse.
Figure 2—video 13
Computational processing of wt3 heart timelapse.
Figure 2—video 14
Computational processing of wt4 heart timelapse.
Figure 2—video 15
Computational processing of wt5 heart timelapse.
Figure 3 with 2 supplements

Origin and final positioning of left- and right-originating cardiomyocytes during cardiac looping.
(A) At 28 hpf, as cardiac jogging towards the anterior left side of the embryo is completed, (A’) the tg(0.2Intr1spaw:GFP) labels cardiomyocytes localizing to the superior side of the cardiac tube (section). (B) By 48 hpf cardiac looping morphogenesis is accompanied by displacement in opposite directions of left-originating cardiomyocytes toward the outer curvatures of the ventricle and the atrium (arrowheads in the section and surface view panels). (C) At 48 hpf, the oug mutant heart tube fails to display any constriction at the AV canal and left-originating cardiomyocytes are not visible in the region around the outer curvatures of the cardiac chambers (asterisk; ventricle). Legends: R: Right; L: Left; S: Superior side; I: Inferior side. Scale bars: 50 µm.
Figure 3—figure supplement 1
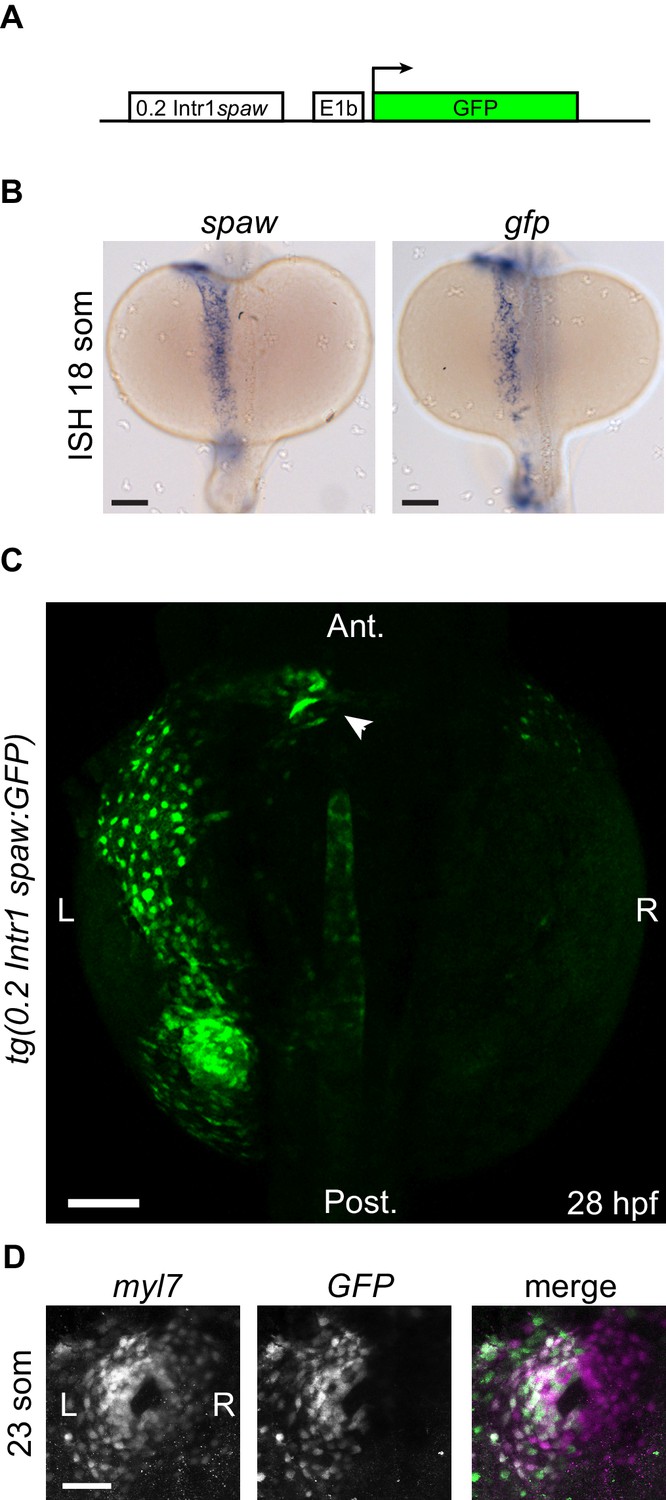
Transgenic 0.2Intr1spaw:eGFP reporter line.
(A) An approximately 0.2 kb conserved sequence located in Intron 1 of the spaw genomic locus, hereafter called 0.2Intr1spaw, was used to drive expression of GFP. (B) ISH on spaw and GFP at 18 somites confirms the validity of the tg(0.2Intr1spaw:eGFP) reporter expression pattern. (C) GFP fluorescence at 28 hpf illustrates the left LPM reporter use of the 0.2Intr1spaw:eGFP line. (D) At the cardiac disc stage (23 som), the tg(0.2Intr1spaw:eGFP) reporter is expressed in cardiomyocytes exclusively belonging to the left half of the cardiac disc. Arrowhead indicates arterial pole of the heart tube. Legends: R: Right; L: Left. Scale bar: 100 µm.
Figure 3—figure supplement 2
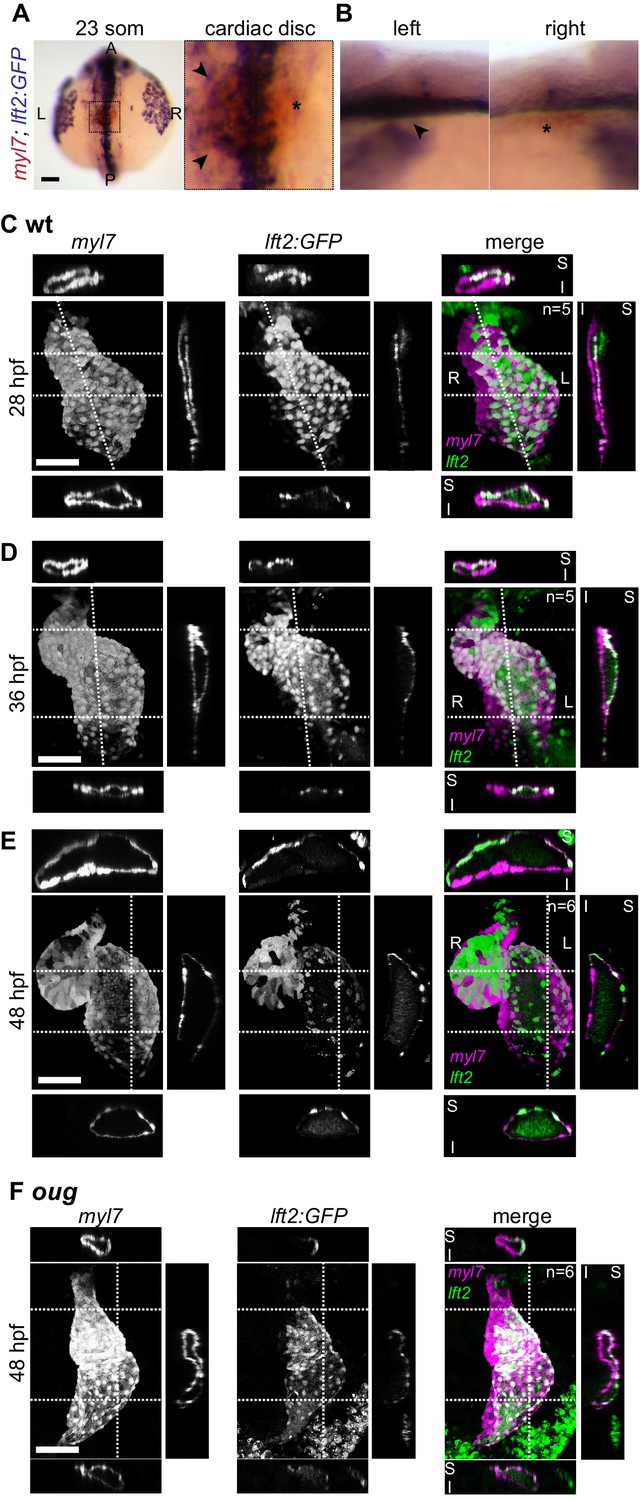
Use of the lft2BAC:Gal4FF to track left- and -right originating cardiomyocytes during cardiac looping.
(A,B) Double-color ISH shows GFP transcripts in the left half of the cardiac disc at the 23 somites stage (arrowheads in magnification in (A) and left lateral view in (B)). Asterisks denote absence of GFP ISH signal in the right halve of the cardiac disc. Staining at the midline is extracardiac and ascribed to Gal4/UAS system. (C) At 28 hpf, left- and right-originating cardiomyocytes (lft2:GFP+ and lft2;GFP- respectively) are organized in a superior-inferior manner, as reported previously (Smith et al., 2008). (D) As cardiac looping progresses, left-originating cells are displaced towards the outer curvatures of the ventricle and atrium. Conversely, at the inner curvature of the atrium only right-originating cells can be observed. (E) After completion of cardiac looping, left-originating cells are located at the outer curvatures of the ventricle and atrium, as also observed in the 0.2Intr1spaw:GFP line. (F) In the oug heart at 48 hpf left-originating cardiomyocytes (magenta) remain absent from the outer curvature of the ventricle. Legends: R: Right; L: Left; S: Superior side; I: Inferior side. Scale bar: 50 µm.
Figure 4 with 16 supplements
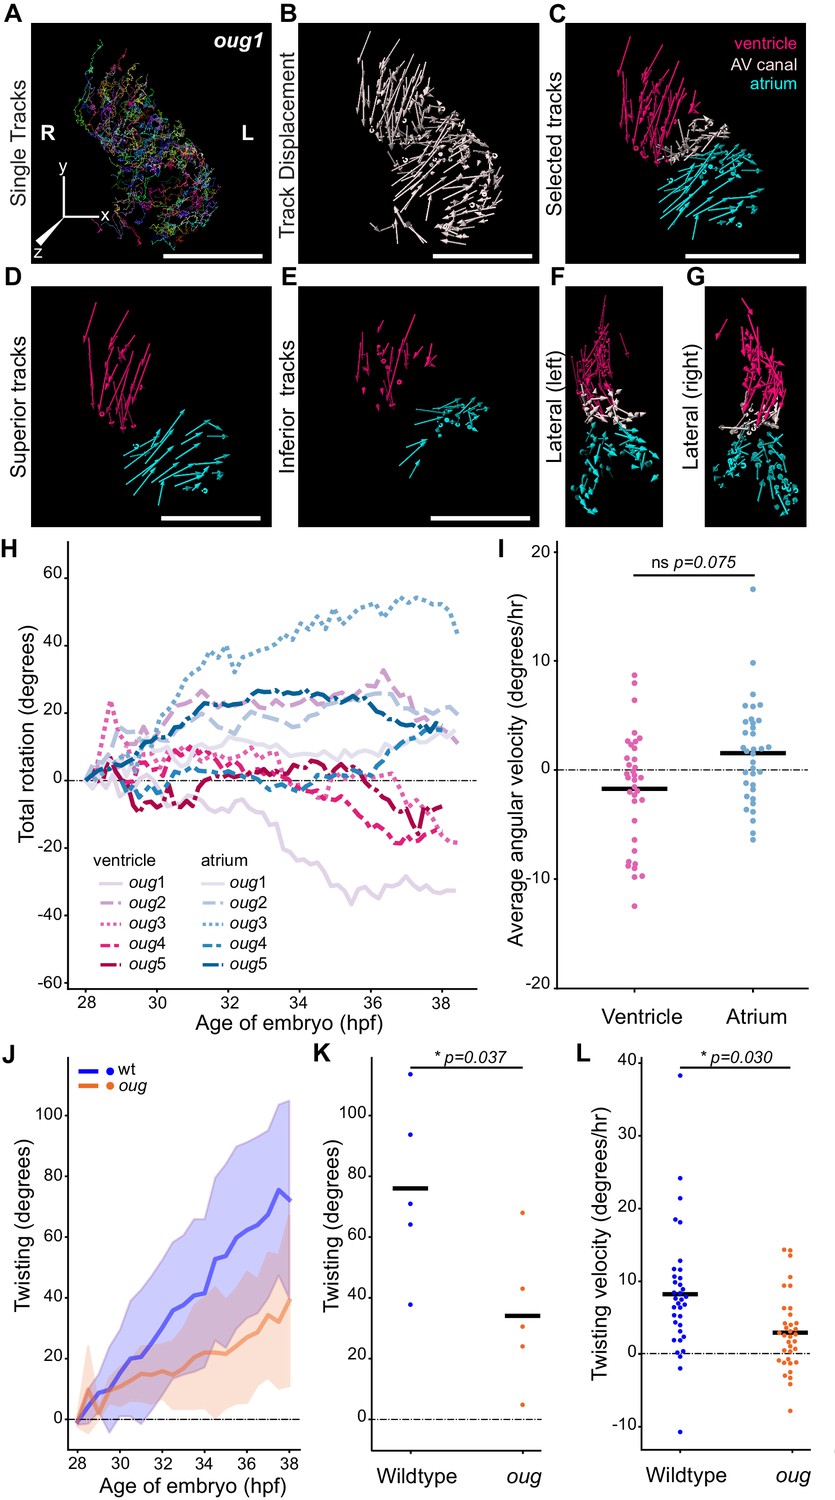
Cardiac looping is defective in oug mutants due to absence of asymmetric rotation of the cardiac chambers.
(A) Total tracks (Ventral View) obtained from a time-lapse movie of cardiac looping in an oug mutant. Each track is colour-coded and is assigned an ID number. (B) Track displacement vectors for each trace drawn in (A). (C) Track displacement vectors to be analyzed are selected, categorized by visual inspection and colour-labeled accordingly. (D) Detail of the track displacement vectors on the superior cardiac side and (E) on the inferior cardiac side. (F), (G) Lateral views of the selected tracks reveal no major displacement along the Z-axis. (H) Cumulative rotation angle for the ventricle (shades of red) and atrium (shades of blue) in oug hearts. Compare with Figure 2F; the chambers do not show separation. With the outflow of the heart as viewpoint, positive values represent anti-clockwise rotation and negative values represent clockwise rotation. (I) Comparison of the average angular velocity for each replicate per 1.5 hr time window displayed by the chambers analyzed in (H). Horizontal bars: mean values. (J–L) Twisting of the heart tube during cardiac looping. (J) Plot of the twisting angle (as defined in the main text and in Appendix 1- Supplementary Methods) in time. The looping defect in oug is due to a reduced twisting of the heart tube. Solid lines: Mean; shaded area: standard deviation. (K) Average twisting angle for the sample hearts 9 hr after the start of the timelapse (37 hpf). Horizontal bars: mean values. (L) The twisting velocity in 1.5 hr windows in the wt samples is significantly higher than in oug. Horizontal bars: mean values. Scale bars: (A–C): 100 µm.
-
Figure 4—source data 1
Source files for data presented in panels H, I, J, K, and L.
- https://cdn.elifesciences.org/articles/61733/elife-61733-fig4-data1-v1.xlsx
Figure 4—figure supplement 1
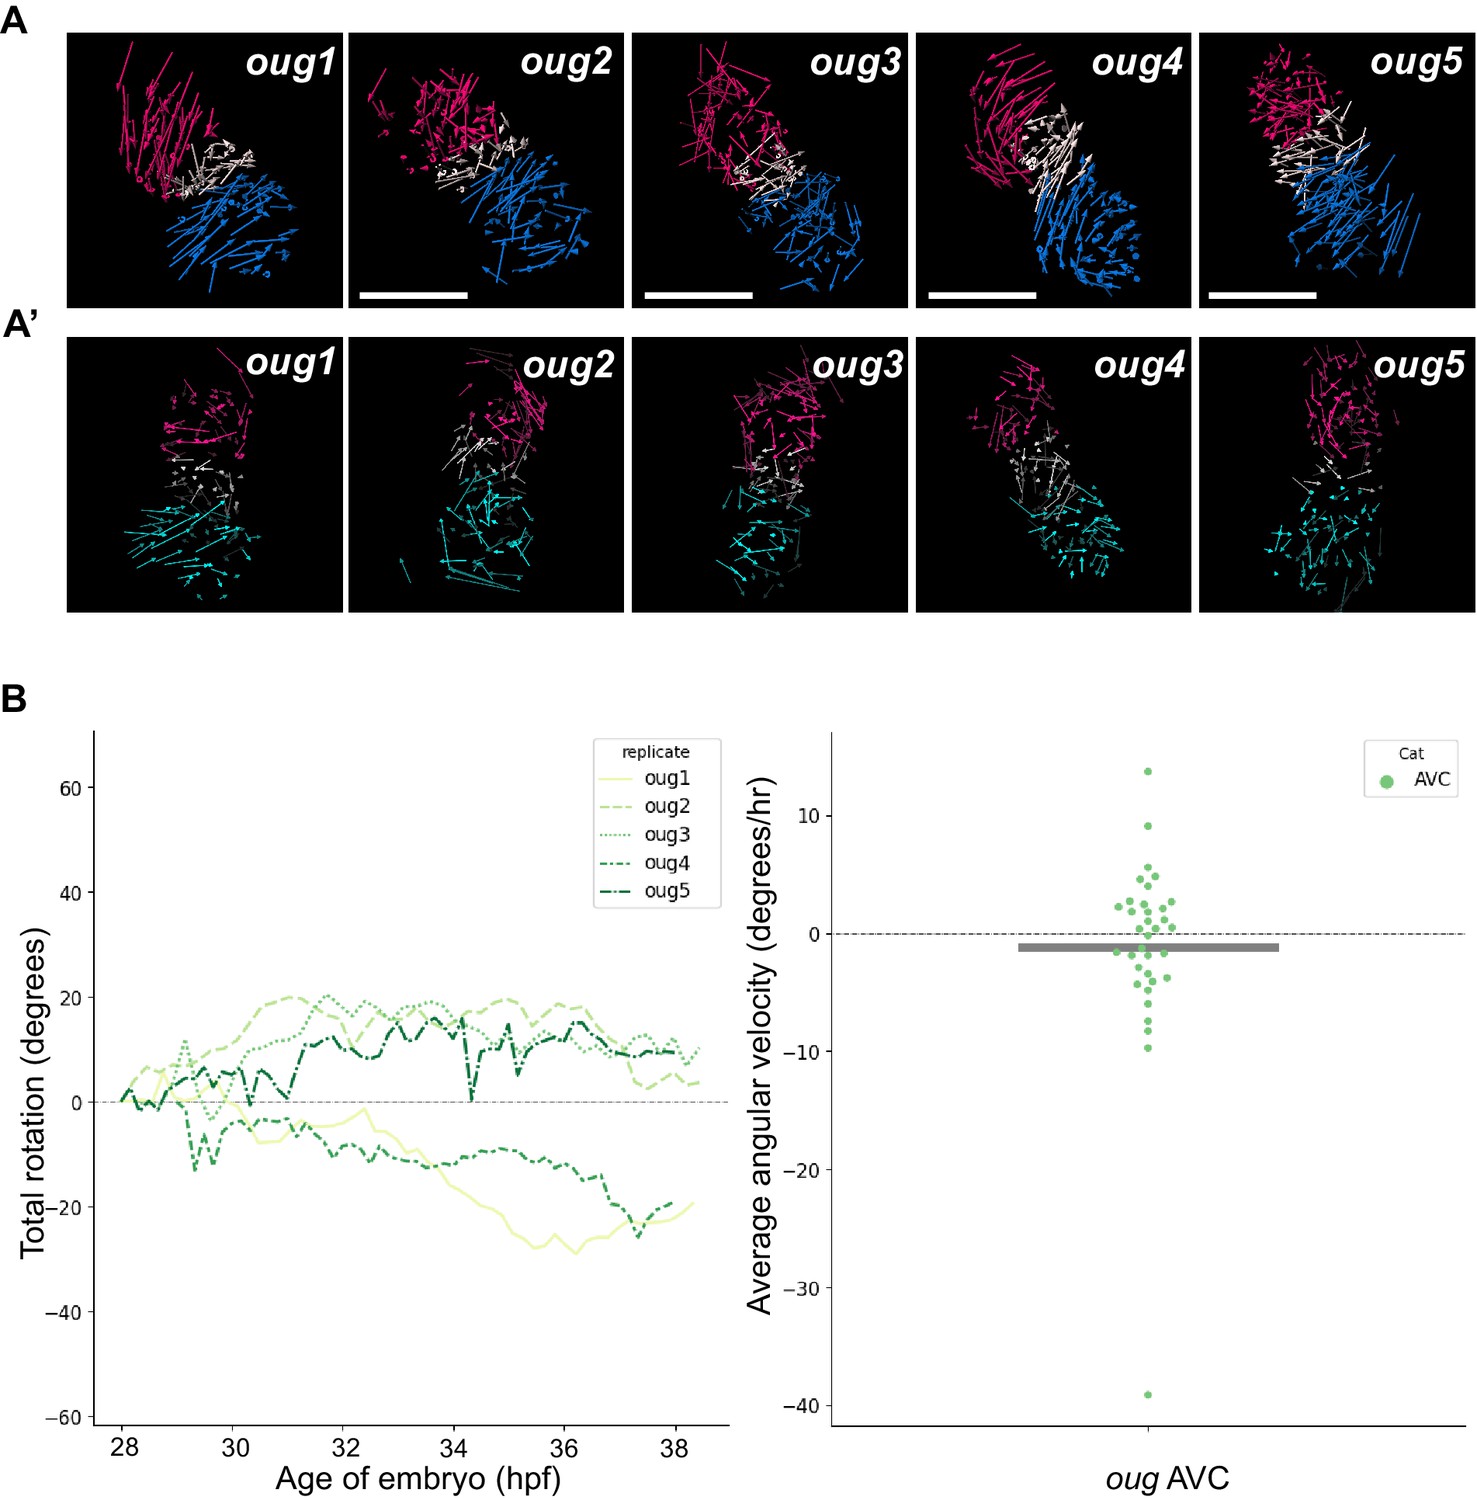
Analyzed oug hearts and AV canal analysis.
(A) Track displacement vectors for oug hearts oug2, oug3, oug4, and oug5. (A’) Vector maps for oug hearts oug2, oug3, oug4 and oug5 after computational unfolding. Ventricle (red), Atrium (blue/cyan) and AV canal (white) vectors are reported as for oug1 in Figure 4. For all hearts presented in this figure supplement: timelapses for tg(myl7:Gal4FF; UAS:H2A-GFP) are available as Figure 4—videos 4–7; displacement vectors (360° rotation) as Figure 4—videos 8–11; computational processing of heart timelapses as Figure 4—videos 12–15. (B) Left panel: Total cumulative rotation angle for the AV canal in the analyzed oug hearts. Right panel: average angular velocity per 1.5 hr time window displayed by the AV canal (AVC) of the hearts analyzed in the left panel. Scale bar: 100 µm.
-
Figure 4—figure supplement 1—source data 1
Source files for data presented in panel B of Figure 4—figure supplement 1.
- https://cdn.elifesciences.org/articles/61733/elife-61733-fig4-figsupp1-data1-v1.xlsx
Figure 4—video 1
Timelapse of oug1 tg(myl7:Gal4FF; UAS:H2A-GFP) heart.
Figure 4—video 2
Displacement vectors for oug1 heart (360° rotation).
Figure 4—video 3
Computational processing of oug1 timelapse.
Figure 4—video 4
Timelapse of oug2 tg(myl7:Gal4FF; UAS:H2A-GFP) heart.
Figure 4—video 5
Timelapse of oug3 tg(myl7:Gal4FF; UAS:H2A-GFP) heart.
Figure 4—video 6
Timelapse of oug4 tg(myl7:Gal4FF; UAS:H2A-GFP) heart.
Figure 4—video 7
Timelapse of oug5 tg(myl7:Gal4FF; UAS:H2A-GFP) heart.
Figure 4—video 8
Displacement vectors for oug2 heart (360° rotation).
Figure 4—video 9
Displacement vectors for oug3 heart (360° rotation).
Figure 4—video 10
Displacement vectors for oug4 heart (360° rotation).
Figure 4—video 11
Displacement vectors for oug5 heart (360° rotation).
Figure 4—video 12
Computational processing of oug2 timelapse.
Figure 4—video 13
Computational processing of oug3 timelapse.
Figure 4—video 14
Computational processing of oug4 timelapse.
Figure 4—video 15
Computational processing of oug5 timelapse.
Figure 5 with 1 supplement
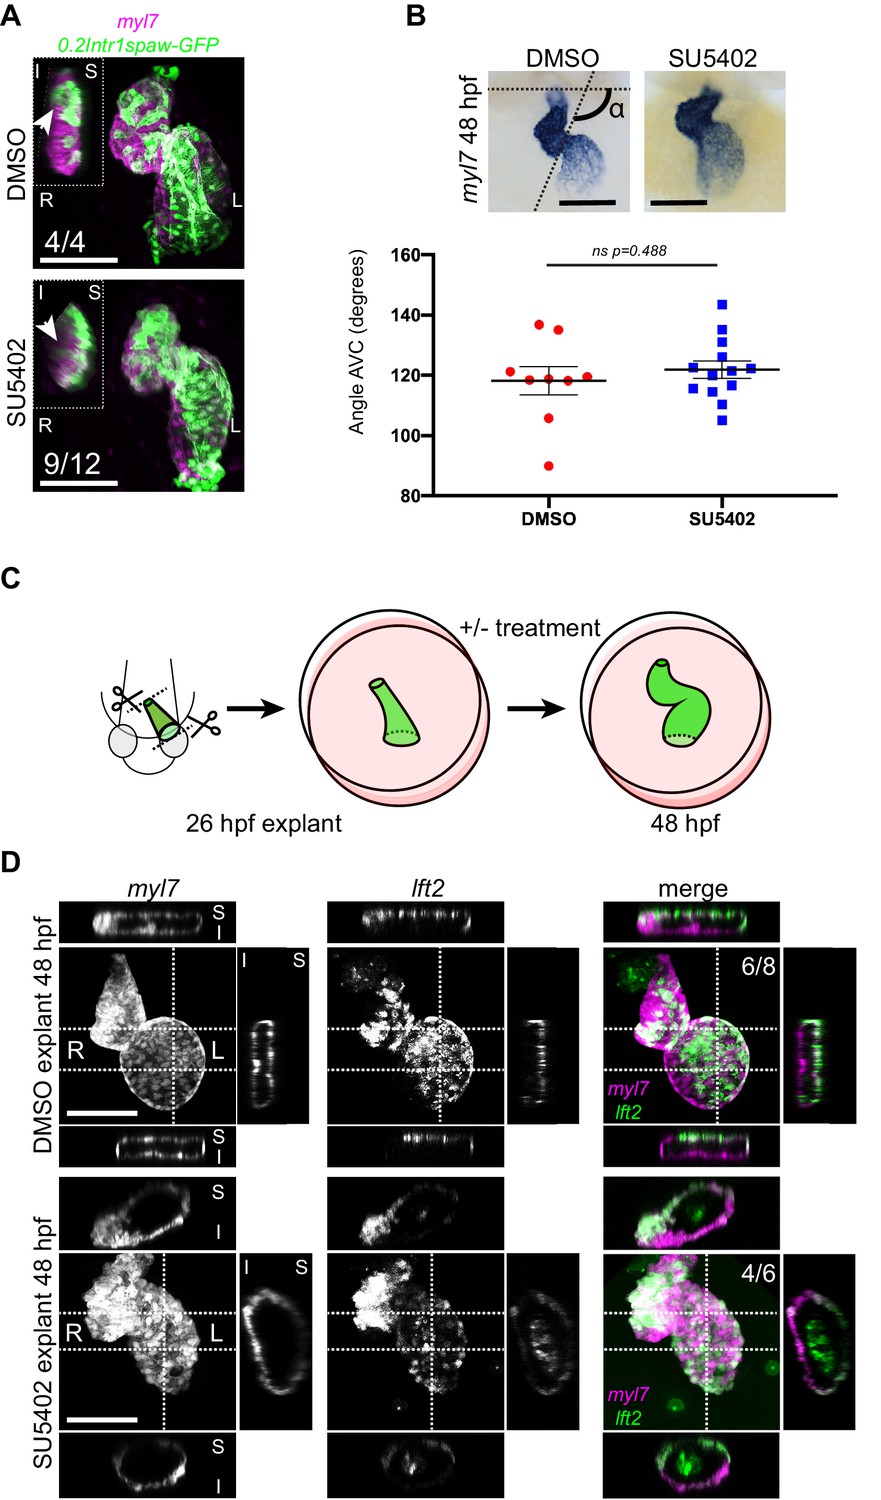
Chemical and physical suppression of cell addition to the heart tube do not affect proper completion of cardiac looping.
Representative SU5402-treated and DMSO Control (explanted) hearts are shown. (A) 48 hpf tg(myl7:Gal4FF; UAS:RFP; 0.2Intr1spaw-GFP) hearts. In SU5402-treated hearts, dextral looping is completed and left-originating cardiomyocytes (green) can be observed at the ventricle outer curvature, similar to the control condition (arrowheads). (B) Quantification and comparison of AV canal angles in SU5402-treated and DMSO Control embryos. AV canal angle measurement is exemplified in the upper left panel. (C) Heart explant procedure: as cardiac jogging is completed (26 hpf) heart tubes are explanted and put into culture for approximately 24 hpf during which chemical treatments can be carried out. At 48 hpf, the hearts are imaged. (D) Heart tubes explanted at 26 hpf and subsequently cultured in liquid medium for 24 hr display normal formation of a ventricle, atrium and atrioventricular canal. The lft2 reporter allows visualization of left-originating cells at the outer curvature of both ventricle and atrium, in control (DMSO) and treatment (SU5402) conditions. For (B) mean values ± SEM are shown. Legends: R: Right; L: Left; S: Superior side; I: Inferior side. Scale bars: 100 µm.
-
Figure 5—source data 1
Source files for data presented in panel B.
- https://cdn.elifesciences.org/articles/61733/elife-61733-fig5-data1-v1.xlsx
Figure 5—figure supplement 1
SU5402 treatment.
(A) Immunofluorescence with atrium-specific S46 antibody allows distinction of the cardiac chambers. (B) Quantification of ventricular and atrial cardiomyocytes in DMSO Control and SU5402-treated embryos at 2 dpf. Treatment between pf and 2dpf with SU5402 only affects ventricular cardiomyocyte number; three embryos per condition were quantified. Legends: D: DMSO Control; S: SU5402 Treatment.
Figure 6

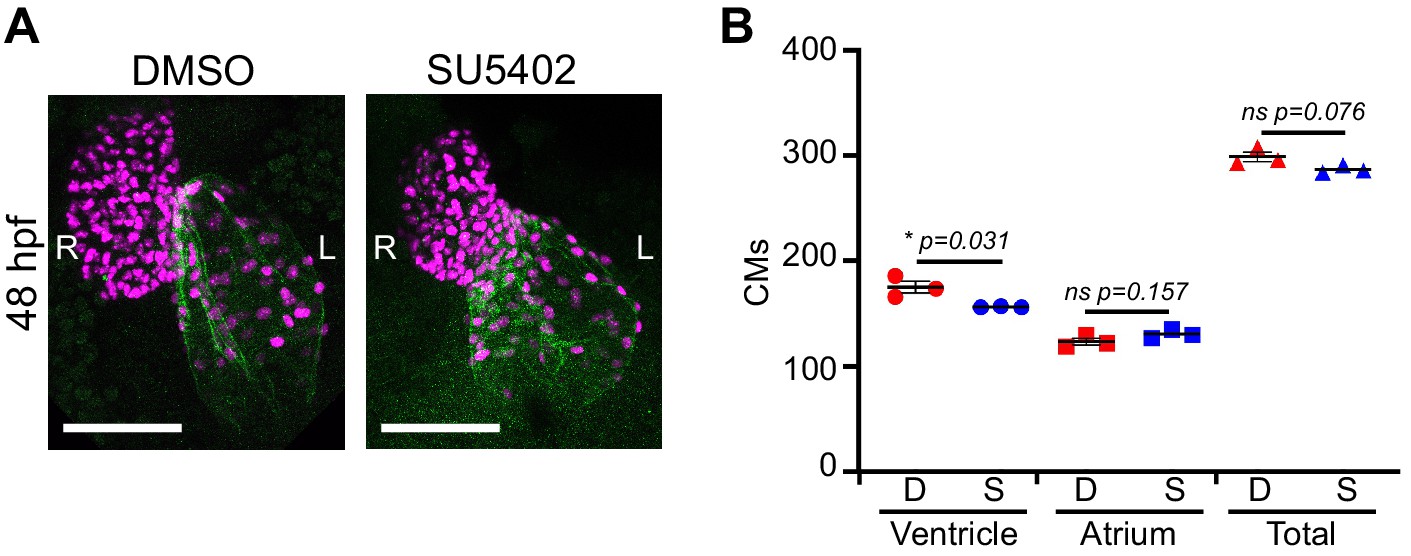
Defective looping in oug mutants is not due to reduced cardiomyocyte number or embryonic environment.
(A) Immunofluorescence with atrium-specific S46 antibody allows distinction of the cardiac chambers. (B) Quantification of ventricular and atrial cardiomyocytes in wt and oug mutant embryos at 2dpf. (C) Explanting oug mutant hearts and culturing them in vitro, ex-embryo does not rescue defective looping. (B): Horizontal bars: mean value ± SEM. Legends: R: Right; L: Left; S: Superior side; I: Inferior side . Scale bars: 100 µm.
-
Figure 6—source data 1
Source files for data presented in panel B.
- https://cdn.elifesciences.org/articles/61733/elife-61733-fig6-data1-v1.xlsx
Figure 7 with 15 supplements
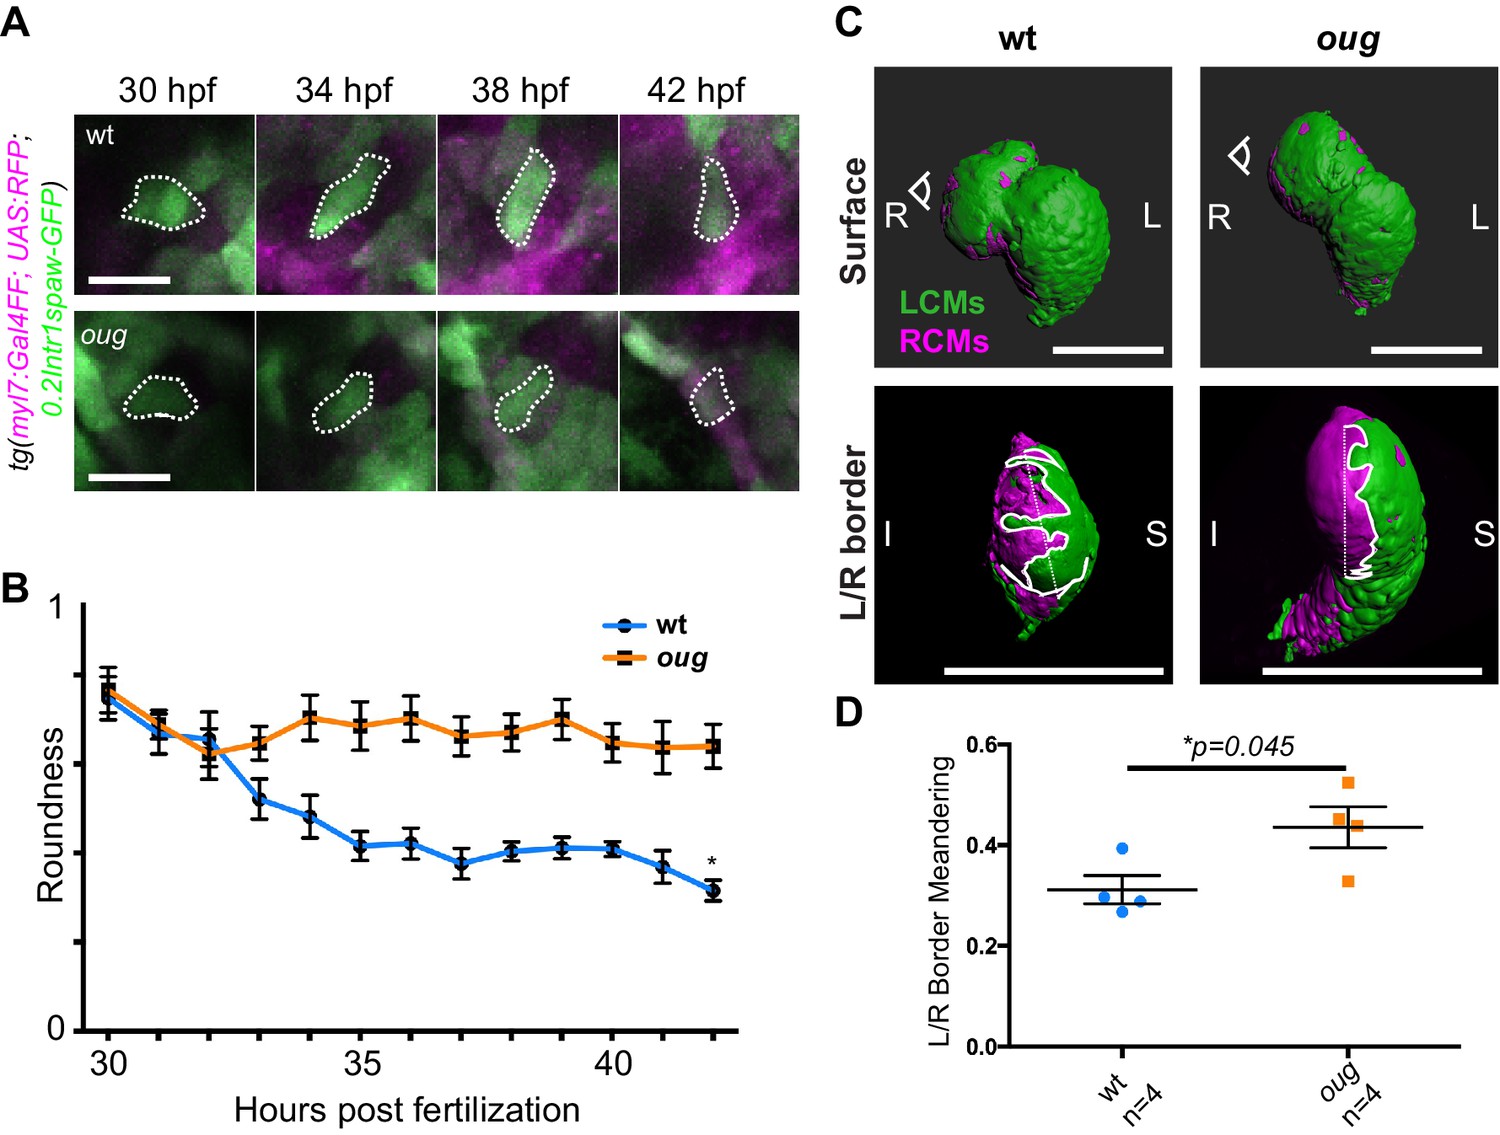
Anisotropic cell shape changes accompany cardiac looping.
(A) Outline of ventricular cardiomyocytes assessed for assessed for cell roundness. Representative images of the data quantified in (B) are shown for wt (upper row) and oug (lower row). (B) Quantification of cell roundness as observed in (A) and comparison between values for wt and oug mutants. (C) Upper panels: surface rendering of tg(myl7:Gal4FF; UAS:RFP; 0.2Intr1spaw-GFP) in 48 hpf hearts allows clear definition of a boundary between Left-originating cardiomyocytes (LCMs, green) and right-originating cardiomyocytes (RCMs, magenta). This allows calculation of the straightness index of the left/right boundary (white) of the ventricle (lower panels, respective viewpoint indicated in upper panels). The straightness index is calculated as the ratio between distance between start and end point of left/right boundary at (straight dotted line) and length of left/right boundary measured on the ventricular surface. (D) Quantification of the straightness index is indicative of the level of anisotropic growth in wt and oug mutant hearts. (B) and (D): Horizontal bars: mean value ± SEM. Legends: R: Right; L: Left; S; Superior side; I: Inferior side. Scale bars: (A) 20 µm; (C) 100 µm.
-
Figure 7—source data 1
Source files for data presented in panels B and D.
- https://cdn.elifesciences.org/articles/61733/elife-61733-fig7-data1-v1.xlsx
Figure 7—video 1
Timelapse of wt tg(myl7:Gal4FF; UAS:RFP; 0.2Intr1spaw-GFP) heart 1 used for cardiomyocyte roundness calculations (Figure 7A,B).
Figure 7—video 2
Timelapse of wt tg(myl7:Gal4FF; UAS:RFP; 0.2Intr1spaw-GFP) heart 2 used for cardiomyocyte roundness calculations (Figure 7A,B).
Figure 7—video 3
Timelapse of wt tg(myl7:Gal4FF; UAS:RFP; 0.2Intr1spaw-GFP) heart 3 used for cardiomyocyte roundness calculations (Figure 7A,B).
Figure 7—video 4
Timelapse of wt tg(myl7:Gal4FF; UAS:RFP; 0.2Intr1spaw-GFP) heart 4 used for cardiomyocyte roundness calculations (Figure 7A,B).
Figure 7—video 5
Timelapse of oug tg(myl7:Gal4FF; UAS:RFP; 0.2Intr1spaw-GFP) heart 1 used for cardiomyocyte roundness calculations (Figure 7A,B).
Figure 7—video 6
Timelapse of oug tg(myl7:Gal4FF; UAS:RFP; 0.2Intr1spaw-GFP) heart 2 used for cardiomyocyte roundness calculations (Figure 7A,B).
Figure 7—video 7
Timelapse of oug tg(myl7:Gal4FF; UAS:RFP; 0.2Intr1spaw-GFP) heart 3 used for cardiomyocyte roundness calculations (Figure 7A,B).
Figure 7—video 8
360° rotation animation of surface-rendered wt tg(myl7:Gal4FF; UAS:RFP; 0.2Intr1spaw-GFP) heart analyzed in Figure 7C,D.
Figure 7—video 9
360° rotation animation of surface-rendered wt tg(myl7:Gal4FF; UAS:RFP; 0.2Intr1spaw-GFP) heart analyzed in Figure 7C,D.
Figure 7—video 10
360° rotation animation of surface-rendered wt tg(myl7:Gal4FF; UAS:RFP; 0.2Intr1spaw-GFP) heart analyzed in Figure 7C,D.
Figure 7—video 11
360° rotation animation of surface-rendered wt tg(myl7:Gal4FF; UAS:RFP; 0.2Intr1spaw-GFP) heart analyzed in Figure 7C,D.
Figure 7—video 12
360° rotation animation of surface-rendered oug tg(myl7:Gal4FF; UAS:RFP; 0.2Intr1spaw-GFP) hearts analyzed in Figure 7C,D.
Figure 7—video 13
360° rotation animation of surface-rendered oug tg(myl7:Gal4FF; UAS:RFP; 0.2Intr1spaw-GFP) hearts analyzed in Figure 7C,D.
Figure 7—video 14
360° rotation animation of surface-rendered oug tg(myl7:Gal4FF; UAS:RFP; 0.2Intr1spaw-GFP) hearts analyzed in Figure 7C,D.
Figure 7—video 15
360° rotation animation of surface-rendered oug tg(myl7:Gal4FF; UAS:RFP; 0.2Intr1spaw-GFP) hearts analyzed in Figure 7C,D.
Figure 8 with 2 supplements
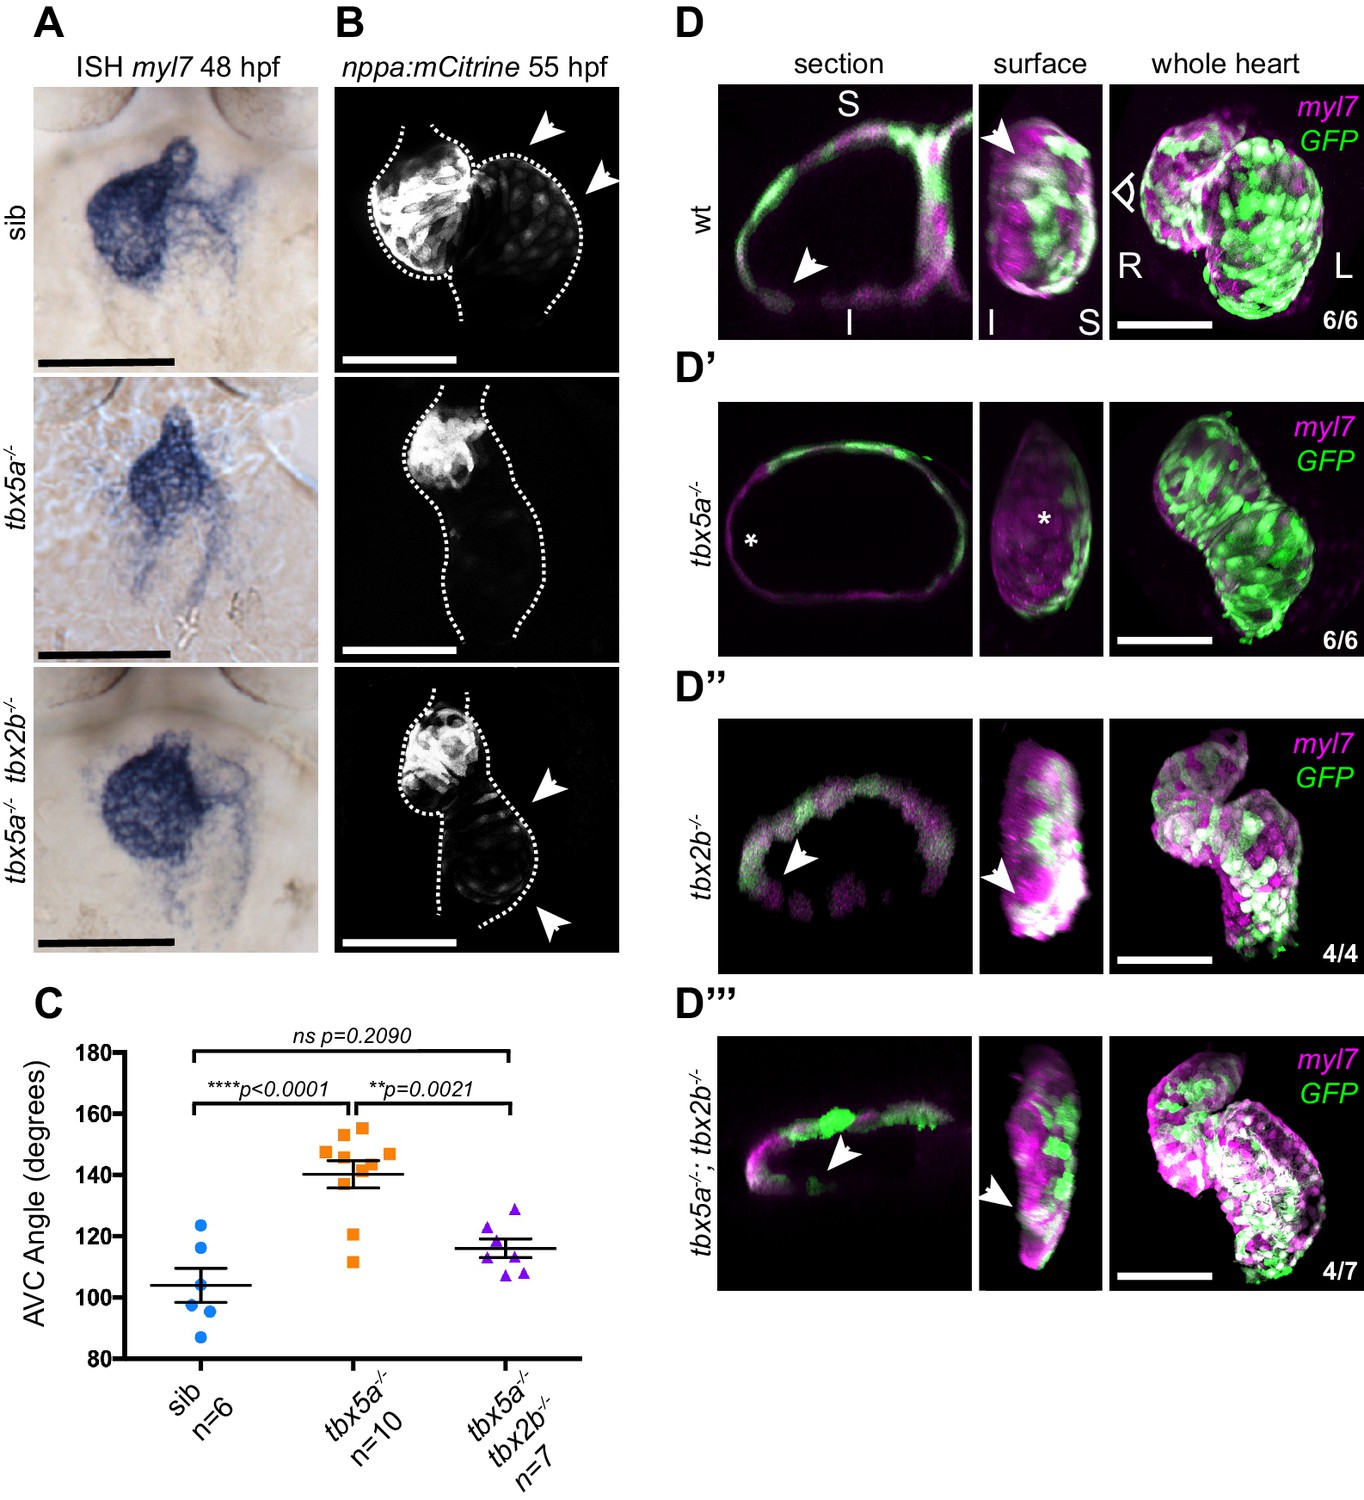
Defective cardiac looping in oug mutants is alleviated by simultaneous loss of tbx2b.
(A) ISH for myl7 at 50 hpf in wild type siblings, oug mutants and tbx5a;tbx2b double mutants. (B) Confocal maximum projections of 2dpf tg(nppa:mCitrine) hearts. In the tbx5a;tbx2b double mutants, atrial expression of nppa, which was lost in oug mutants, is re-instated. (C) Quantification and comparison of AV canal angles in wild-type siblings, tbx5a mutants and tbx5a;tbx2b double mutants. Quantification of AV canal angle is carried out as reported in Figure 5D. (D–D’’’) 48 hpf tg(myl7:Gal4FF; UAS:RFP; 0.2Intr1spaw-GFP) hearts. Wt (D) and tbx5-/- (D’) are shown for comparison. tbx2b-/- hearts (D’’) display robust dextral looping and left-originating cardiomyocytes (green) at the ventricle outer curvature, similar to wt (arrowheads in D; Figure 3B). In double homozygous mutants tbx5a-/-; tbx2b-/- (D’’’) rescue of cardiac looping is observed, accompanied by presence of left-originating cardiomyocytes at the ventricle OC (Compare with D, D’’). (C): Horizontal bars: mean value ± SEM. Legends: R: Right; L: Left; S: Superior side; I: Inferior side. Scale bars: 100 µm.
-
Figure 8—source data 1
Source files for data presented in panel C.
- https://cdn.elifesciences.org/articles/61733/elife-61733-fig8-data1-v1.xlsx
Figure 8—figure supplement 1
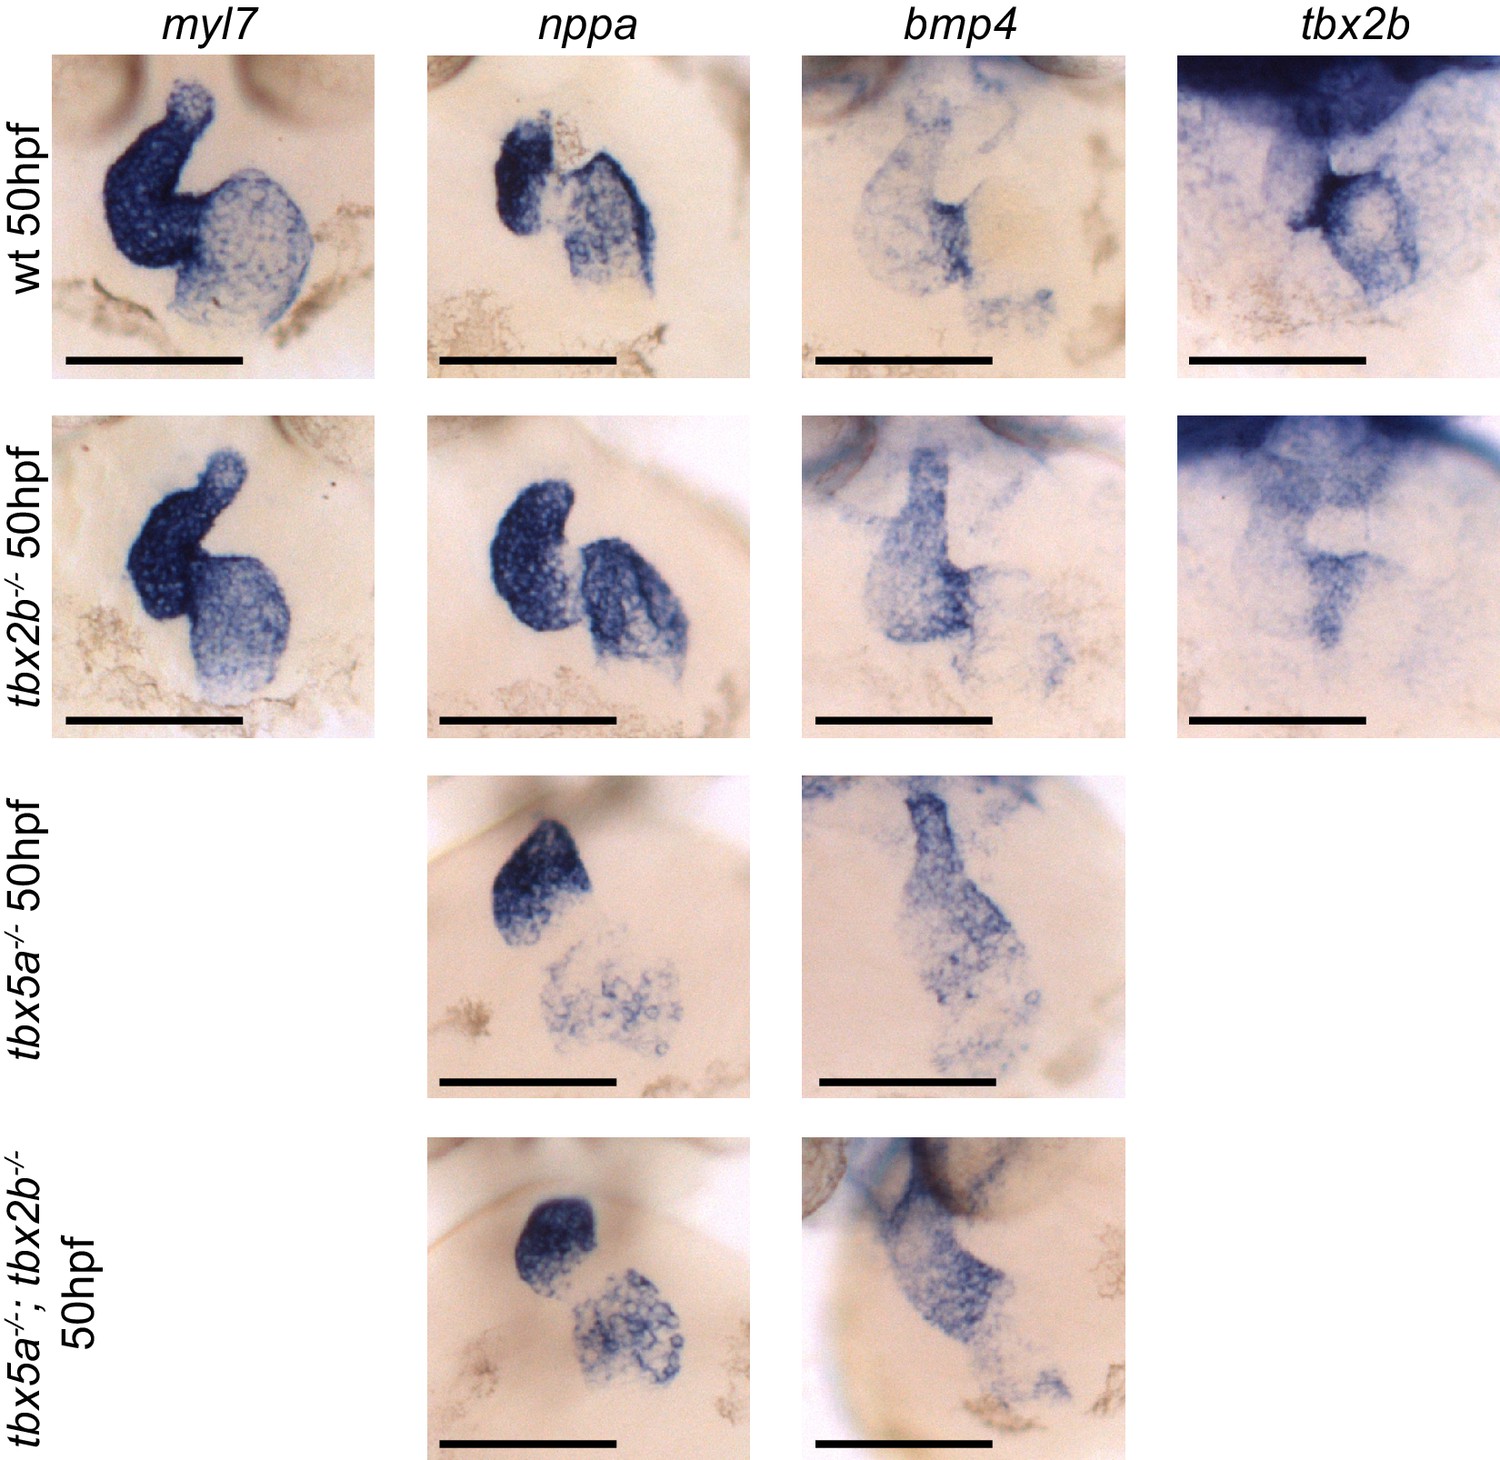
Analysis of cardiac markers in fby/tbx2b-/- and tbx5a-/-; tbx2b-/- embryos at 50 hpf.
ISH probes used are myl7 (all cardiomycytes), nppa (cardiac chambers), bmp4 (AV canal and IFT), and tbx2b (AV canal). Scale bar: 100 µm.
Figure 8—figure supplement 2
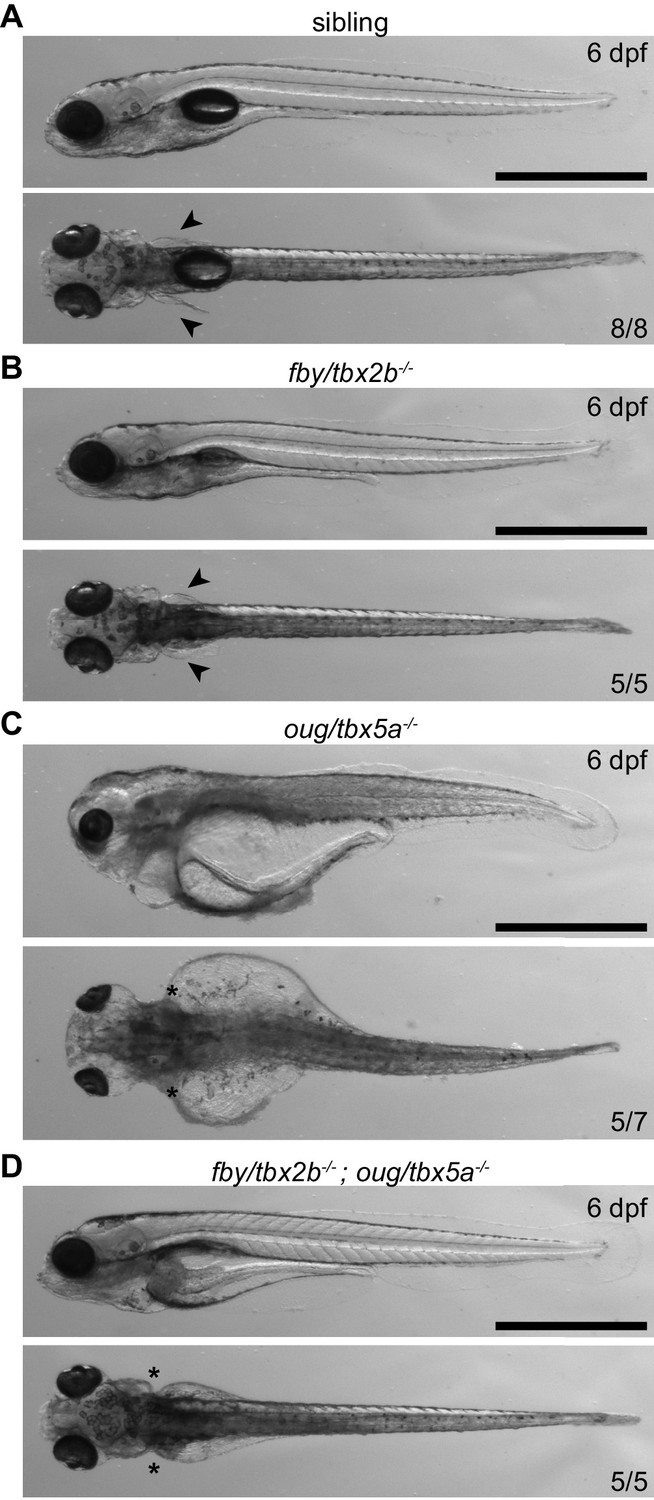
Phenotypical analysis of tbx5a-/-; tbx2b-/- larvae at 6 dpf.
Arrowheads indicate presence of pectoral fins in wt (sib) (A) and tbx2b-/- (B) larvae, asterisks indicate absence of pectoral fins in tbx5a-/- (C) and tbx5a-/-; tbx2b-/- (D) larvae. The severe general oedemic phenotype displayed by tbx5a-/- larvae is rescued in the tbx5a-/-; tbx2b-/- double mutant. Scale bar: 500 µm.
Figure 9
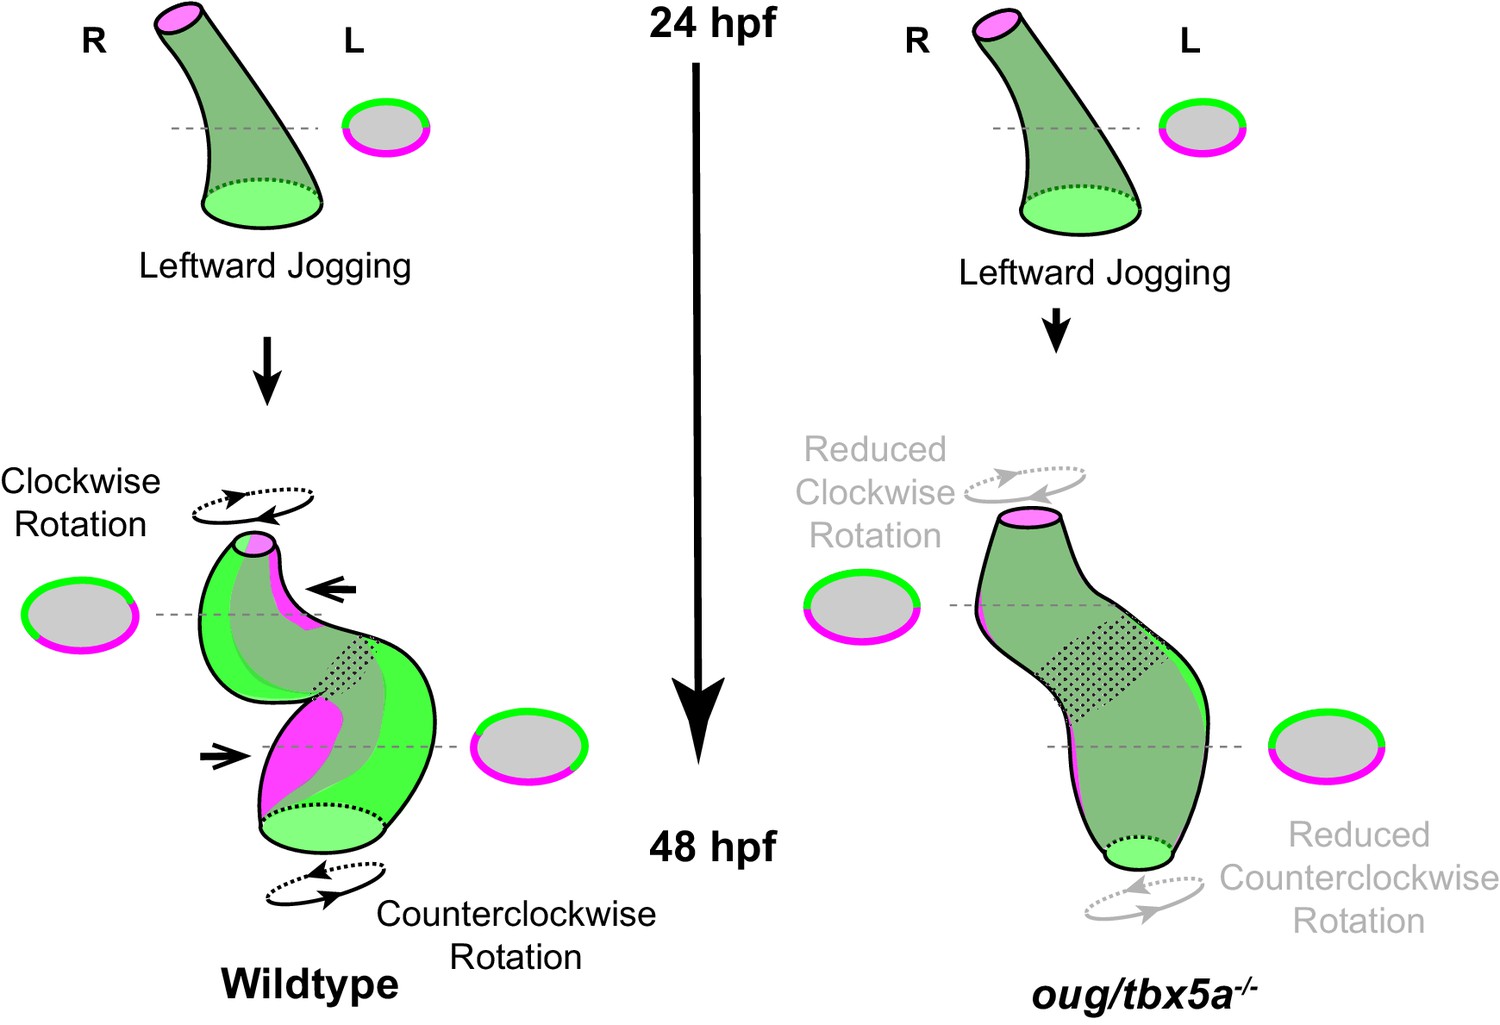
Model for cardiac looping morphogenesis.
Viewpoint for describing direction of rotation is always the outflow tract (OFT). Left- and right- originating regions of the embryonic myocardium are reported in green and magenta, respectively. Transversal sections are shown next to the corresponding cartoon. In wild-type hearts, at the end of cardiac jogging, twisting of the heart tube results in disposition of left-originating cardiomyocytes toward the outer curvatures of both the ventricle and atrium. The resulting twisting of the heart tube is driven by the clockwise rotation of the ventricle and counterclockwise rotation of the atrium, around a fixed hinge, the AV canal. In oug hearts, cardiac jogging is completed properly, but progression of cardiac looping is defective. Reduced twisting of the heart tube and chamber expansion are observed. Defective looping is accompanied by an expansion of the expression domain of tbx2b (spotted pattern), especially noticeable at the AV canal (see also Figure 1H). Legends: R: Right; L: Left.
Appendix 1—figure 1

Scheme of the types of motion described in the text.
(a) Scheme of the heart tube with a few cells manually marked for each category, the respective category centroid calculated from the marked cells’ average position, and the axes linking these centroids. The cells are drawn in different sizes to highlight their position at the front or back of the heart tube. The centroid is larger than the cells. (b) Example of translation. (c) Example of heart tube folding over the hinge-like AVC. (d) Example of cell rotation around the axis of the respective category.
Appendix 1—figure 2
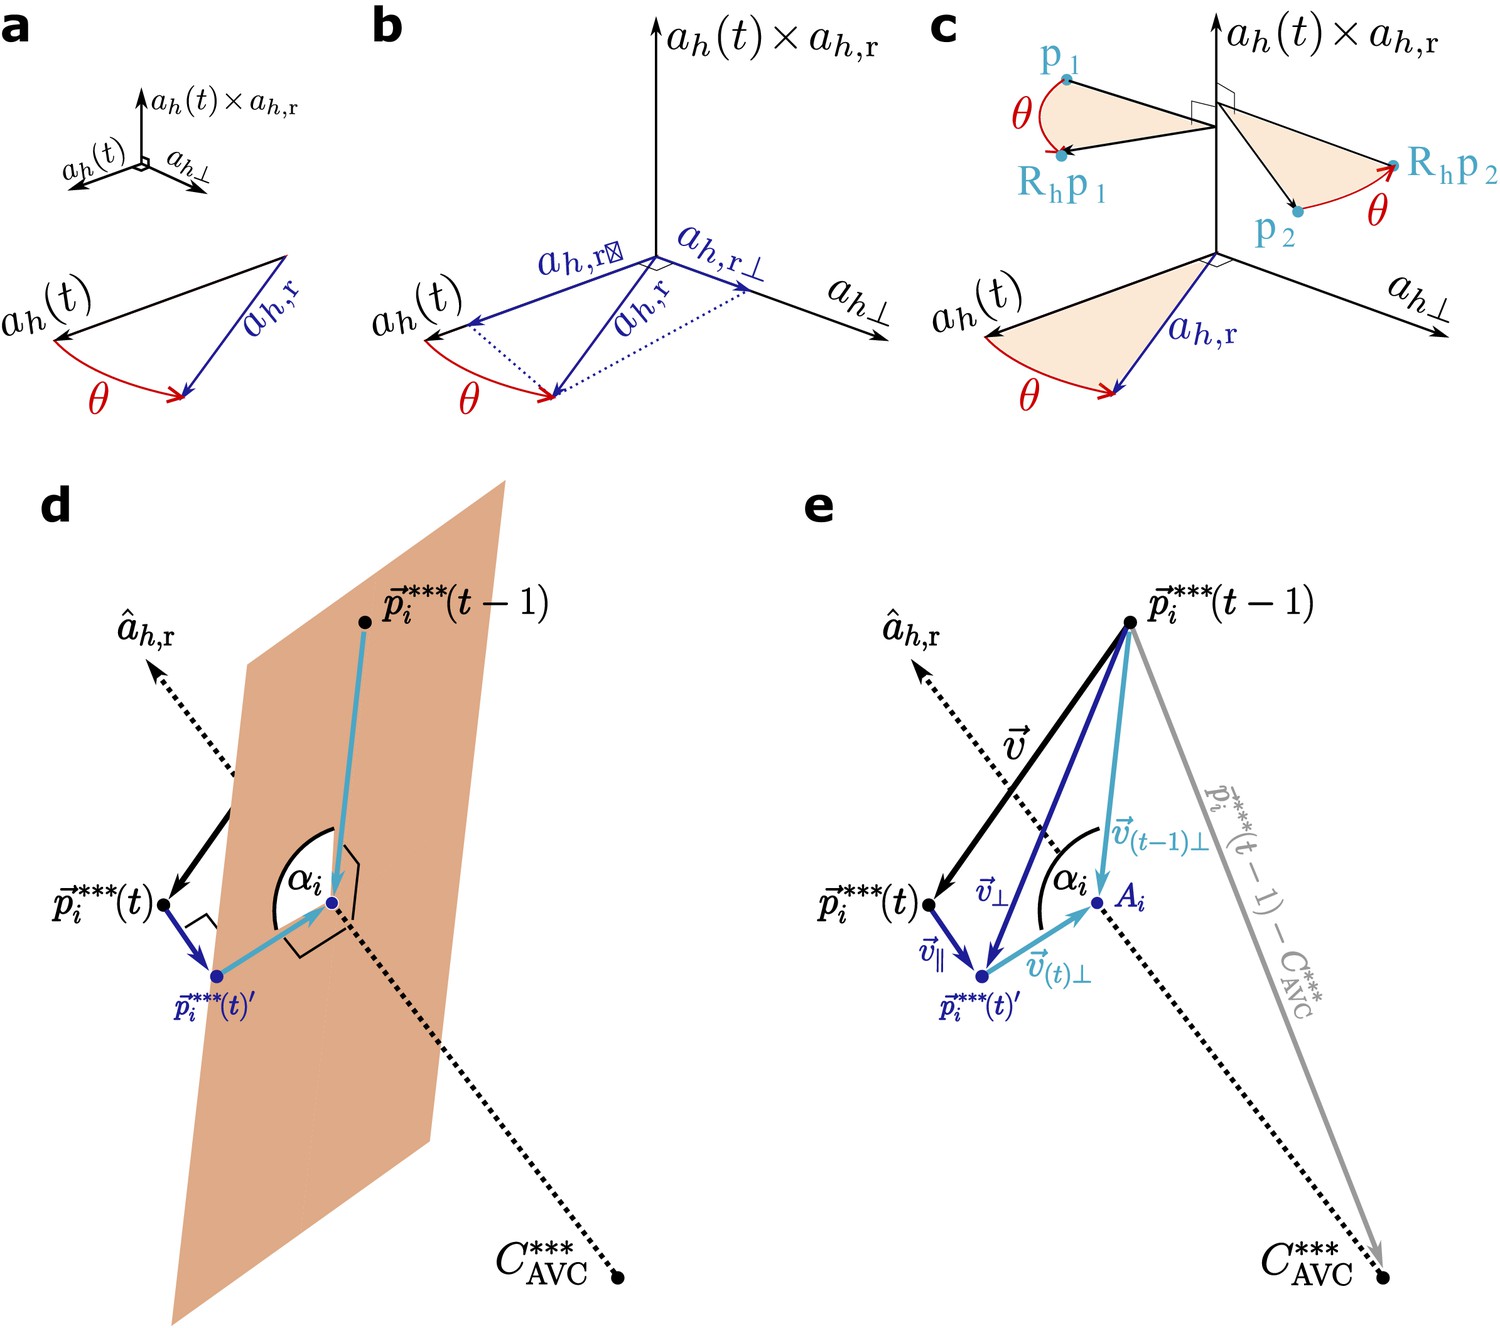
Scheme of the calculations.
(a–b) Scheme of step 2 in the text. The folding angle is the angle subtended by the axis and the reference axis . (c) Rotating the cells by the angle defined in (a–b). (d) Scheme of the plane perpendicular to the reference axis used to calculate cell rotation around the axis. (e) Calculation of the angle of rotation of the cells around the reference axis with symbols as used in the text. Note that this is not the same angle as in (a–c).
Author response image 1
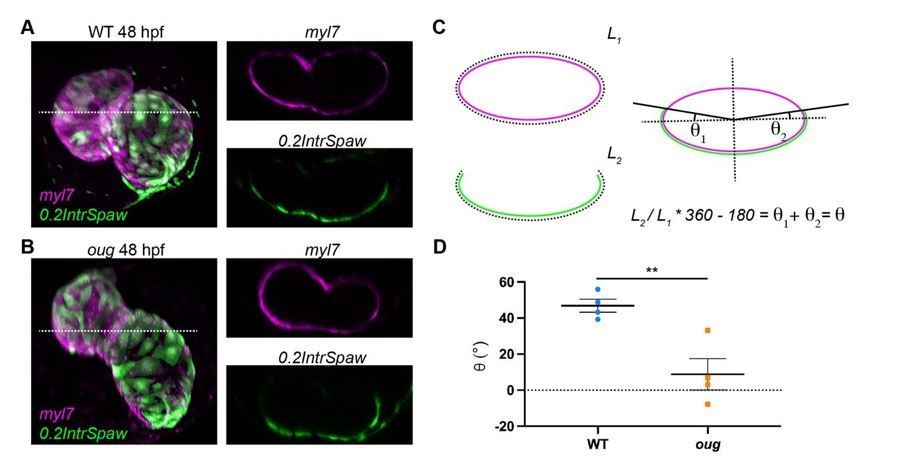
Measurement of the twisting angle.
Transversal sections of WT (A) and oug (B) are used to calculate the twisting angle θ as explained in (C). For clarity, transversal sections of the heart are assimilated to a perfect ellipsoid. Quantification and statistical comparison of the measured twisting angles for the two genotypes is presented in (D). Horizontal bars: Mean +/- SEM. Statistical test: Student’s t test; **: p=0.0068.
Tables
Key resources table
| Reagent type (species) or resource | Designation | Source or reference | Identifiers | Additional information |
|---|---|---|---|---|
| Gene (Danio rerio) | tbx5a | NA | ZDB-GENE-991124–7 | |
| Strain, strain background (Danio rerio) | Tübingen Long Fin (TL) | ZIRC | ZDB-GENO-990623–2 | |
| Genetic reagent (Danio rerio) | oug/tbx5a | This paper | More info on generation of this line can be found in the Materials and Methods section. | |
| Genetic reagent (Danio rerio) | hst/tbx5a | ZIRC | ZDB-ALT-030627–2 | |
| Genetic reagent (Danio rerio) | fby/tbx2b | ZIRC | ZDB-ALT-070117–1 | |
| Genetic reagent (Danio rerio) | tg(myl7:Gal4FF) | DOI: 10.1242/dev.113894 | ZDB-ALT-151008–1 | |
| Genetic reagent (Danio rerio) | tg(lft2BAC:Gal4FF) | DOI: 10.1093/cvr/cvab004 | Not available | |
| Genetic reagent (Danio rerio) | tg(UAS:RFP) | DOI: 10.1073/pnas.0704963105 | ZDB-ALT-080528–2 | |
| Genetic reagent (Danio rerio) | tg(UAS:H2A-GFP) | DOI: 10.1242/dev.113894 | ZDB-ALT-151008–2 | |
| Genetic reagent (Danio rerio) | tg(myl7:dsRed)s879Tg | DOI: 10.1101/gad.1629408 | ZDB-FISH-150901–3078 | |
| Genetic reagent (Danio rerio) | tg(mCitrine:nppa) | DOI: 10.7554/eLife.50163 | ZDB-ALT-201116–10 | |
| Cell line (Chlorocebus aethiops) | kidney fibroblast-like cell line (SV 40 transformed, Adult) | ATCC | Cat# CRL-1651; RRID:CVCL_0224 | |
| Transfected construct (Chlorocebus aethiops) | pGL3-Basic (plasmid) | Promega | Cat# E1751; Genbank: U47295 | |
| Transfected construct (Chlorocebus aethiops) | phRG-TK Renilla (plasmid) | Promega | Cat# E6291; Genbank: AF362551 | |
| Antibody | Living Colors anti-DsRed (Rabbit polyclonal) | Takara Bio | Cat# 101004; RRID:AB_10013483 | 1:200 |
| Antibody | Myosin heavy chain, slow developmental (Mouse monoclonal) | DSHB | Cat# s46, RRID:AB_528376 | 1:200 |
| Antibody | Anti-GFP (Chicken polyclonal) | Aves Labs | Cat# GFP-1010, RRID:AB_2307313 | 1:500 |
| Antibody | Anti-Digoxigenin-AP, Fab fragments (Sheep polyclonal) | Roche | Cat# 11093274910, RRID:AB_2734716 | 1:5000 |
| Antibody | Anti-Fluorescein-AP, Fab fragments (Sheep polyclonal) | Roche | Cat# 11426338910, RRID:AB_2734723 | 1:5000 |
| Recombinant DNA reagent | E1b-GFP-Tol2-Gateway | DOI: 10.1101/gr.133546.111 Obtained from Addgene | RRID:Addgene_37846 | |
| Sequence-based reagent | Start site morpholino: tnnt2a | DOI: 10.1038/ng875 | ZDB-MRPHLNO-060317–4 | 5' - CATGTTTGCTCTGATCTGACACGCA - 3' 2 ng / embryo |
| Commercial assay or kit | NBT/BCIP Stock solution | Sigma-Aldrich | Cat# 11681451001 | |
| Commercial assay or kit | INT/BCIP Stock solution | Sigma-Aldrich | Cat# 11681460001 | |
| Chemical compound, drug | SU5402 | Sigma-Aldrich | Cat# 572630; CAS 215543-92-3 | 10 µM |
| Chemical compound, drug | phenylthourea | Sigma-Aldrich | Cat# P7629; CAS103-85-5 | 0,003%(v/v) |
| Software, algorithm | Fiji | https://fiji.sc/ | RRID:SCR_002285 | |
| Software, algorithm | Volocity 3D Image Analysis Software | Perkin Elmer | RRID:SCR_002668 | |
| Software, algorithm | Graphpad Prism 9.0 | Graphpad | RRID:SCR_002798 | V9.0 |
| Software, algorithm | Imaris data visualization software | Bitplane | RRID:SCR_007370 | V9.3.1 |
| Software, algorithm | heartbending.py | Source or reference: custom software, available in public repository: https://github.com/rmerks/heartbending (copy archived at swh:1:rev:149f05441e06f875faa3f9ab21101619bce25e93; Tsingos, 2021) | commit 149f054 | Code for transforming cell track data and for statistical analysis of cell rotation around the heart segment axes. |
Additional files
Download links
A two-part list of links to download the article, or parts of the article, in various formats.
Downloads (link to download the article as PDF)
Open citations (links to open the citations from this article in various online reference manager services)
Cite this article (links to download the citations from this article in formats compatible with various reference manager tools)
Twisting of the zebrafish heart tube during cardiac looping is a tbx5-dependent and tissue-intrinsic process
eLife 10:e61733.
https://doi.org/10.7554/eLife.61733


