Enhancing mitochondrial activity in neurons protects against neurodegeneration in a mouse model of multiple sclerosis
- Institute of Neuroimmunology and Multiple Sclerosis (INIMS), University Medical Center Hamburg-Eppendorf, Germany
- Department of Pathology, Amsterdam UMC, MS Center Amsterdam, Amsterdam Neuroscience, Netherlands
- Department of Molecular Cell Biology and Immunology, Amsterdam UMC, MS Center Amsterdam, Amsterdam Neuroscience, Netherlands
- Fraunhofer ITMP ScreeningPort, Germany
- Institute of Pharmacology, Heidelberg University, Germany
Figures
Figure 1 with 1 supplement
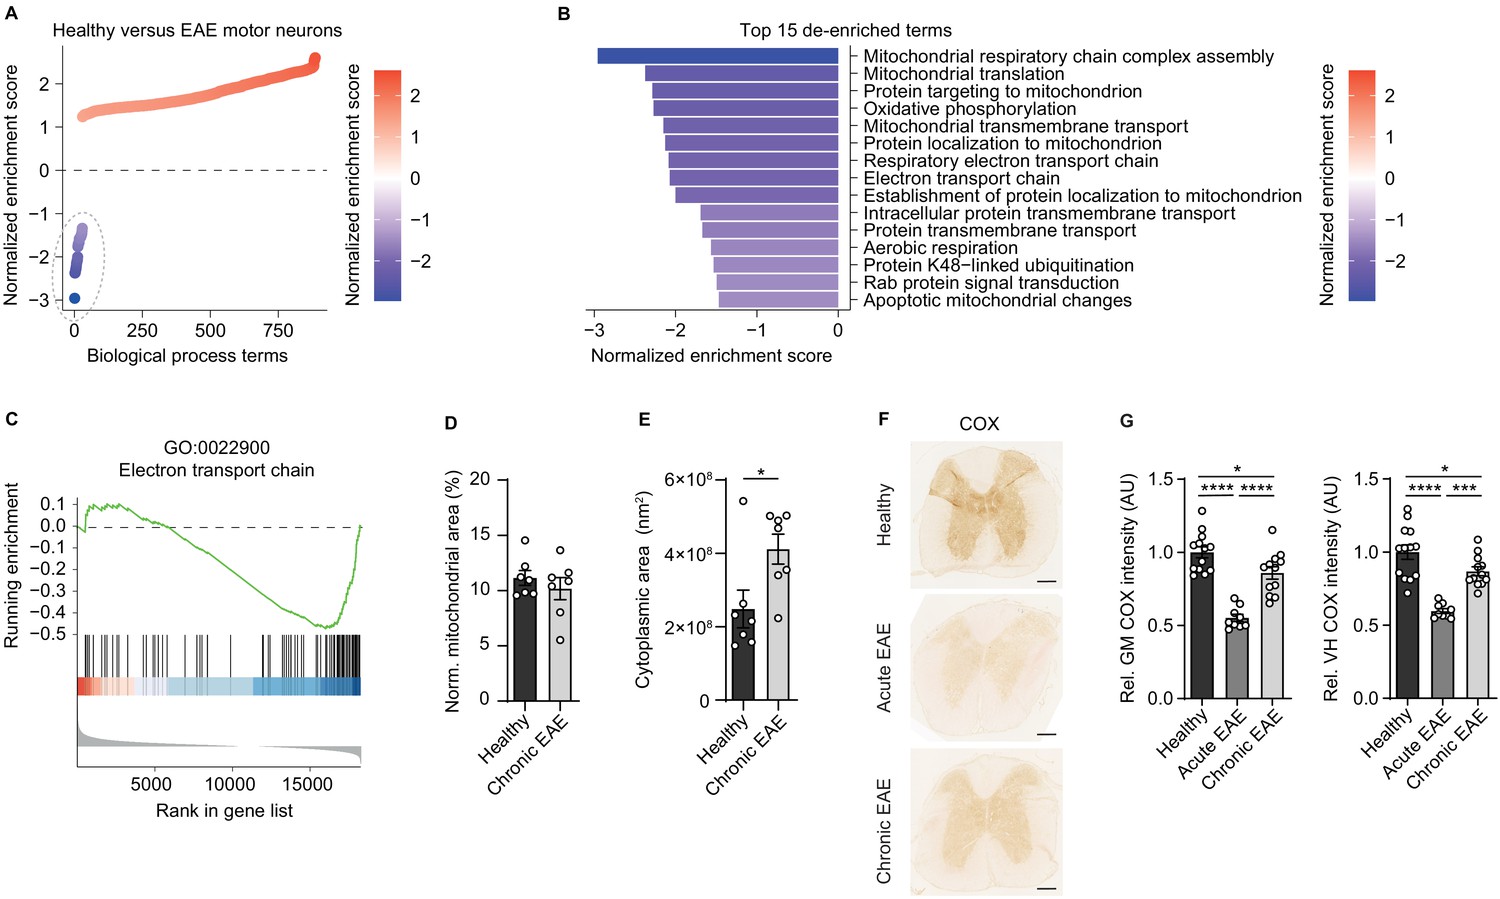
Reduced activity of oxidative phosphorylation in spinal cord neurons during experimental autoimmune encephalomyelitis (EAE).
(A) Gene set enrichment analysis (GSEA) of biological process gene ontology (GO) terms in motor neurons during central nervous system inflammation in the EAE model. Dashed line indicates 29 de-enriched terms. (B) Top 15 de-enriched GO terms with normalized enrichment score. (C) GSEA plot of the de-enriched term ‘GO:0022900 electron transport chain’. (D) Transmission electron microscopy (TEM) analysis of motor neuronal mitochondrial content normalized to size of healthy (n = 3) and chronic EAE (n = 3) mice (2–3 cells per mice). Bars show mean values ± s.e.m. (E) TEM analysis of motor neuronal size of healthy (n = 3) and chronic EAE (n = 3) mice (2–3 cells per mice). Bars show mean values ± s.e.m. (F) Representative images of cytochrome c oxidase (COX) histochemistry of cervical spinal cord sections of healthy, acute, and chronic EAE mice. Scale bar: 250 µm. (G) Quantification of COX histochemistry of cervical spinal cord gray matter (GM) and ventral horn (VH) of healthy (n = 5), acute (n = 3), and chronic (n = 5) EAE mice (2–3 stainings per mice) normalized to HuC/HuD-positive neurons. Bars show mean values ± s.e.m. Statistical analysis in D and E was performed by unpaired, two-tailed Student’s t-test, and in G by one-way ANOVA following Tukey’s post-hoc test for multiple comparisons. *p<0.05, ****p<0.0001.
Figure 1—figure supplement 1
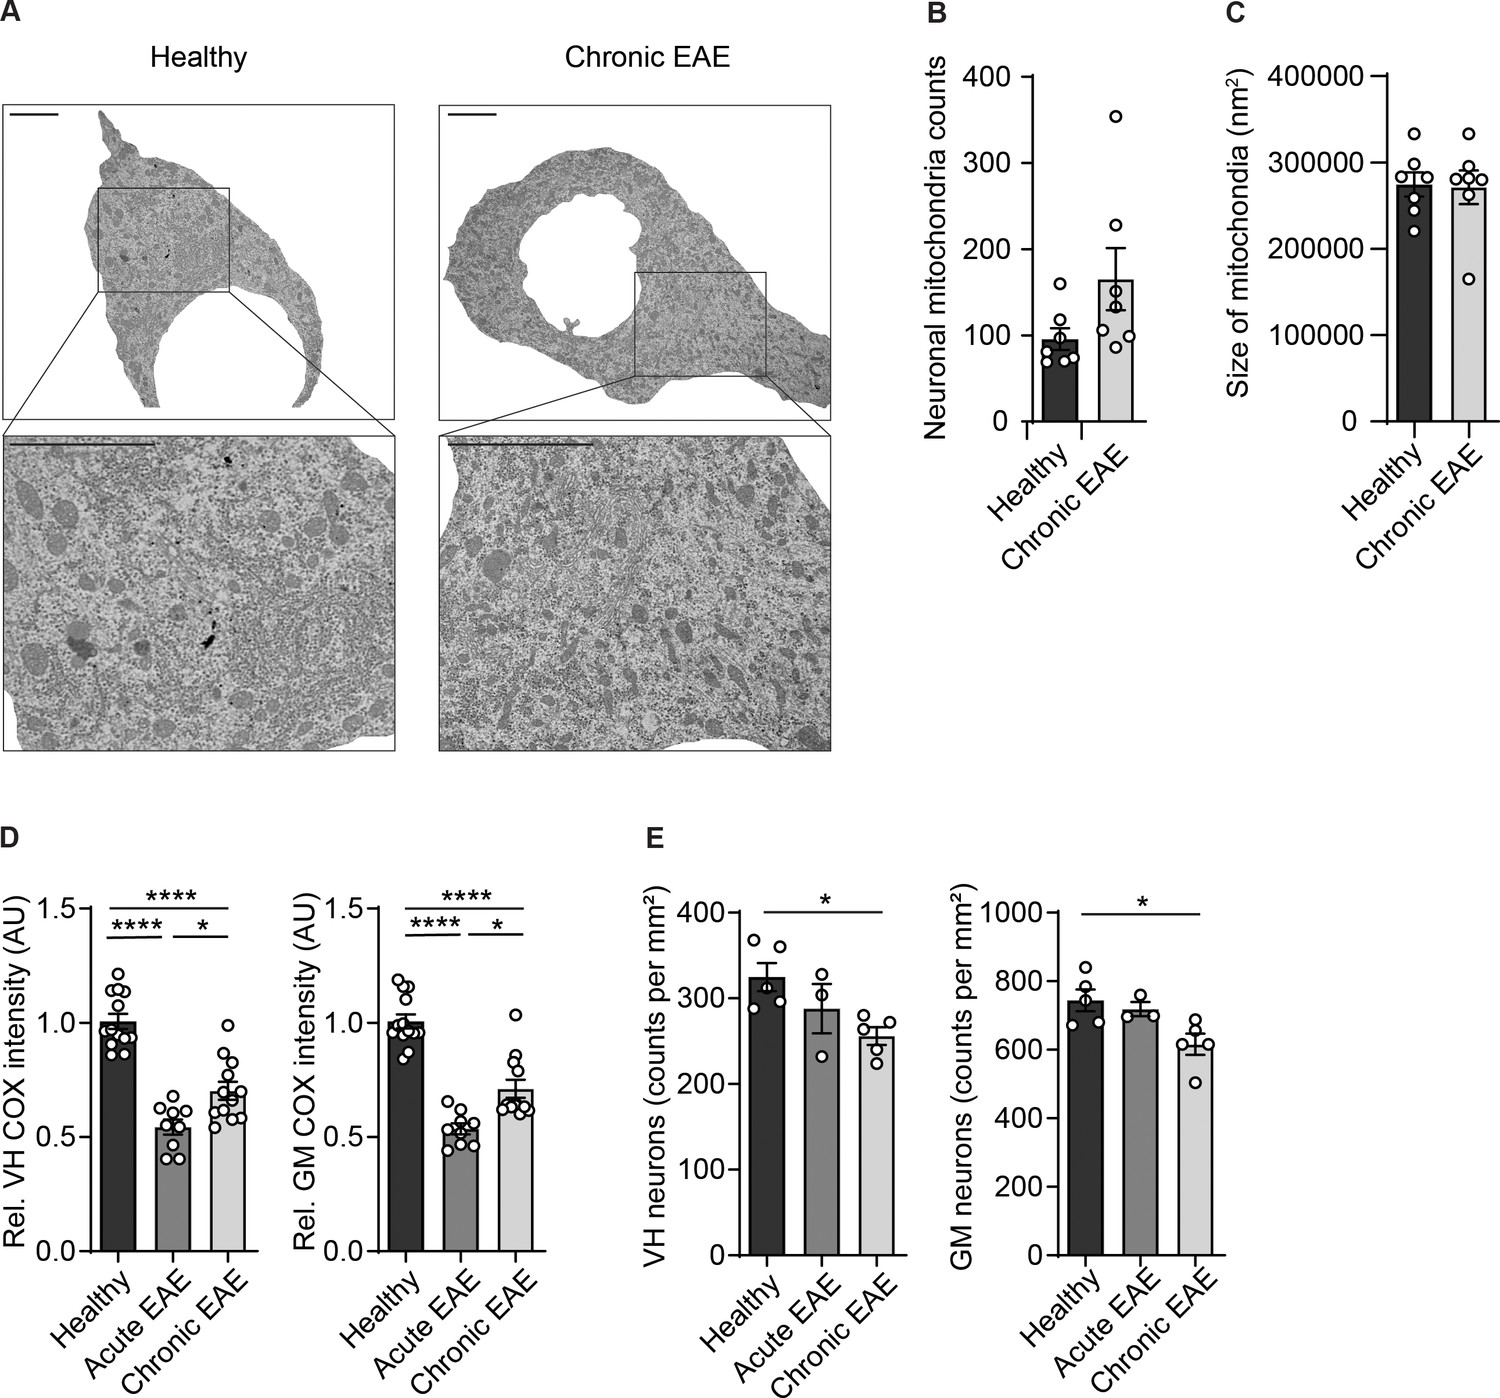
Reduced numbers of neurons and complex IV activity in spinal cord neurons during experimental autoimmune encephalomyelitis (EAE).
(A) Representative transmission electron microscopy (TEM) images and corresponding magnifications of cervical spinal cord motor neurons of healthy and chronic experimental autoimmune encephalomyelitis (EAE) mice. Scale bar 5 µm. (B) Quantification of TEM analysis of motor neuronal mitochondrial numbers of healthy (n = 3) and chronic EAE (n = 3) mice (2–3 cells per mice). Bars show mean values ± s.e.m. (C) Quantification of TEM analysis of motor neuronal mitochondrial size of healthy (n = 3) and chronic EAE (n = 3) mice (2–3 cells per mice). Bars show mean values ± s.e.m. (D) Quantification of cytochrome c oxidase (COX) histochemistry of cervical spinal cord gray matter (GM) and ventral horn (VH) of healthy (n = 5), acute (n = 3), and chronic (n = 5) EAE mice (2–3 stainings per mice). Bars show mean values ± s.e.m. (E) Analysis of immunohistochemical stainings of HuC/HuD-positive neurons in cervical spinal cord GM or VH of healthy (n = 5), acute (n = 3), and chronic (n = 5) EAE mice. Bars show mean values ± s.e.m. Statistical analysis in B and C was performed by unpaired, two-tailed Student’s t-test, and in D and E by one-way ANOVA following Tukey’s post-hoc test for multiple comparisons. *p<0.05, ****p<0.0001.
Figure 2 with 1 supplement

Inactivation of proliferator-activated receptor gamma coactivator 1-alpha (PGC-1α) in spinal cord neurons during experimental autoimmune encephalomyelitis (EAE).
(A) Heatmap of genes driving the de-enrichment of ‘GO:0022900 electron transport chain’. Heatmap is annotated for electron transport chain complexes and target genes induced by the transcription factor Ppargc1a (Lucas et al., 2014). (B) Normalized RNA-seq expression of Ppargc1a in healthy (n = 5) and acute EAE (n = 5) motor neurons. Bars show mean values ± s.e.m. (C) Relative qPCR mRNA expression of Ppargc1a to Tbp in healthy (n = 3) and acute EAE (n = 3) motor neurons. Bars show mean values ± s.e.m. (D) Quantification of PGC-1α protein in cervical spinal cords of healthy (n = 5) and acute (n = 5) EAE mice. Each sample was normalized to its β-actin. Bars show mean values ± s.e.m. (E) Representative immunoblots of PGC-1α, phosphorylated PGC-1αS570 (pPGC-1α), and corresponding β-actin of cervical spinal cords of healthy and acute EAE mice. (F) Quantification of phosphorylated PGC-1αS570 (pPGC-1α) in relation to PGC-1α total protein in cervical spinal cords of healthy (n = 5) and acute (n = 5) EAE mice. Each sample was normalized to its β-actin. Bars show mean values ± s.e.m. Statistical analysis in B and C was performed by unpaired, two-tailed Student’s t-test, and in D and F by unpaired, two-tailed Mann–Whitney test; *p<0.05.
Figure 2—figure supplement 1
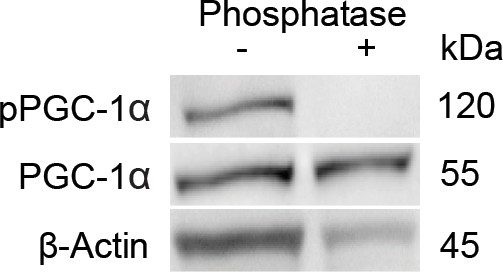
Representative immunoblots of phosphorylated PGC-1αS570 (proliferator-activated receptor gamma coactivator 1-alpha [pPGC-1α]) of cervical spinal cords of healthy wild-type mice with and without prior treatment of lambda protein phosphatase for validation of the pPGC-1αS570 antibody.
Figure 3 with 1 supplement
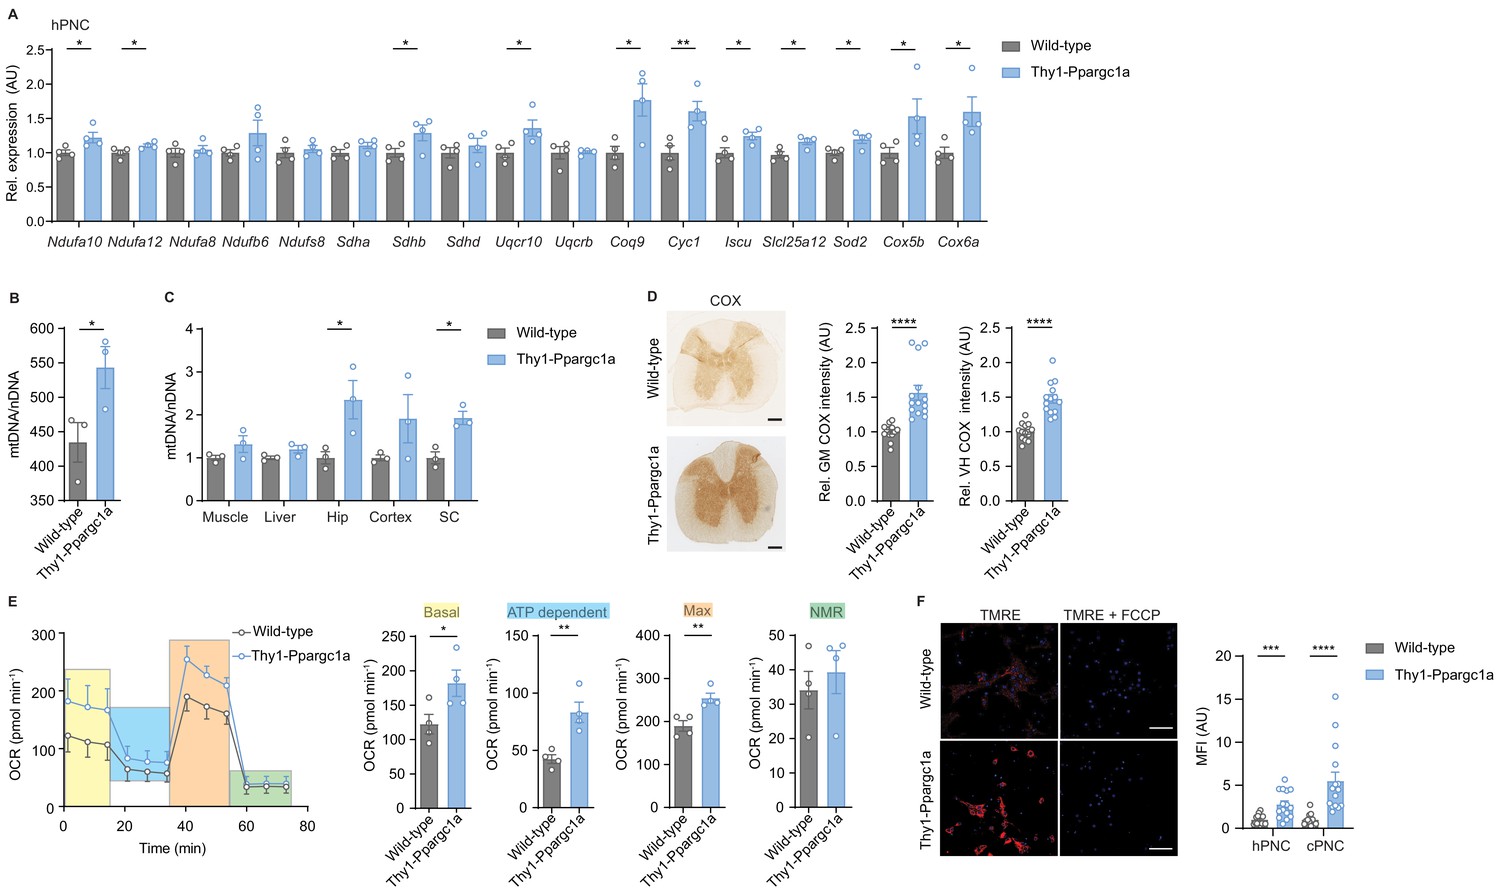
Neuronal overexpression of Ppargc1a increases neuronal mitochondrial activity.
(A) Relative qPCR mRNA expression in hippocampal primary neuronal cultures (hPNC) (DIV14) of wild-type (n = 4) and Thy1-Ppargc1a (n = 4) mice of Ppargc1a-regulated electron transport chain genes that were detected to be downregulated during experimental autoimmune encephalomyelitis. Bars show mean values ± s.e.m. (B) Mitochondrial DNA copy numbers (mtDNA) relative to diploid nuclear chromosomal DNA (nDNA) in hPNC (DIV14) of wild-type (n = 3) and Thy1-Ppargc1a (n = 3) mice. Bars show mean values ± s.e.m. (C) mtDNA relative to nDNA in muscle, liver, hippocampus (Hip), cortex, and cervical spinal cord (SC) of wild-type (n = 3) and Thy1-Ppargc1a (n = 3) mice. Bars show mean values ± s.e.m. (D) Representative images and quantification of cytochrome c oxidase (COX) histochemistry of cervical spinal cord gray matter (GM) or ventral horn (VH) of wild-type (n = 5) and Thy1-Ppargc1a (n = 6) mice (2–3 stainings per mice) normalized to neuronal nuclei (NeuN)-positive neurons. Bars show mean values ± s.e.m. Scale bar 250 µm. (E) Profile and quantification of oxygen consumption rate in hPNC (DIV14) of wild-type (n = 4) and Thy1-Ppargc1a (n = 4) mice. Yellow: basal respiration (Basal); blue: ATP-dependent respiration (ATP dependent); orange: maximal respiratory capacity (Max); green: non-mitochondrial respiration (NMR). Bars show mean values ± s.e.m. (F) Representative images of hPNC and mean fluorescence intensity quantification of tetramethylrhodamin-ethylester mitochondrial membrane potential assay of hPNC (DIV14) and cortical primary neuronal culture of wild-type (n = 3) and Thy1-Ppargc1a (n = 3) mice (five cells per culture). FCCP(carbonyl cyanide 4-(trifluoromethoxy) phenylhydrazone) was used as ionophore uncoupler of oxidative phosphorylation. Bars show mean values ± s.e.m. Scale bar: 10 µm. Statistical analysis in A was performed by unpaired, one-tailed Student’s t-test, and in B–E by unpaired, two-tailed Student’s t-test. *p<0.05, **p<0.01, ***p<0.001, ****p<0.0001.
-
Figure 3—source data 1
Analysis of oxygen consumption rate in primary neurons of Thy1-Ppargc1a mice.
- https://cdn.elifesciences.org/articles/61798/elife-61798-fig3-data1-v3.docx
Figure 3—figure supplement 1
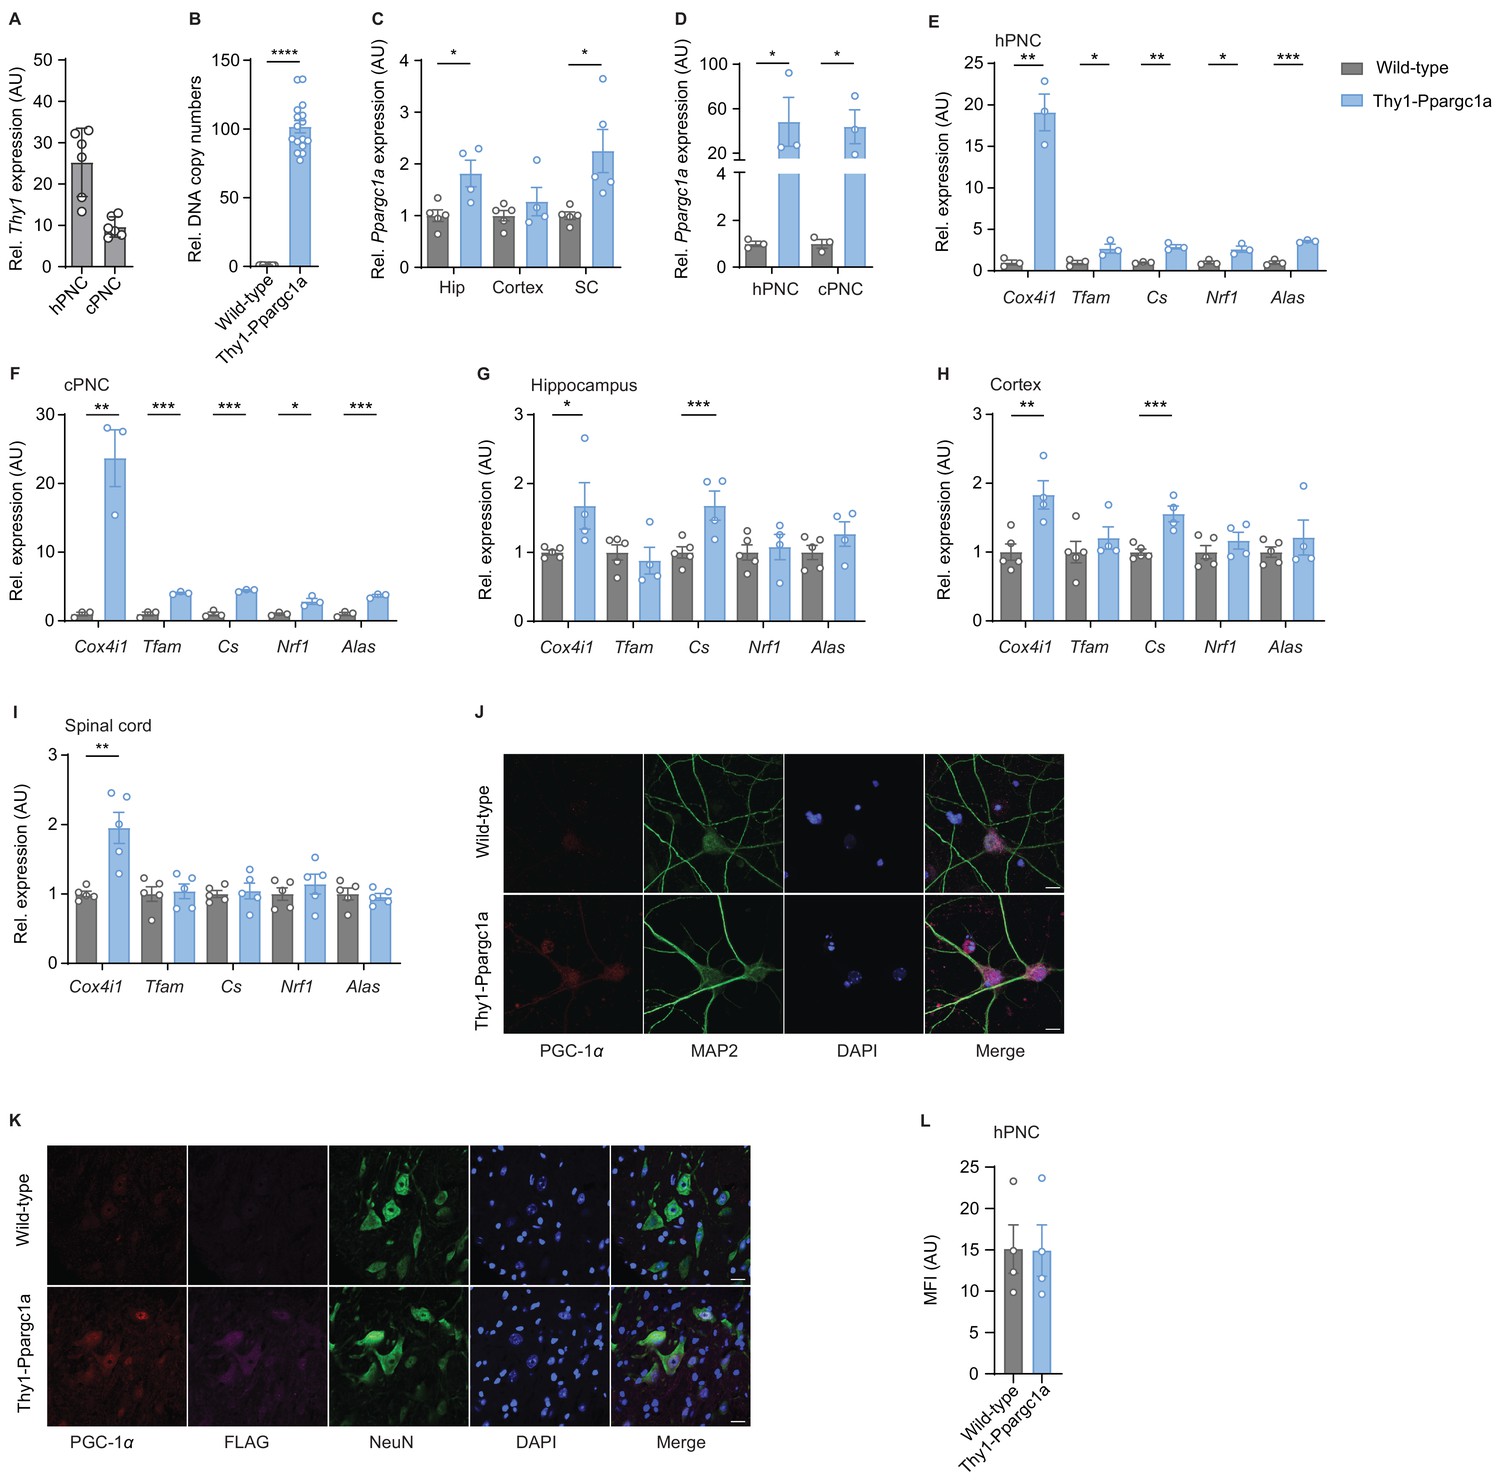
Neuronal Ppargc1a and Ppargc1a-dependent target genes are increased in Thy1-Ppargc1a mice.
(A) Relative qPCR mRNA expression of Thy-1 to Tbp in hippocampal primary neuronal culture (hPNC) and cortical primary neuronal cultures (cPNC) (DIV14) of wild-type (n = 6 per group) mice. Bars show mean values ± s.e.m. (B) Relative diploid nuclear chromosomal DNA copy numbers of Ppargc1a in tail biopsy of wild-type (n = 9) and Thy1-Ppargc1a (n = 16) mice. Bars show mean values ± s.e.m. (C) Relative qPCR mRNA expression of Ppargc1a in hippocampus (Hip), cortex, and cervical spinal cord (SC) of wild-type (n = 5) and Thy1-Ppargc1a (n = 4) mice. Bars show mean values ± s.e.m. (D) Relative qPCR mRNA expression of Ppargc1a in hPNC and cPNC (DIV14) of wild-type (n = 3) and Thy1-Ppargc1a (n = 3) mice. Bars show mean values ± s.e.m. (E) Relative qPCR mRNA expression of Ppargc1a target genes in hPNC (DIV14) of wild-type (n = 3) and Thy1-Ppargc1a (n = 3) mice. Bars show mean values ± s.e.m. (F) Relative qPCR mRNA expression of Ppargc1a target genes in cPNC (DIV14) of wild-type (n = 3) and Thy1-Ppargc1a (n = 3) mice. Bars show mean values ± s.e.m. (G) Relative qPCR mRNA expression of Ppargc1a target genes in hippocampus of wild-type (n = 5) and Thy1-Ppargc1a (n = 4) mice. Bars show mean values ± s.e.m. (H) Relative qPCR mRNA expression of Ppargc1a target genes in cortex of wild-type (n = 5) and Thy1-Ppargc1a (n = 4) mice. Bars show mean values ± s.e.m. (I) Relative qPCR mRNA expression of Ppargc1a target genes in cervical spinal cord of wild-type (n = 5) and Thy1-Ppargc1a (n = 5) mice. Bars show mean values ± s.e.m. (J) Representative immunocytochemical staining of proliferator-activated receptor gamma coactivator 1-alpha (PGC-1α) in cPNC (DIV14) of wild-type and Thy1-Ppargc1a mice. Co-stainings for microtubule-associated protein 2 (Map2) and 4′,6-diamidino-2-phenylindole (DAPI). Scale bar 10 µm. (K) Representative immunohistochemical staining of PGC-1α in spinal cord of wild-type and Thy1-Ppargc1a mice. Co-stainings for neuronal nuclei (NeuN), FLAG, and DAPI. Scale bar 20 µm. (L) Mean fluorescence intensity (MFI) quantification of calcein of hPNC (DIV14) of wild-type (n = 1) and Thy1-Ppargc1a (n = 1) mice (three wells per culture) to determine cell viability. Bars show mean values ± s.e.m. Statistical analysis in C and D was performed by unpaired, one-tailed Student’s t-test, and in B, E–I, and L by unpaired, two-tailed Student’s t-test. *p<0.05, **p<0.01, ***p<0.001, ****p<0.0001.
Figure 4
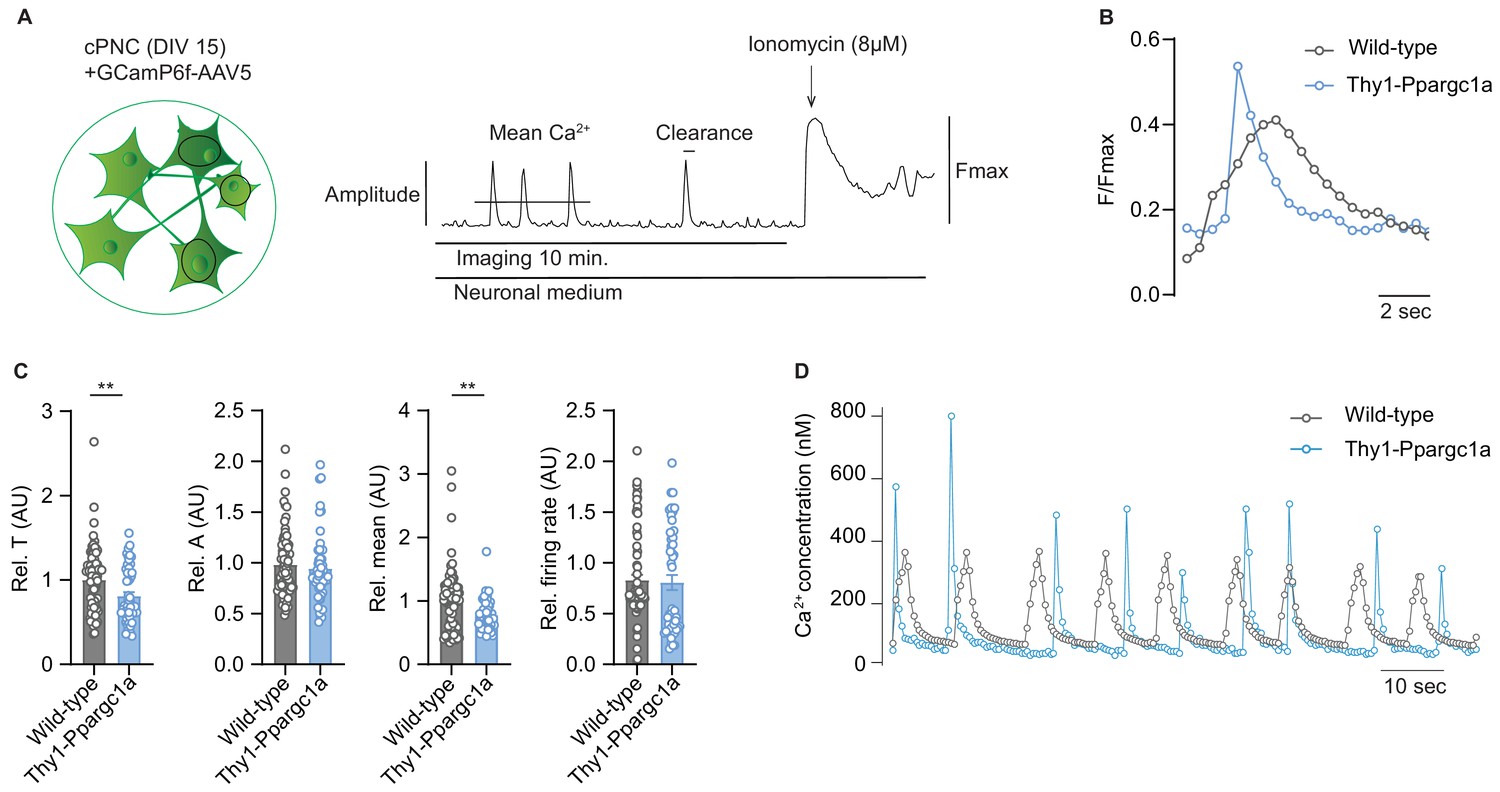
Neuronal overexpression of Ppargc1a improves neuronal calcium buffering.
(A) Experimental approach for analysis of Ca2+ signaling. GCamp6f fluorescence was recorded for 10 minutes in spontaneously active cortical primary neuronal culture (cPNC) (DIV15) prior to ionomycin application used for signal normalization. (B) Representative cytosolic calcium transients of GCaMP6f-transduced spontaneously active cPNC (DIV15) of wild-type and Thy1-Ppargc1a mice normalized to fluorescence of cytosolic calcium-saturated conditions (Fmax). (C) Quantification of calcium transient decay constant Tau (T) as an indicator of cytosolic calcium clearance time, calcium transient amplitude (A), mean cytosolic calcium signal intensity and of the number of cytosolic calcium transients presented as firing rate of GCaMP6f-transduced cPNC (DIV15) of wild-type (n = 74 cells from three different mice) and Thy1-Ppargc1a (n = 51 cells from three different mice). 478s of the recorded trace were analysed. Bars show mean values ± s.e.m. (D) Representative cytosolic calcium trace of Fluo-4-stained cPNC (DIV14–16) of wild-type and Thy1-Ppargc1a mice. Statistical analysis in C was performed by unpaired, two-tailed Student’s t-test. **p<0.01.
Figure 5 with 1 supplement
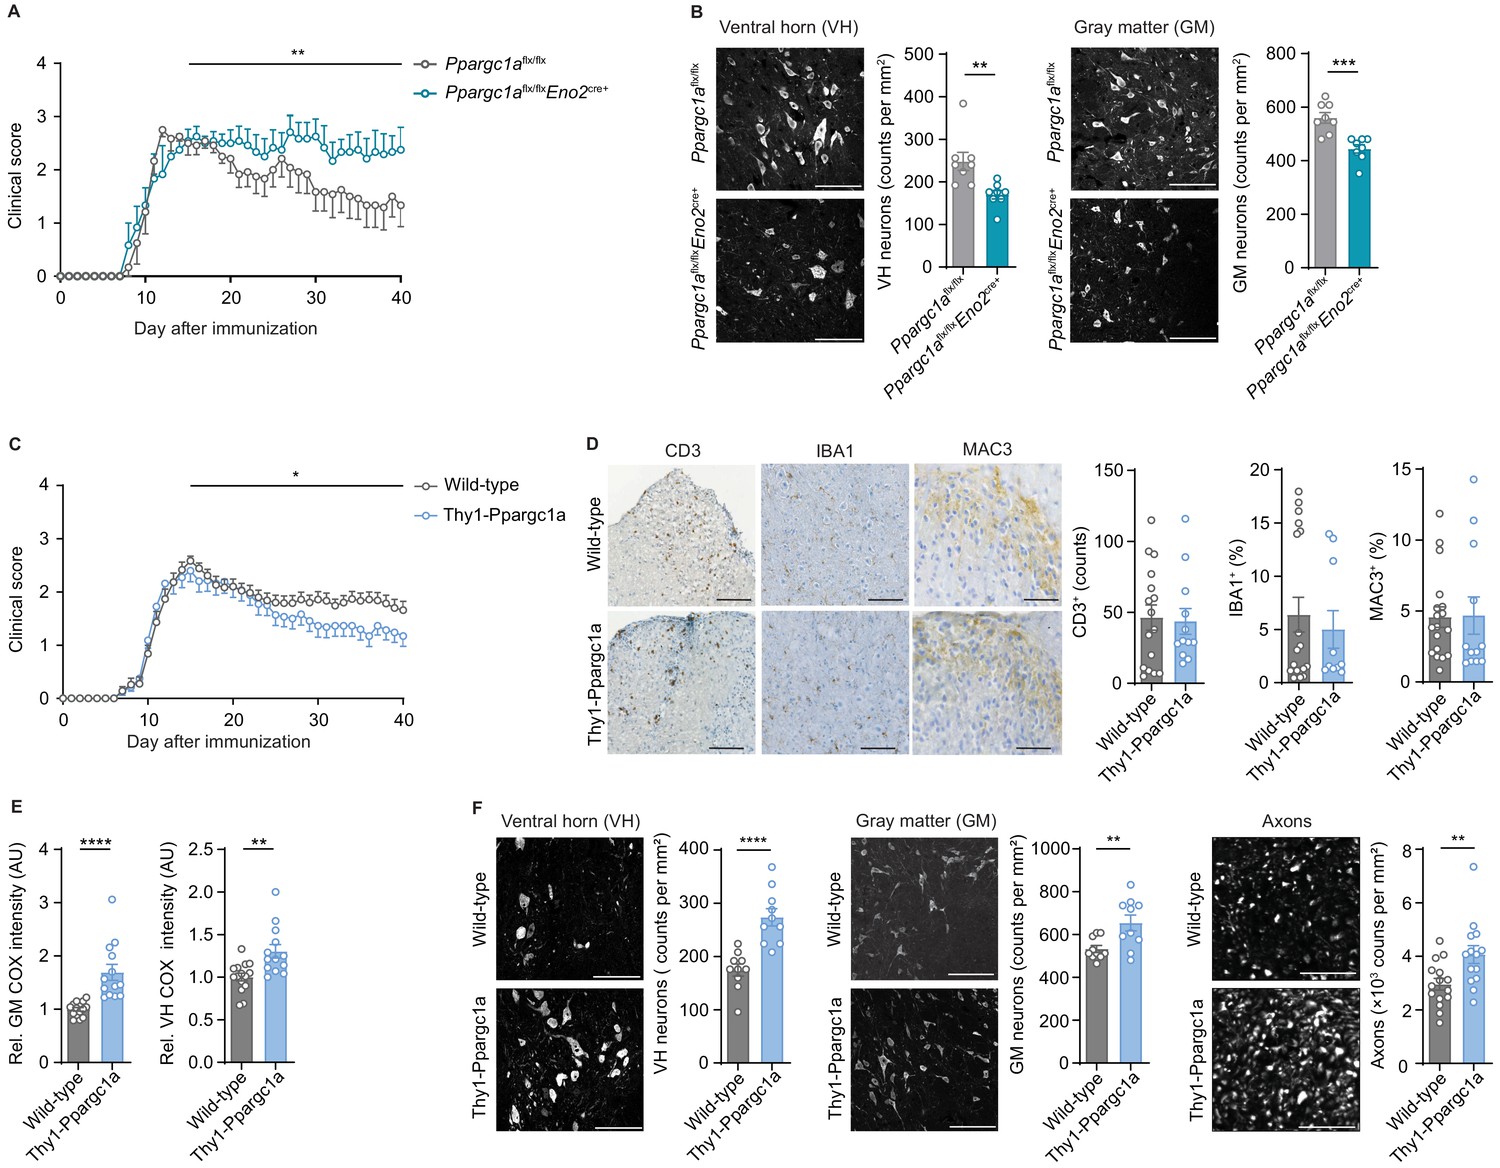
Neuronal Ppargc1a levels determine neuronal injury and clinical disability in experimental autoimmune encephalomyelitis (EAE).
(A) Mean clinical scores of Ppargc1aflx/flx (n = 6) and Ppargc1aflx/fl × Eno2Cre+ (n = 6) mice undergoing EAE. Curves show mean ± s.e.m. (B) Representative images and analysis of immunohistochemical stainings of surviving NeuN-positive neurons in cervical spinal cord ventral horn (VH) or gray matter (GM) of Ppargc1aflx/flx (n = 4) and Ppargc1aflx/flx × Eno2Cre+ (n = 4) mice (two areas per mice) at day 40 post-immunization with quantification. Bars show mean values ± s.e.m. Scale bar 100 µm. (C) Mean clinical scores of wild-types (n = 31) and Thy1-Ppargc1a (n = 22) mice undergoing EAE. Curves show mean ± s.e.m., all pooled from three independent experiments. (D) Histopathological stainings of T cells (CD3), microglia (IBA1), and macrophages (MAC-3) in cervical spinal cord sections of wild-type (n = 6) and Thy1-Ppargc1a (n = 5) mice (2–3 stainings per mice) at day 15 post immunization with quantifications. Bars show mean values ± s.e.m. Scale bar 250 and 100 µm. (E) Quantification of cytochrome c oxidase (COX) histochemistry of cervical spinal cord GM or VH of wild-type (n = 6) and Thy1-Ppargc1a (n = 4) mice (2–3 stainings per mice) at acute stage of EAE normalized to neuronal nuclei (NeuN)-positive neurons. Bars show mean values ± s.e.m. Scale bar 250 µm. (F) Representative images and analysis of immunohistochemical stainings of surviving NeuN-positive neurons in cervical spinal cord VH or GM and surviving neurofilament-positive axons in the dorsal columns of wild-type (n = 5) and Thy1-Ppargc1a (n = 5) (two areas per mice for NeuN, three areas per mice for neurofilament) at day 40 post immunization. Bars show mean values ± s.e.m. Scale bar: 100 µm and 50 µm. Statistical analysis in A and C was performed by one-tailed Mann–Whitney U test of area under the curve (AUC) starting at peak (day 15) of disease; in B, D, E, and F by unpaired, two-tailed Student’s t-test. *p<0.05, **p<0.01, ***p<0.001, ****p<0.0001.
-
Figure 5—source data 1
Numerical data of clinical scores of Ppargc1aflx/flx (flx/flx) (n = 6) and Ppargc1aflx/flx × Eno2Cre+ (flx/flx × Eno2Cre) (n = 6) mice undergoing experimental autoimmune encephalomyelitis (EAE).
- https://cdn.elifesciences.org/articles/61798/elife-61798-fig5-data1-v3.xlsx
-
Figure 5—source data 2
Numerical data of clinical scores of wild-types (WT) (n = 31) and Thy1-Ppargc1a (TT) (n = 22) mice undergoing experimental autoimmune encephalomyelitis (EAE).
- https://cdn.elifesciences.org/articles/61798/elife-61798-fig5-data2-v3.xlsx
Figure 5—figure supplement 1
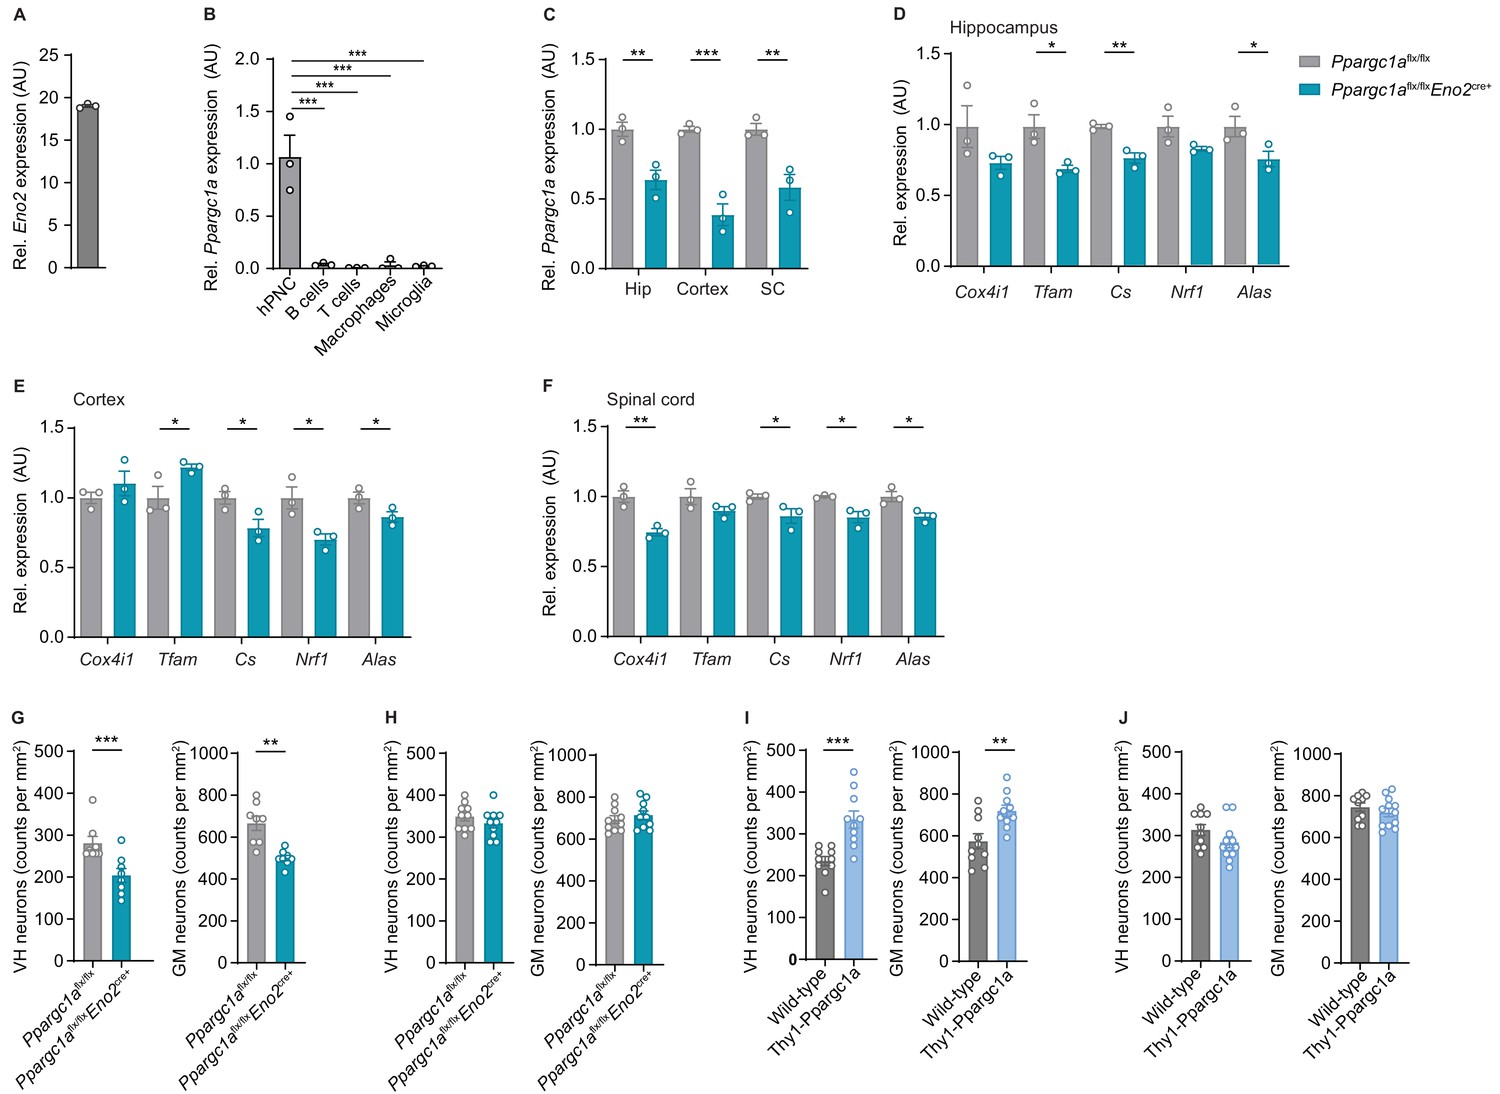
Neuronal Ppargc1a and Ppargc1a-dependent target genes are decreased in Ppargc1aflx/flx × Eno2Cre+ mice.
(A) Relative qPCR mRNA expression of Eno2 to Tbp in hippocampal primary neuronal cultures (hPNC) (DIV14) of wild-type (n = 3) mice. Bars show mean values ± s.e.m. (B) Relative qPCR mRNA expression of Ppargc1a in sorted immune cells in relation to hPNC (DIV14) of wild-type (n = 3) mice. Bars show mean values ± s.e.m. (C) Relative qPCR mRNA expression of Ppargc1a in hippocampus (Hip), cortex, and cervical spinal cord (SC) of Ppargc1aflx/flx (n = 3) and Ppargc1aflx/flx × Eno2Cre+ (n = 3) mice. Bars show mean values ± s.e.m. (D) Relative qPCR mRNA expression of Ppargc1a target genes in hippocampus of Ppargc1aflx/flx (n = 3) and Ppargc1aflx/flx × Eno2Cre+ (n = 3) mice. Bars show mean values ± s.e.m. (E) Relative qPCR mRNA expression of Ppargc1a target genes in cortex of Ppargc1aflx/flx (n = 3) and Ppargc1aflx/flx × Eno2Cre+ (n = 3) mice. Bars show mean values ± s.e.m. (F) Relative qPCR mRNA expression of Ppargc1a target genes in cervical spinal cord of Ppargc1aflx/flx (n = 3) and Ppargc1aflx/flx × Eno2Cre+ (n = 3) mice. Bars show mean values ± s.e.m. (G) Analysis of immunohistochemical stainings and quantification of HuC/HuD-positive neurons in cervical spinal cord ventral horn (VH) or gray matter (GM) of Ppargc1aflx/flx (n = 4) and Ppargc1aflx/flx × Eno2Cre+ (n = 4) mice (two areas per mouse) at day 40 post-immunization. Bars show mean values ± s.e.m. (H) Analysis of immunohistochemical stainings and quantification of neuronal nuclei (NeuN)-positive neurons in cervical spinal cord VH or GM of healthy Ppargc1aflx/flx (n = 5) and Ppargc1aflx/flx × Eno2Cre+ (n = 5) mice (two areas per mouse). Bars show mean values ± s.e.m. (I) Analysis of immunohistochemical stainings and quantification of surviving HuC/HuD-positive neurons in cervical spinal cord VH or GM of wild-type (n = 5) and Thy1-Ppargc1a (n = 6) (two areas per mice for NeuN, three areas per mice for neurofilament) at day 40 post immunization. Bars show mean values ± s.e.m. (J) Analysis of immunohistochemical stainings and quantification of NeuN-positive neurons in cervical spinal cord VH or GM of healthy wild-type (n = 5) and Thy1-Ppargc1a (n = 5) (two areas per mice) immunization. Bars show mean values ± s.e.m. Statistical analysis in B was performed by multiple comparisons test following one-way ANOVA, and in C–J by unpaired, two-tailed Student’s t-test. *p<0.05, **p<0.01, ***p<0.001, ****p<0.0001.
Videos
Video 1
Representative video of calcium transients of Fluo4 stained cortical primary neuronal culture (DIV15) of Thy1-Ppargc1a (left) and wild-type (right) mice.
Enhancing mitochondrial activity in neurons protects against neurodegeneration in a mouse model of multiple sclerosis.
Tables
Key resources table
| Reagent type (species) or resource | Designation | Source or reference | Identifiers | Additional information |
|---|---|---|---|---|
| Antibody | Alexa Fluor 488 α-chicken (donkey polyclonal) | Jackson | RRID: AB_2340375 | IHC (1:800) |
| Antibody | Alexa Fluor 647 α-rabbit (donkey polyclonal) | Jackson | RRID: AB_2752244 | IHC (1:800) |
| Antibody | α-NeuN (chicken polyclonal) | Millipore | RRID: AB_11205760 | IHC (1:500) |
| Antibody | α-HuC/HuD (mouse monoclonal) | Thermo Scientific | RRID: AB_221448 | IHC (1:500) |
| Antibody | α-Mouse IgG (goat polyclonal) | Jackson | RRID: AB_2338476 | IHC (1:200) |
| Antibody | Cy3 α-mouse (donkey polyclonal) | Jackson | RRID: AB_2340816 | IHC (1:800) |
| Antibody | α-FLAG (Clone M2) (mouse monoclonal) | Sigma | RRID: AB_259529 | IHC (1:200) |
| Antibody | α-SMI31 (mouse monoclonal) | Covance | RRID: AB_10122491 | IHC (1:500) |
| Antibody | α-SMI32 (mouse monoclonal) | Covance | RRID: AB_2564642 | IHC (1:500) |
| Antibody | α-PGC-1α (rabbit polyclonal) | Novus | RRID: AB_1522118 | IHC (1:100) ICC (1:200) WB (1:2000) |
| Antibody | α-MAP2 (chicken polyclonal) | Abcam | RRID: AB_2138153 | ICC (1:2500) |
| Antibody | α-CD3 (clone SP7) (rabbit monoclonal) | Abcam | RRID: AB_443425 | IHC (1:100) |
| Antibody | α-Mac3 (clone M3/84) (rat monoclonal) | BD Biosciences | RRID: AB_394780 | IHC (1:100) |
| Antibody | α-Iba1 (rabbit polyclonal) | Wako | RRID: AB_839504 | IHC (1:100) |
| Antibody | α-Phosphorylated PGC-1αS570 (rabbit polyclonal) | R and D Systems | RRID: AB_10890391 | WB (1:1000) |
| Antibody | α-ß-Actin (rabbit polyclonal) | Cell Signaling Technology | RRID: AB_330288 | WB (1:1000) |
| Antibody | HRP α-rabbit (goat polyclonal) | LI-COR Biosciences | RRID: AB_2721264 | WB (1:15,000) |
| Antibody | α-CD45-APC/Cy7 (clone 30F11) (rat monoclonal) | BioLegend | RRID: AB_312981 | FACS (1:100) |
| Antibody | α-CD4-FITC (clone GK1.5) (rat monoclonal) | BioLegend | RRID: AB_312691 | FACS (1:100) |
| Antibody | α-CD3-BV605 (clone 17A2) (rat monoclonal) | BioLegend | RRID: AB_2562039 | FACS (1:300) |
| Antibody | α-CD8-Pacific Blue (clone 53–6.7) (rat monoclonal) | BioLegend | RRID: AB_493425 | FACS (1:100) |
| Antibody | α-CD19-PE/Cy7 (clone 1D3) (rat monoclonal) | BD | RRID: AB_10894021 | FACS (1:100) |
| Antibody | α-CD19-BV605 (clone 6D5) (rat monoclonal) | BioLegend | RRID: AB_11203538 | FACS (1:100) |
| Antibody | α-Ly6G-BV711 (clone 1A8) (rat monoclonal) | BD | RRID: AB_2738520 | FACS (1:100) |
| Antibody | α-F4/80-BV421 (clone T45-2342) (rat monoclonal) | BD | RRID: AB_2734779 | FACS (1:100) |
| Antibody | α-NK1.1- PE/Cy7 (clone PK136) (rat monoclonal) | BioLegend | RRID: AB_389364 | FACS (1:300) |
| Antibody | α-CD11b-FITC (clone M1/70) (rat monoclonal) | BioLegend | RRID: AB_312789 | FACS (1:300) |
| Antibody | α-Fc-Block (true stain anti-mouse CD16/32, clone 93) (rat monoclonal) | BioLegend | RRID: AB_1574975 | FACS (1:1000) |
| Chemical compound, drug | Mycobacterium tuberculosis | BD Difco | BD 231141 | |
| Chemical compound, drug | Freund’s adjuvant | Difco Laboratories | Cat. number: 263910 | |
| Chemical compound, drug | Dynabeads MyOne Streptavidin T1 | Invitrogen | Cat. number: 65601 | |
| Chemical compound, drug | Cytochrome c from bovine heart | Sigma-Aldrich | CAS number:9007-43-6 | |
| Chemical compound, drug | Bis(2-amino-phenoxy) ethane tetraacetic acid | Thermo Scientific | CAS number: 126150-97-8 | |
| Chemical compound, drug | 3,3-Diaminobenzidine (DAB),≥98% | Sigma-Aldrich | Cat. number: D8001 | |
| Chemical compound, drug | Fluo-4, AM | Invitrogen | Cat. number: F14201 | |
| Commercial assay or kit | Bicinchoninic acid (BCA) kit for protein determination | Sigma-Aldrich | Cat. number: BCA1 | |
| Commercial assay or kit | Seahorse XF cell mito stress test kit | Agilent | Part number: 103015-100 | |
| Commercial assay or kit | Calcein-AM | Sigma-Aldrich | CAS number: 14850434–1 | |
| Commercial assay or kit | ultraView Universal DAB detection kit | Ventana | Cat. number: 760-500 | |
| Commercial assay or kit | TMRE-mitochondrial membrane potential assay kit | Abcam | Ab113852 | |
| Genetic reagent (Mus musculus) | C57BL/6J wild-type mice | Jackson Laboratory | Stock #: 000664 RRID: MGI:2159769 | |
| Genetic reagent (M. musculus) | Thy1-Flag-Ppargc1a | PMID: 21984601 | Dr. Dan Lindholm (Minerva Medical Research Institute) | |
| Genetic reagent (M. musculus) | Eno2Cre+ | Jackson Laboratory | Stock #: 006663 RRID: MGI:2177175 | |
| Genetic reagent (M. musculus) | Ppargc1aflx/flx | Jackson Laboratory | Stock #: 009666 RRID: MGI:5576884 | |
| Genetic reagent (M. musculus) | Chat-L10a-eGFP | Jackson Laboratory | Stock #: 030250 RRID: MGI:5496680 | |
| Other | Bolt 4–12% Bis-Tris Plus Gel | Invitrogen | Cat. number: NW04120BOX | |
| Peptide, recombinant protein | MOG35-55 peptide | Peptides and elephants | Order number: EP02030_1 | |
| Sequence-based reagent | Actb | Thermo Scientific | Mm_00607939_s1 | |
| Sequence-based reagent | Alas | Thermo Scientific | Mm01235914_m1 | |
| Sequence-based reagent | Coq9 | Thermo Scientific | Mm00804236_m1 | |
| Sequence-based reagent | Cox2I | Thermo Scientific | Mm03294838_g1 | |
| Sequence-based reagent | Cox4iI | Thermo Scientific | Mm01250094_m1 | |
| Sequence-based reagent | Cox5a | Thermo Scientific | Mm00432638_m1 | |
| Sequence-based reagent | Cox5b | Thermo Scientific | Mm01229713_g1 | |
| Sequence-based reagent | Cox6a1 | Thermo Scientific | Mm01612194_m1 | |
| Sequence-based reagent | Cs | Thermo Scientific | Mm00466043_m1 | |
| Sequence-based reagent | Cyc1 | Thermo Scientific | Mm00470540_m1 | |
| Sequence-based reagent | Iscu | Thermo Scientific | Mm02342800_g1 | |
| Sequence-based reagent | Ndufa10 | Thermo Scientific | Mm00600325_m1 | |
| Sequence-based reagent | Ndufa12 | Thermo Scientific | Mm01240336_m1 | |
| Sequence-based reagent | Ndufa8 | Thermo Scientific | Mm00503351_m1 | |
| Sequence-based reagent | Ndufb6 | Thermo Scientific | Mm07294890_m1 | |
| Sequence-based reagent | Ndufs8 | Thermo Scientific | Mm00523063_m1 | |
| Sequence-based reagent | Nrf1 | Thermo Scientific | Mm01135606_m1 | |
| Sequence-based reagent | Ppargc1a | Thermo Scientific | Mm00464452_m1 | |
| Sequence-based reagent | Sdha | Thermo Scientific | Mm01352366_m1 | |
| Sequence-based reagent | Sdhb | Thermo Scientific | Mm00458272_m1 | |
| Sequence-based reagent | Sdhd | Thermo Scientific | Mm00546511_m1 | |
| Sequence-based reagent | Slc25a12 | Thermo Scientific | Mm00552467_m1 | |
| Sequence-based reagent | Sod2 | Thermo Scientific | Mm01313000_m1 | |
| Sequence-based reagent | Tbp | Thermo Scientific | Mm01277042_m1 | |
| Sequence-based reagent | Tfam | Thermo Scientific | Mm00447485_m1 | |
| Sequence-based reagent | Uqcr10 | Thermo Scientific | Mm01186961_m1 | |
| Sequence-based reagent | Uqcrb | Thermo Scientific | Mm01615741_gH | |
| Sequence-based reagent | Ppargc1a | Thermo Scientific | Mm00164544_cn, FAM | |
| Sequence-based reagent | Tfrc | Thermo Scientific | TaqMan Copy Number reference Assay for mouse, VIC | |
| Transfected construct (synthetic) | pAAV.Syn.GCaMP6f.WPRE.SV40 | Abcam | RRID: Addgene_100837 | Cytosolic calcium indicator |
Additional files
Download links
A two-part list of links to download the article, or parts of the article, in various formats.
Downloads (link to download the article as PDF)
Open citations (links to open the citations from this article in various online reference manager services)
Cite this article (links to download the citations from this article in formats compatible with various reference manager tools)
Enhancing mitochondrial activity in neurons protects against neurodegeneration in a mouse model of multiple sclerosis
eLife 10:e61798.
https://doi.org/10.7554/eLife.61798


