Phasic oxygen dynamics confounds fast choline-sensitive biosensor signals in the brain of behaving rodents
- Bernstein Center for Computational Neuroscience, Faculty of Medicine, Ludwig-Maximilians Universität München, Germany
Figures
Figure 1 with 1 supplement
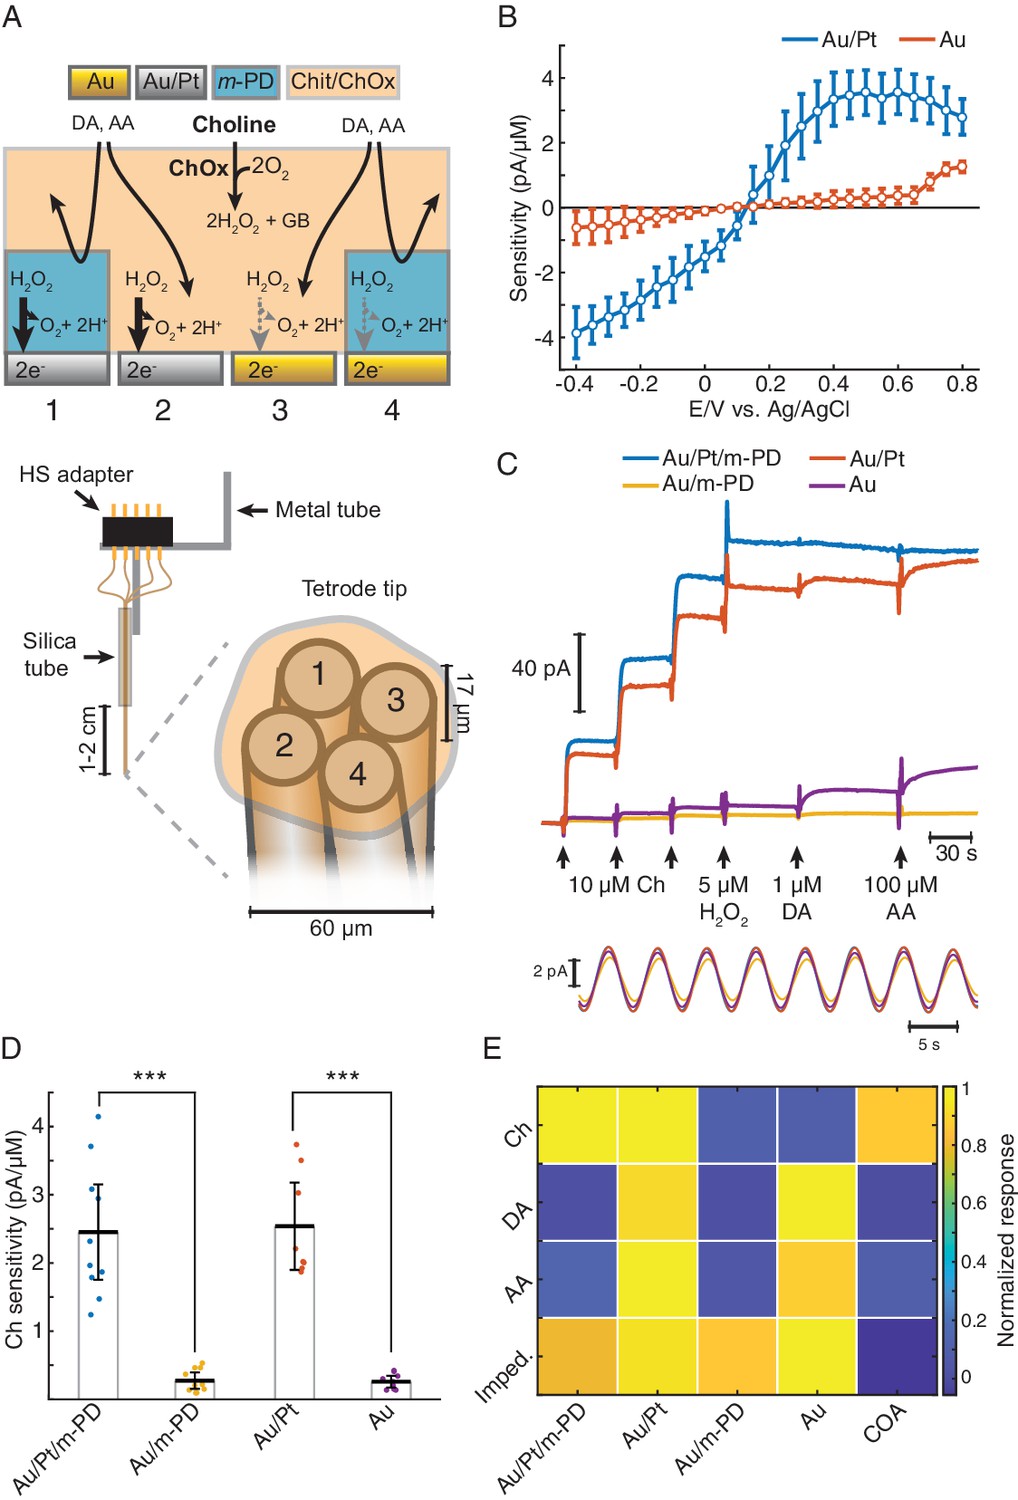
TACO sensor design and response properties.
(A) Schematics depicting the multichannel biosensor design, including the assembly used in in vitro and head-fixed recordings (bottom). HS: head-stage. (B) Voltammogram showing H2O2 sensitivities of gold-plated and platinized sites upon amperometric calibrations at different DC potentials (n = 10). Prior to calibrations, tetrodes were coated with a matrix of chitosan/ChOx. (C) Top shows a representative calibration of a sensor showing the response of different types of sites to step additions of Ch, H2O2, dopamine (DA). and ascorbate (AA). Bottom shows an example of current responses to a sinusoidal 12 mV AC voltage at 0.2 Hz overlaid on top of +0.6 V vs. Ag/AgCl DC voltage. (D) Sensitivities of different sites toward Ch (n = 10 biosensors). Unlike m-PD electropolymerization, platinization significantly increased sensitivity (p<0.0001 and F1,33 = 115 for platinization effect and p=0.87 and F1,33 = 0.03 for m-PD, by two-way ANOVA for unbalanced data). (E) Normalized responses of each tetrode site to Ch, interferent molecules and AC voltage, presented as impedance at 0.2 Hz (n = 5–10). Magnitudes significantly depended on the site modification and on the factor tested (p<0.0001 and F1,113 = 22 for platinization, F1,113 = 109 for m-PD and F3,113 = 12.9 for factors, by three-way ANOVA for unbalanced data). Platinization selectively increased responses to Ch (p<0.0001) while m-PD decreased responses only to DA and AA (p<0.0001). Impedances did not significantly differ across different types of electrode modifications (p>0.99). The rightmost column shows COA signal responses computed from the difference between Au/Pt/m-PD and Au/m-PD sites. Groups were compared by three-way ANOVA followed by Tukey-Kramer post-hoc tests. Data are represented as mean ± CI.
Figure 1—figure supplement 1
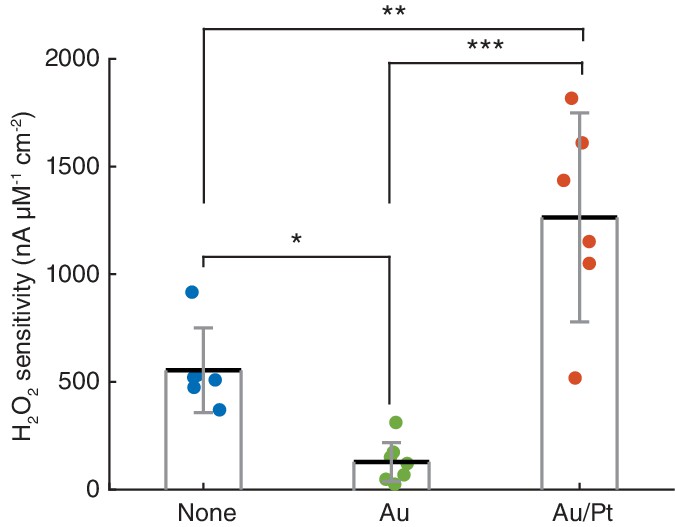
Effect of platings on platinum electrode sensitivity to H2O2.
Normalized H2O2 sensitivity of Pt/Ir disc electrodes (n = 6, data from our previous sensor design [Santos et al., 2015]), gold-plated Pt/Ir tetrode sites (n = 7) and gold/platinum-plated tetrode sites (n = 6). All electrode surfaces were coated with chitosan/ChOx matrices. All group pairwise comparisons were statistically significant (p=0.041 for None vs. Au, p=0.0015 for None vs. Au/Pt and p<0.0001 for Au vs. Au/Pt, by one-way ANOVA for unbalanced data followed by Tukey-Kramer post-hoc test). *p<0.05, **p<0.01, ***p<0.001.
Figure 2 with 2 supplements
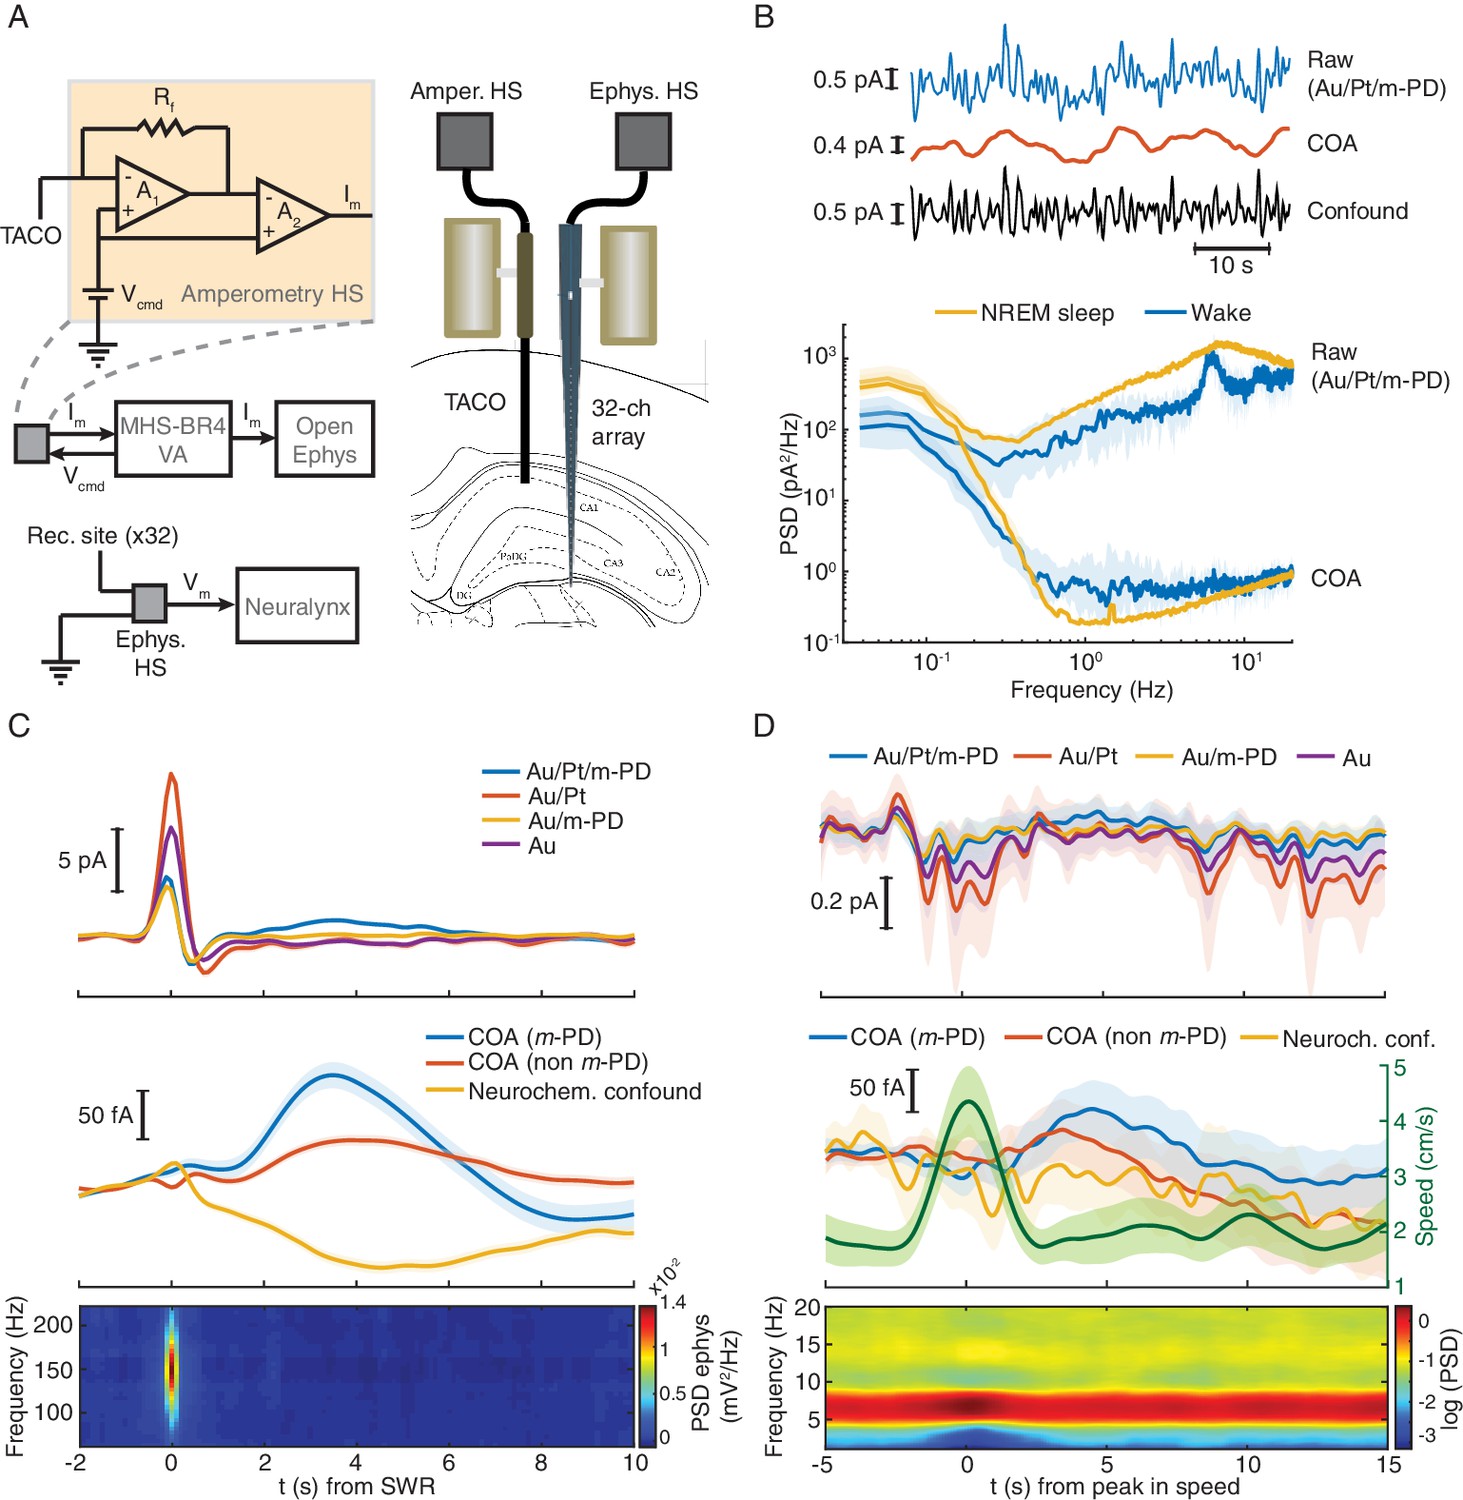
TACO sensor provides a highly sensitive and selective measurement of COA in freely behaving animals.
(A) Left panel shows a simplified diagram of the electronic circuits in freely moving recordings. The amperometric measurement (one channel for simplicity) was based on a voltage clamp circuit. Rf: feedback resistor (1 GOhm); A1, A2: OP amps; Vcmd: command voltage; Im: measured current (acquired as analog voltage signal). Vcmd is set on the MHS-BR4-VA box and sent to the head-stage. Its output is acquired by an Open-Ephys system. Electrophysiological setup is depicted in bottom. Vm: measured voltage output. The amplified LFP signal is acquired by the Neuralynx system. Right panel depicts the arrangement of a TACO sensor and a 32-channel silicon probe chronically implanted in the hippocampus of a rat. Both probes were attached to microdrives. (B) Top, segment of NREM sleep recording, a raw signal (low-pass filtered at 1 Hz), cleaned COA and confound components. Bottom, spectrum of the raw and clean COA signal during wake (n = 10) and NREM sleep periods (n = 19). Data shown as medians ± CI. (C) Average low frequency (1 Hz low-pass filtered) biosensor signals and high frequency power spectrograms triggered to SWRs detected from a silicon probe channel in CA1 pyramidal layer (top quartile of all ripples sorted by power, n = 2019). Average raw (top), cleaned (middle) COA responses and LFP spectrogram triggered on SWRs (bottom). (D) Average raw (top) cleaned COA responses (middle), average speed (middle) and LFP spectrogram (bottom) triggered to peaks in rat speed in an open-field arena (n = 127). Data are represented as mean ± CI, except in B.
Figure 2—figure supplement 1
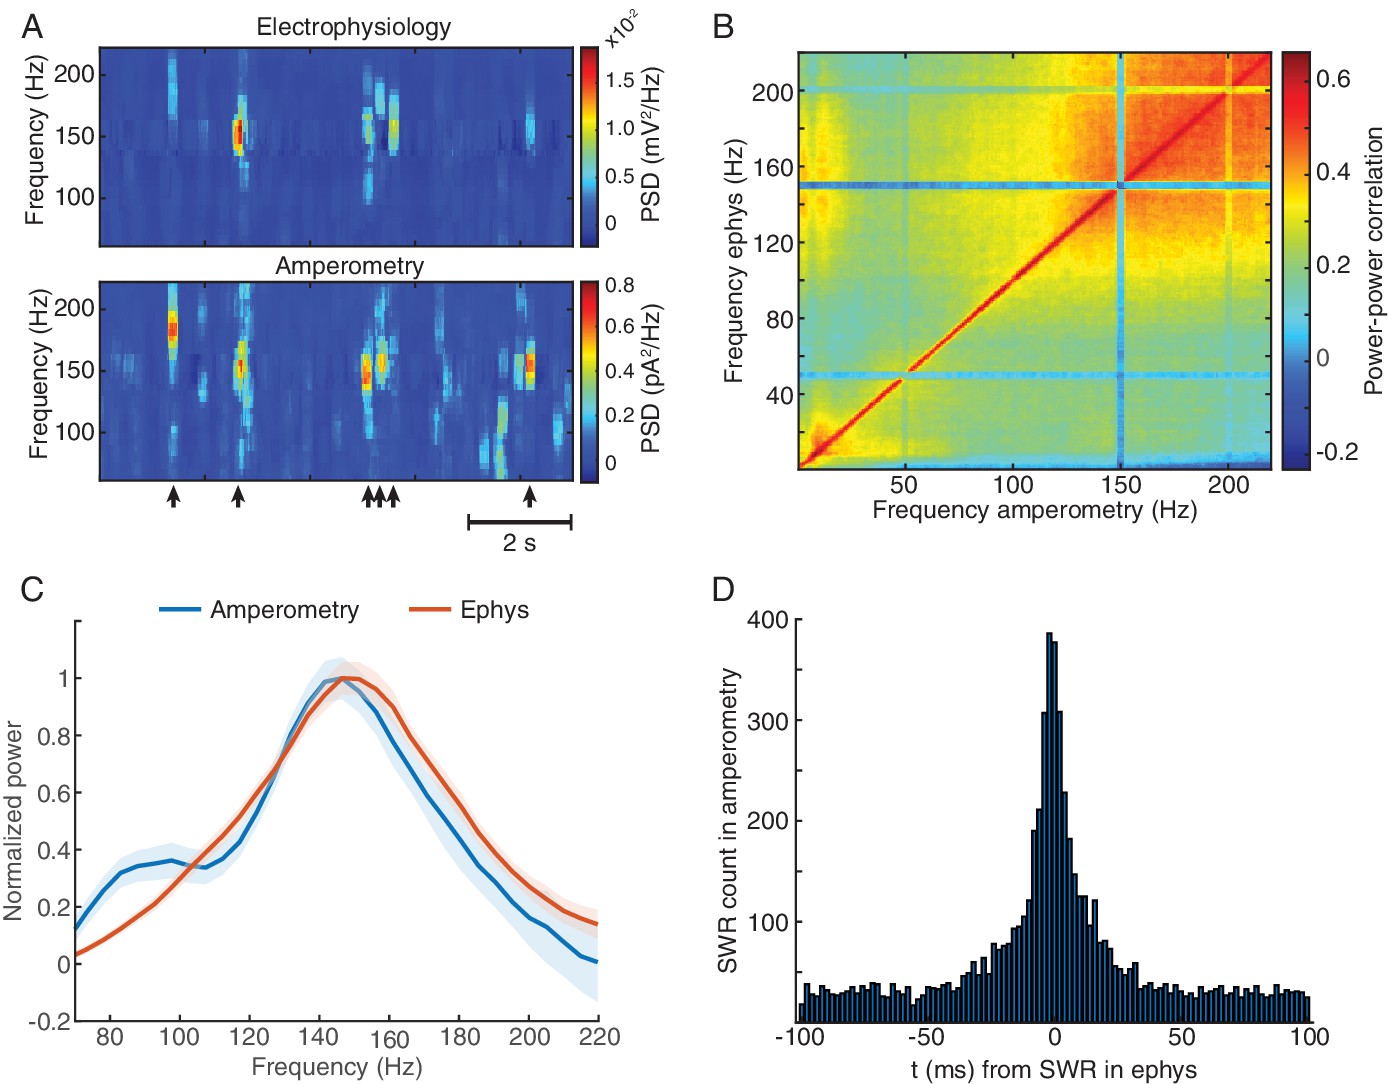
Amperometric currents reliably track LFP spectral content over a wide frequency range.
(A) Representative power spectrogram from high-frequency range of electrophysiology and amperometry derived LFP signals in the CA1 pyramidal layer during NREM sleep. Arrows indicate timings of SWRs detected from LFP. High-frequency bursts captured with both modalities typically coincided in time and exhibited similar spectral features. (B) Comodugram showing high correlation between LFP power, recorded during NREM sleep, from a silicon probe’s site in CA1 pyramidal layer and the power of the amperometric signal from a biosensor site, targeted to the same hippocampal layer. (C) Normalized power spectra triggered to SWRs highlighting the similarity of profiles gathered using both modalities. (D) Cross-correlogram of SWR timings detected using amperometry and electrophysiology, emphasizing the high co-occurrence of these events (n = 8074 for electrophysiology and n = 8085 for amperometry).
Figure 2—figure supplement 2
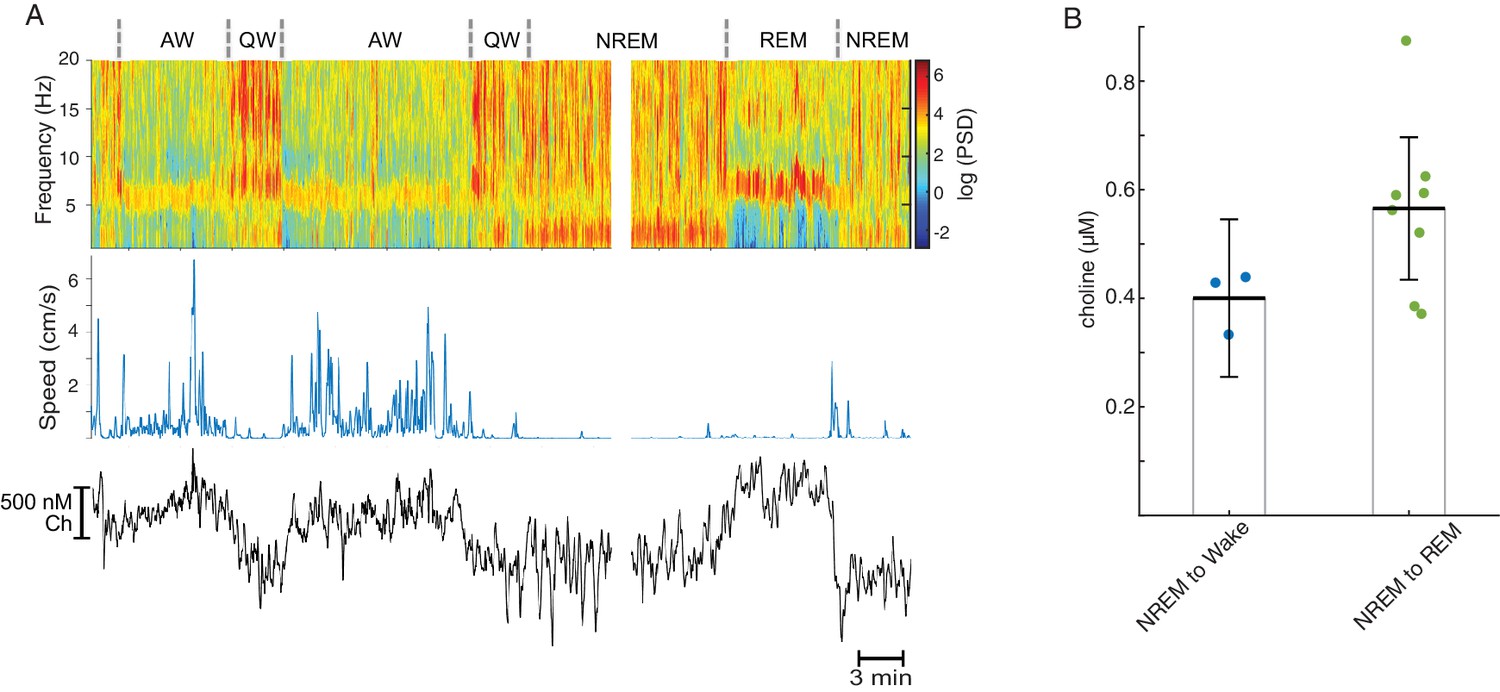
Tonic COA dynamics across brain states in a freely moving animal.
(A) Representative recording across multiple brain states showing power spectrogram from a silicon probe site at hippocampal fissure (top), rat speed (middle) and clean ChOx signal (bottom). (B) Change in tonic putative Ch levels following transitions from NREM sleep to wake (n = 3) or REM sleep (n = 9). Both groups were significantly different from zero (p=0.046 for NREM to Wake and p<0.0001 for NREM to REM, inferred from one-way anova followed by Tukey-Kramer post-hoc analysis). An outlier was excluded from the NREM to REM group (1.64, exceeding three median absolute deviations away from median).
Figure 3 with 2 supplements
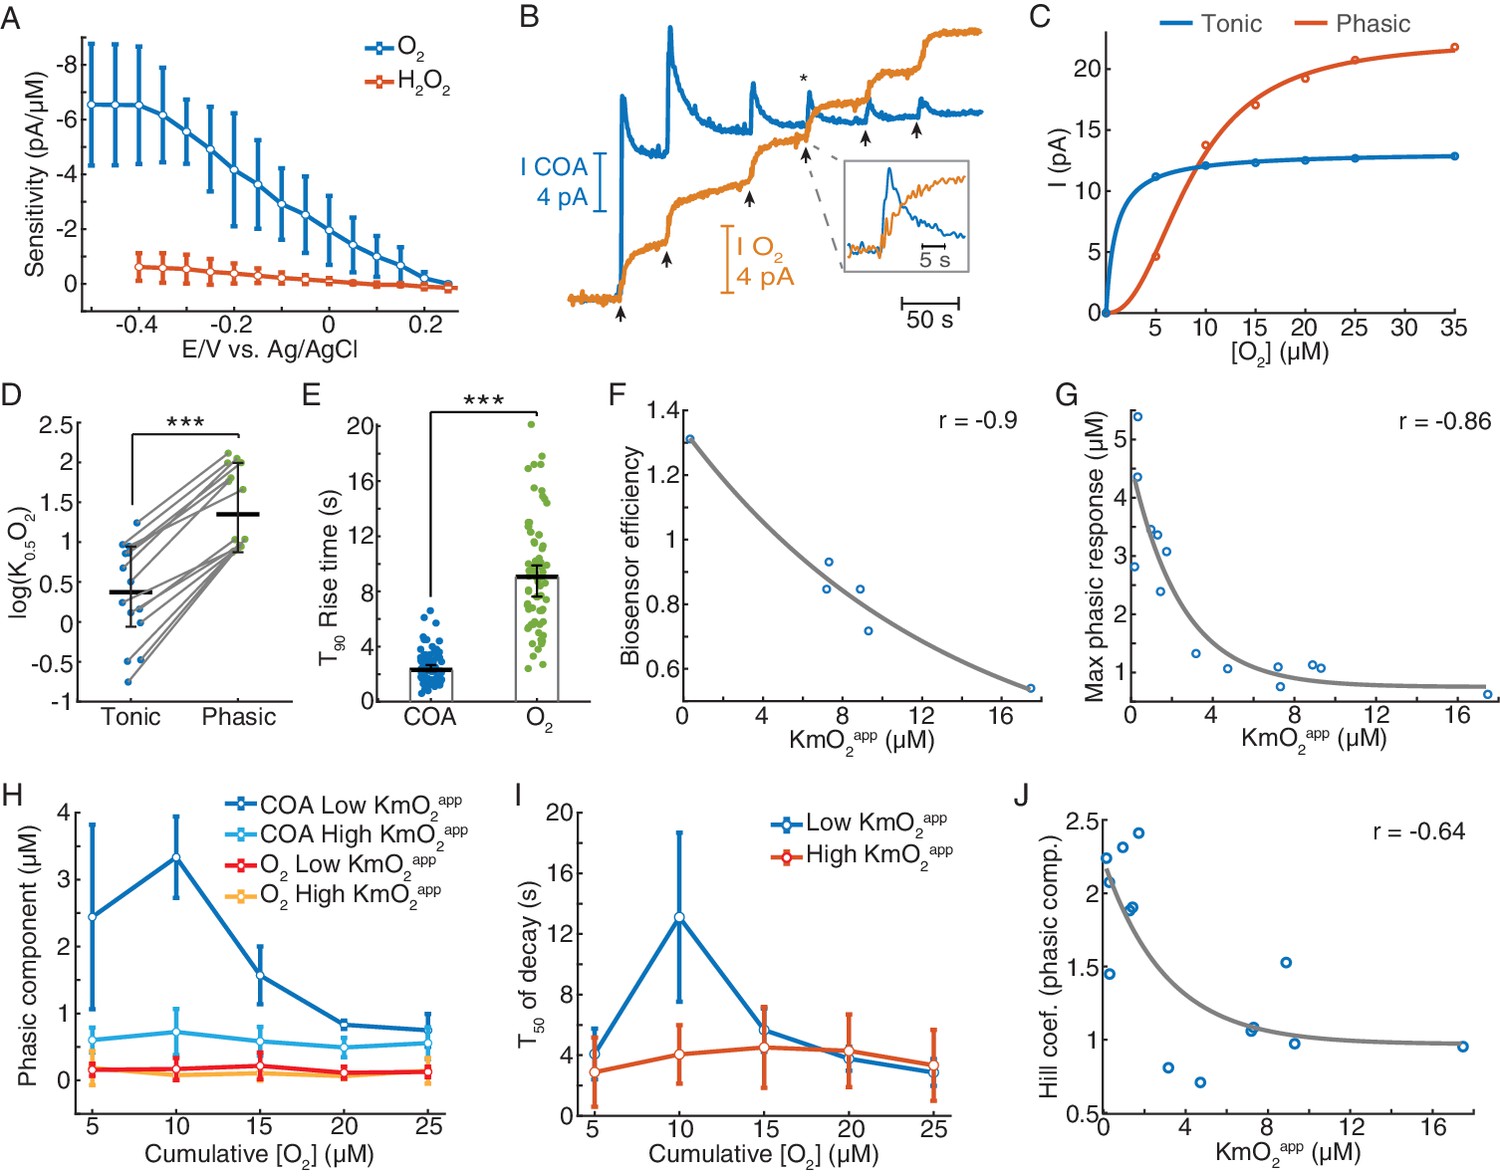
Biosensors generate tonic and phasic COA components in response to O2.
(A) The voltammogram shows the DC voltage-related sensitivity of gold-plated sites toward H2O2 (n = 10) and O2 (n = 5). (B) An example of an in vitro O2 calibration. Upon removal of O2 from PBS containing 5 μM Ch, 5 μM O2 additions (arrows) were performed until the tonic sensor response saturated. (C) Representative cumulative tonic and phasic responses as a function of O2 baseline after each addition. Tonic data were fitted with Michaelis-Menten equation, resulting in a KmO2app of 0.97 μM (CI = 0.818–1.126 μM) and Imax = 13.2 pA (CI = 13.04–13.37 pA), with RMSE = 0.08 pA. Phasic responses were fitted to the Hill equation, yielding K0.5O2 = 8.6 μM (CI = 7.58–9.62 μM), Hill coefficient n = 2.31 (CI = 1.74–2.88) and Imax = 22.4 pA (CI = 20.6–24.1), with rmse = 0.50 pA. (D) K0.5O2app values of tonic and phasic components from all biosensors (n = 14). Averages and error bars are medians and CIs. Groups were significantly different (sign test, p<0.0005). (E) T90 rise times of O2 steps and COA peaks following O2 additions (n = 72–95). Bars and error bars represent medians and 95% CIs, groups were significantly different (p<0.0001, Wilcoxon rank sum test). (F) Biosensor efficiency (Ch/H2O2 sensitivity ratio) as a function of KmO2app (n = 6). For illustrative purposes, data were fitted with an exponential function. Spearman correlation between variables was −0.9 (p=0.028). (G) Maximal phasic response to O2 (from each biosensor calibration) as a function of KmO2app (n = 14, rspearman = −0.86, p<0.0001). Data were fitted with an exponential decay curve (decay constant k = 0.4 μM−1, CI = 0.031–0.78 μM−1, rmse = 0.68 μM). (H) Amplitudes of phasic ChOx responses divided into low and high-KmO2app groups (n = 7 per group) following O2 additions. Control phasic O2 using the same algorithm is plotted for the same groups (n = 6 for high-KmO2app and n = 4 for low-KmO2app). Low-KmO2app COA transients were higher than those from the high-KmO2app group (p<0.0001) and the amplitudes from both COA groups were higher than any O2 group (p<0.005). Oxygen transients from low-KmO2app vs. high-KmO2app groups did not significantly differ (p=0.998). Group comparisons by two-way ANOVA for unbalanced data followed by Tukey-Kramer post-hoc tests. Data are means ± CI. (I) T50 decay of transients from low- and high-KmO2app groups as a function of cumulative O2. The decay of peaks at 10 μM O2 was the longest (p<0.0005, two-way ANOVA for unbalanced data followed by Tukey-Kramer post-hoc tests). Data are means ± CI. (J) Hill coefficient from the fits of cumulative COA phasic component vs. cumulative O2 (as in C) as a function of KmO2app (n = 14). The two variables negatively correlate (rspearman = −0.64, p=0.015), showing an exponential-like relationship (fitted initial amplitude of 1.27 ± 0.75, decay constant of 0.33 ± 0.62 μM−1 and offset of 0.97 ± 0.67). ***p<0.001.
Figure 3—figure supplement 1
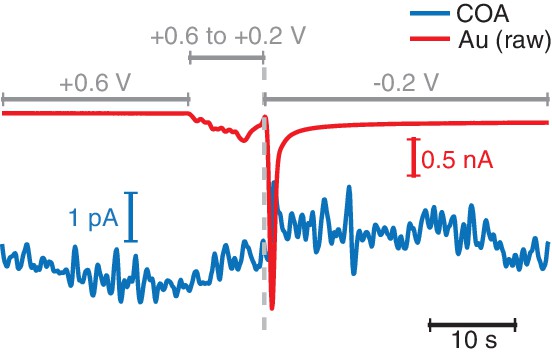
Oxygen measurement with the TACO sensor does not affect the simultaneously recorded COA signal.
Example of a switch of the potential applied to the Au site in vivo from the normally used +0.6 V vs. Ag/AgCl in sentinel mode to −0.2 V vs. Ag/AgCl used for O2 measurement. No change was observed in the COA signal upon switching the polarity of the signal.
Figure 3—figure supplement 2
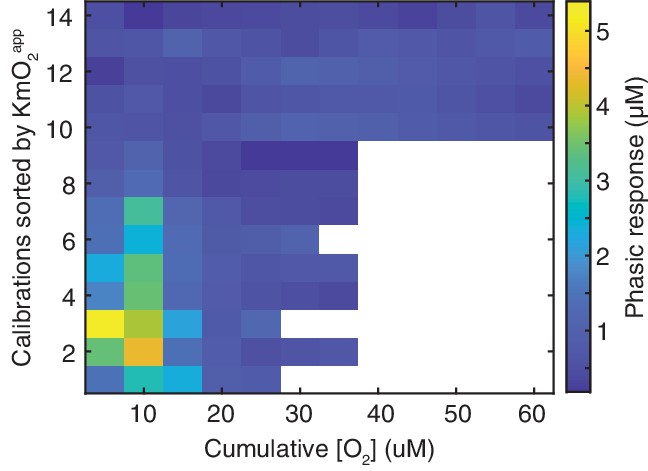
Phasic biosensor responses to O2in vitro.
Amplitude of phasic response (color) as a function of cumulative O2 after each addition, sorted by sensor’s tonic KmO2app. Amplitudes were calculated as Ch concentration, based on sensors’ response to 5 μM Ch.
Figure 4 with 2 supplements
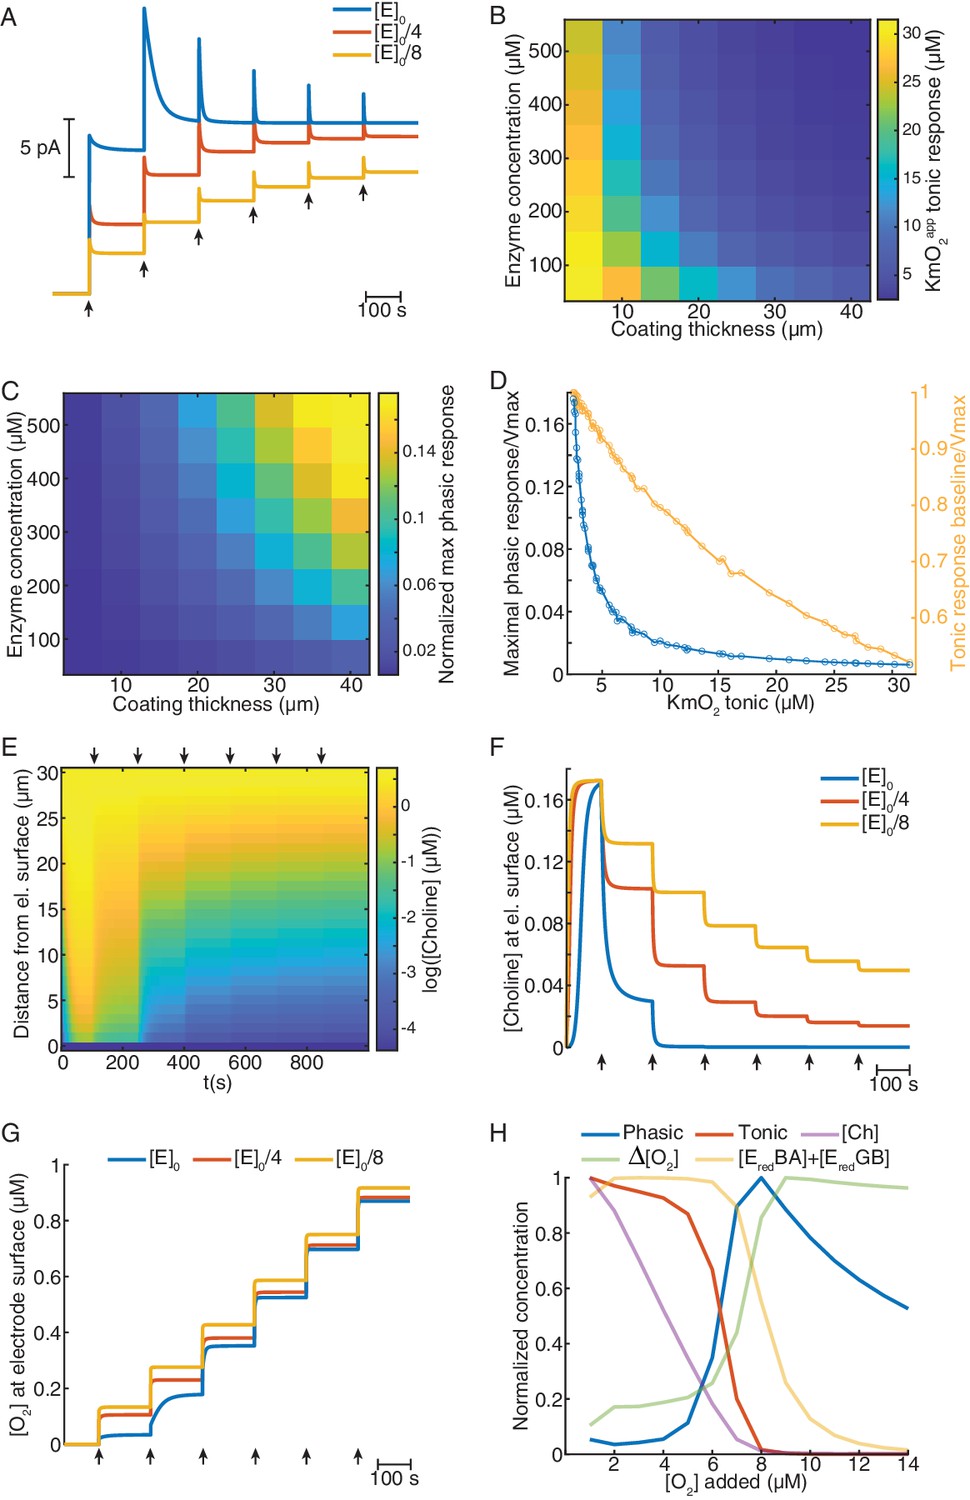
Mathematical model explains ChOx-based biosensor COA responses to oxygen.
(A) Simulated calibrations of biosensors with different enzyme concentrations in the coating (coating thickness of 30 μm). Choline in bulk solution was kept constant at 5 μM and O2 was incremented in 5 μM steps from zero to 30 μM (arrows). (B) KmO2app of tonic responses as a function of coating thickness and enzyme concentration in the coating. (C) Normalized maximal phasic responses of sensors with different coating thicknesses and enzyme concentrations. Magnitudes refer to the highest phasic response divided by the maximal cumulative tonic response (Imax) from the respective simulated sensor calibration. (D) Blue trace represents the normalized maximal phasic response vs. tonic KmO2app and the orange trace refers to the level of saturation of the sensor's tonic response at which the maximal phasic peak occurs. Data were obtained from all combinations of coating thickness and enzyme concentration in B and C. (E) Concentration dynamics of Ch in the sensor coating as a function of distance from the electrode surface during a simulated calibration of a high enzyme-loaded sensor (coating thickness of 30 μm and enzyme concentration of 560 μM, same as the blue in A). Arrows indicate 5 μM O2 step increments in solution. (F) and (G) show time-courses of Ch and O2 concentration, respectively, at the electrode surface of sensors with different enzyme concentrations during simulated calibrations. Arrows indicate 5 μM O2 increments in solution. (H) Normalized profiles of phasic and tonic sensor responses as well as of concentrations of enzyme substrates and total reduced enzyme-bound complexes at the electrode surface as a function of O2 in solution. Data are from a simulated calibration of a sensor with a 30 μm coating and an enzyme concentration of 560 μM, upon 1 μM O2 step increases in solution. The ΔO2 is the initial rise in O2 following each O2 increment in solution (at a lag of 0.3 s).
Figure 4—figure supplement 1
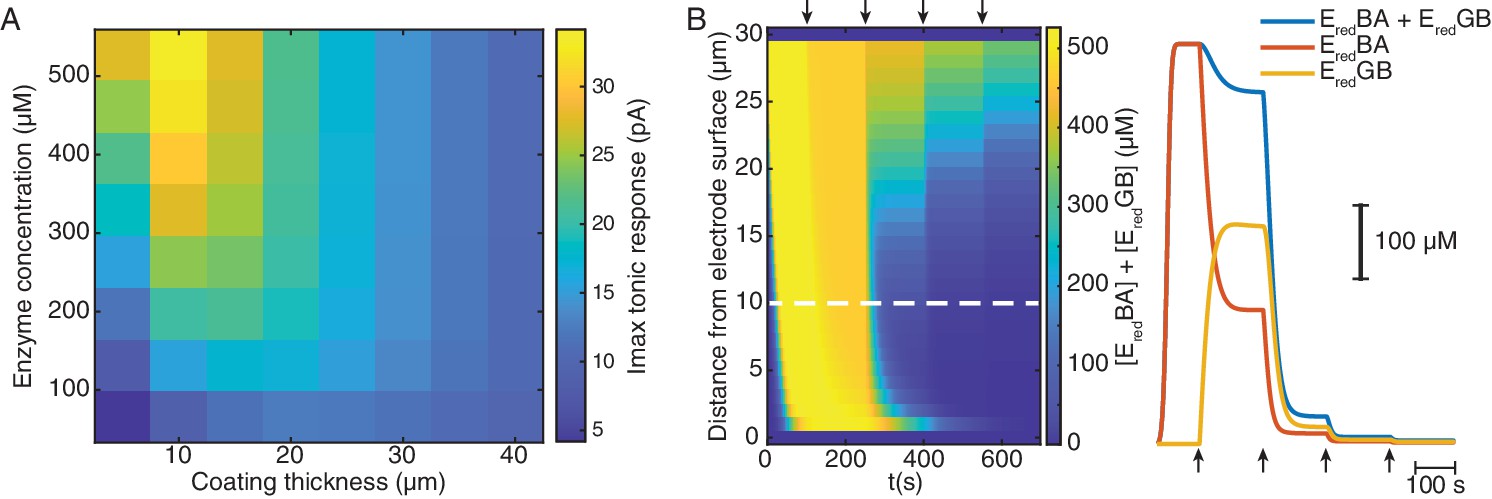
Mathematical simulation of ChOx-biosensor tonic responses and reduced enzyme-bound intermediate dynamics.
(A) Maximal cumulative tonic sensor responses as a function of coating thickness and enzyme concentration in the coating. (B) Left shows simulated concentration dynamics of total reduced enzyme-bound intermediates (EredBA+EredGB) in the sensor coating as a function of distance from the electrode surface during a simulated calibration of a high enzyme-loaded sensor (coating thickness of 30 μm and enzyme concentration of 560 μM). Right shows the dynamics of total and individual enzyme-bound intermediates at 10 μm from the electrode surface (dashed line in left panel). Arrows indicate 5 μM O2 step increments in solution.
Figure 4—figure supplement 2
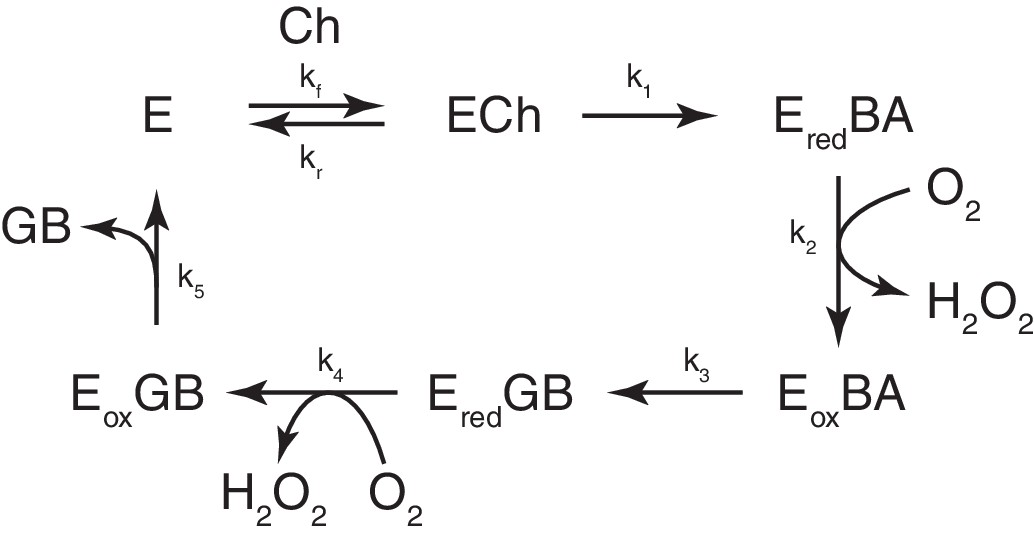
Minimal kinetic mechanism of Choline Oxidase.
(E) Free enzyme, (ECh) enzyme-bound Ch, (Ered) enzyme with reduced FAD co-factor, (Eox) enzyme with oxidized FAD co-factor, (BA) betaine aldehyde, (GB) glycine betaine.
Figure 5

Locomotion-related correlated changes in COA and local oxygen concentration in head-fixed mice.
(A) The schematics of the tetrode configuration used to simultaneously measure COA (H2O2) and extracellular O2.in head-fixed mice. Values on each recording site indicate the applied DC voltage vs. Ag/AgCl (+0.6 V for H2O2 and −0.2 V for O2 measurement). (B) Representative segment of simultaneous recording of COA and O2 (top), locomotion speed (middle) and LFP spectrogram (bottom). Dashed lines indicate times of detected locomotion bouts. (C) Average speed, COA and O2 signals (top) and LFP power spectrogram (bottom) triggered on locomotion bouts (n = 41 from one recording session). (D) Event counts across different categories of locomotion bouts, distinguished by the occurrence or absence of COA and/or O2 peaks. Data were collected from five recordings in three mice. (E) Amplitude of COA (shown as calibrated Ch concentrations) vs O2 transients following locomotion bouts (data from the events with increases in both signals, n = 146). Each color represents one recording session (n = 5–74 events per recording). Amplitudes were significantly correlated (rspearman = 0.77, p<0.001). (F) Spearman correlation coefficients between COA amplitudes and O2, theta power or speed (n = 5). Correlation across recordings was significant for ChOx vs O2 data (p<0.01, t-test). Each point represents a single recording session. (G) Peak lags of COA vs. O2 relative to the peak in speed (rspearman = 0.81, p<0.001, n = 146). Colors represent recording sessions (n = 5–74 events per recording). The diagonal line was plotted to ease comparison between lags. Data were obtained from five recordings in three mice and are represented as mean ± CI.
Figure 6 with 1 supplement
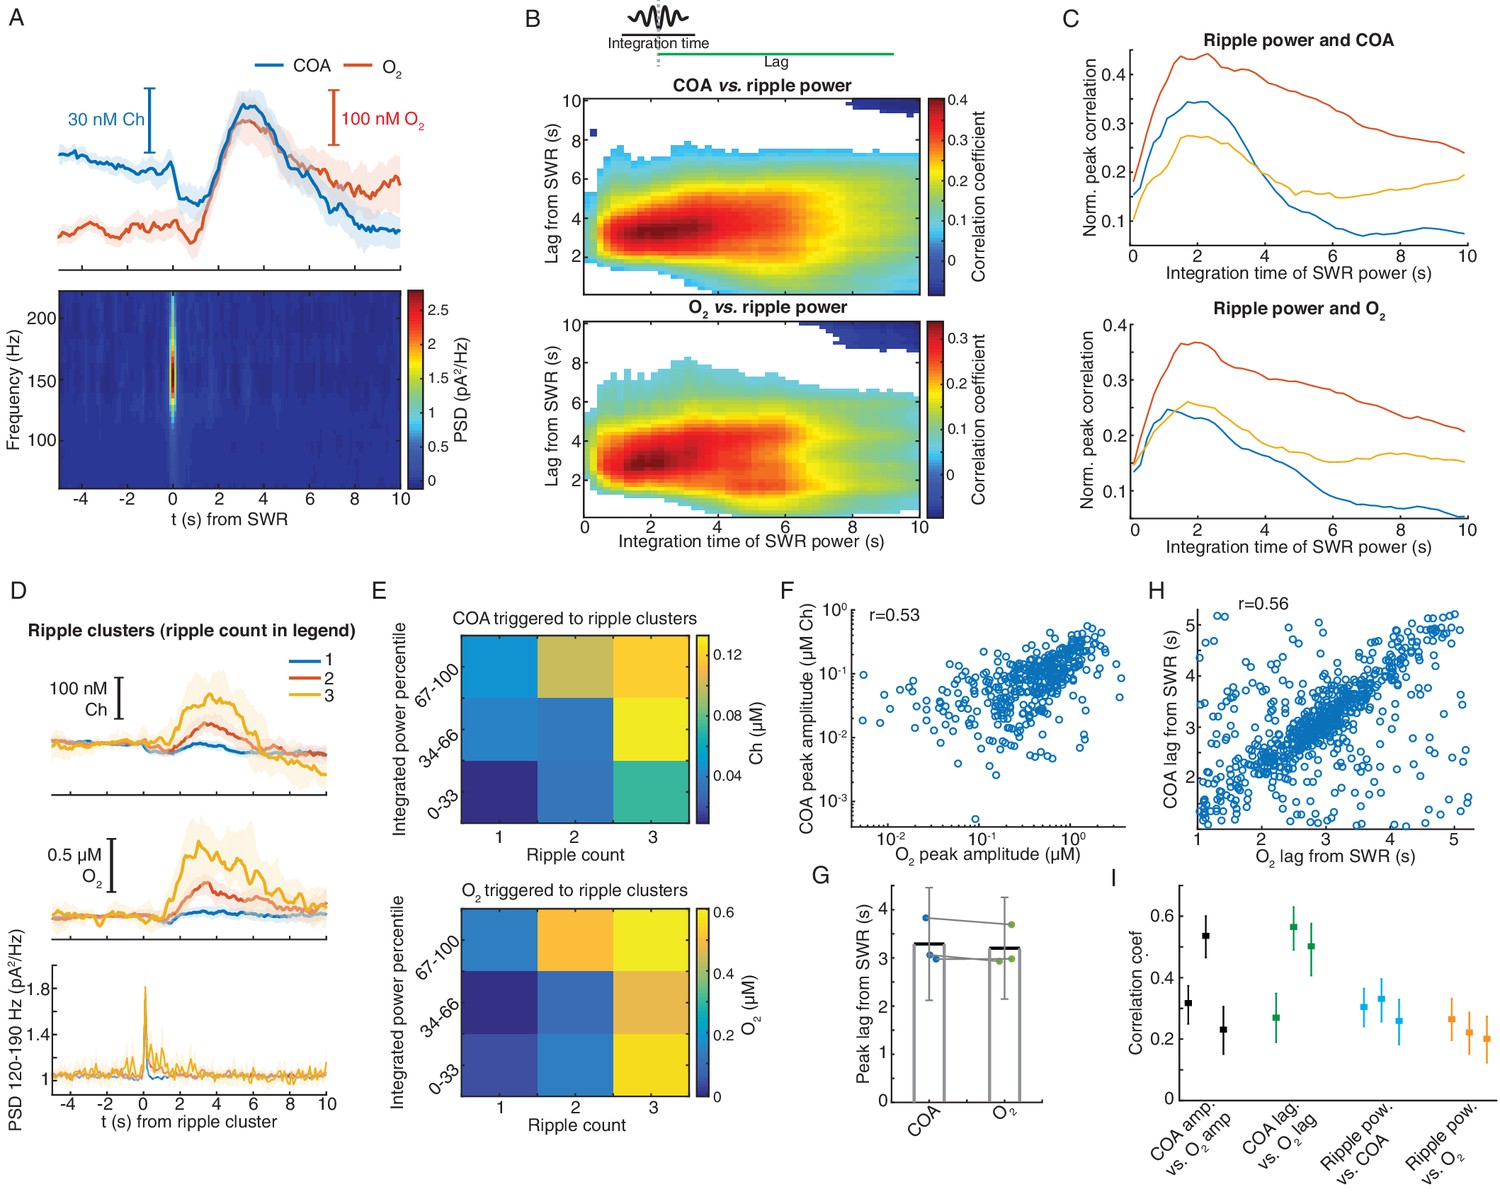
Correlated COA and oxygen transients follow hippocampal SWRs.
(A) Average COA and O2 dynamics triggered on hippocampal SWRs (n = 1067, top) and average LFP spectrogram (bottom) from a recording session in the head-fixed setup. (B) Pseudo-color-coded Spearman correlation between COA (top) or O2 (bottom) amplitude at different time lags from SWRs (y-axis) and integrated ripple band power computed in windows of varying size (x-axis) for a representative session. White areas represent non-significant correlations (p>0.05). (C) Normalized peak correlations, obtained from the difference between maximal and minimal correlations for each integration time in B, between integrated ripple power and COA or O2. Colors represent recording sessions in different mice. (D) Average COA, O2 and ripple power dynamics triggered to SWRs bursts containing variable number of SWRs (1-3) in a 2 s window (n = 34–591 SWRs in each group, respectively from one representative session). Data are represented as median ± CI. (E) Peak amplitude of COA or O2 transients as a function of SWR burst size (as shown in D) sorted by different percentile ranges of summed ripple power. Both SWR count and total ripple power significantly affected the amplitude of COA and O2 (two-way ANOVA for unbalanced data following ART, p<0.0001 and F2,803 > 12 for both factors in COA and O2 data). (F) Amplitude of COA vs. O2 transients following SWRs from one recording session (rspearman = 0.53, p<0.0001, n = 1067). (G) Group statistics on the lags of COA and O2 peaks relative to SWRs. Each dot is the average from one recording. Bars represent means ± CI. (H) Lags of COA peaks as a function of O2 peak lags relative to SWRs. The parameters were significantly correlated (rspearman = 0.56, p<0.0001, n = 1067). (I) Summary of correlations between sensor signals and ripples. Each point represents one recording session, and error bars are CIs computed using bootstrap. Data were obtained from three recording sessions in three mice.
Figure 6—figure supplement 1
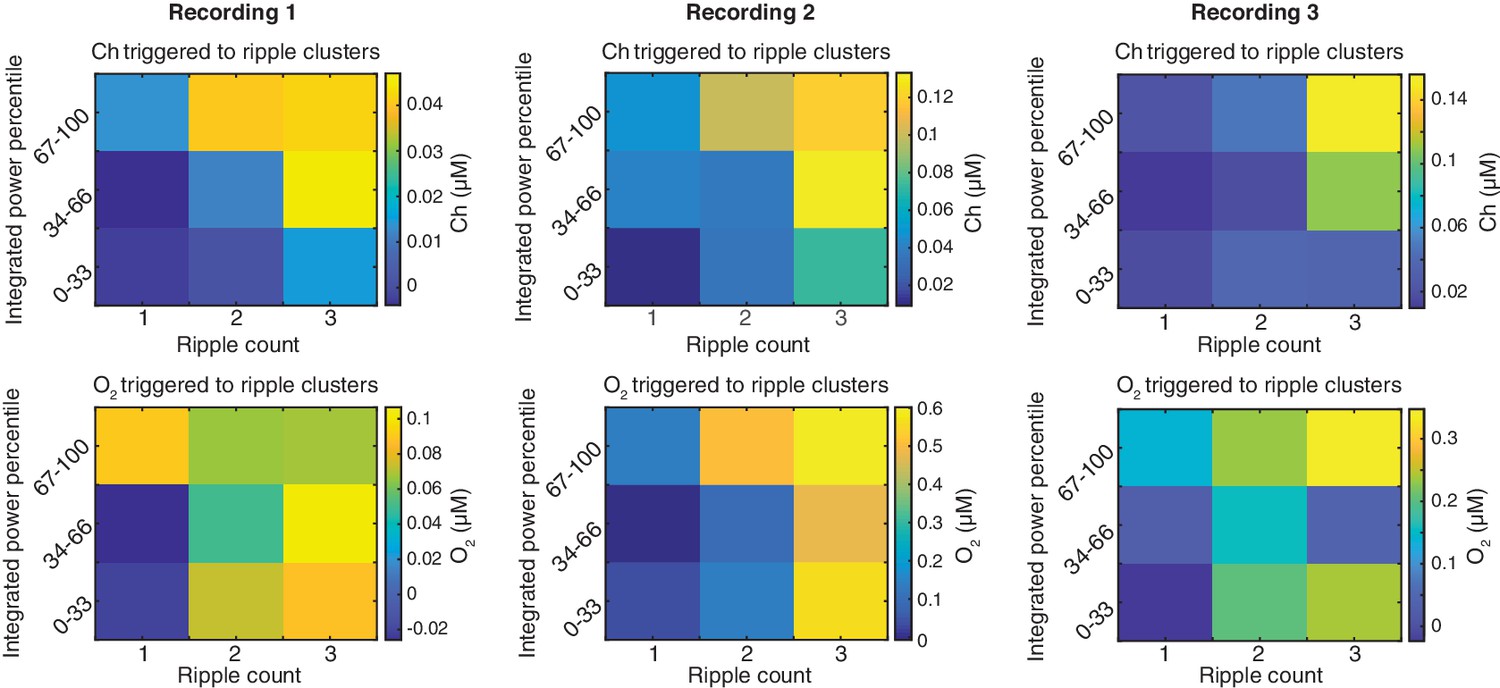
Phasic COA and oxygen responses following SWRs jointly depend on their power and grouping.
Amplitude of ChOx activity and O2 transients as a function of SWR count in a 2 s time window, sorted by different percentile ranges of summed ripple power. The data was collected from three recording sessions. Statistic tests were performed by two-way ANOVA for unbalanced data following ART to account for non-gaussian distributions. In recording session 1, both SWR count and total ripple power significantly affected the amplitude of ChOx and O2 (p<0.0001 for count and F2,762 = 10.2 for count, p<0.001 and F2,762 = 8.24 for power in COA data; p<0.001 and F2,762 = 9.98 for count, p=0.004 and F2,762 for power in O2 data). The same applied for recording 2 (p<0.0001 and F2,803 = 14.35 for count, p<0.0001 and F2,803 = 12.3 for power in COA data; p<0.0001 and F2,803 = 16.9 for count, p<0.0001 and F2,803 = 12.1 for power in O2 data). As for recording session 3, the SWR count effect was significant for both sensor signals (p<0.0001 and F2,618 = 11.3 for COA; p=0.032 and F2,618 = 3.47 for O2) and the summed ripple power significantly affected O2 (p=0.016 and F2,618 = 4.14), but was not consistently related to ChOx transients amplitude (p=0.07, F2,618=2.71).
Figure 7 with 1 supplement
Correlation between COA and spontaneous O2 transients suggests O2-COA directionality.
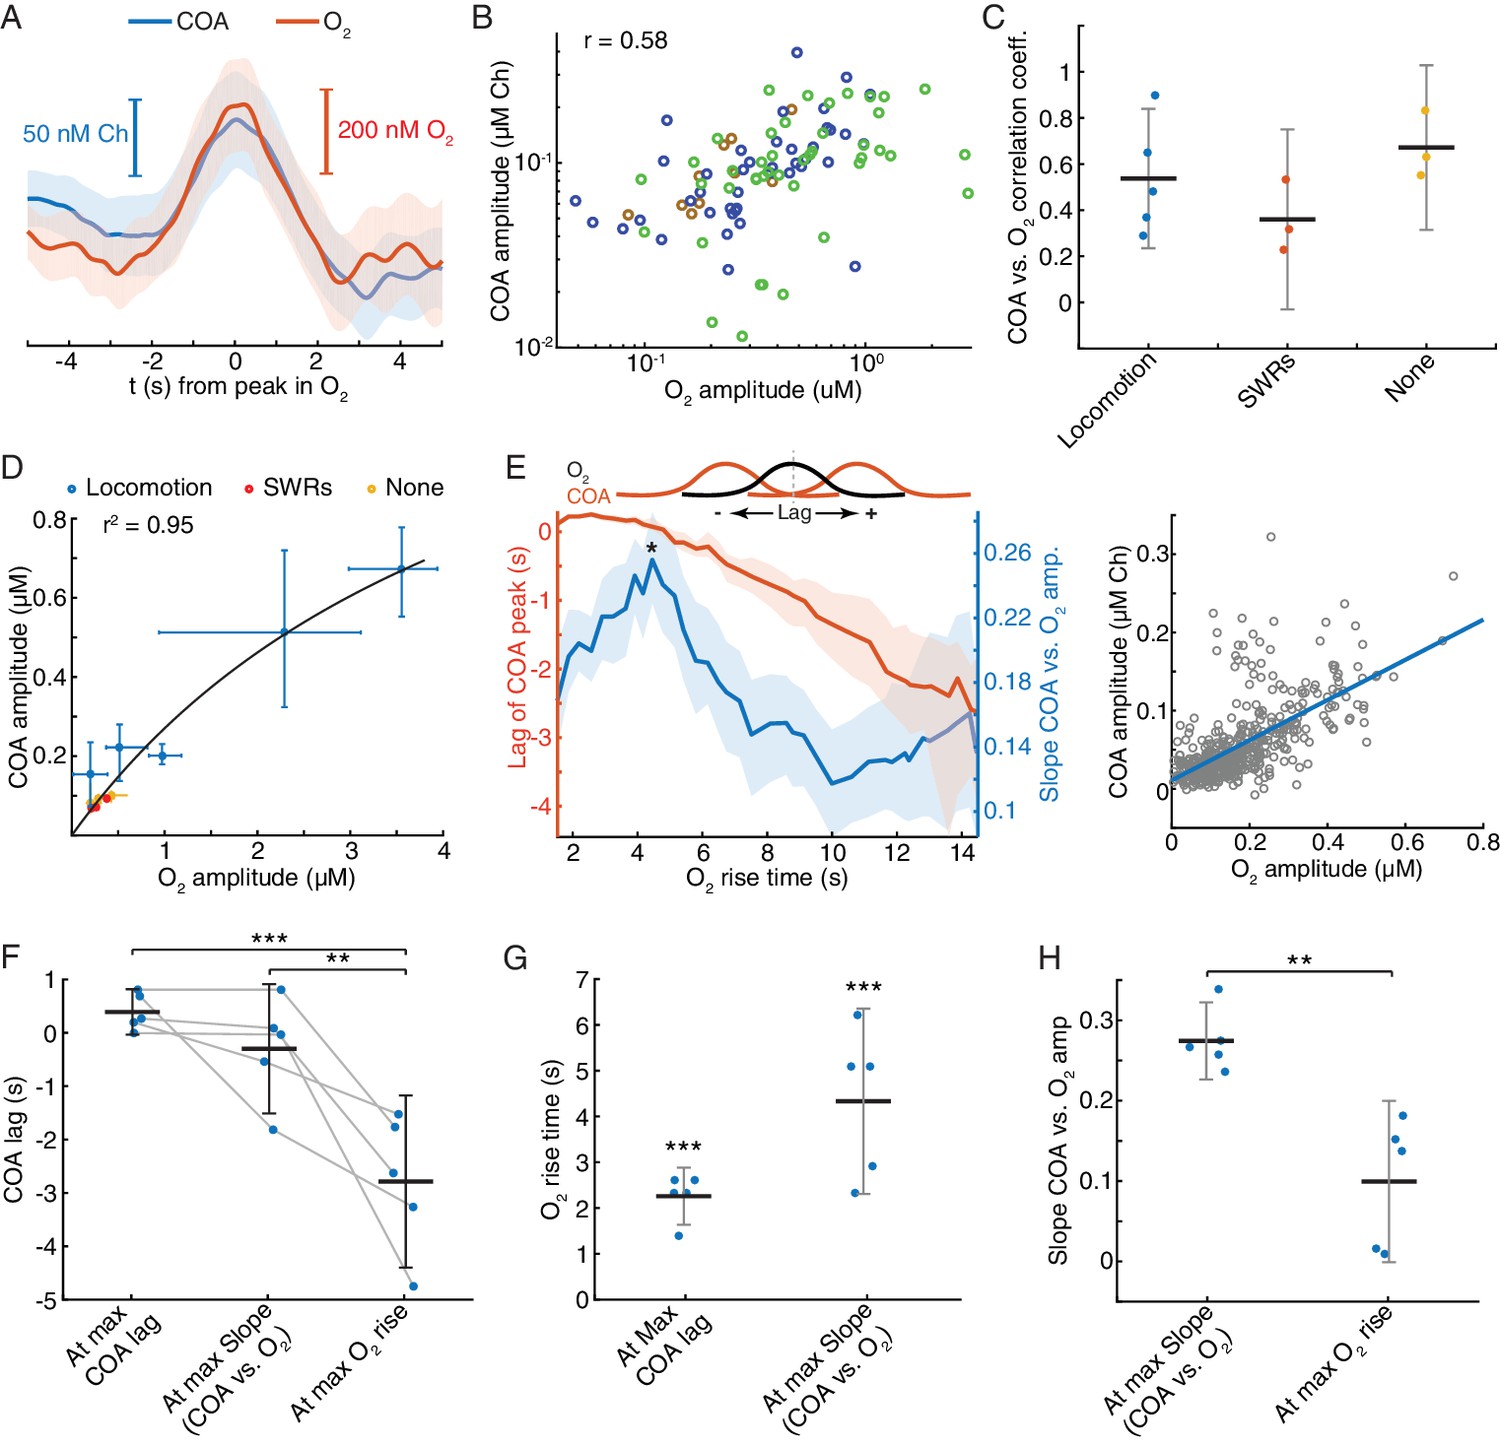
(A) Average COA and O2 dynamics triggered to fast O2 transients (duration ~5 s) detected outside periods when SWRs or locomotion bouts occurred. Data is from one recording session (n = 42 events). (B) Relationship between amplitudes of O2 and associated COA transients outside SWRs/locomotion bouts. Colors represent different recording sessions (n = 10–45 from three recordings, rspearman = 0.58, p<0.0001). (C) Group summary of COA vs. O2 amplitude correlations under different behavioral and/or electrophysiological contexts. (D) COA vs. O2 amplitude across animals and states. Each point represents the median of events from a recording session (error bars are CIs). Data were fitted to the Michaelis-Menten equation (Vmax = 1.58, Km = 4.84). (E) Lag of COA peaks relative to O2 peaks (red) and slope of COA vs. O2 amplitude (blue) for O2 transients with varying rise time for a single session; medians with CIs (left). Right shows the relationship between amplitudes of O2 and associated COA transients for the O2 rise time corresponding to largest slope marked with * on the left panel. (F) Group statistics on maximal COA lags, lags at maximal COA/O2 slope and lags associated with longest O2 transients (ANOVA, F2,12 = 15.22, with post-hoc Tukey test, p=0.51 for max COA lag vs. lag at max COA/O2, p=0.0006 for max COA lag vs. lag at max O2 rise and p=0.0038 for lag at maximal COA/O2 slope vs. lag at max O2 rise). (G) Group statistics on O2 rise times corresponding to maximal COA lags and COA/O2 slope in (E). Values from both groups were significantly lower than the longest O2 rise time observed in a given recording (p<0.0001, one-sample t-test). (H) Group statistics on the slopes of COA vs. O2 amplitude at its maximum value and at maximum O2 rise. Differences between groups were significant (p=0.002, paired t-test). ***p<0.001, **p<0.01. Data were obtained from five recording sessions in three mice and are represented as mean ± CI, except in D.
Figure 7—figure supplement 1
COA dynamics associated with O2 transients across all experiments.
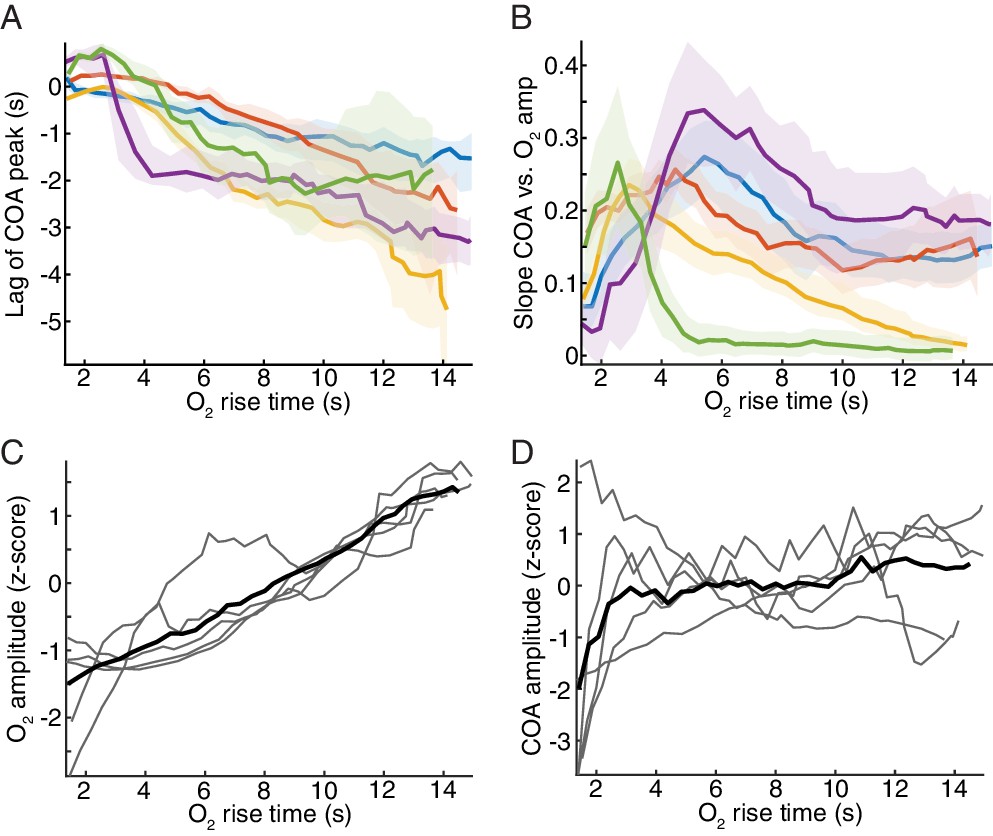
(A–B) plots display the same statistics as in an example on Figure 5E, but for all recordings (A) Lag of ChOx activity peaks relative to O2 for changes in O2 detected with varying rise time (from whole recordings, n = 5). Colors represent data from different recording sessions shown as medians ± CIs. (B) Slope of COA response vs. O2 amplitude for O2 transients detected with a varying rise time. Colors represent data from different recording sessions shown as medians ± CIs. (C) z-scored amplitude of detected O2 peaks as a function of O2 rise time. Each trace represents medians from each recording. (D) z-scored amplitude of COA transients peaks associated with O2 transients as a function of O2 rise time. Each trace represents medians from each recording.
Figure 8 with 1 supplement
Exogeneous O2 elicits phasic COA responses in the hippocampus in vivo.
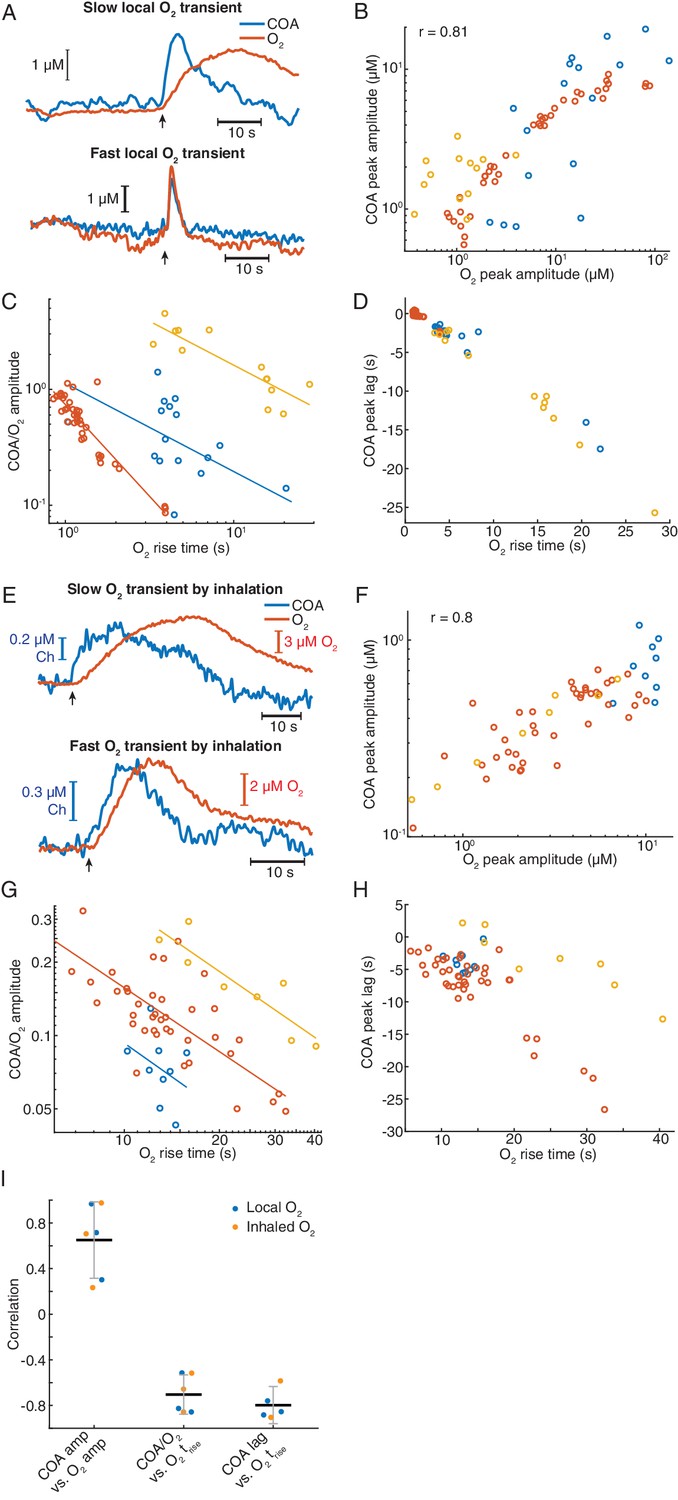
(A) Representative examples of slow and fast O2 transients and associated COA responses evoked by local application of exogenous O2 from a glass micropipette. (B) Amplitudes of COA vs. locally evoked O2 transients. Data are from three recordings (color-coded, n = 13–40 per session). Amplitudes were significantly correlated when pooling all data (rspearman = 0.81, p<0.0001) and within two sessions (p=0.0017 and p<0.0001, analysis not performed in one session due to the narrow range of O2 amplitudes covered). (C) Ratio of COA vs. evoked O2 peak amplitudes as a function of O2 signal rise time. Colors denote recording sessions and trendlines are linear fits performed on data from each session. In all cases, the variables were negatively correlated (p=0.037, p<0.0001, and p<0.001 for each session). (D) Lag of COA relative to locally evoked O2 transient peaks as a function of O2 rise time. Lags significantly decreased with O2 rise time in all sessions (rspearman for each recording ranged from −0.76 to −0.88, p<0.001). (E) Representative traces showing slow and fast transients evoked by O2 inhalation. E-H plots are analogous to A-D, but for O2-inhalation-induced O2 transients. (F) Amplitudes of COA vs. O2 transients. Data were obtained from three recordings (color-coded, n = 8–40 per session). Whole data as well as data from individual experiments were significantly correlated (p<0.0001 and p<0.0005, respectively). (G) Amplitude ratio of COA vs. O2 transients as a function of O2 rise time. Variables were negatively correlated (red and yellow sessions, with rspearman of −0.66 and −0.86 respectively, p<0.0001 and p=0.011). (H) Lags of COA relative to O2 peaks significantly decreased as a function of O2 rise time (red and yellow sessions, rspearman of −0.58 and −0.90 respectively, p<0.0001 and p=0.0046). Analysis in F-H not performed in one session (blue dots) due to insufficient coverage of O2 amplitudes and rise times. (I) Summary of amplitude and COA-O2 lags correlations for COA and O2 transients evoked by local O2 application and O2 inhalation. Data were obtained from six recording sessions in five mice and are presented as means ± CIs.
Figure 8—figure supplement 1
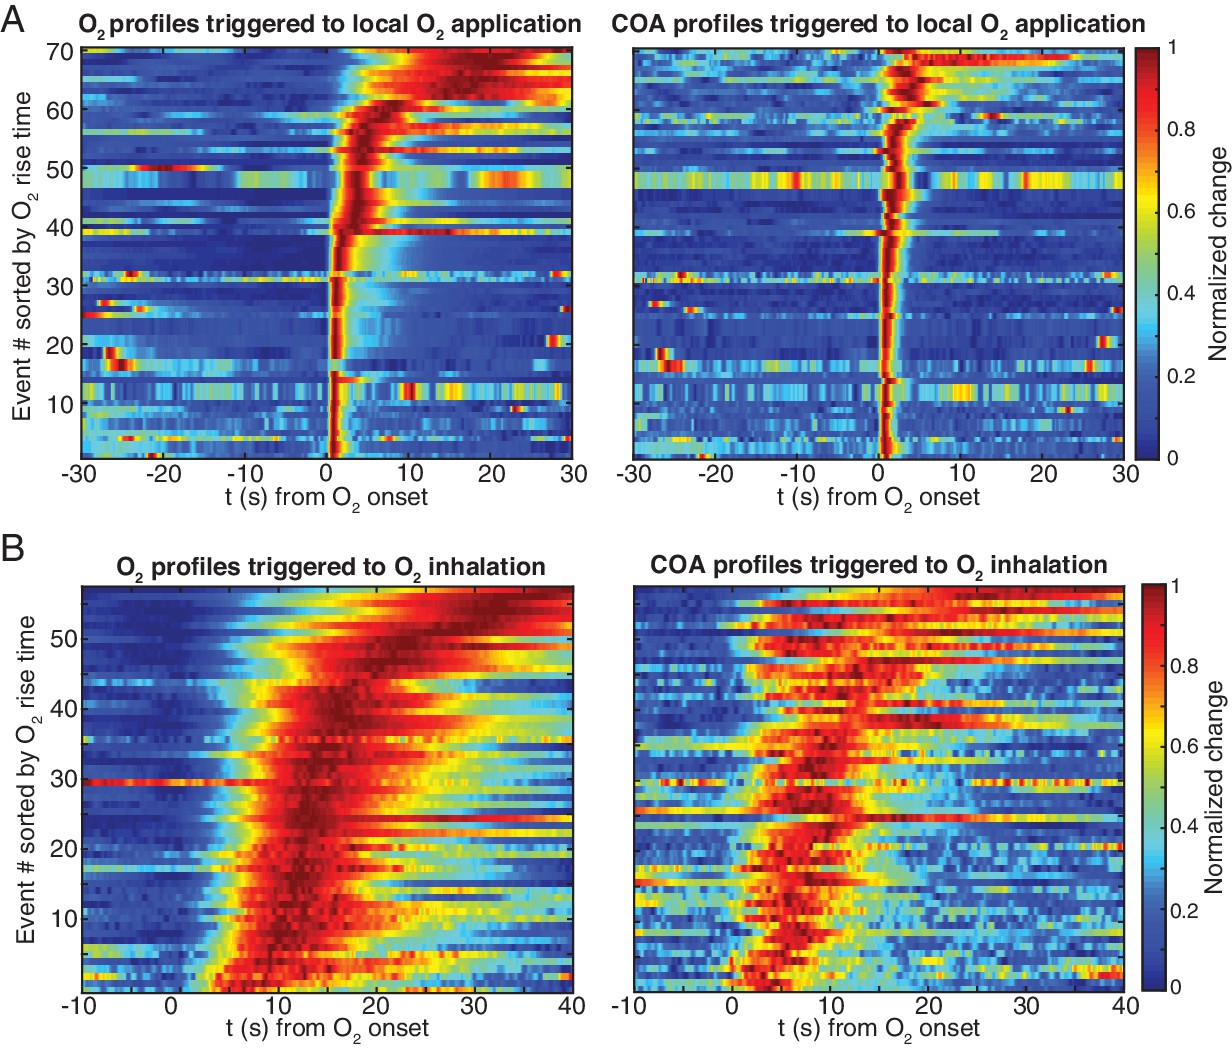
Raw sensor responses evoked by exogenous oxygen in vivo.
(A) Normalized O2 and COA transients evoked by local O2 application, sorted by O2 rise time. Events were obtained from three recording sessions (n = 13–40 per session). (B) Normalized O2 and COA transients evoked by O2 inhalation, sorted by O2 rise time. Events were obtained from three recording sessions (n = 8–40 per session).
Tables
Table 1
Analytical properties of TACO sensors.
| Individual sites’ analytical properties | ||||||
|---|---|---|---|---|---|---|
| Channel type | Ch sensitivity (pA/µM) | Ch sensitivity (nA µM−1 cm−2) | H2O2 sensitivity (pA/µM) | DA sensitivity (pA/µM) | AA sensitivity (pA/µM) | Impedance (GΩ) |
| Au/Pt/m-PD | 2.45 ± 0.70 (n = 10) | 1081 ± 309 (n = 10) | 2.48 ± 0.93 (n = 8) | 0.15 ± 0.23(n = 10) | 0.02 ± 0.013(n = 10) | 2.90 ± 0.48 (n = 5) |
| Au/Pt | 2.54 ± 0.64 (n = 8) | 1118 ± 283 (n = 8) | 2.86 ± 1.10 (n = 6) | 7.48 ± 1.86(n = 8) | 0.22 ± 0.20(n = 8) | 3.38 ± 0.56 (n = 5) |
| Au/m-PD | 0.27 ± 0.12 (n = 10) | 118.2 ± 53 (n = 10) | 0.22 ± 0.16 (n = 8) | 0.13 ± 0.23 (n = 10) | 0.007 ± 0.004 (n = 10) | 3.11 ± 0.77 (n = 5) |
| Au | 0.25 ± 0.086 (n = 9) | 111.5 ± 38 (n = 10) | 0.29 ± 0.08 (n = 7) | 8.24 ± 1.84 (n = 9) | 0.19 ± 0.16 (n = 9) | 3.65 ± 0.59 (n = 5) |
| Analytical properties for COA measurement (Au/Pt/m-PD - Au/m-PD) | ||||||
|---|---|---|---|---|---|---|
| Ch sensitivity (pA/µM) | Limit of detection (nM) | Linearity, [Ch]<30 µM (R2) | Response time (s) | DA sensitivity (pA/µM), selectivity ratio | AA sensitivity (pA/µM), selectivity ratio | |
| 2.18 ± 0.73 (n = 10) | 28 ± 0.011 (n = 10) | 0.9996 ± 0.0003 (n = 10) | 1.4 ± 0.4 (n = 10) | 0.022 ± 0.38 (n = 10), 101:1 | 0.013 ± 0.012 (n = 10), 169:1 | |
-
The data are given as the mean ± CI (95%).
The number of sensors tested is given in parentheses. Data were collected from calibrations on the day after m-PD electropolymerization.
Key resources table
| Reagent type (species) or resource | Designation | Source or reference | Identifiers | Additional information |
|---|---|---|---|---|
| Chemical compound, drug | Chitosan | Sigma-Aldrich | 448869 | |
| Chemical compound, drug | Chloroplatinic acid hydrate | Sigma-Aldrich | 520896 | |
| Chemical compound, drug | Choline chloride | Sigma-Aldrich | C7017 | |
| Chemical compound, drug | Choline oxidase from Alcaligenes sp. | Sigma-Aldrich | C5896 | |
| Chemical compound, drug | Dopamine hydrochloride | Sigma-Aldrich | H8502 | |
| Chemical compound, drug | Gold chloride solution | Sigma-Aldrich | HT1004 | |
| Chemical compound, drug | Hydrogen peroxide | Sigma-Aldrich | 216763 | |
| Chemical compound, drug | m-Phenylenediamine | Sigma-Aldrich | P23954 | |
| Chemical compound, drug | p-Benzoquinone | Sigma-Aldrich | B10358 | |
| Chemical compound, drug | Sodium-L-Ascorbate | Sigma-Aldrich | A7631 |
Table 2
Values of constants used in the biosensor model.
| Constant | Value | Reference |
|---|---|---|
| kf* | 2 × 10⁶ M−1 s−1 | Fan and Gadda, 2005 |
| kr* | 580 s−1 | Fan and Gadda, 2005 |
| k1 | 93 s−1 | Fan and Gadda, 2005 |
| k2 | 8.64 × 10⁴ M−1 s−1 | Fan and Gadda, 2005 |
| k3 | 135 s−1 | Fan and Gadda, 2005 |
| k4 | 5.34 × 10⁴ M−1 s−1 | Fan and Gadda, 2005 |
| k5 | 200 s−1 | Fan and Gadda, 2005 |
| DCh† | 1197 μm2 s−1 | Valencia and González, 2012 |
| DO2‡ | 2500 μm2 s−1 | Santos et al., 2011 |
| DH2O2 | 1830 μm2 s−1 | van Stroe-Biezen et al., 1993 |
| α | 0.8 |
-
* Estimated based on Kd, Kcat and Km values of ChOx for choline.
†Estimated using the Stokes−Einstein Gierer-Wirtz Estimation method.
-
‡Extrapolated from room temperature to 37°C using a factor of 2.6% per degree (Han and Bartels, 1996).
Additional files
Download links
A two-part list of links to download the article, or parts of the article, in various formats.
Downloads (link to download the article as PDF)
Open citations (links to open the citations from this article in various online reference manager services)
Cite this article (links to download the citations from this article in formats compatible with various reference manager tools)
Phasic oxygen dynamics confounds fast choline-sensitive biosensor signals in the brain of behaving rodents
eLife 10:e61940.
https://doi.org/10.7554/eLife.61940


