Rapid adaptation of endocytosis, exocytosis, and eisosomes after an acute increase in membrane tension in yeast cells
- Department of Molecular Biophysics and Biochemistry, Nanobiology Institute, Yale University, United States
- Nanobiology Institute, Yale University, United States
- Department of Cell Biology, Yale University School of Medicine, United States
Figures
Figure 1
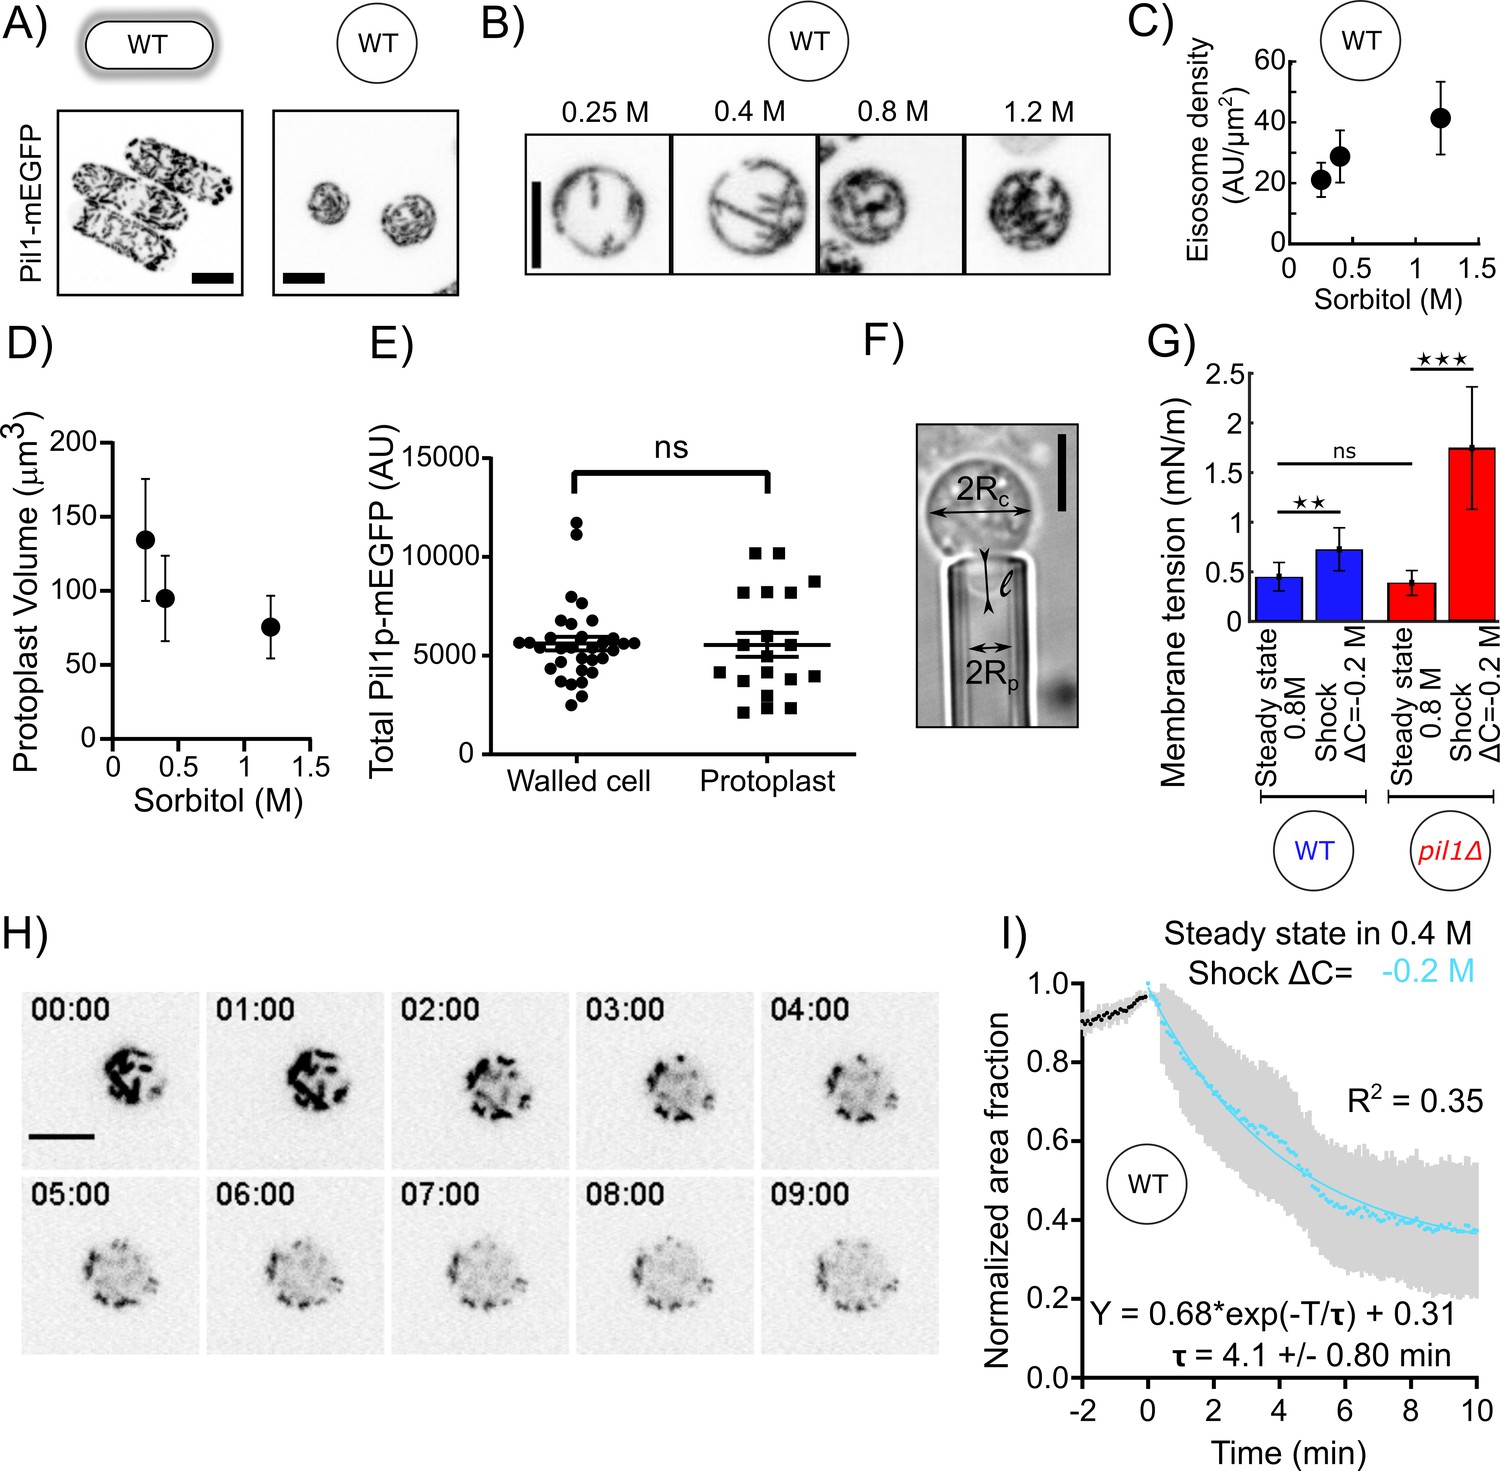
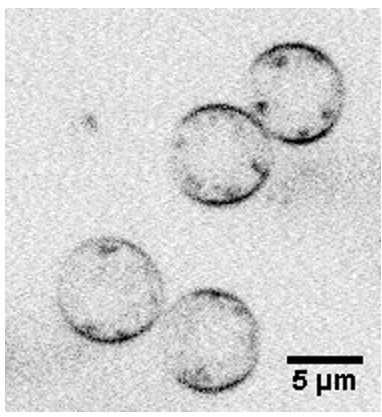
Eisosomes disassemble to buffer increases in membrane tension.
(A) Representative walled yeast cells (left column) and protoplasts (right column) at steady state in 1.2 M sorbitol expressing eisosome core protein Pil1-mEGFP (inverted contrast). Note that the cellular concentration of Pil1p-mEGFP is the same in walled cells and protoplasts (panel E). (B) Eisosomes labeled with Pil1p-mEGFP (inverted contrast) in wild-type protoplasts at steady state in different sorbitol concentrations. From left to right: 0.25, 0.4, 0.8, and 1.2 M sorbitol. (C and D) Density of eisosomes at the plasma membrane (C), measured as the ratio between the intensity of Pil1p-mEGFP on the plasma membrane and the surface area of the protoplast and volume (D), at steady state in 0.25 M (N = 26), 0.4 M (N = 34), and 1.2 M (N = 39) sorbitol. Error bars: standard deviations. (E) The total amount of Pil1-mEGFP in walled cells (N = 32) and protoplasts in 0.4 M sorbitol (N = 19) are not significantly different (Mann-Whitney test, p=0.65). Each point represents one measurement; bars are the mean and SEM. (F) Micropipette aspiration was used to measure membrane tension. Rc: cell radius; Rp: micropipette radius; l: length of the tongue inside the micropipette. (G) Membrane tension of protoplasts at steady state in 0.8 M sorbitol and ~5 min after a hypotonic shock (ΔC = −0.2 M) for wild-type (blue bars, N = 28 for steady state and N = 5 for the shock) and pil1Δ protoplasts (red bars, N = 42 for steady state and N = 7 for the shock). Error bars: standard deviation. p-values: non-significant (ns), p>0.05; **p≤0.01; ***p≤0.001. (H and I) Eisosomes of wild-type protoplasts disassemble rapidly after a hypotonic shock. (H) Time course of a representative protoplast expressing Pil1p-mEGFP over 10 min after a hypotonic shock (ΔC = −0.2 M) and initially at steady state in 0.4 M sorbitol (just before time 0 min). (I) Evolution of the surface area covered by eisosomes over time, as a fraction of the surface area covered at time 0 min (normalized to 1). Data are from three independent experiments (N = 15) and presented as mean ± 95% confidence interval. Scale bars in (A), (B), (F), and (H): 5 µm.
-
Figure 1—source data 1
Data for Figure 1C and 1D.
- https://cdn.elifesciences.org/articles/62084/elife-62084-fig1-data1-v2.xlsx
-
Figure 1—source data 2
Data for Figure 1E.
- https://cdn.elifesciences.org/articles/62084/elife-62084-fig1-data2-v2.xlsx
-
Figure 1—source data 3
Data for Figure 1G.
- https://cdn.elifesciences.org/articles/62084/elife-62084-fig1-data3-v2.xlsx
-
Figure 1—source data 4
Data for Figure 1I.
- https://cdn.elifesciences.org/articles/62084/elife-62084-fig1-data4-v2.xlsx
Figure 2 with 1 supplement
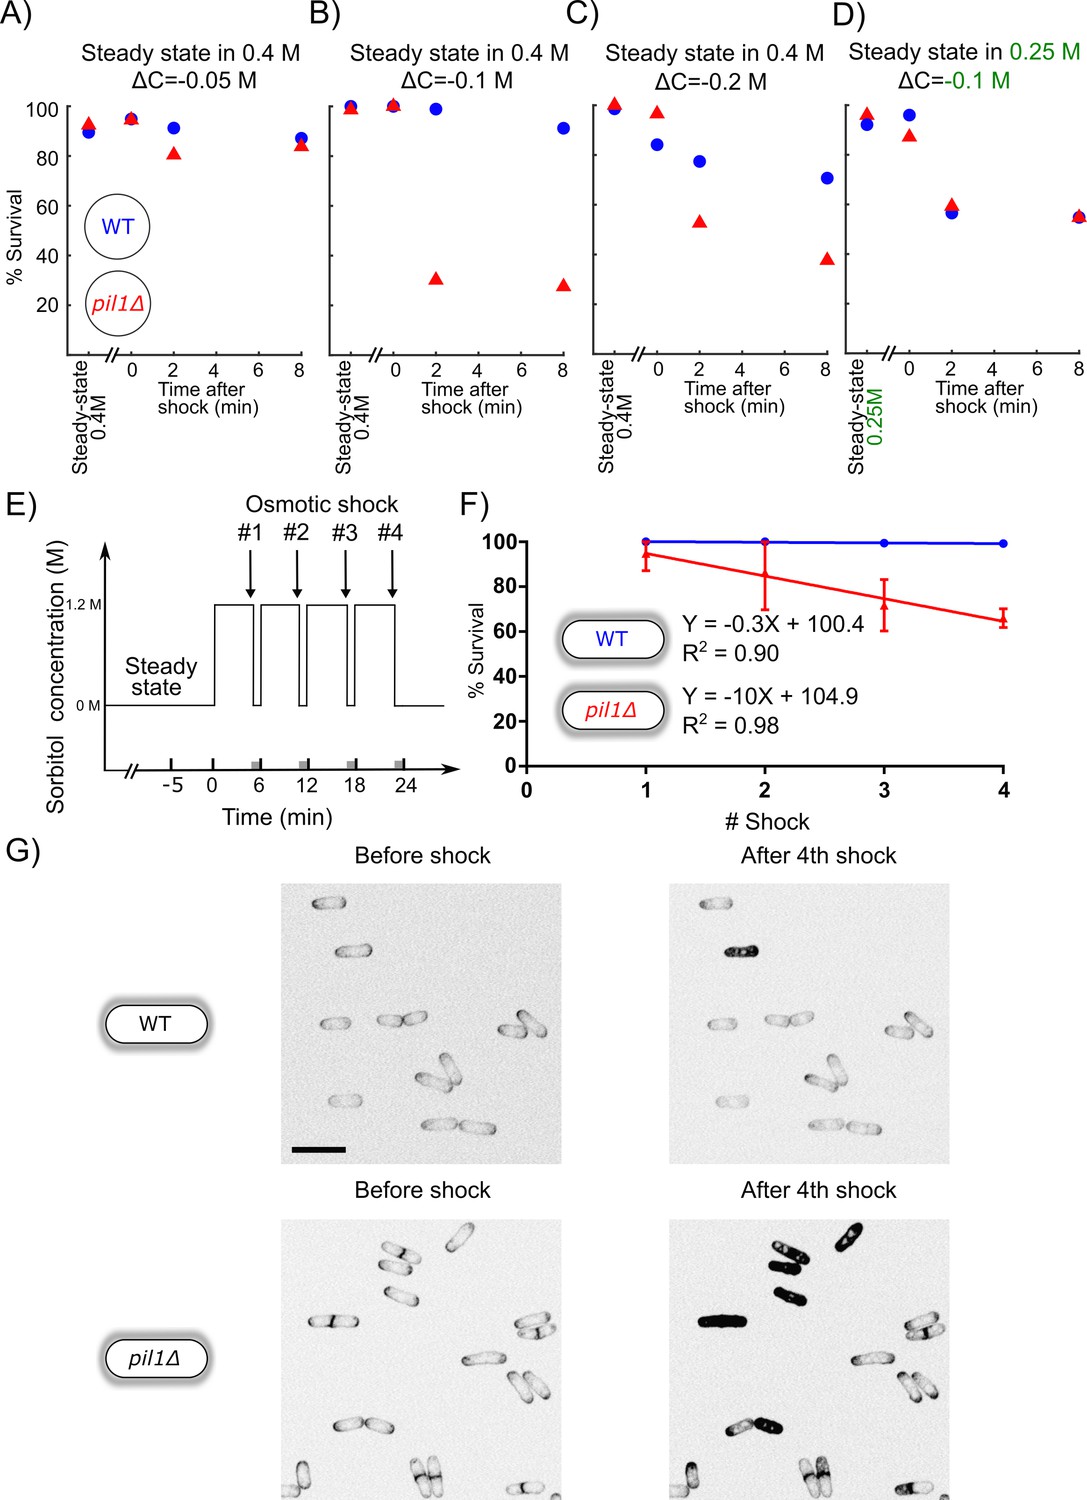
Eisosomes protect protoplasts and walled cells from osmotic shocks.
(A–C) Percentage of wild-type (blue dots) and pil1Δ (red triangle) protoplasts that were alive at steady state in 0.4 M sorbitol, and after a ΔC = −0.05 M (A), ΔC = −0.1 M (B), and ΔC = −0.2 M (C) single hypotonic shock. Representative fields of view used to determine these percentages are shown in Figure 2—figure supplement 1. (D) Percentage of wild-type (blue dots) and pil1Δ (red triangles) protoplasts that were alive at steady state in 0.25 M sorbitol, and after a ΔC = −0.1 M hypotonic shock. In these conditions, before the shock, eisosomes in wild-type protoplasts were almost completely disassembled (Figure 1B). After the shock, wild-type cell survival was comparable to cells void of eisosomes because they lack Pil1p. (E) Timeline of repeated ΔC = 1.2 M osmotic shocks for walled cells. Each osmotic shock was performed by exchanging sorbitol concentration from 1.2 M (5 min) to 0 M (1 min). (F) Percentage of wild-type (blue dots, N = 273) and pil1Δ (red triangle, N = 197) walled cells that were alive after each osmotic shock. Note the progressive cell death induced by repeated osmotic shocks for pil1Δ cells. Combined data are from three independent experiments and plotted as mean ± standard deviation. (G) Representative images of wild-type (upper panel) and pil1Δ (lower panel) walled cells before shock and after the fourth shock. Dead cells were strongly stained by FM4-64 due to membrane damage. Scale bar: 10 µm.
-
Figure 2—source data 1
Data for Figure 2A.
- https://cdn.elifesciences.org/articles/62084/elife-62084-fig2-data1-v2.xlsx
-
Figure 2—source data 2
Data for Figure 2B.
- https://cdn.elifesciences.org/articles/62084/elife-62084-fig2-data2-v2.xlsx
-
Figure 2—source data 3
Data for Figure 2C.
- https://cdn.elifesciences.org/articles/62084/elife-62084-fig2-data3-v2.xlsx
-
Figure 2—source data 4
Data for Figure 2D.
- https://cdn.elifesciences.org/articles/62084/elife-62084-fig2-data4-v2.xlsx
-
Figure 2—source data 5
Data for Figure 2E.
- https://cdn.elifesciences.org/articles/62084/elife-62084-fig2-data5-v2.xlsx
Figure 2—figure supplement 1
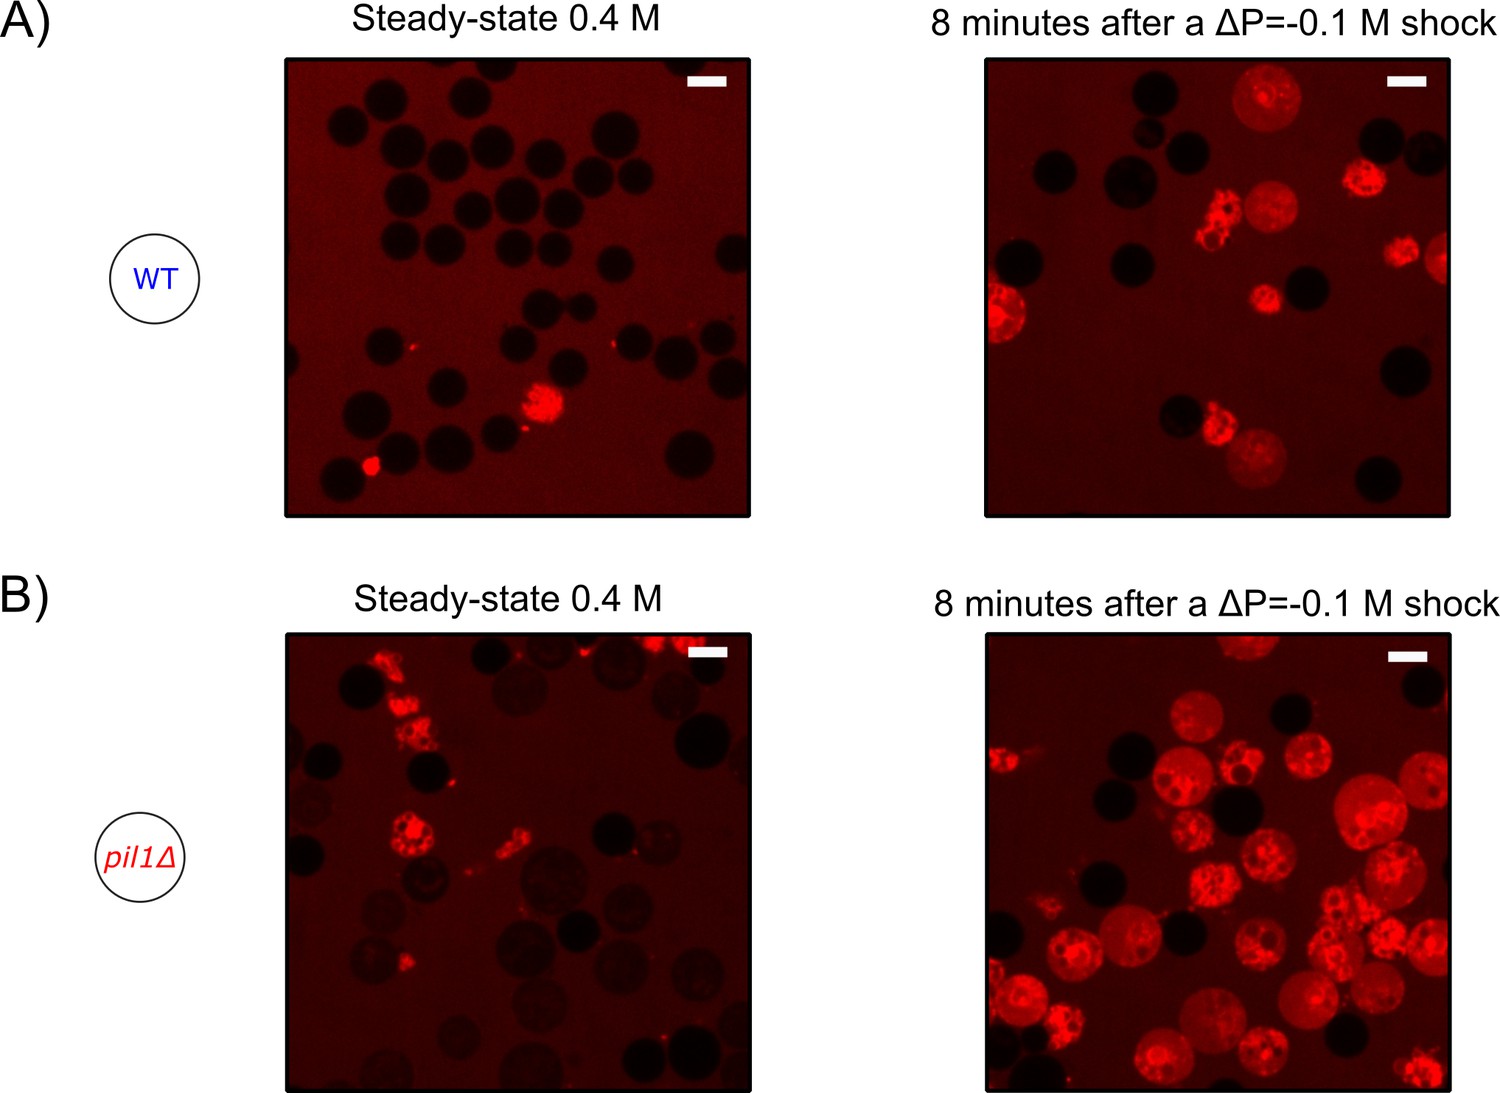
Typical fields of view of protoplasts at steady state in 0.4 M sorbitol and 8 min after a ΔC = −0.1 M hypotonic shock.
(A) Wild-type. (B) pil1Δ. Cells are considered alive if they do not contain any red fluorescence from the sulforhodamin B dye. Scale bar: 5 µm.
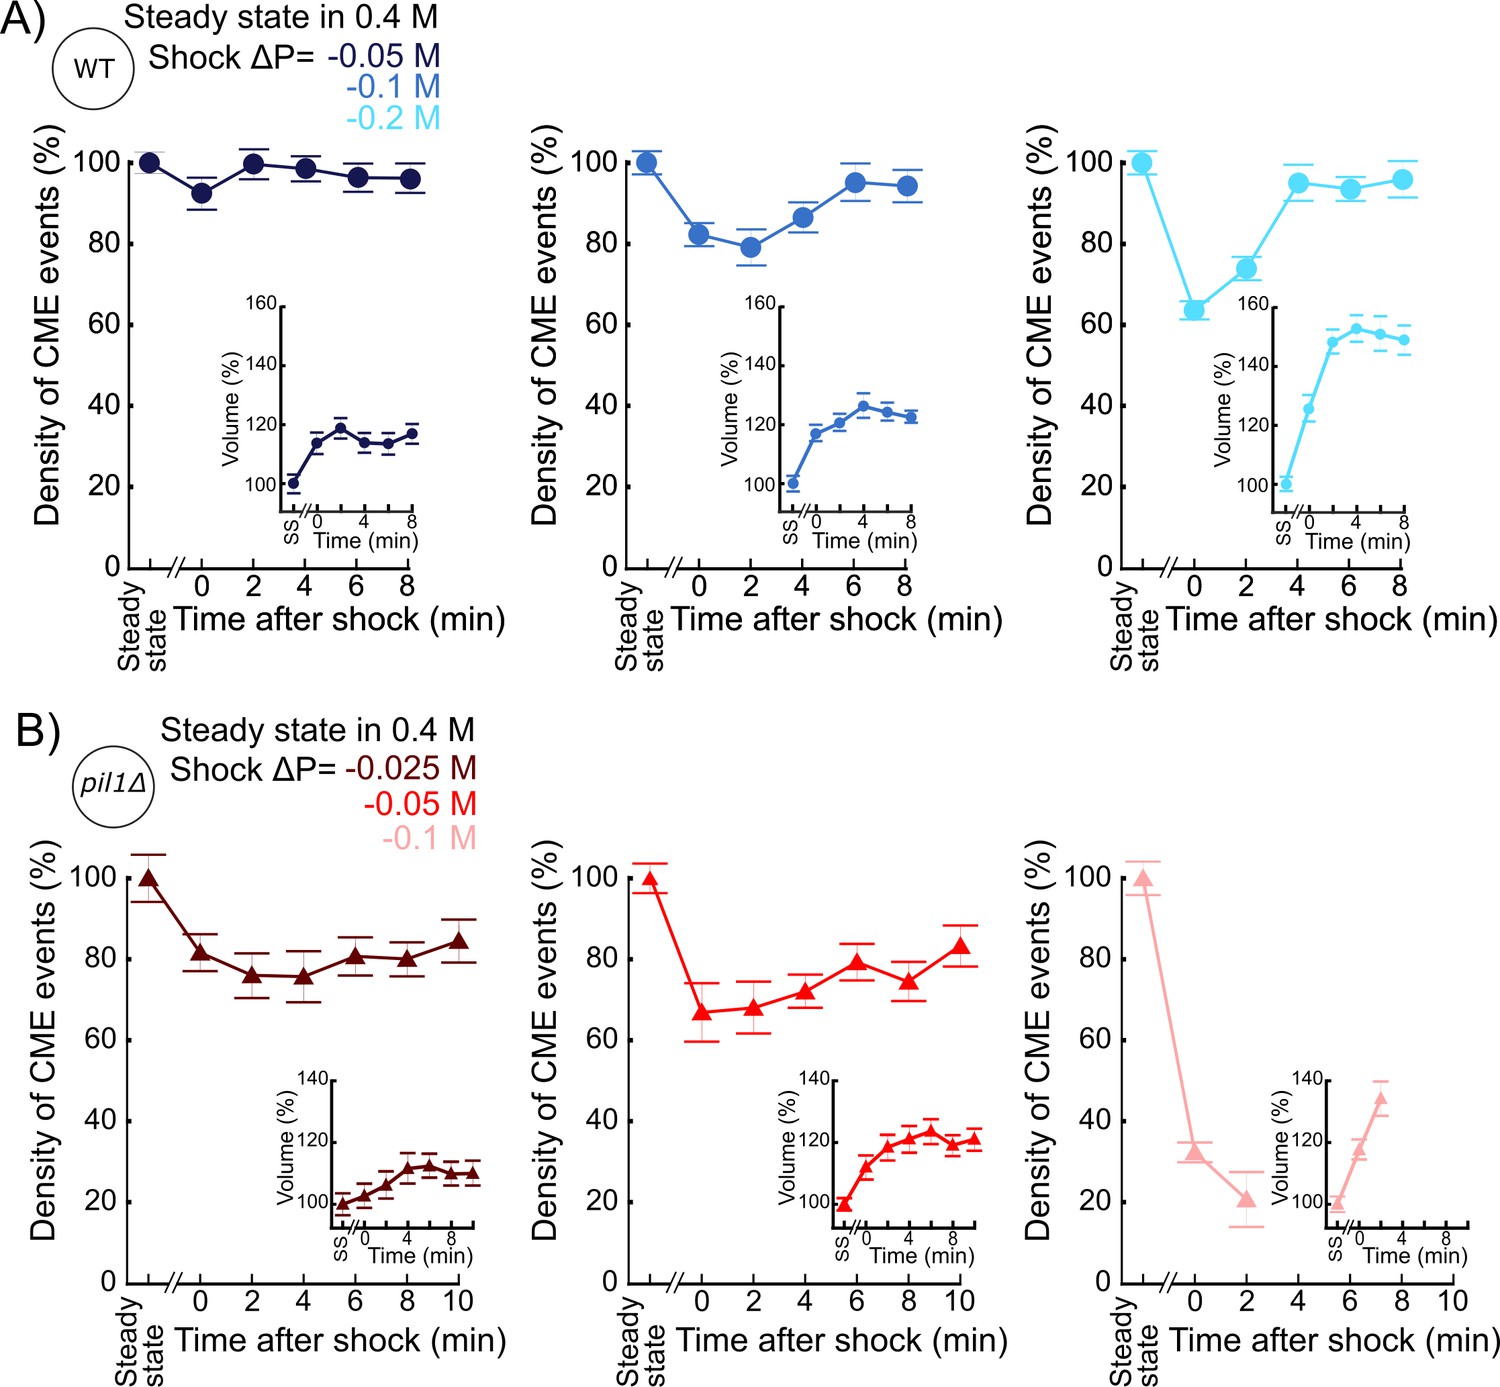
Figure 3 with 1 supplement

The density of endocytic events rapidly adapts after acute osmotic shocks.
(A) Temporal evolution of density of endocytic events (average number of endocytic events at a given time in a cell divided by the cell length) in wild-type protoplasts initially at steady state in 0.4 M sorbitol and after an acute hypotonic shock of ΔC = −0.05 M (dark blue, Ncell ≥ 102), ΔC = −0.1 M (blue, Ncell ≥ 54), and ΔC = −0.2 M (light blue, Ncell ≥ 83). For ΔC = −0.1 and −0.2 M, the difference in the density of clathrin-mediated endocytosis (CME) events between steady state and 0 or 2 min after the shock is statistically significant (one-way ANOVA, p<10−4). In all conditions, the difference after 6 min is not significant (one-way ANOVA, p>0.12; details in Figure 3—source data 1). (B) Same as (A) but with pil1Δ protoplasts and hypotonic shocks of ΔC = −0.025 M (dark red, Ncell ≥ 70), ΔC = −0.05 M (red, Ncell ≥ 103), and ΔC = −0.1 M (light red, Ncell ≥ 78). In all conditions, the difference in the density of CME events between steady- state and any time after the shock is statistically significant (one-way ANOVA, p<10−3). For ΔC = −0.025 and −0.05 M, the differences between time points after 6 min are not significant (one-way ANOVA, p>0.09; details in Figure 3—source data 2). (A and B) Insets: relative volume increase after the hypotonic shocks (the volume at steady state is used as a reference). The numbers of cells used for each condition and each time point are given in Supplementary file 1a. The number of cells measured in the insets is the same as that in the main figures. *: the large majority of pil1Δ protoplasts were too damaged or dead 4 min after the hypotonic shocks at ΔC = −0.1 M (Figure 2B), which prevented us to measure the density of endocytic events and the volume after this time point. (C) Density of endocytic events in intact cells at steady state in different osmolarities, Ncell ≥ 80. In pil1Δ walled cells, the difference in the density of CME events between all pairs of conditions is statistically significant (one-way ANOVA, p<10−4). In wild-type walled cells, the difference is small but statistically significant (details in Figure 3—source data 3). The numbers of cells used for each condition and each time point are given in Supplementary file 1b. (D) Density of endocytic events in wild-type (blue circle) and pil1Δ (red triangle) walled cells initially at steady state in 1.2 M sorbitol and after an acute hypotonic shock of ΔC = −1.2 M, Ncell ≥ 44. The numbers of cells used for each condition and each time point are given in Supplementary file 1c. For wild-type and pil1Δ walled cells, the differences in the density of CME events after 2 min are not statistically significant (p>0.08; details in Figure 3—source data 4). (A), (B), (C), and (D): error bars are standard errors of the mean.
-
Figure 3—source data 1
Data for Figure 3A.
- https://cdn.elifesciences.org/articles/62084/elife-62084-fig3-data1-v2.xlsx
-
Figure 3—source data 2
Data for Figure 3B.
- https://cdn.elifesciences.org/articles/62084/elife-62084-fig3-data2-v2.xlsx
-
Figure 3—source data 3
Data for Figure 3C.
- https://cdn.elifesciences.org/articles/62084/elife-62084-fig3-data3-v2.xlsx
-
Figure 3—source data 4
Data for Figure 3D.
- https://cdn.elifesciences.org/articles/62084/elife-62084-fig3-data4-v2.xlsx
Figure 3—figure supplement 1
Separate plots for each condition shown in Figure 3A and B.
(A) Temporal evolution of density of endocytic events (average number of endocytic events at a given time in a cell divided by the cell length) in wild-type protoplasts initially at steady state in 0.4 M sorbitol and after an acute hypotonic shock of ΔC = −0.05 M (dark blue, Ncell ≥ 102), ΔC = −0.1 M (blue, Ncell ≥ 54), and ΔC = −0.2 M (light blue, Ncell ≥ 83). (B) Same as (A) but with pil1Δ protoplasts and hypotonic shocks of ΔC = −0.025 M (dark red, Ncell ≥ 70), ΔC = −0.05 M (red, Ncell ≥ 103), and ΔC = −0.1 M (light red, Ncell ≥ 78). (A and B) Insets: relative volume increase after the hypotonic shocks (the volume at steady state is used as a reference). The number of cells used for each condition and each time point is given in Supplementary file 1a. The number of cells measured in the insets is the same as in the main figures. (A and B) Error bars are standard errors of the mean. The number of cells used for each condition and each time point is given in Supplementary file 1b.
Figure 4 with 1 supplement
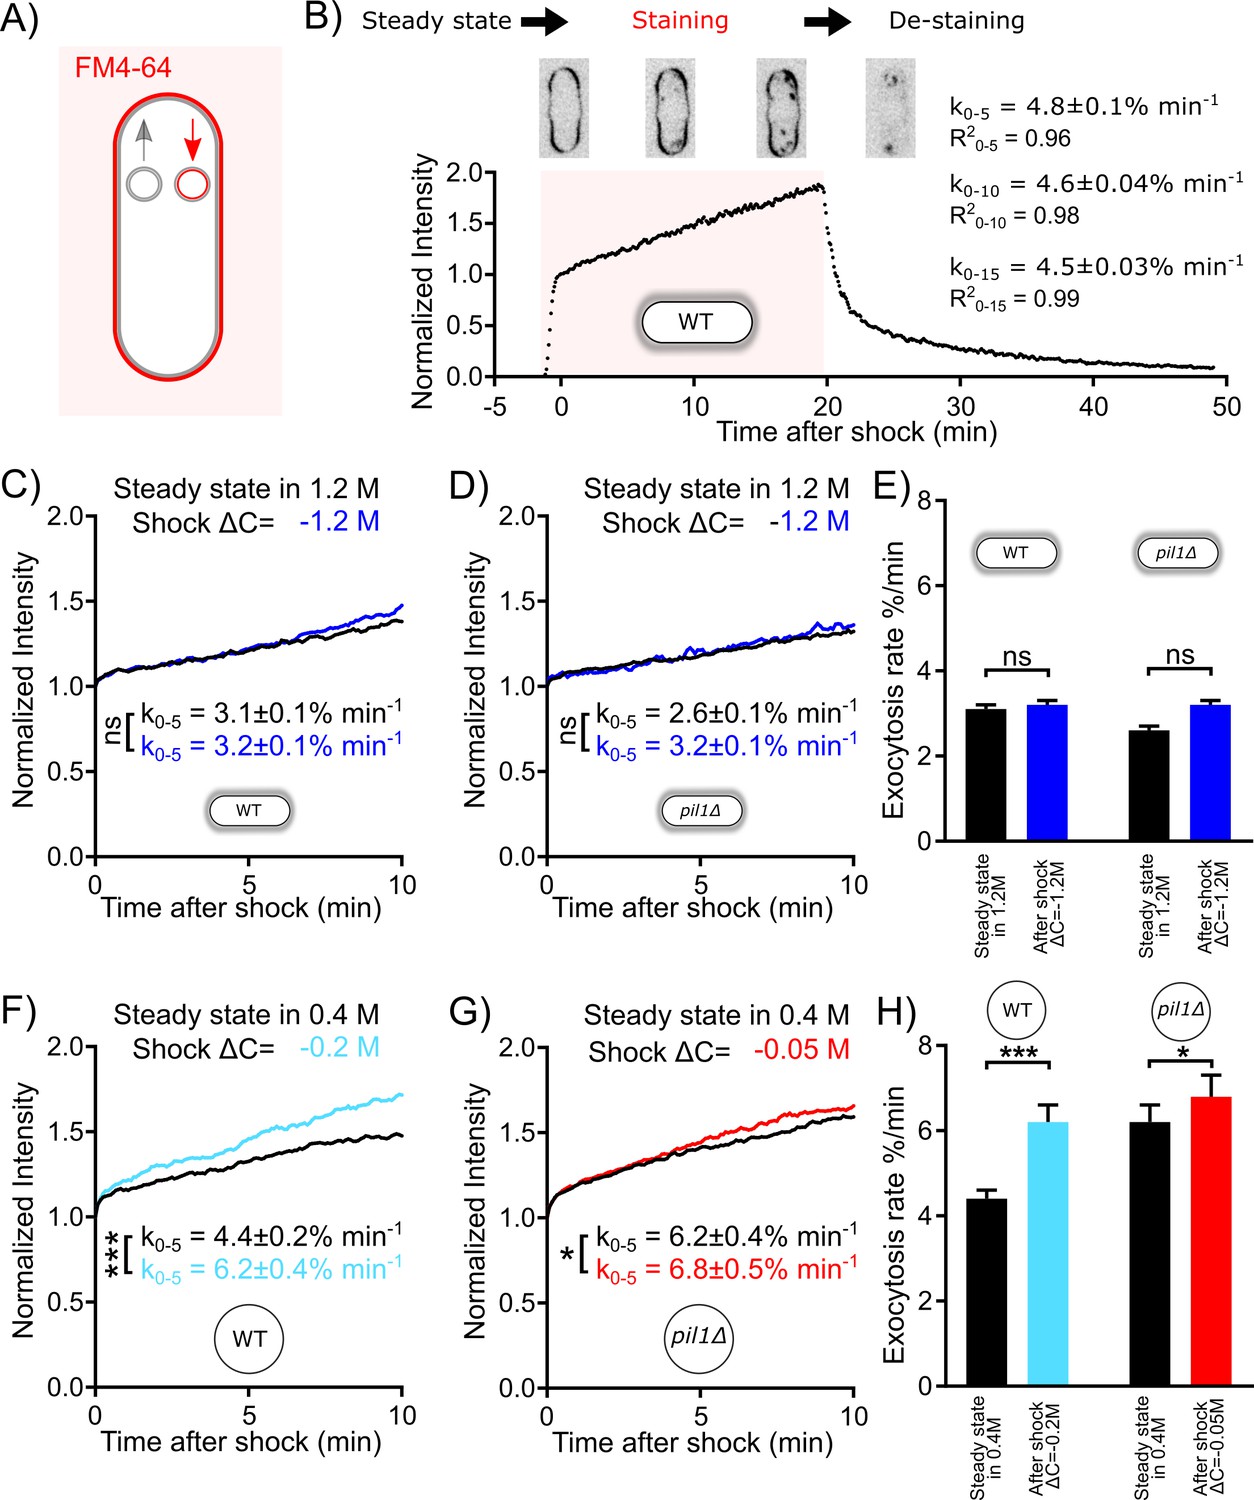
Exocytosis rate increases after an acute change in membrane tension in protoplasts but not in walled cells.
(A) Rationale of measurement of whole cell exocytosis rate through FM4-64 staining. After FM4-64 is flown in the imaging chamber, the dye rapidly binds to the cell surface in less than a minute. After this initial phase, the whole cell fluorescence increases every time the new (unlabeled) internal membrane is exposed to the cell surface by exocytosis. Note that endocytic events do not change the total fluorescence measured. (B) Measurement of yeast cell exocytosis rate at steady state in 0 M sorbitol. Cells were stained with 20 µM FM4-64 in Edinburgh Minimum Media (EMM5S) for 20 min before washing with EMM5S. During FM4-64 staining, the fluorescence intensity increases rapidly for 1 min before entering a slow linear phase over at least 20 min for wild-type cells. The fluorescence intensity at the end of the initial rapid increase phase corresponds to the complete staining of cell surface. It was normalized to 1, so that the subsequent increase in fluorescence intensity corresponds to a percentage of the plasma membrane surface area. After the dye was removed 20 min later, the decrease in fluorescence intensity suggests that the incorporation of FM4-64 didn’t interfere with the vesicle trafficking pathway of the cell. The rate of exocytosis (measured as a percentage of the plasma membrane surface area per minute) is the slope of a linear fit of the measured signal over the first 5 min (k0-5), 10 min (k0-10), or 15 min (k0-15). Example images of stained cells at different time points are shown in the middle panel (inverted contrast). (C–H) Rates of exocytosis at steady state and after hypotonic shocks. (C and D) The exocytic rate of wild-type walled cells is not changed after a ΔC = −1.2 M acute hypotonic shock (black, before shock, Ncells = 79; blue, after shock, Ncells = 68; three replicates each). The exocytic rate of pil1Δ walled cells does not change significantly in the same conditions (black, before shock, Ncells = 60; blue, after shock, Ncells = 96; three replicates each). All walled cells were at steady state in 1.2 M sorbitol before time 0 min. Curves for individual conditions in panels (C) and (D) are plotted in Figure 4—figure supplements 1A,B, respectively. (E) Summary of exocytic rates for wild-type and pil1Δ walled cells before and after hypotonic shock. (F and G) The exocytic rate of wild-type and pil1Δ protoplasts increases after ΔC = −0.2 M (black, before shock, Ncells = 20; light blue, after shock, Ncells = 37; four replicates each) and ΔC = −0.05 M (black, before shock, Ncells = 44; red, after shock, Ncells = 60; four replicates each) acute hypotonic shocks, respectively. Before time 0 min, all protoplasts were at steady state in 0.4 M sorbitol. Curves for individual conditions in panels (F) and (G) are plotted in Figure 4—figure supplements 1C,D, respectively. (H) Summary of exocytic rates for wild-type and pil1Δ protoplasts before and after hypotonic shock. (C–H) Data from at least three independent experiments were pooled together to produce each curve. p-values: non-significant (ns), p>0.05; *p≤0.05; ***p≤0.001.
-
Figure 4—source data 1
Data for Figure 4B.
- https://cdn.elifesciences.org/articles/62084/elife-62084-fig4-data1-v2.xlsx
-
Figure 4—source data 2
Data for Figure 4C.
- https://cdn.elifesciences.org/articles/62084/elife-62084-fig4-data2-v2.xlsx
-
Figure 4—source data 3
Data for Figure 4D.
- https://cdn.elifesciences.org/articles/62084/elife-62084-fig4-data3-v2.xlsx
-
Figure 4—source data 4
Data for Figure 4E.
- https://cdn.elifesciences.org/articles/62084/elife-62084-fig4-data4-v2.xlsx
-
Figure 4—source data 5
Data for Figure 4F.
- https://cdn.elifesciences.org/articles/62084/elife-62084-fig4-data5-v2.xlsx
-
Figure 4—source data 6
Data for Figure 4G.
- https://cdn.elifesciences.org/articles/62084/elife-62084-fig4-data6-v2.xlsx
-
Figure 4—source data 7
Data for Figure 4H.
- https://cdn.elifesciences.org/articles/62084/elife-62084-fig4-data7-v2.xlsx
Figure 4—figure supplement 1
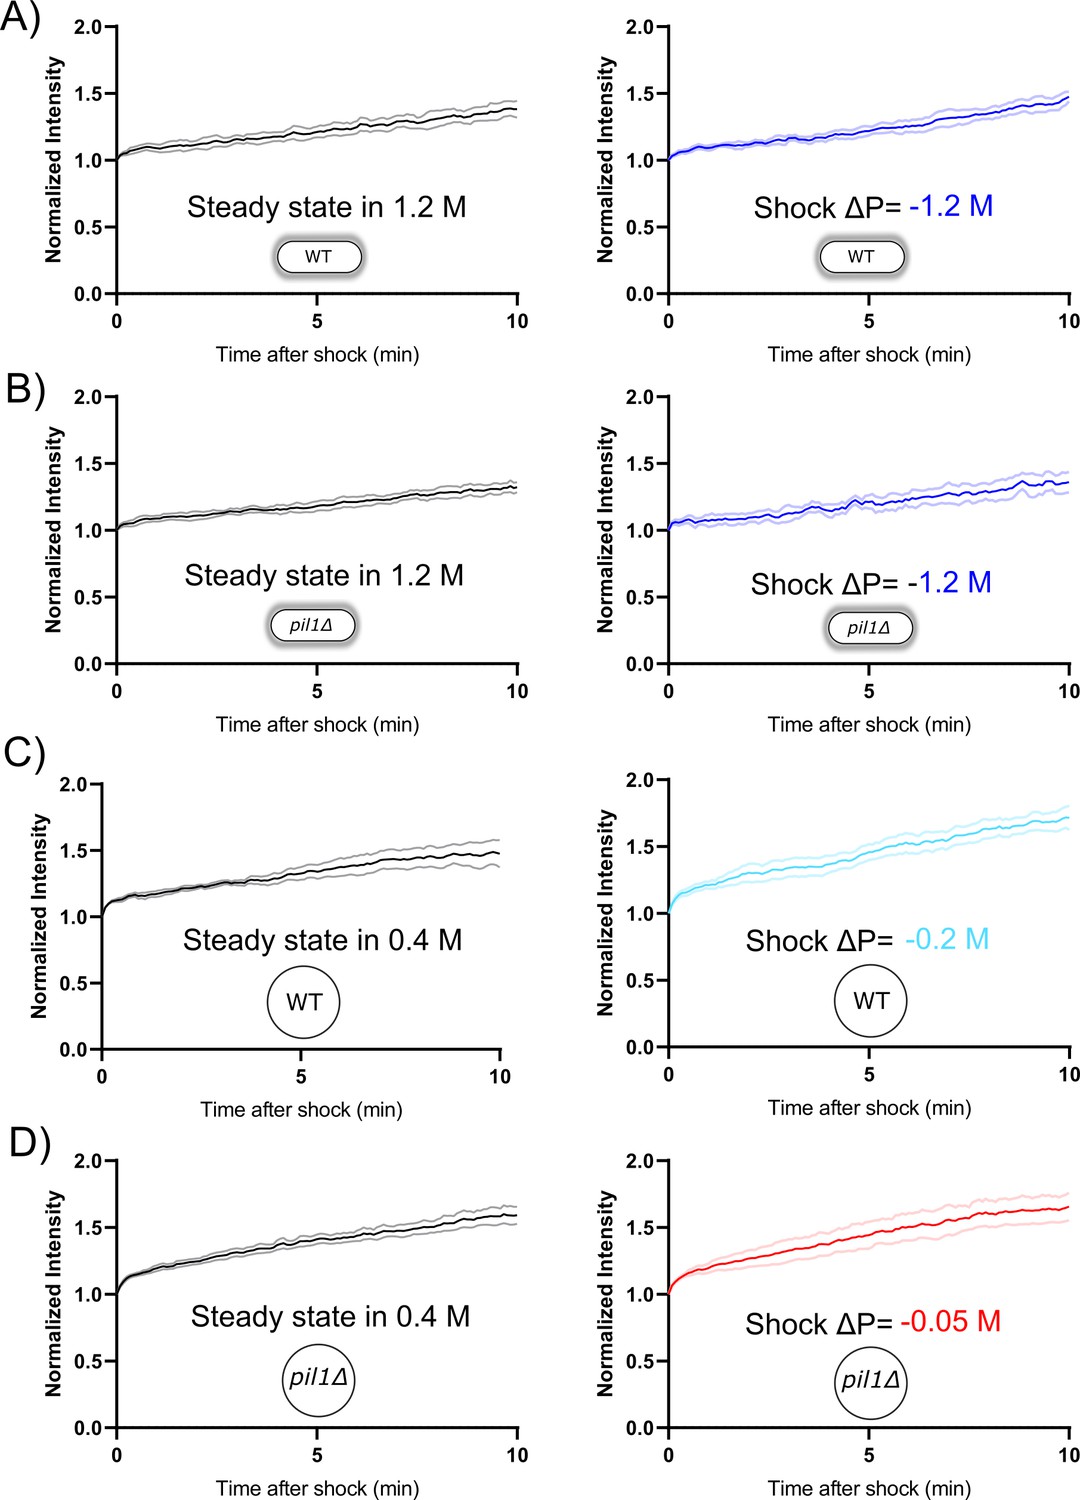
Separate plots for each condition in Figure 4.
Rates of exocytosis at steady state and after hypotonic shocks. (A and B) The exocytic rate of wild-type walled cells is not changed after a ΔC = −1.2 M acute hypotonic shock (black, before shock, Ncells = 79; blue, after shock, Ncells = 68; three replicates each). The exocytic rate of pil1Δ walled cells does not change significantly in the same conditions (black, before shock, Ncells = 60; blue, after shock, Ncells = 96; three replicates each). All walled cells were at steady state in 1.2 M sorbitol before time 0 min. (C and D) The exocytic rate of wild-type and pil1Δ protoplasts increases after ΔC = −0.2 M (black, before shock, Ncells = 20; light blue, after shock, Ncells = 37; four replicates each) and ΔC = −0.05 M (black, before shock, Ncells = 44; red, after shock, Ncells = 60; four replicates each) acute hypotonic shocks, respectively. Before time 0 min, all protoplasts were at steady state in 0.4 M sorbitol. (A–D) Dark color: mean; light color: standard error of the mean.
Figure 5
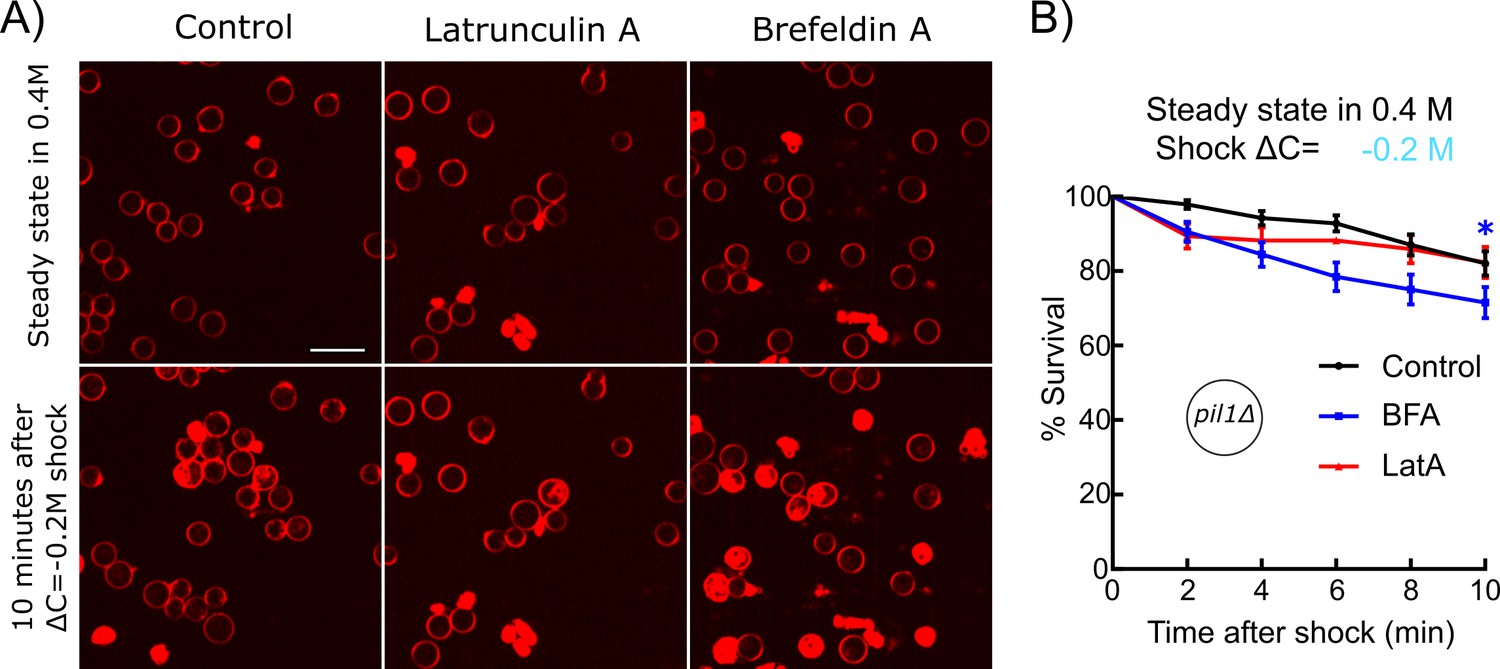
Inhibition of exocytosis but not endocytosis decreased the survival rate of protoplasts under acute hypotonic shocks.
(A) pil1Δ protoplasts initially at steady state in 0.4 M sorbitol and supplemented with 25 μM Latrunculin A (LatA) (middle column) or 2 mM Brefeldin A (BFA) (right column) or nothing (control, left column) were submitted to a ΔC = −0.2 M hypotonic shock (t = 0 min). Cells were considered dead if they contained large amounts of intracellular red fluorescence from the FM4-64 dye, which is the consequence of a rupture of the plasma membrane. Scale bar: 10 µm. (B) Survival rate for all conditions. Black: control (N = 114); blue: 2 mM BFA (N = 83); red: 25 μM Latrunculin A (N = 70). Data were pooled from two independent experiments and plotted as Kaplan-Meier survival curves. Error bars: standard error of the mean by the Greenwood formula. *p≤0.05, logrank test.
-
Figure 5—source data 1
Data for Figure 5B.
- https://cdn.elifesciences.org/articles/62084/elife-62084-fig5-data1-v2.xlsx
Figure 6 with 4 supplements
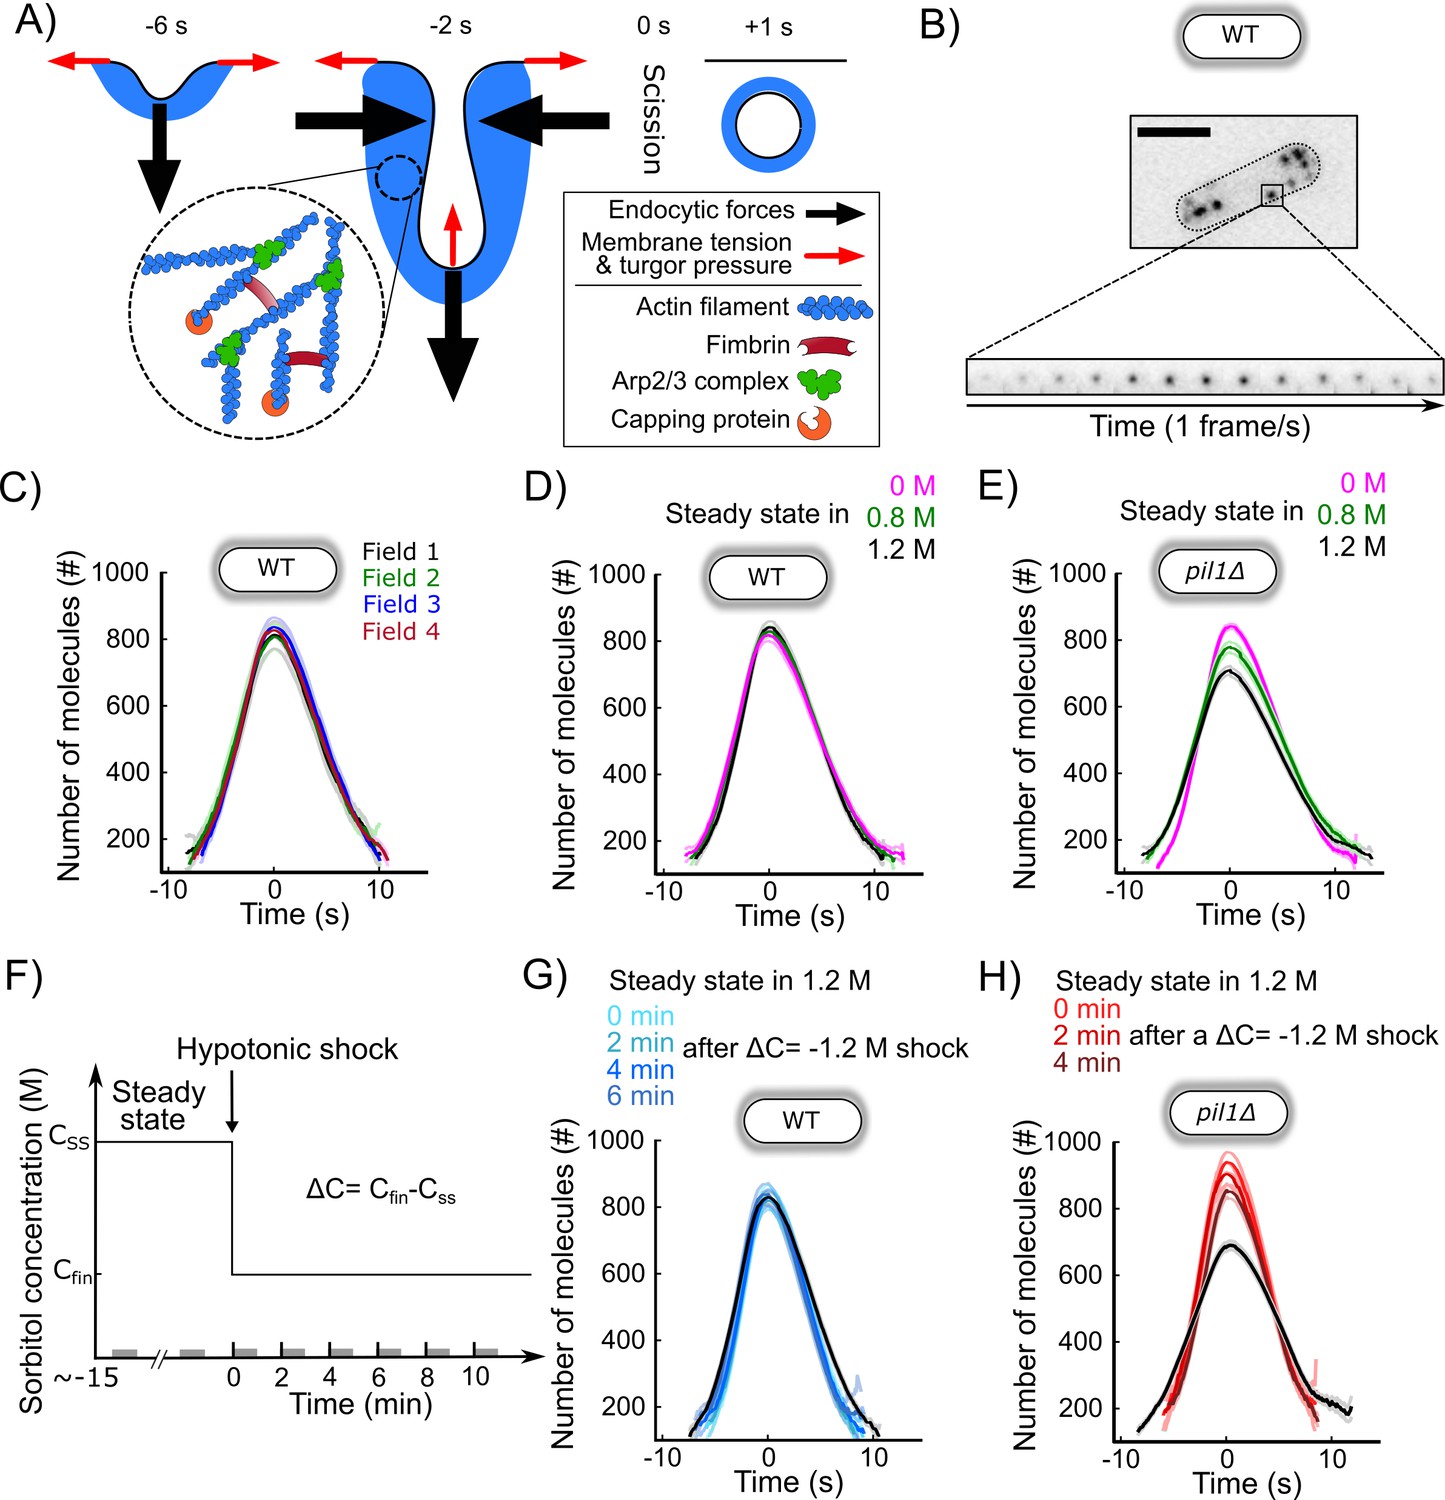
CME in walled cells is robust over a wide range of conditions.
(A) Schematic of the plasma membrane deformations and the main components of the actin machinery during clathrin-mediated endocytosis (CME). Fimbrin (Fim1p, red) crosslinks actin filaments (blue) present at endocytic sites and is used as a proxy to monitor the amount of actin assembled (Figure 6—figure supplement 1). (B) Wild-type walled fission yeast cell expressing Fim1p-mEGFP (inverted contrast). Top: cell outlined with a dashed line; scale bar: 5 µm. Bottom: montage of a representative CME event. The interval between each frame is 1 s. (C) The number of molecules of Fim1p-mEGFP detected, tracked, and aligned with temporal super-resolution (Berro and Pollard, 2014a) is highly reproducible between fields of view (one-way ANOVA on the number of molecules at time 0 s, p=0.74). Each curve with a dark color represents the average of several endocytic events from a different field of view of the same sample (N ≥ 64), and the light colors are the 95% confidence intervals. For each average curve, the peak value corresponds to time 0 s, when vesicle scission happens. (D) Number of molecules of Fim1p-mEGFP in wild-type walled cells at steady state in media supplemented with different sorbitol concentrations. There is no statistically significant difference in the number of molecules at time 0 s between the three conditions (one-way ANOVA, p=0.29). N ≥ 388. (E) Number of molecules of Fim1p-mEGFP in pil1Δ walled cells at steady state in media supplemented with different sorbitol concentrations (N ≥ 342). The difference in the number of molecules at time 0 s between all pairs of conditions is statistically significant (one-way ANOVA, p<10−5). (F) Timeline of the hypotonic shock experiments and notations. By convention, hypotonic shocks start at time 0 min and are defined by the difference in concentrations of sorbitol in the steady-state media before the shock (CSS) and after the hypotonic shock (Cfin), ΔC=Cfin-CSS. Data for a given time point correspond to endocytic events happening within 1 min after this time point (e.g., the data at t = 0 min correspond to endocytic events happening between 0 and 1 min after the shock). These time intervals are represented by gray bars on the time axis. (G) Number of molecules of Fim1p-mEGFP for wild-type walled cells initially at steady state in 1.2 M sorbitol and after an acute osmotic shock of ΔC = −1.2 M. There is no statistically significant difference in the number of molecules at time 0 s between the three conditions (one-way ANOVA, p=0.95). Black: steady state in 1.2 M sorbitol; light to dark blue in top panel: 0, 2, 4, and 6 min after the acute hypotonic shock (N ≥ 103). (H) Number of molecules of Fim1p-mEGFP in pil1Δ walled cells before and after an acute osmotic shock (ΔC = −1.2 M). The difference in the number of molecules at time 0 s between all pairs of conditions is statistically significant (one-way ANOVA, p<0.03) except between 0 and 2 min after the shock (one-way ANOVA, p=0.18). Black: steady state in 1.2 M sorbitol before the hypotonic shock (N = 583); light to dark red in top panel: 0, 2, and 4 min after the acute hypotonic shock (N ≥ 145). (C, D, E, G, and H) Dark colors: average; light colors: average ± 95% confidence interval. The number of molecules and speed versus time for each condition are plotted separately in Figure 6—figure supplements 2C, Figure 6—figure supplements 3D,G, and Figure 6—figure supplement 4E,H (E and H). The numbers of endocytic events used in each curve are given in Supplementary file 1d (C), Supplementary file 1e (D), Supplementary file 1f (E), Supplementary file 1g (G), and Supplementary file 1h (H).
-
Figure 6—source data 1
Data for Figure 6C and for Figure 6—figure supplement 2.
- https://cdn.elifesciences.org/articles/62084/elife-62084-fig6-data1-v2.xlsx
-
Figure 6—source data 2
Data for Figure 6D and for Figure 6—figure supplement 3A.
- https://cdn.elifesciences.org/articles/62084/elife-62084-fig6-data2-v2.xlsx
-
Figure 6—source data 3
Data for Figure 6E and for Figure 6—figure supplement 4A.
- https://cdn.elifesciences.org/articles/62084/elife-62084-fig6-data3-v2.xlsx
-
Figure 6—source data 4
Data for Figure 6G and for Figure 6—figure supplement 3B.
- https://cdn.elifesciences.org/articles/62084/elife-62084-fig6-data4-v2.xlsx
-
Figure 6—source data 5
Data for Figure 6H and for Figure 6—figure supplement 4B.
- https://cdn.elifesciences.org/articles/62084/elife-62084-fig6-data5-v2.xlsx
Figure 6—figure supplement 1
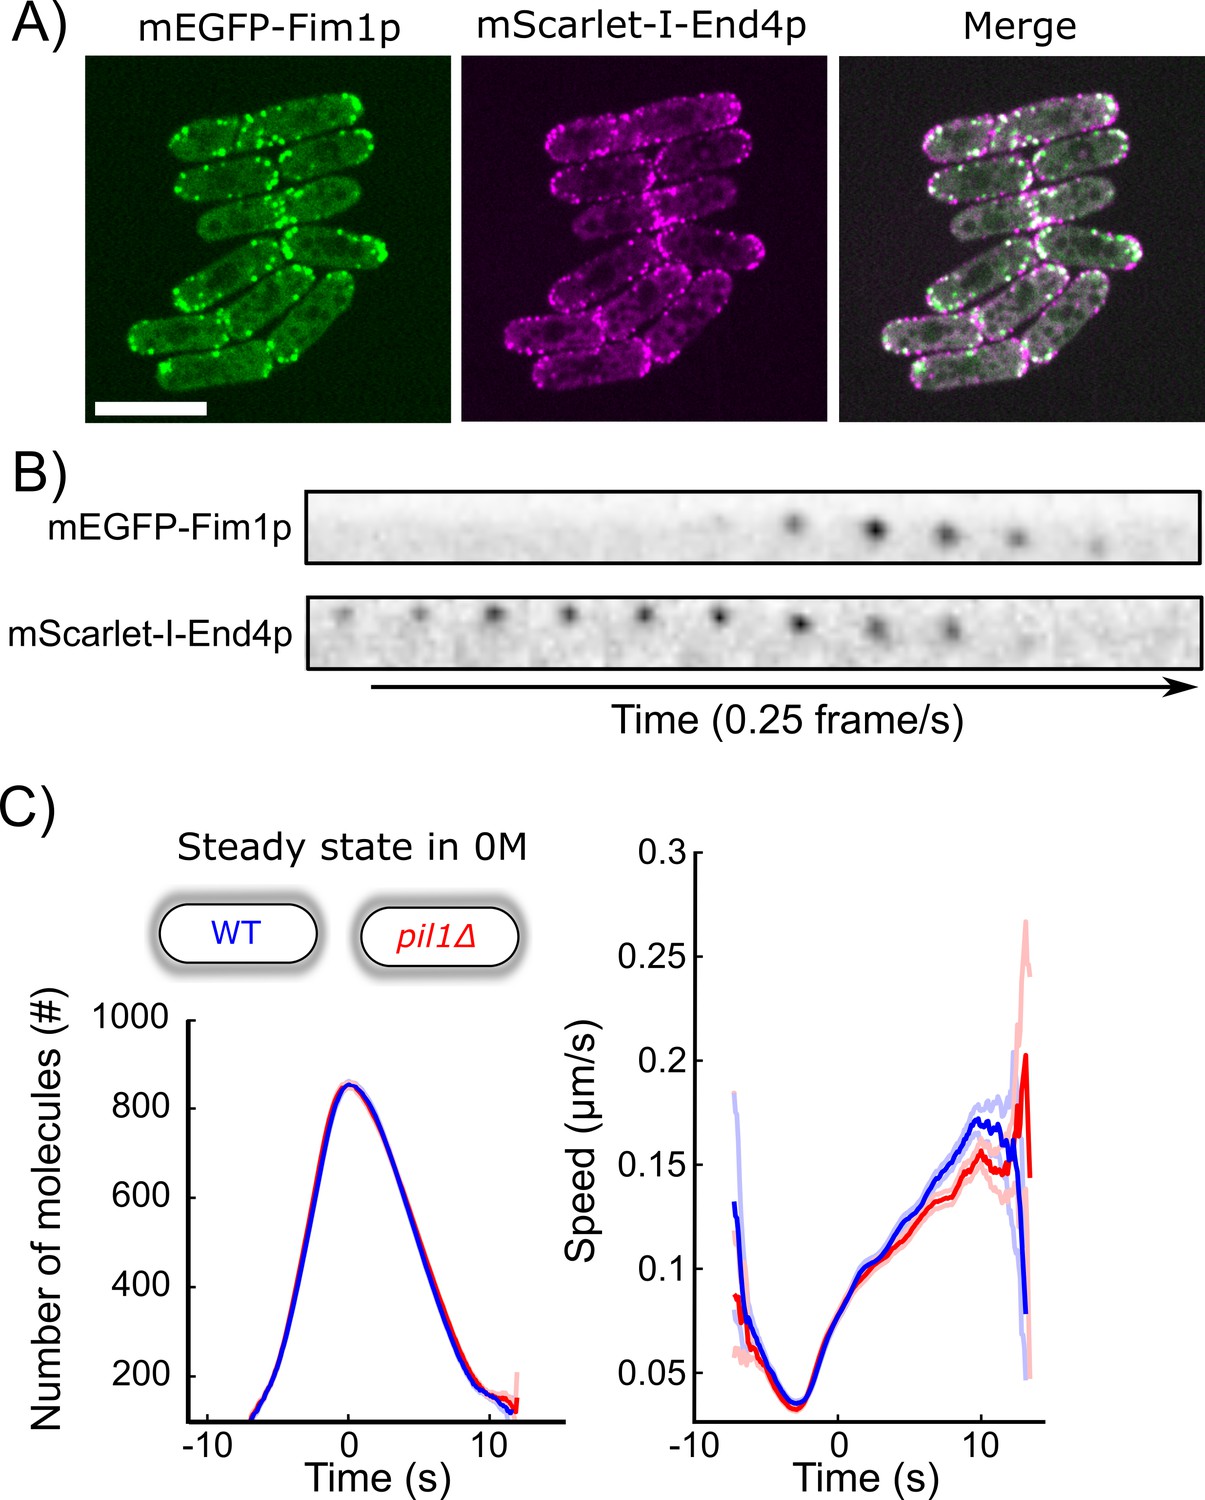
Fimbrin is a proxy for actin dynamics during CME in yeast, and eisosomes do not participate in CME in wild-type walled cells.
(A) Co-localization of Fimbrin (mEGFP-Fim1p, green) and End4 (mScarlet-I-End4p, red) during endocytosis. Significant overlapping of signals can be seen in the merged channel. (B) Montage of a representative clathrin-mediated endocytosis (CME) event tagged by both mEGFP-Fim1p (top row) and mScarlet-I-End4p (bottom row). The interval between each frame is 4 s. (C) The number of molecules (left panel) and speed (right panel) of Fim1p-mEGFP at CME sites in wild-type (blue, N = 1773) and pil1Δ (red, N = 1884) walled cells at steady state in Edinburgh Minimum Media (EMM5S) without sorbitol are identical (same data as in Figure 6D and E). Dark colors: average; light colors: average ± 95% confidence interval.
Figure 6—figure supplement 2
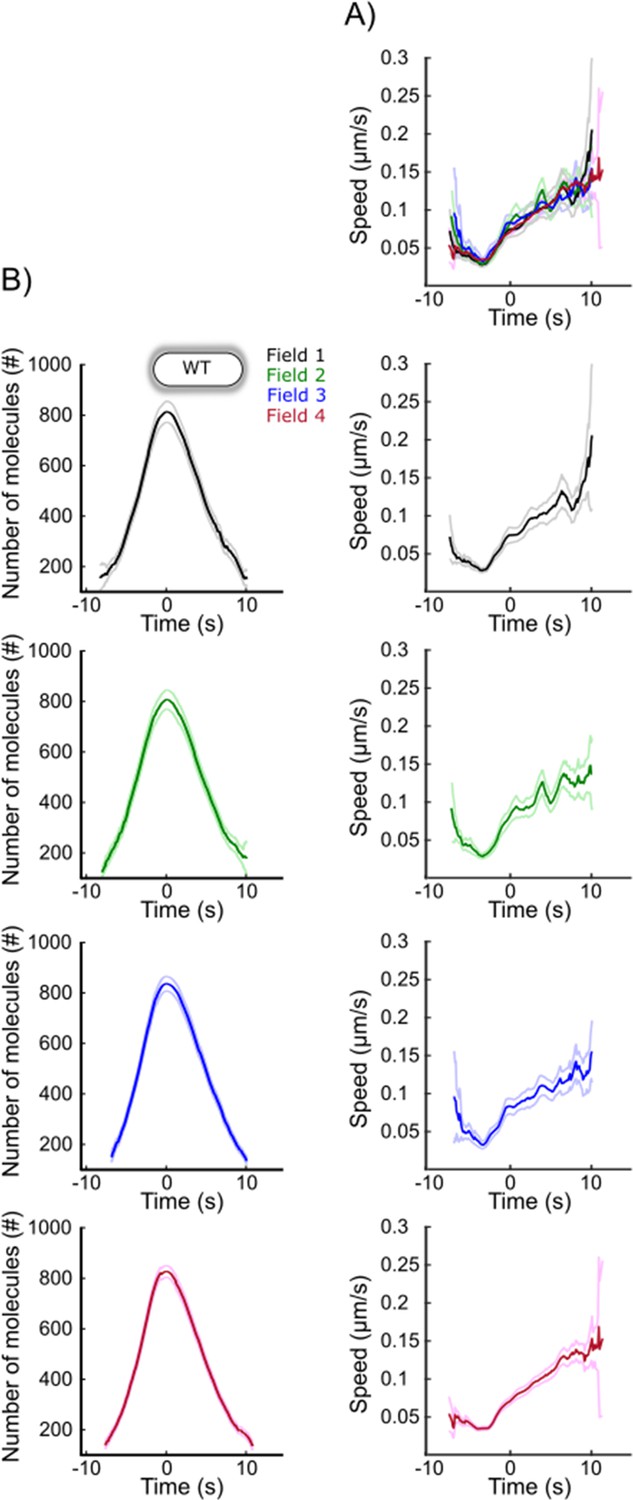
Speed data (A) and separate plots (B) for the data from each field of view in panel (1C).
Each curve with a dark color represents the average of several endocytic events from a different field of view of the same sample (N ≥ 64), and the light colors are the 95% confidence intervals. For each average curve, the peak value corresponds to time 0 s, when vesicle scission happens. The numbers of endocytic events used in each curve are given in Supplementary file 1d.
Figure 6—figure supplement 3
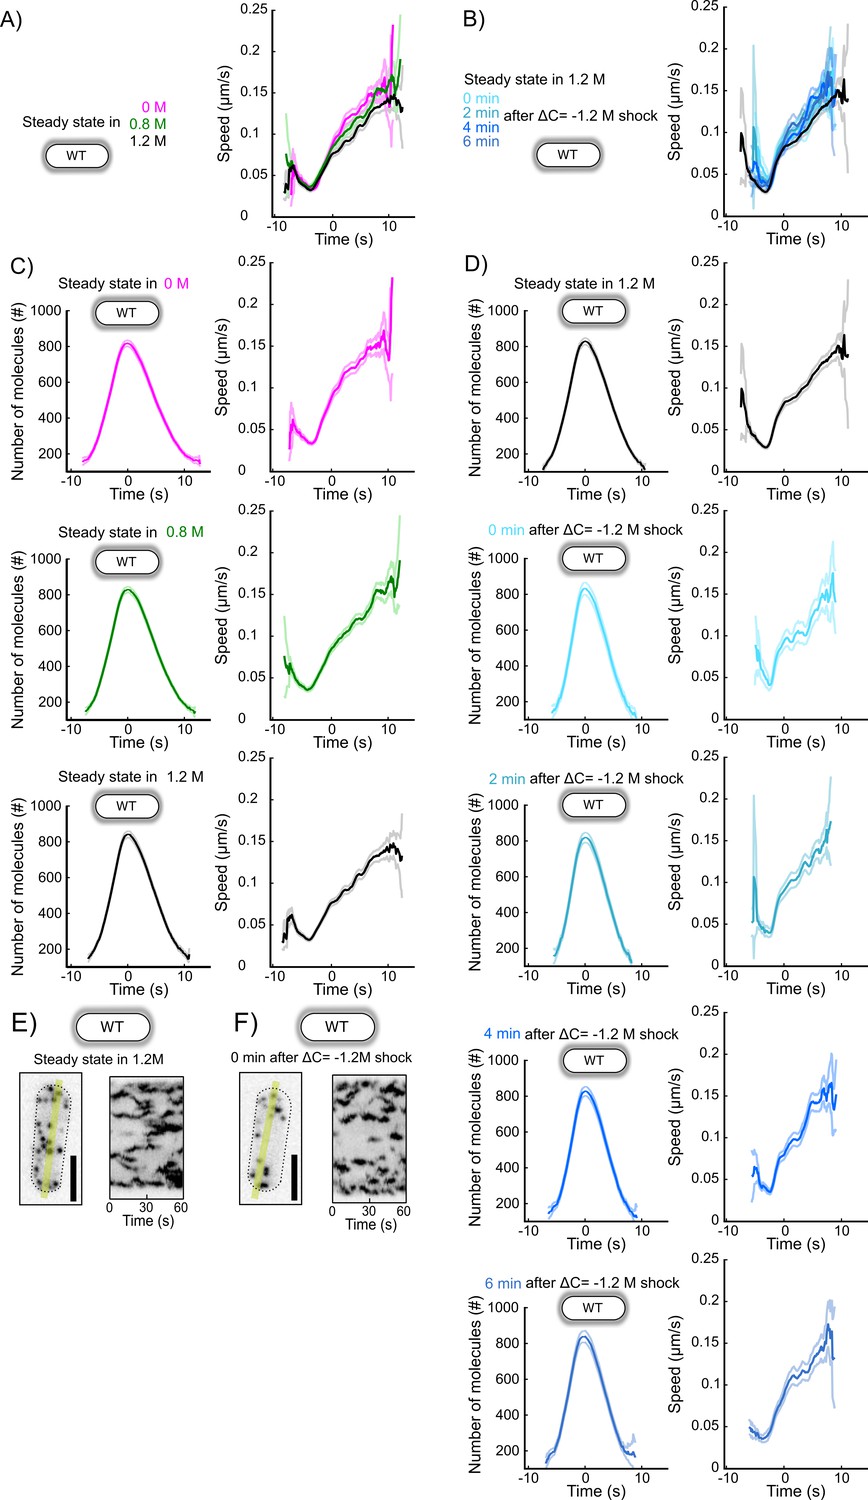
Representative endocytic events, speeds, and separate plots for each condition in Figure 6D and G.
(A and B) Speeds corresponding to the data shown in Figure 6D (A) and 6G (B). (C) Number of molecules (left panel) and speed (right panel) of Fim1p-mEGFP in wild-type walled cells at steady state in media supplemented with different sorbitol concentrations (N ≥ 388) (Figure 6D). The numbers of endocytic events used in each curve are given in Supplementary file 1e. (D) Number of molecules (left panel) and speed (right panel) of Fim1p-mEGFP for wild-type walled cells initially at steady state in 1.2 M sorbitol and after an acute osmotic shock of ΔC = −1.2 M. Black: steady state in 1.2 M sorbitol; light to dark blue (from top to bottom rows): 0, 2, 4, and 6 min after the acute hypotonic shock (N ≥ 103) (Figure 6G). The numbers of endocytic events used in each curve are given in Supplementary file 1g. (C and D) Dark colors: average; light colors: average ± 95% confidence interval. (E and F) Left panels: representative wild-type walled cells expressing Fim1p-mEGFP (inverted contrast) at steady state in 1.2 M sorbitol (E) and immediately (0 min) after an acute osmotic shock ΔC = −1.2 M (F). Right panels: kymographs of the fluorescence under the yellow line in the left panels. Black dashed lines: outline of the cell. Scale bars for all panels: 5 µm.
Figure 6—figure supplement 4
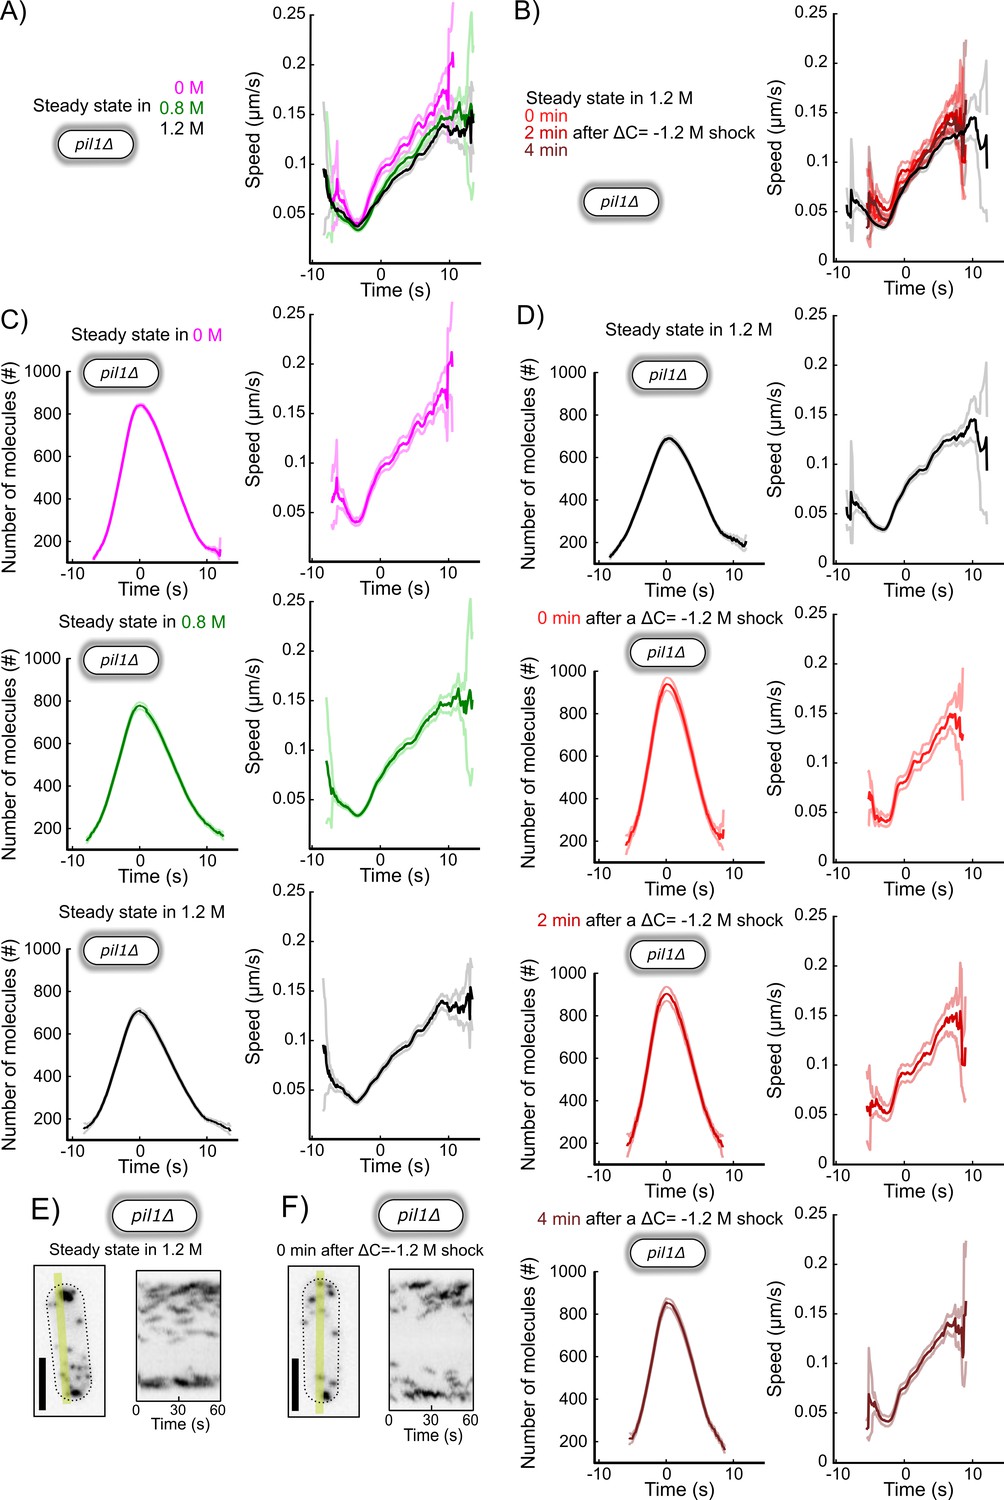
Representative endocytic events, speeds, and separate plots for each condition in Figure 6E and H.
(A and B) Speeds corresponding to the data shown in Figure 6E (A) and 6H (B). (C) Number of molecules (left panel) and speed (right panel) of Fim1p-mEGFP in pil1Δ walled cells at steady state in media supplemented with different sorbitol concentrations (N ≥ 342) (Figure 6E). The numbers of endocytic events used in each curve are given in Supplementary file 1e. (D) Number of molecules (left panel) and speed (right panel) of Fim1p-mEGFP for wild-type walled cells initially at steady state in 1.2 M sorbitol and after an acute osmotic shock of ΔC = −1.2 M. Black: steady state in 1.2 M sorbitol; light to dark blue (from top to bottom rows): 0, 2, and 4 min after the acute hypotonic shock (N ≥ 145) (Figure 6H). The numbers of endocytic events used in each curve are given in Supplementary file 1g. (C and D) Dark colors: average; light colors: average ± 95% confidence interval. (E and F) Left panels: representative pil1Δ walled cells expressing Fim1p-mEGFP (inverted contrast) at steady state in 1.2 M sorbitol (E) and immediately (0 min) after an acute osmotic shock ΔC = −1.2 M (F). Right panels: kymographs of the fluorescence under the yellow line in the left panels. Black dashed lines: outline of the cell. Scale bars for all panels: 5 µm.
Figure 7 with 7 supplements
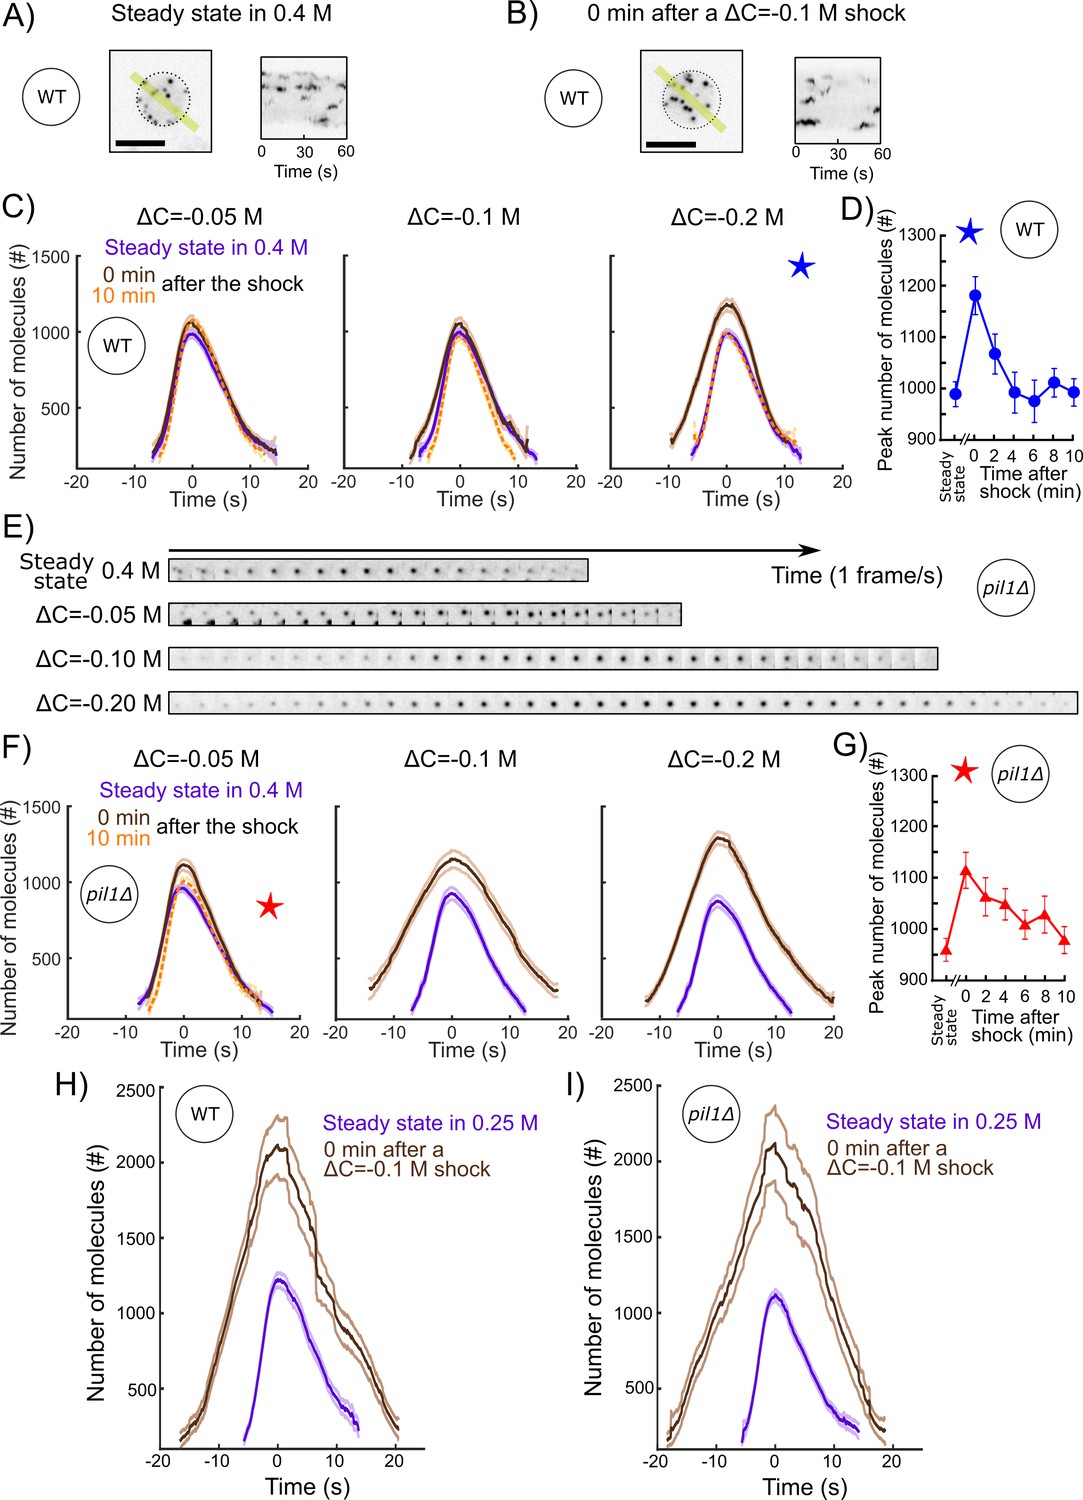
The actin endocytic machinery adapts to increases of membrane tension in protoplasts.
(A and B) Representative wild-type protoplasts expressing Fim1-mEGFP (inverted contrast) at steady state in 0.25 M sorbitol (A, left panel) and immediately after (0 min) an acute osmotic shock of ΔC = −0.1 M (B, left panel). Right panels: kymographs of the fluorescence under the yellow lines in the left panels. Black dashed lines: protoplast outline. Scale bars: 5 µm. (C and F) Number of Fim1p-mEGFP molecules in wild-type (C) and pil1Δ (F) protoplasts at steady state in 0.4 M sorbitol (purple), 0 min (brown) and 10 min (orange) after a hypotonic shock of ΔC = −0.05 M (left panels), ΔC = −0.1 M (middle panels), and ΔC = −0.2 M (right panels), N ≥ 95. Data for each condition are plotted separately in Figure 7—figure supplement 3 (wild type) and Figure 7—figure supplement 4 (pil1Δ). The speeds of Fim1p-mEGFP for each condition are shown in Figure 7—figure supplement 5 (wild type) and Figure 7—figure supplement 6 (pil1Δ). The numbers of endocytic events used in each curve are given in Supplementary file 1i. Note that the large majority of pil1Δ protoplasts were too damaged or dead 2 min after hypotonic shocks larger than or equal to ΔC = −0.1 M to allow us to track enough endocytic events and produce a curve (Figure 2B,C and Figure 7—figure supplement 1). In panel (C), the difference in the number of molecules at time 0 s at steady state and 0 min after the shock is statistically significant for all shocks (one-way ANOVA, p<0.03), and the difference between steady state and 10 min after the shock is not statistically significant (one-way ANOVA, p>0.2; details in the data file for C). In panel (F), the difference at steady state and 0 min after the shock is statistically significant for all shocks (one-way ANOVA, p<10−5; details in the data file for Figure 5F). (D) Temporal adaptation of the peak number of Fim1p-mEGFP in wild-type protoplasts initially at steady state in 0.4 M sorbitol and 0–10 min after a ΔC = −0.2 M osmotic shock. The condition for this figure is the same as the condition with the blue star in (C). The difference between steady state and 0 or 2 min after shock is statistically significant (one-way ANOVA, p<10−3; details in the data file for D). The difference between steady state and 4, 6, 8, and 10 min after shock is not statistically significant (one-way ANOVA, p>0.2; details in the data file for D). (E) Montage of representative endocytic events (Fim1-mEGFP, inverted contrast) in pil1Δ protoplasts (one frame per second) at steady state in 0.4 M sorbitol (first row) and immediately after (0 min) hypotonic shocks of ΔC = −0.05 M (second row), ΔC = −0.10 M (third row), and ΔC = −0.20 M (fourth row). (G) Temporal adaptation of the peak number of Fim1p-mEGFP in pil1Δ protoplasts initially at steady state in 0.4 M sorbitol and 0–10 min after a ΔC = −0.05 M shock. The condition in this figure is the same as the condition with the red star in (F). The difference between steady state and 0, 2, 4, 6, or 8 min after shock is statistically significant (one-way ANOVA, p<0.01; details in the data file for F). The difference between steady state and 10 min after shock is not statistically significant (one-way ANOVA, p>0.3; details in the data file for F). (D and G) Error bars are 95% confidence intervals. The numbers of endocytic events at each time point are given in Supplementary file 1j. (H and I) Number of molecules of Fim1p-mEGFP for wild-type (H) and pil1Δ (I) protoplasts at steady state in 0.25 M sorbitol (purple dashed) and immediately after (0 min) a hypotonic shock of ΔC = −0.1 M (brown), N ≥ 67. The difference in the number of molecules at time 0 s at steady state and 0 min after the shock is statistically significant for all conditions (one-way ANOVA, p<10−16). The speed data for each condition are plotted in Figure 7—figure supplement 7. The numbers of endocytic events used in each curve are given in Supplementary file 1k. The survival rates for the wild-type and pil1Δ protoplasts in these conditions are plotted in Figure 2D.
-
Figure 7—source data 1
Data for Figure 7C.
- https://cdn.elifesciences.org/articles/62084/elife-62084-fig7-data1-v2.xlsx
-
Figure 7—source data 2
Data for Figure 7D.
- https://cdn.elifesciences.org/articles/62084/elife-62084-fig7-data2-v2.xlsx
-
Figure 7—source data 3
Data for Figure 7F.
- https://cdn.elifesciences.org/articles/62084/elife-62084-fig7-data3-v2.xlsx
-
Figure 7—source data 4
Data for Figure 7G.
- https://cdn.elifesciences.org/articles/62084/elife-62084-fig7-data4-v2.xlsx
-
Figure 7—source data 5
Data for Figure 7H.
- https://cdn.elifesciences.org/articles/62084/elife-62084-fig7-data5-v2.xlsx
-
Figure 7—source data 6
Data for Figure 7I.
- https://cdn.elifesciences.org/articles/62084/elife-62084-fig7-data6-v2.xlsx
Figure 7—figure supplement 1
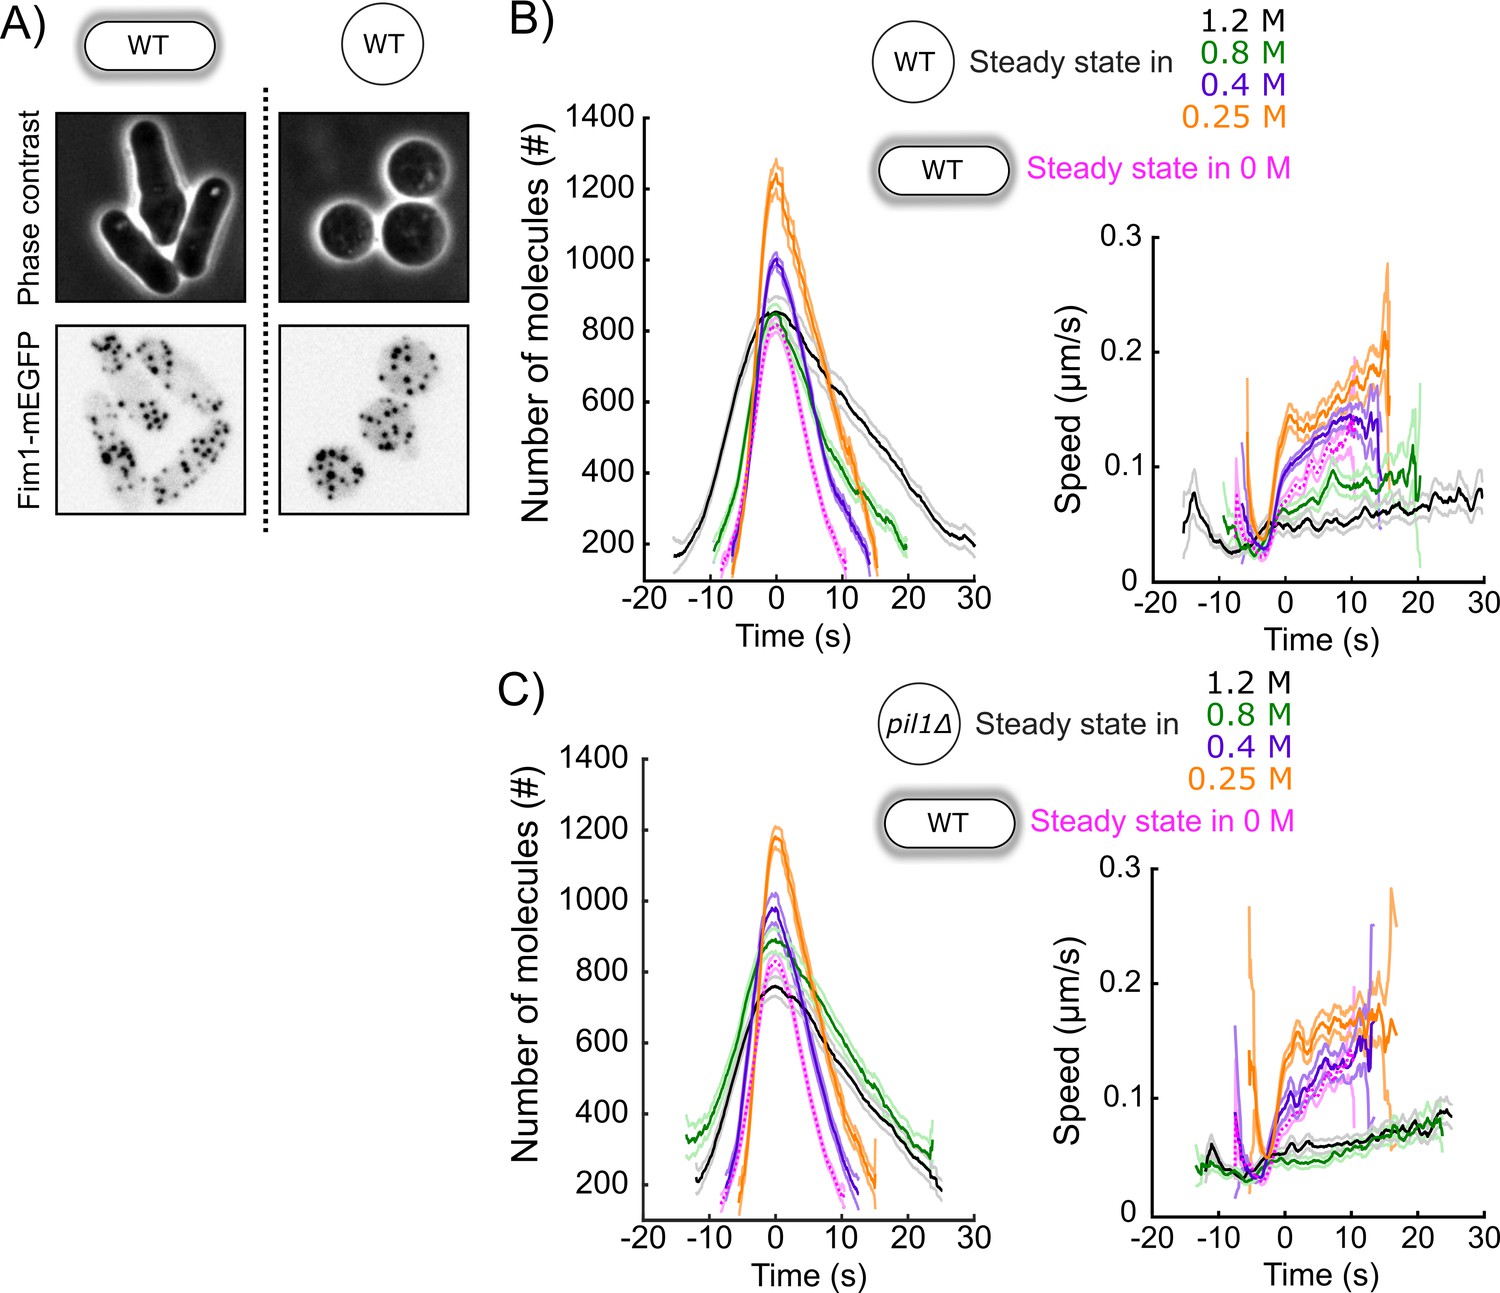
CME in protoplasts at steady state in different sorbitol concentrations.
(A) Representative walled yeast cells (left column) and protoplasts (right column) at steady state in 1.2 M sorbitol. Top panels: phase contrast; middle panels: cells expressing Fim1-mEGFP (inverted contrast). (B and C) Number of molecules (left panels) and speed (right panels) of Fim1p-mEGFP for wild-type (B) and pil1Δ (C) protoplasts at steady state in different sorbitol concentrations. Orange: 0.25 M; purple: 0 M; green: 0.8 M; black: 1.2 M. Dark colors: average; light colors: average ± 95% confidence interval (N ≥ 143). Fuchsia dotted curves: wild-type walled cells at steady state in 0 M sorbitol. Data for each condition are plotted separately in Figure 7—figure supplement 2. The numbers of endocytic events used in each curve are given in Supplementary file 1l.
-
Figure 7—figure supplement 1—source data 1
Data for Figure 7—figure supplement 1B.
- https://cdn.elifesciences.org/articles/62084/elife-62084-fig7-figsupp1-data1-v2.xlsx
-
Figure 7—figure supplement 1—source data 2
Data for Figure 7—figure supplement 1C.
- https://cdn.elifesciences.org/articles/62084/elife-62084-fig7-figsupp1-data2-v2.xlsx
Figure 7—figure supplement 2
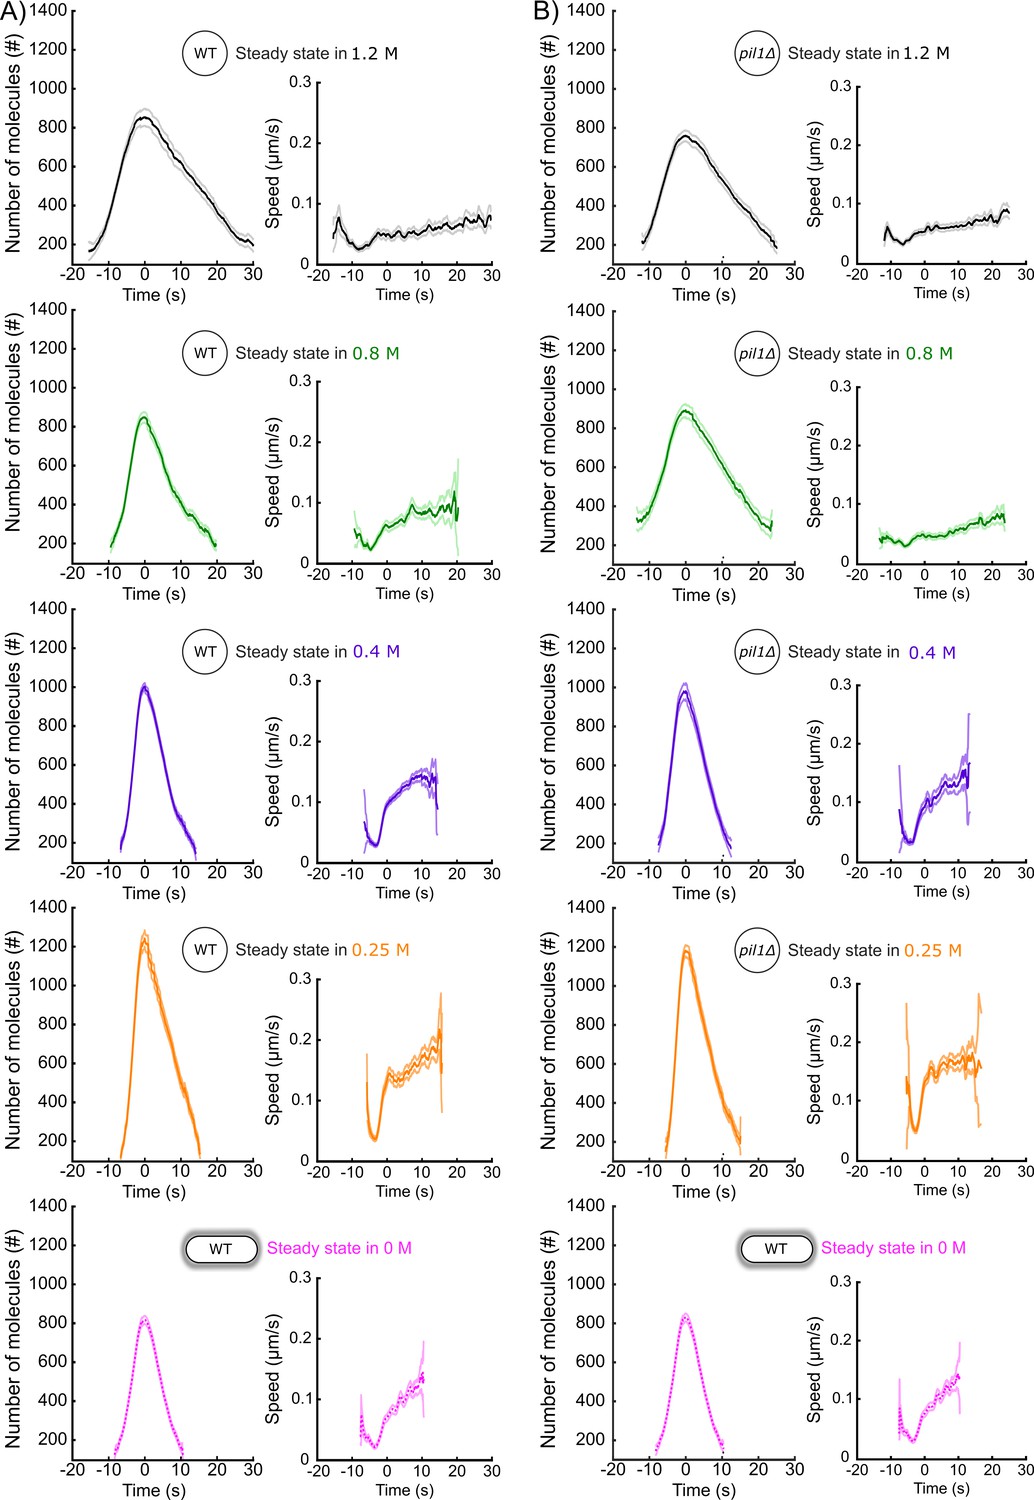
Separate plots for each condition in Figure 7—figure supplement 1.
(A and B) Number of molecules (left panels) and speed (right panels) of Fim1p-mEGFP for wild-type (A) and pil1Δ (B) protoplasts at steady state in different sorbitol concentrations. Orange: 0.25 M; purple: 0 M; green: 0.8 M; black: 1.2 M. Dark colors: average; light colors: average ± 95% confidence interval (N ≥ 143). Fuschia dotted curves: walled cells at steady state in 0 M sorbitol (same as in Figure 6D and E). The numbers of endocytic events used in each curve are given in Supplementary file 1l.
Figure 7—figure supplement 3
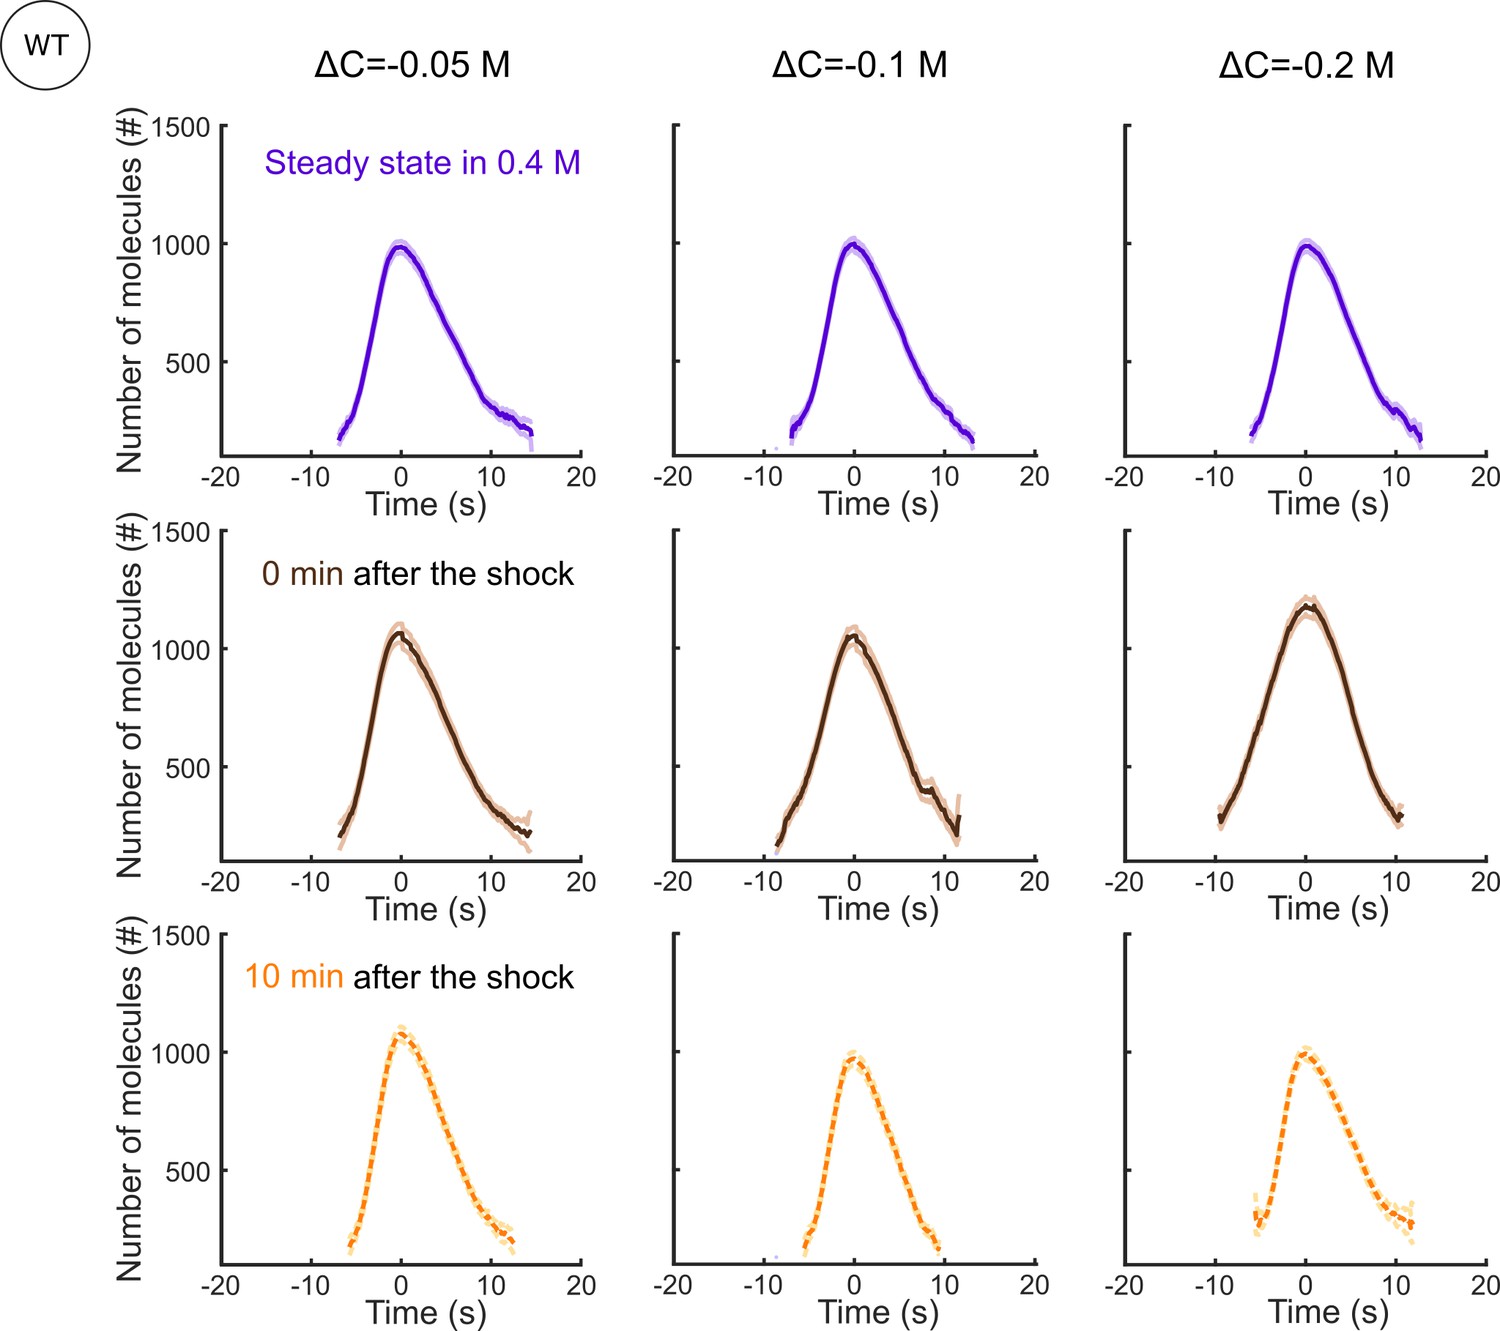
Separate plots for each condition shown in Figure 7C.
Number of Fim1p-mEGFP molecules in wild-type protoplasts at steady state in 0.4 M sorbitol (purple), 0 min (brown) and 10 min (orange) after a hypotonic shock of ΔC = −0.05 M (left panels), ΔC = −0.1 M (middle panels), and ΔC = −0.2 M (right panels), N ≥ 95. The speeds of Fim1p-mEGFP for each condition are shown in Figure 7—figure supplement 5. The numbers of endocytic events used in each curve are given in Supplementary file 1i. Dark colors: average; light colors: average ± 95% confidence interval.
Figure 7—figure supplement 4
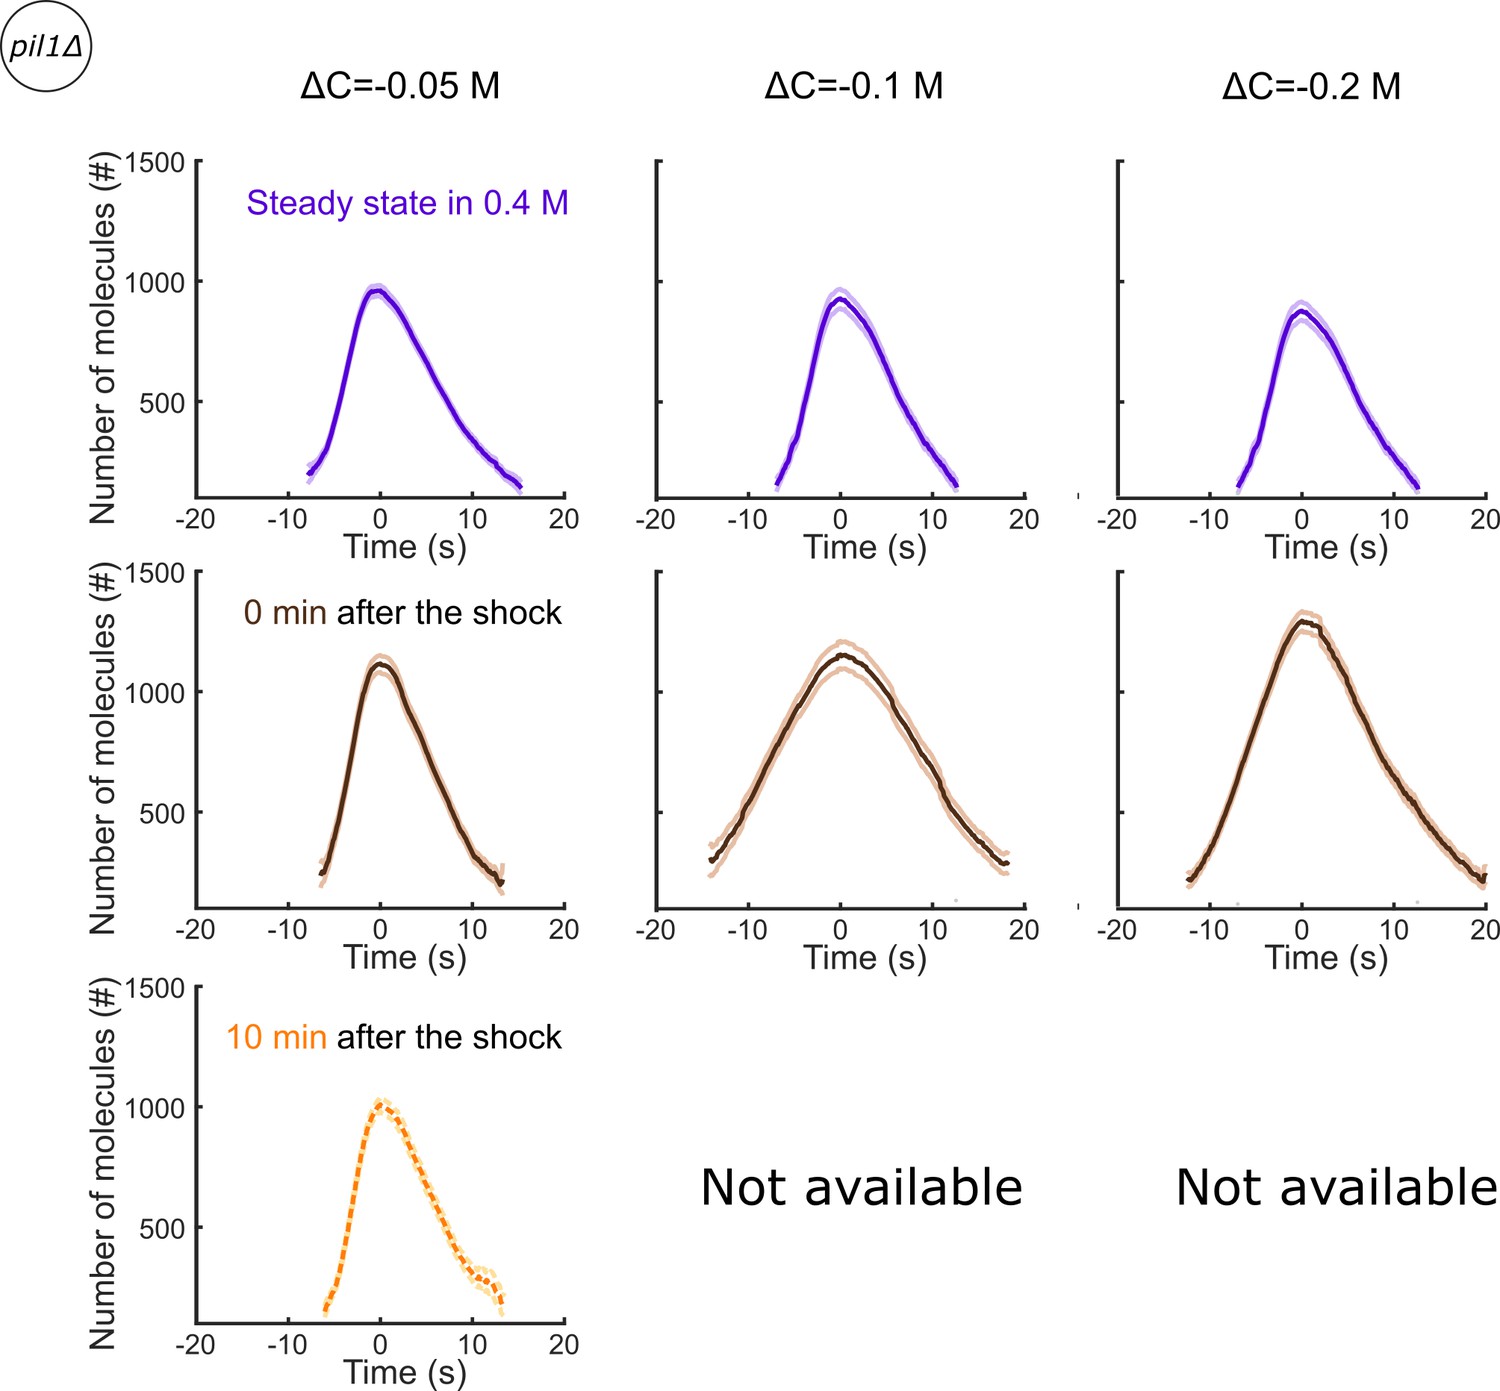
Separate plots for each condition shown in Figure 7F.
Number of Fim1p-mEGFP molecules in pil1Δ protoplasts at steady state in 0.4 M sorbitol (purple), 0 min (brown) and 10 min (orange) after a hypotonic shock of ΔC = −0.05 M (left panels), ΔC = −0.1 M (middle panels), and ΔC = −0.2 M (right panels), N ≥ 95. The speeds of Fim1p-mEGFP for each condition are shown in Figure 7—figure supplement 6. The numbers of endocytic events used in each curve are given in Supplementary file 1i. Note that the large majority of pil1Δ protoplasts were too damaged or dead 2 min after hypotonic shocks larger than or equal to ΔC = −0.1 M to allow us to track enough endocytic events and produce a curve (Figure 2B,C and Figure 2—figure supplement 1). Dark colors: average; light colors: average ± 95% confidence interval.
Figure 7—figure supplement 5
Speeds and separate plots for each condition shown in Figure 7C.
(A) Speed of Fim1p-mEGFP in wild-type protoplasts at steady state in 0.4 M sorbitol (purple), 0 min (brown) and 10 min (orange) after a hypotonic shock of ΔC = −0.05 M (left panels), ΔC = −0.1 M (middle panels), and ΔC = −0.2 M (right panels). (B) Separate plots for each condition shown in panel (A). (A and B) The same endocytic events as the ones used in Figure 7C have been used to generate these plots. The numbers of endocytic events used in each curve are given in Supplementary file 1i. Dark colors: average; light colors: average ± 95% confidence interval.
-
Figure 7—figure supplement 5—source data 1
Data for Figure 7—figure supplement 5.
- https://cdn.elifesciences.org/articles/62084/elife-62084-fig7-figsupp5-data1-v2.xlsx
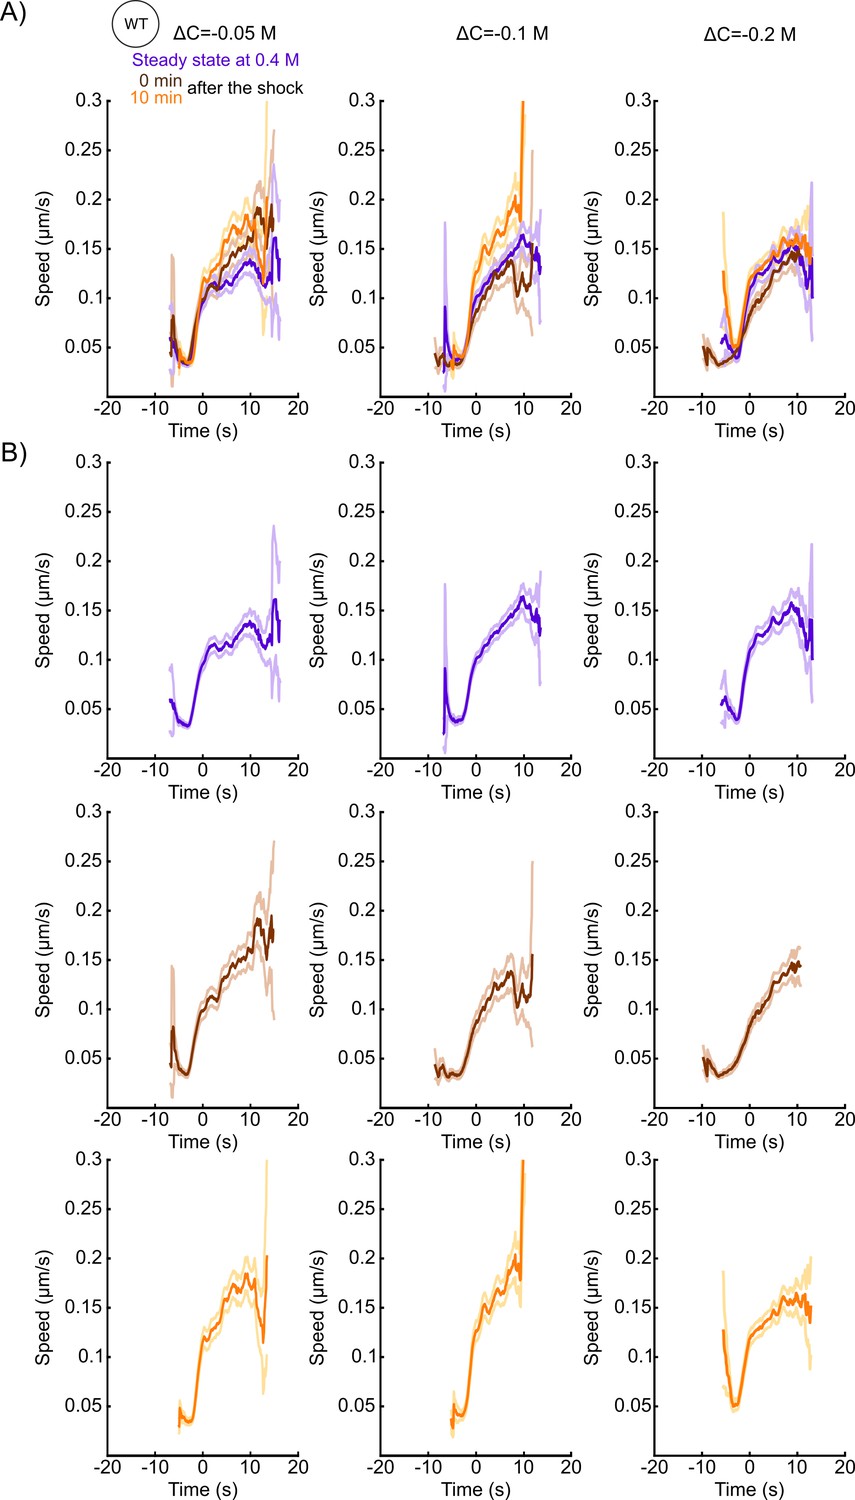
Figure 7—figure supplement 6
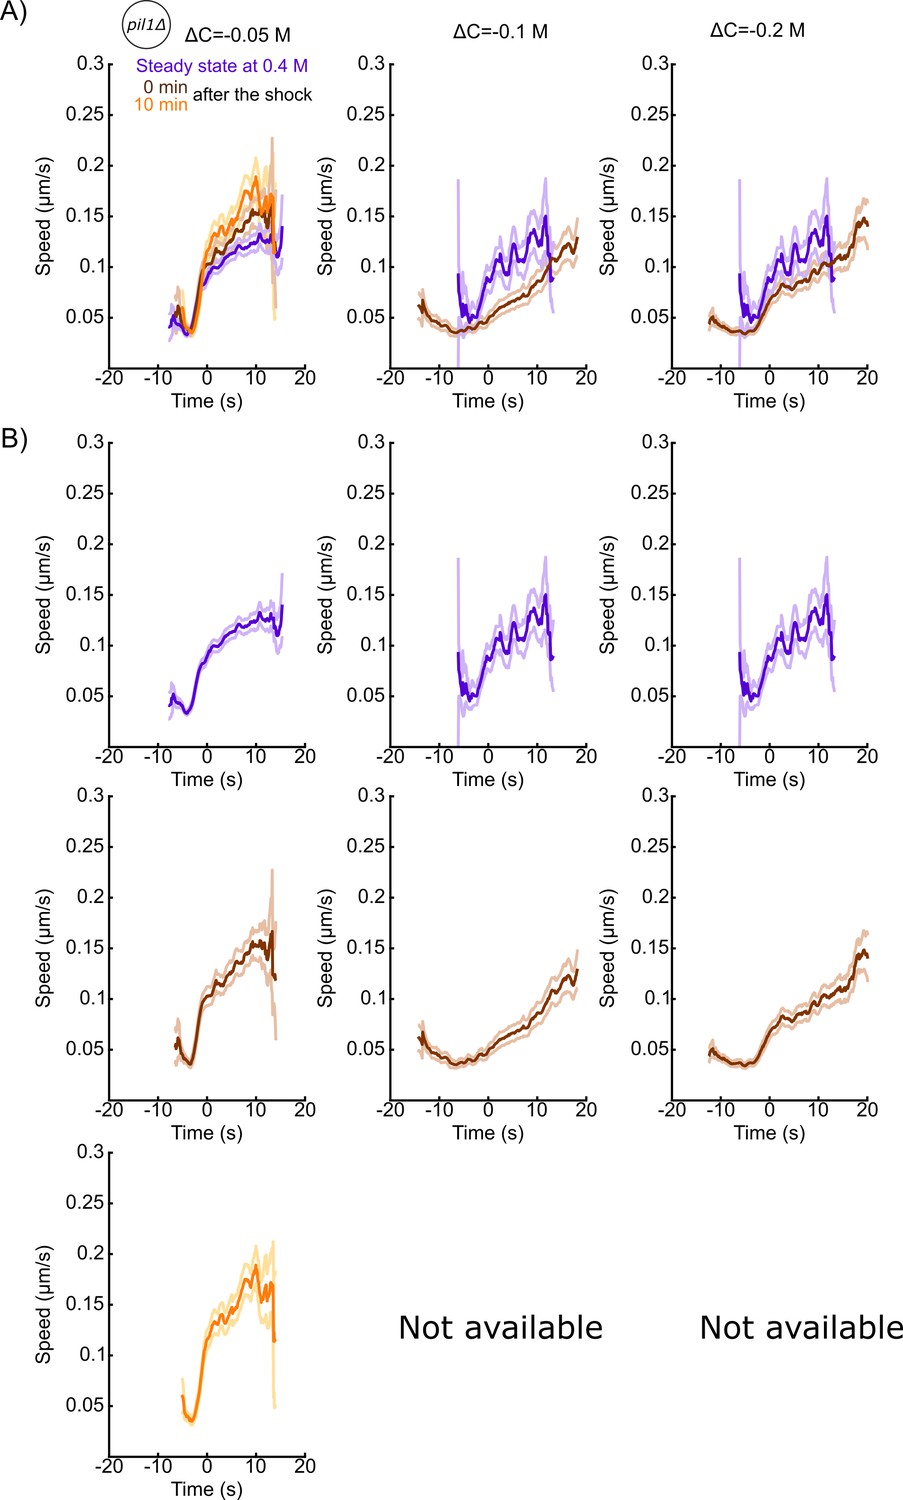
Speeds and separate plots for each condition shown in Figure 7F.
(A) Speed of Fim1p-mEGFP in pil1Δ protoplasts at steady state in 0.4 M sorbitol (purple), 0 min (brown) and 10 min (orange) after a hypotonic shock of ΔC = −0.05 M (left panels), ΔC = −0.1 M (middle panels), and ΔC = −0.2 M (right panels). (B) Separate plots for each condition shown in panel (A). (A and B) The same endocytic events as the ones used in Figure 7F have been used to generate these plots. The numbers of endocytic events used in each curve are given in Supplementary file 1i. Dark colors: average; light colors: average ± 95% confidence interval.
-
Figure 7—figure supplement 6—source data 1
Data for Figure 7—figure supplement 6.
- https://cdn.elifesciences.org/articles/62084/elife-62084-fig7-figsupp6-data1-v2.xlsx
Figure 7—figure supplement 7
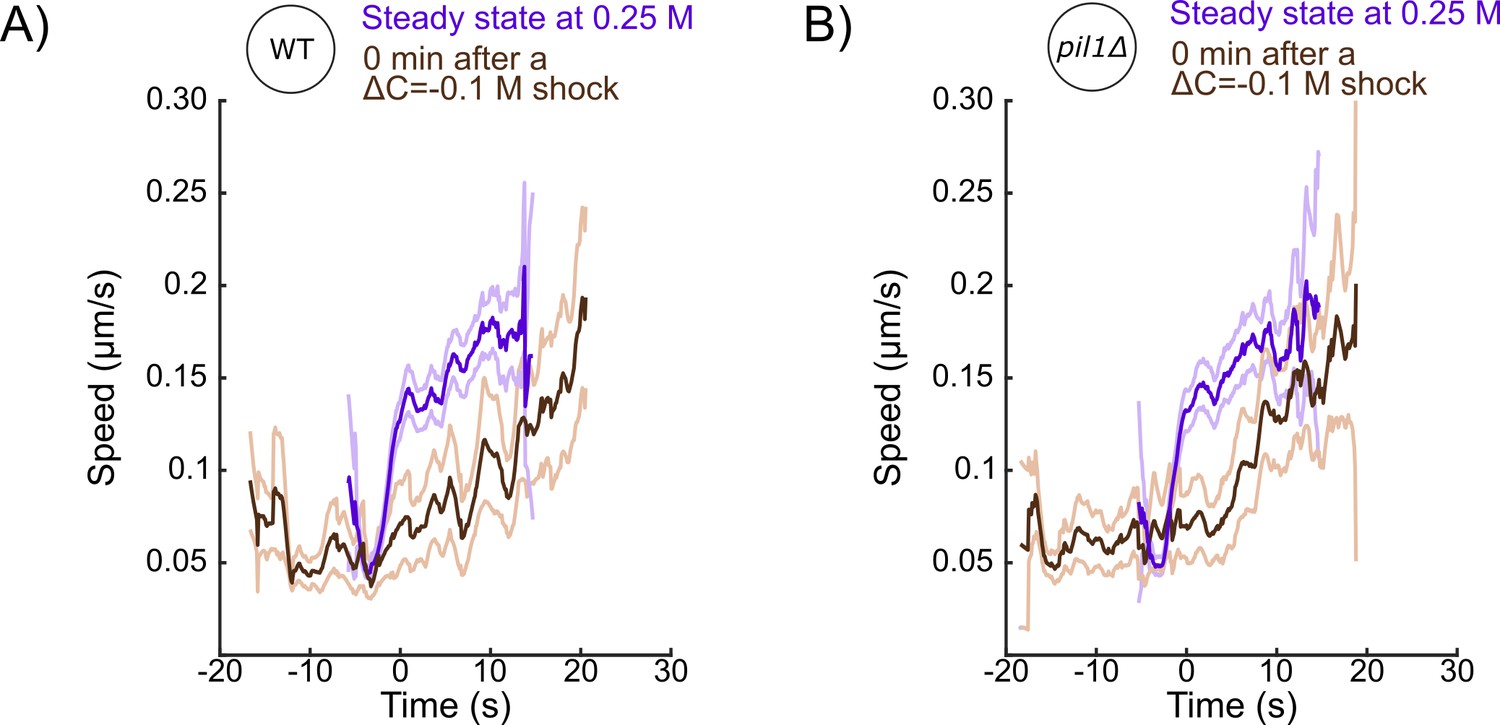
Speed of Fim1p-mEGFP at CME sites for wild-type (A) and pil1Δ (B) protoplasts at steady-state in 0.25 M sorbitol (purple) and immediately (0 min) after (brown) a hypotonic shock of ΔC = −0.1 M.
The same endocytic events as the ones used in Figure 7H (A) and 7I (B) have been used to generate these plots. The numbers of endocytic events used in each curve are given in Supplementary file 1k. Dark colors: average; light colors: average ± 95% confidence interval.
-
Figure 7—figure supplement 7—source data 1
Data for Figure 7—figure supplement 7.
- https://cdn.elifesciences.org/articles/62084/elife-62084-fig7-figsupp7-data1-v2.xlsx
Figure 8

Schematic of the adaptation of fission yeast endocytosis, exocytosis, and eisosome after acute hypotonic shock-induced increase in membrane tension.
(A) In an isotonic solution, endocytosis and exocytosis rates are largely balanced, and proteins including Pil1p are assembled at the plasma membrane to form eisosomes. Actin is recruited to endocytic sites to provide the forces needed to reshape the membrane under normal membrane tension. When present, cell wall makes fission yeast cell resistant to significant changes in the osmolarity of extracellular solution. (B) Acute hypotonic shock results in an increase in membrane tension, which leads to a decrease in endocytosis rate, an increase in exocytosis rate, and a rapid disassembly of eisosomes, within ~2 min. The proteins of the actin machinery are recruited in larger amounts to endocytic sites to provide larger forces for successful endocytosis under increased membrane tension. Failure of adaptation to the increase in membrane tension leads to membrane rupture and cell death in both protoplasts and walled cells.
Author response image 1
Tables
Key resources table
| Reagent type (species) or resource | Designation | Source or reference | Identifiers | Additional information |
|---|---|---|---|---|
| Strain, strain background (Schizosacchoromyces pombe) | Fim1p-mEGFP | Berro and Pollard, 2014a | SpJB57 | fim1-mEGFP-NatMX6 ade6-M216 his3-Δ1 leu1-32 ura4-Δ18 h+ |
| Strain, strain background (Schizosacchoromyces pombe) | Pil1p-mEGFP | Lacy et al., 2017 | SpJB204 | pil1-mEGFP-kanMX6 ade6-M216 his3-Δ1 leu1-32 ura4-Δ18 h- |
| Strain, strain background (Schizosacchoromyces pombe) | pil1Δ Fim1p-mEGFP | This study | SpJB234 | pil1Δ fim1-mEGFP-NatMX6 ade6-M216 his3-Δ1 leu1-32 ura4-Δ18 h- |
| Strain, strain background (Schizosacchoromyces pombe) | mScarlet-I-End4p mEGFP-Fim1p | This study | SpJB566 | mScarlet-I-end4 mEGFP-fim1 fex1Δ fex2Δ ade6-M216 his3-Δ1 leu1-32 ura4-Δ18 h- |
| Chemical compound, drug | FM4-64 | Biotium, Fremont, CA | ||
| Chemical compound, drug | Sulforhodamine B | MP Biomedicals LLC, Santa Ana | ||
| Chemical compound, drug | Latrunculin A | Millipore, MA | ||
| Chemical compound, drug | Brefeldin A | Santa Cruz Biotechnology Inc, TX | ||
| Software, algorithm | Matlab | Mathworks | R2016a, R2018b | |
| Software, algorithm | FIJI ImageJ | Schindelin et al., 2012; Schneider et al., 2012 | ||
| Software, algorithm | Trackmate | Tinevez et al., 2017 | ||
| Software, algorithm | PatchTrackingTools | This study, Berro, 2018 | Version 2015.12.16 | https://bitbucket.org/jberro/patchtrackingtools/src/stable/, copy archived at swh:1:rev:226505c08c2197584c1299462b5de85433d1fcf1. |
| Software, algorithm | PatchTrackingDataPostprocessing.Deterministic | This study, Berro, 2021 | #1B100-4 | https://bitbucket.org/jberro/patchtrackingdatapostprocessing.deterministic/src/master/, copy archived at swh:1:rev:3d96cd606f47a692dd6db55ba2aab0a7f6e0c4f2. |
| Other | Glass micropipette | World Precision Instruments, Sarasota | Version 160801 | |
| Chemical compound, drug | β-casein | Millipore-Sigma | Saint-Louis | |
| Software, algorithm | GraphPad Prism | Software, La Jolla, CA | version 8.4.2 |
Additional files
-
Supplementary file 1
Number of cells used to generate the figures of this paper.
(a) Figure 3A and Figure 3B. (b) Figure 3C. (c) Figure 3D. (d) Figure 6C and Figure 6—figure supplement 2A. (e) Figure 6D. (f) Figure 6E. (g) Figure 6G. (h) Figure 6H. (i) Figure 7C and Figure 7F. (j) Figure 7D and Figure 7G. (k) Figure 7H and Figure 7I. (l) Figure 7—figure supplement 1B and Figure 7—figure supplement 1C.
- https://cdn.elifesciences.org/articles/62084/elife-62084-supp1-v2.xlsx
-
Transparent reporting form
- https://cdn.elifesciences.org/articles/62084/elife-62084-transrepform-v2.docx
Download links
A two-part list of links to download the article, or parts of the article, in various formats.
Downloads (link to download the article as PDF)
Open citations (links to open the citations from this article in various online reference manager services)
Cite this article (links to download the citations from this article in formats compatible with various reference manager tools)
Rapid adaptation of endocytosis, exocytosis, and eisosomes after an acute increase in membrane tension in yeast cells
eLife 10:e62084.
https://doi.org/10.7554/eLife.62084


