Dissociation of impulsive traits by subthalamic metabotropic glutamate receptor 4
- The Research Institute of Molecular Pathology (IMP), Department of Neuroscience, Vienna Biocenter, Austria
- Department of Neuronal Cell Biology, Center for Brain Research, Medical University of Vienna, Austria
- Preclinical Imaging Facility, Vienna BioCenter Core Facilities (VBCF), Austria
- Div Research Germany, Boehringer Ingelheim, Germany
Figures
Figure 1 with 2 supplements
Brain-wide resting-state functional magnetic resonance imaging (rs-fMRI) associates subthalamic nucleus (STN) with trait impulsivity.
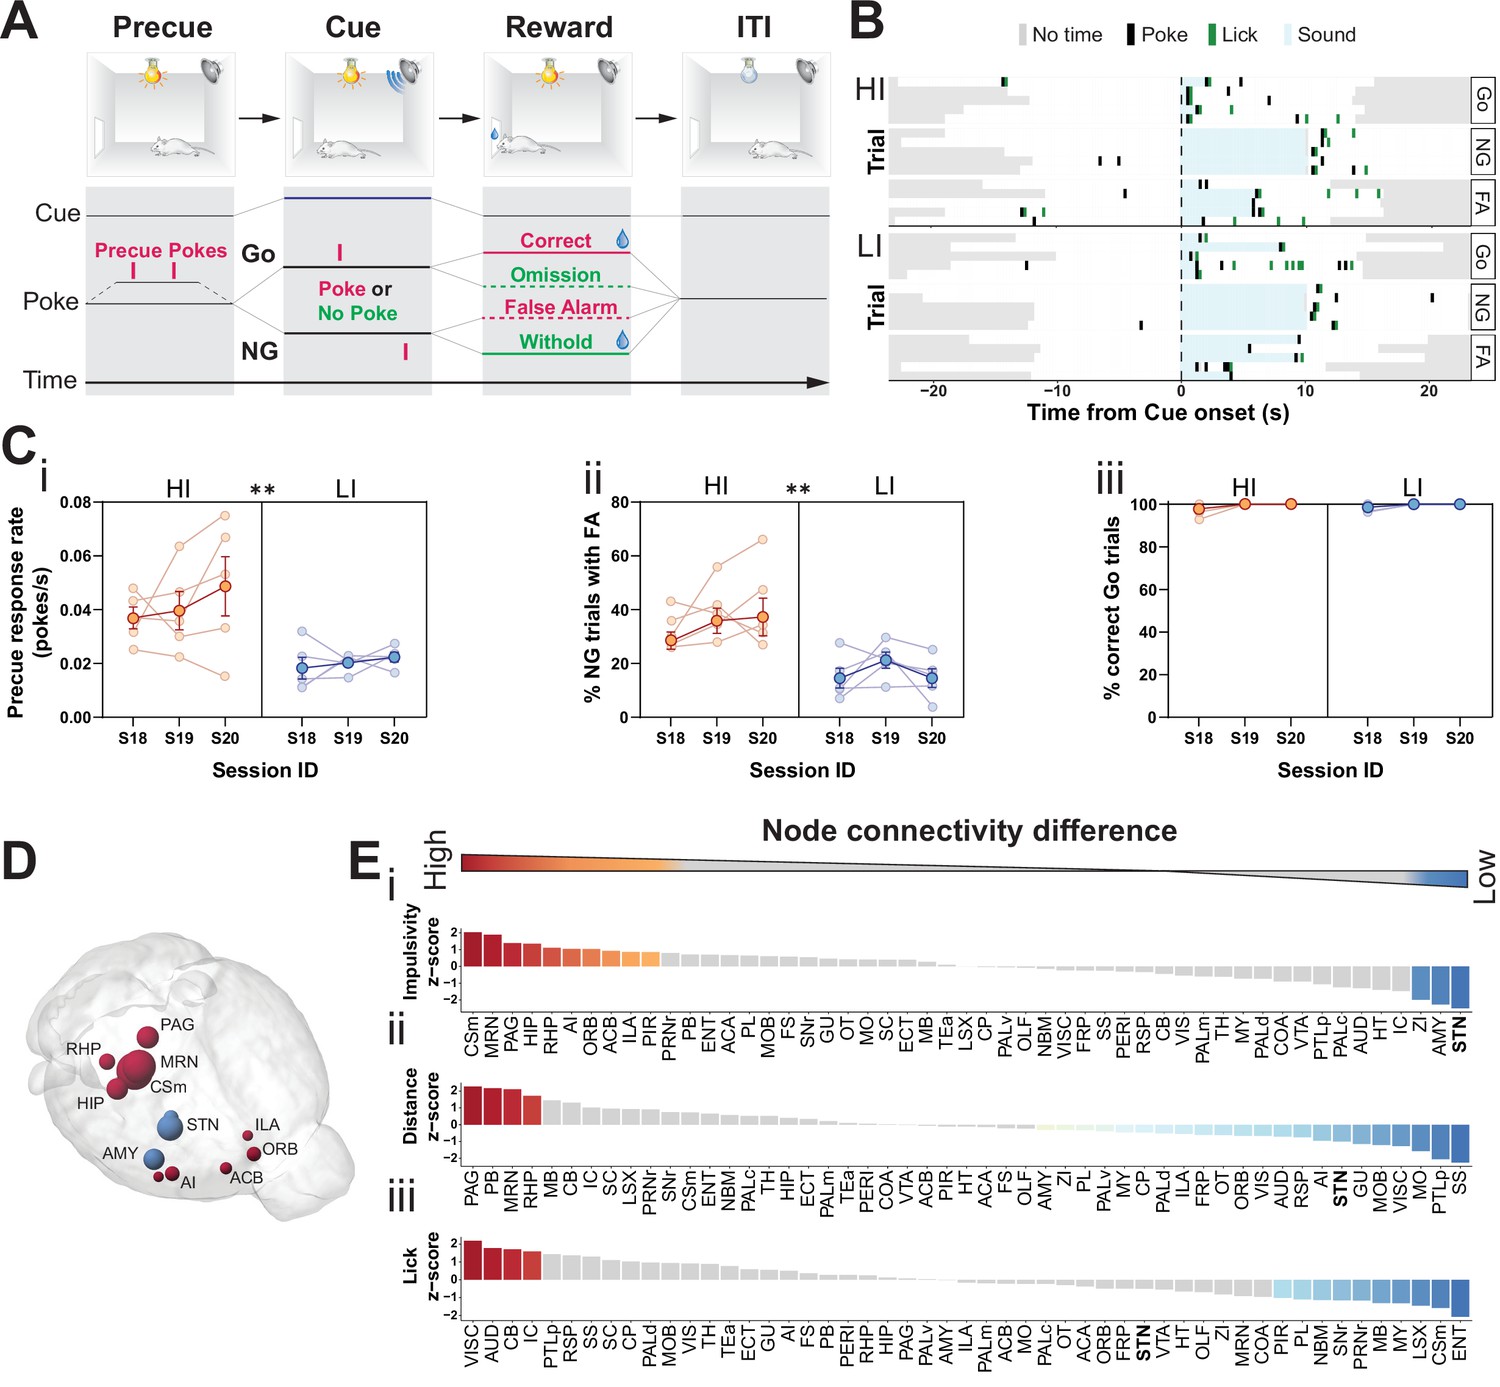
(A) Schematic description of the Go/No-Go (GNG) task. The start of each trial is cued by the light turning on (precue period). Precue responses are recorded. Correct Go responses and No-Go (NG) withholds are rewarded. Incorrect Go and NG responses are recorded as an omission and false alarm (FA), respectively, with no reward delivery (see Materials and methods for details). (B) Example of behavioral recording of individual animals from either the high impulsive (HI) or low impulsive (LI) group. Each row represents a single trial. Correct responses to a Go (Go) or NG trial, and FA responses to a NG trial (FA) are grouped. (C) Behavioral split into HI (N = 5) and LI (N = 5) animals (see Figure 1—figure supplement 1A) showing stable differences in (i) precue response rate (main effect of impulsivity F1,8 = 11.69, p = 0.009, no main effect of session F2,16 = 1.454, p = 0.263 and no interaction F2,16 = 0.389, p = 0.684). (ii) FAs (main effect of impulsivity F1,8 = 17.82, p = 0.003, no effect of session F2,16 = 1.511, p = 0.251 and no interaction F2,16 = 0.710, p = 0.507) in three consecutive sessions (S18–S20). (iii) A significant main effect for session was found for % of correct Go trials (F2,16 = 4.558, p = 0.027), but no main effect of impulsivity (F2,16 = 0.207, p = 0.815) or interaction (F2,16 = 0.207, p = 0.815). Group means ± SEM and single animal data in the background in the last three training sessions. (D, E) Brain-wide rs-fMRI identifies differences in functional connectivity. (D) 3D visualization of the node-wise one-sample t-tests from node-wise connectivity difference between HI vs. LI showing the STN as the node with the highest functional connectivity in LI animals when compared to HI. Color indicates that the mean node connectivity is higher in the HI group (red) or in LI animals (blue); size correlates with t-value. Only significantly different nodes are shown. (E) Ordered, normalized one-sample t-test t-values from node-wise connectivity strength measurements for splits based on (i) impulsivity parameters, (ii) total distance traveled, and (iii) number of licks in the GNG task. Gray bars indicate that the p value did not reach significance. Bonferroni corrected for multiple comparisons. *p < 0.05, **p < 0.01, ***p < 0.001, ****p < 0.0001. ACB – nucleus accumbens; AI – agranular insular area; AMY – amygdalar nuclei; Csm – superior central nucleus raphe; HIP – hippocampus; ILA – infralimbic area; MRN – MB reticular nucleus; ORB – orbital area; PAG – periaqueductal gray; RHP – retrohippocampal region; STN – subthalamic nucleus.
-
Figure 1—source data 1
Related to Figure 1C and E.
- https://cdn.elifesciences.org/articles/62123/elife-62123-fig1-data1-v2.xlsx
Figure 1—figure supplement 1
Behavioral splits of animals for the resting-state functional magnetic resonance imaging (rs-fMRI) screen.
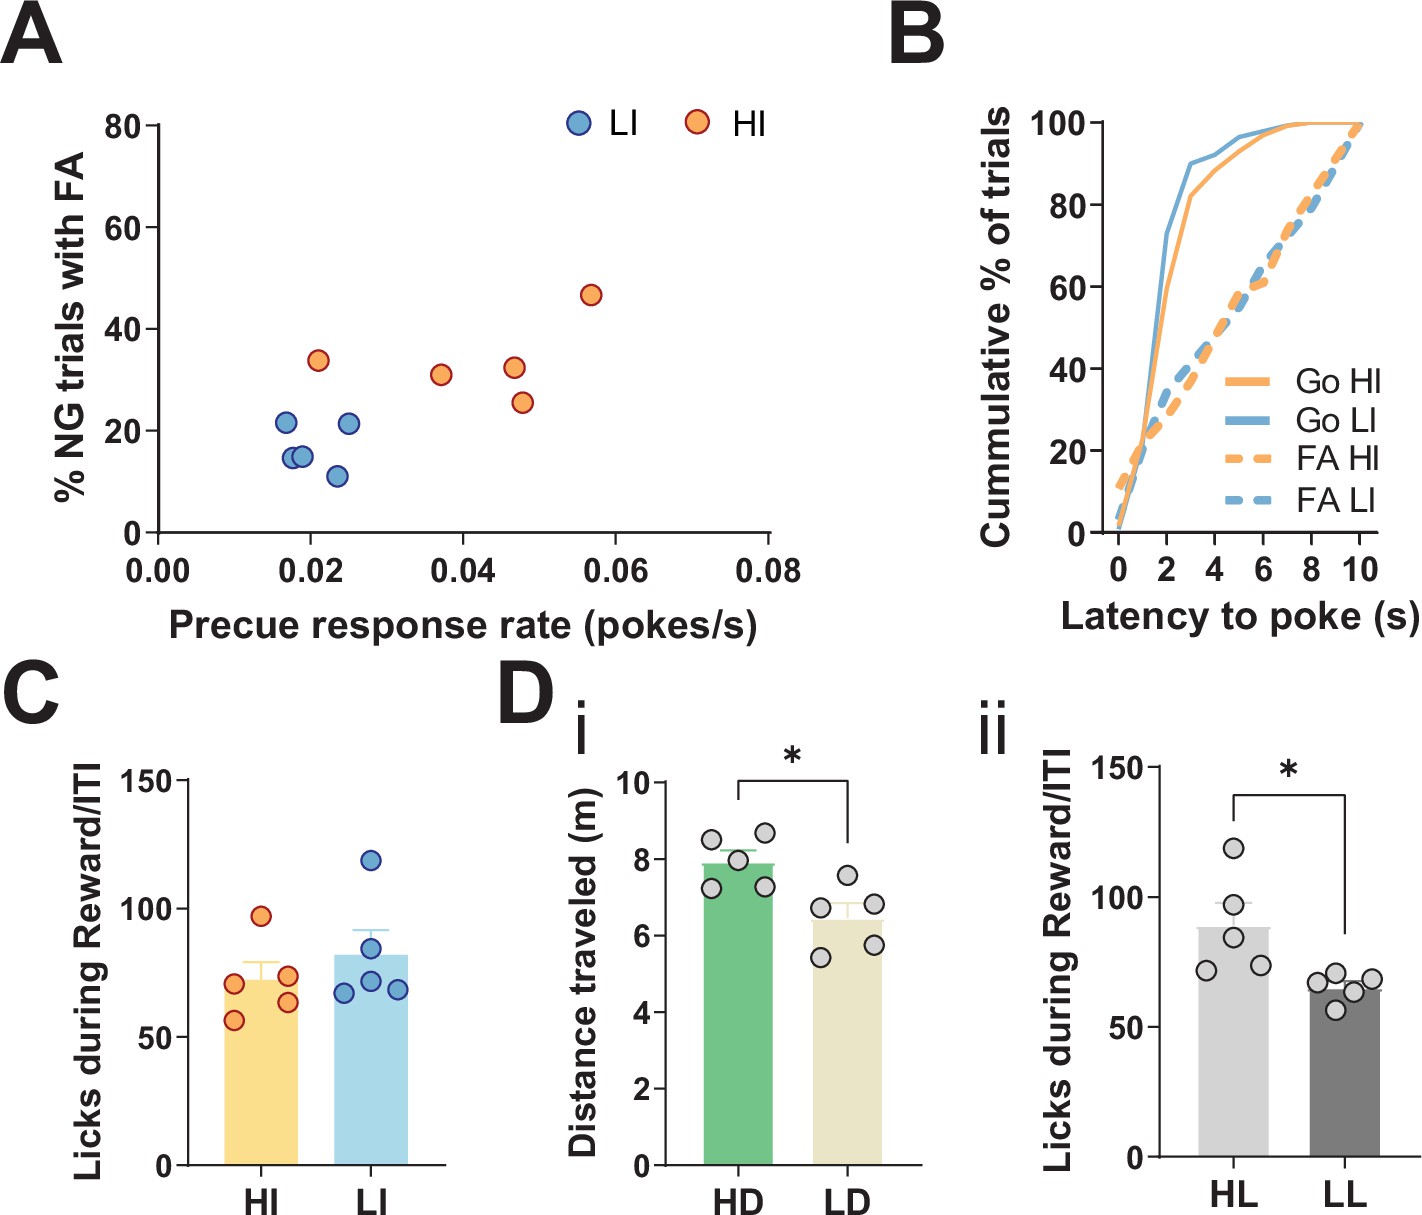
(A) Behavioral split into high impulsive (HI, N = 5) and low impulsive (LI, N = 5) animals, grouped into HI/LI based on precue response and false alarm (FA) rates. Mean single animal data for each category over the last three training sessions. (B) No difference in either distribution of latency to poke in incorrect No-Go (NG) trials (Kolmogorov-Smirnov test, D = 0.1177, p = 0.966) or correct Go trials (Kolmogorov-Smirnov test, D = 0.1426, p = 0.1316). Data shown as cumulative plots for all animals from a representative training session. (C) No difference between HI and LI animals in total number of licks in reward/inter-trial interval (ITI) periods per session, averaged across the last three training sessions (two-tailed t-test t8 = 0.8255, p = 0.433). (D) (i) Behavioral split of animals based on high (HD) and low (LD) distance traveled in the Go/No-Go (GNG) task (two-tailed t-test t8 = 2.996, p = 0.0172). N = 5 per group. (ii) Behavioral split of animals based on high (HL) and low (LL) number of licks during reward/ITI period in the GNG task (two-tailed t-test t8 = 2.654, p = 0.0291). *p < 0.05. N = 5 per group.
-
Figure 1—figure supplement 1—source data 1
Related to Figure 1—figure supplement 1A–D.
- https://cdn.elifesciences.org/articles/62123/elife-62123-fig1-figsupp1-data1-v2.xlsx
Figure 1—figure supplement 2
Brain-wide resting-state functional magnetic resonance imaging (rs-fMRI) screen for high impulsive (HI) vs. low impulsive (LI) animals.
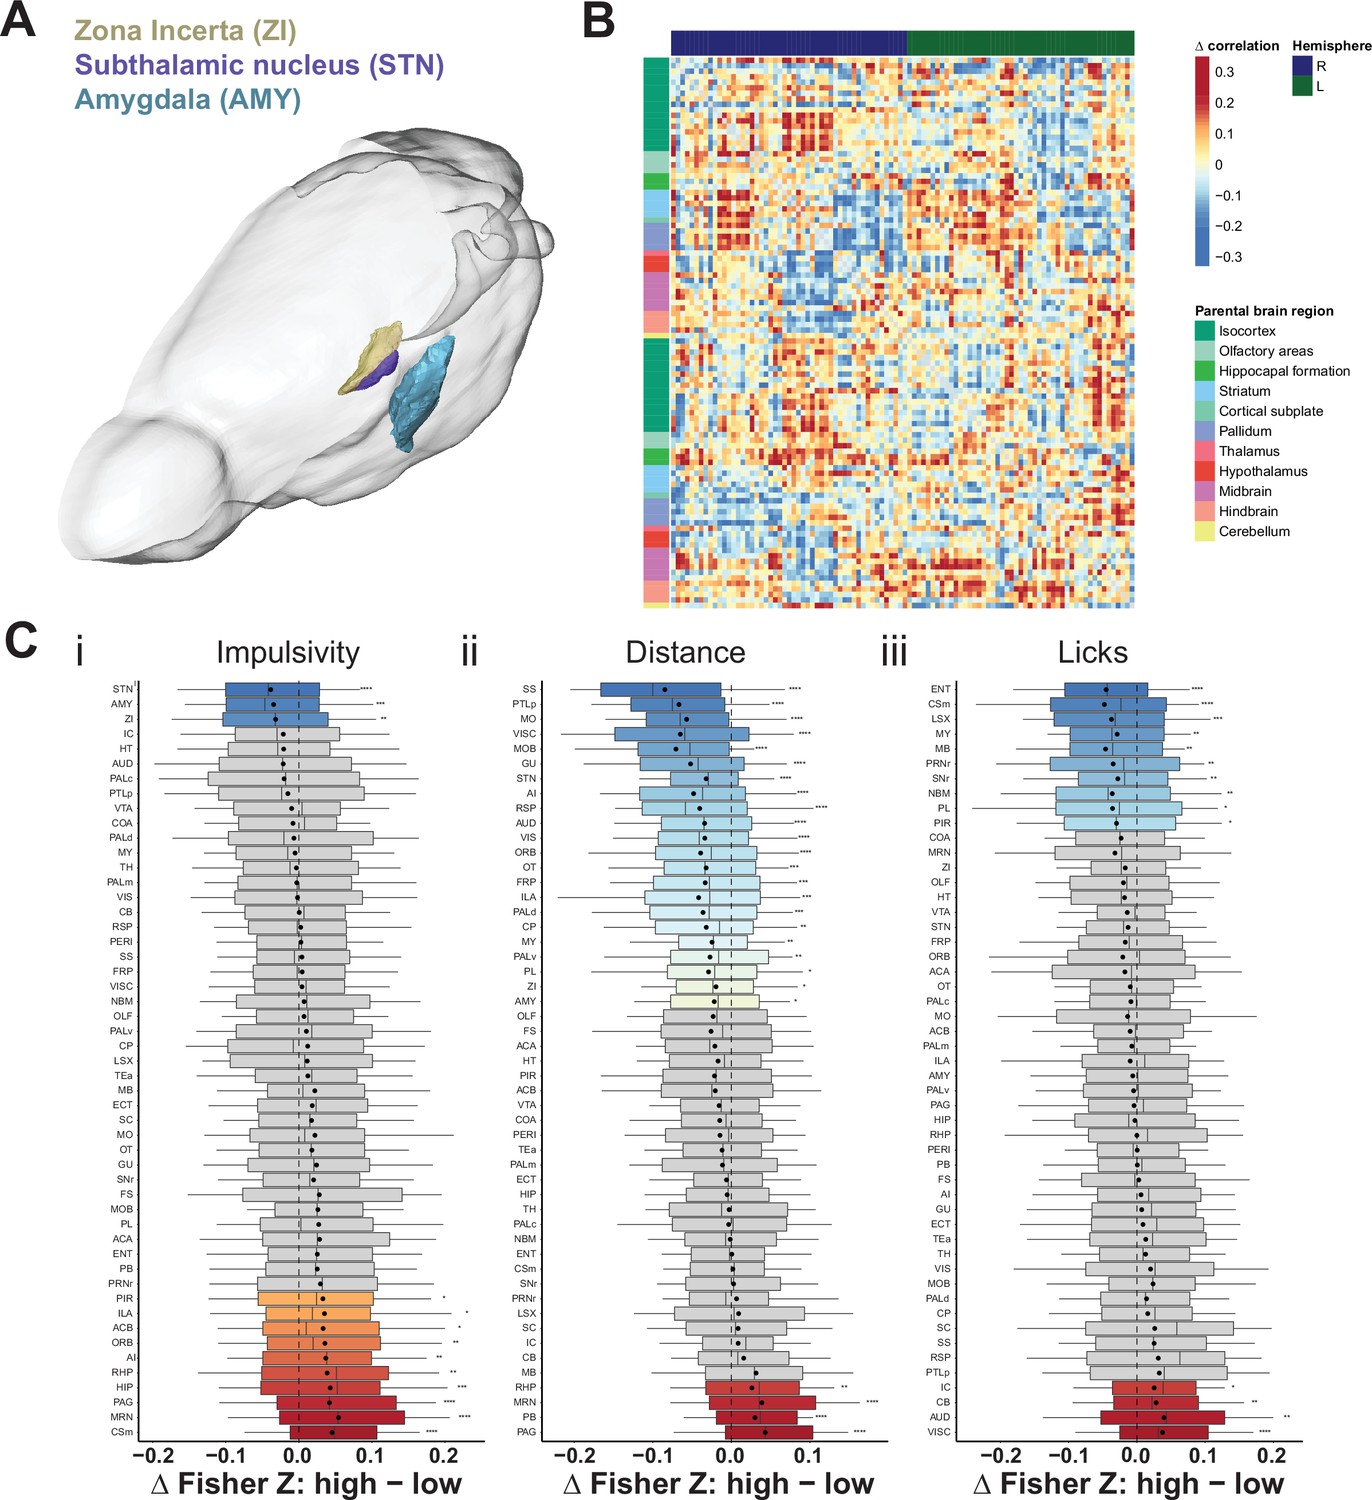
(A) Depiction of the position and area range for the top three candidate regions with the highest correlation measures in LI animals compared to their HI littermates. Note, only left hemisphere is shown. Scale bar = 5 mm. (B) Difference in mean cross-correlation in HI and LI groups of animals. (C) Node-wise difference of Fisher Z-transform of correlation between (i) impulsivity levels (HI vs. LI), (ii) distance traveled (high [HD] vs. low [LD]), and (iii) licks (high [HL] vs. low [LL]). Box–whisker plots display median, interquartile range, and tenth to ninetieth percentiles of the distribution, dot indicates mean. *p < 0.05, **p < 0.01, ***p < 0.001, ****p < 0.0001. ACA – anterior cingulate area; ACB – nucleus accumbens; AI – agranular insular area; AMY – amygdalar nuclei; AUD – auditory area; CB – cerebellum; COA – amygdala cortex; CP – caudoputamen; Csm – superior central nucleus raphe; ECT – ectorhinal area; ENT – entorhinal area; FRP – frontal pole; FS – fundus of striatum; GU – gustatory areas; HIP – hippocampus; HT – hypothalamus; IC – colliculi inferior; ILA – infralimbic area; LSX – lateral septal complex; MO – somatomotor areas; MRN – MB reticular nucleus; MY – rostromedial medulla; NBM – nucleus basalis of Meynert; OLF – olfactory area; ORB – orbital area; OT – olfactory tubercle; PAG – periaqueductal gray; PALc – pallidum caudal; PALd – pallidum dorsal; PALm – pallidum medial; PALv – pallidum ventral; PB – parabrachial nucleus; PERI – perirhinal area; PIR – piriform; PL – prelimbic area; PRNr – pontine reticular nucleus; PTLp – post parietal association area; RHP – retrohippocampal region; RSP – retrosplenial area; SC – superior colliculus; SNr – substantia nigra; SS – somatosensory areas; STN – subthalamic nucleus; TEa – temporal association area; TH – thalamus; VIS – visual area; VISC – visceral area; VTA – ventral tegmental area; ZI – zona incerta.
-
Figure 1—figure supplement 2—source data 1
Related to Figure 1—figure supplement 2C.
- https://cdn.elifesciences.org/articles/62123/elife-62123-fig1-figsupp2-data1-v2.xlsx
Figure 2 with 3 supplements
Subthalamic nucleus (STN) differentiates impulsivity from motor parameters in the Go/No-Go (GNG) task.
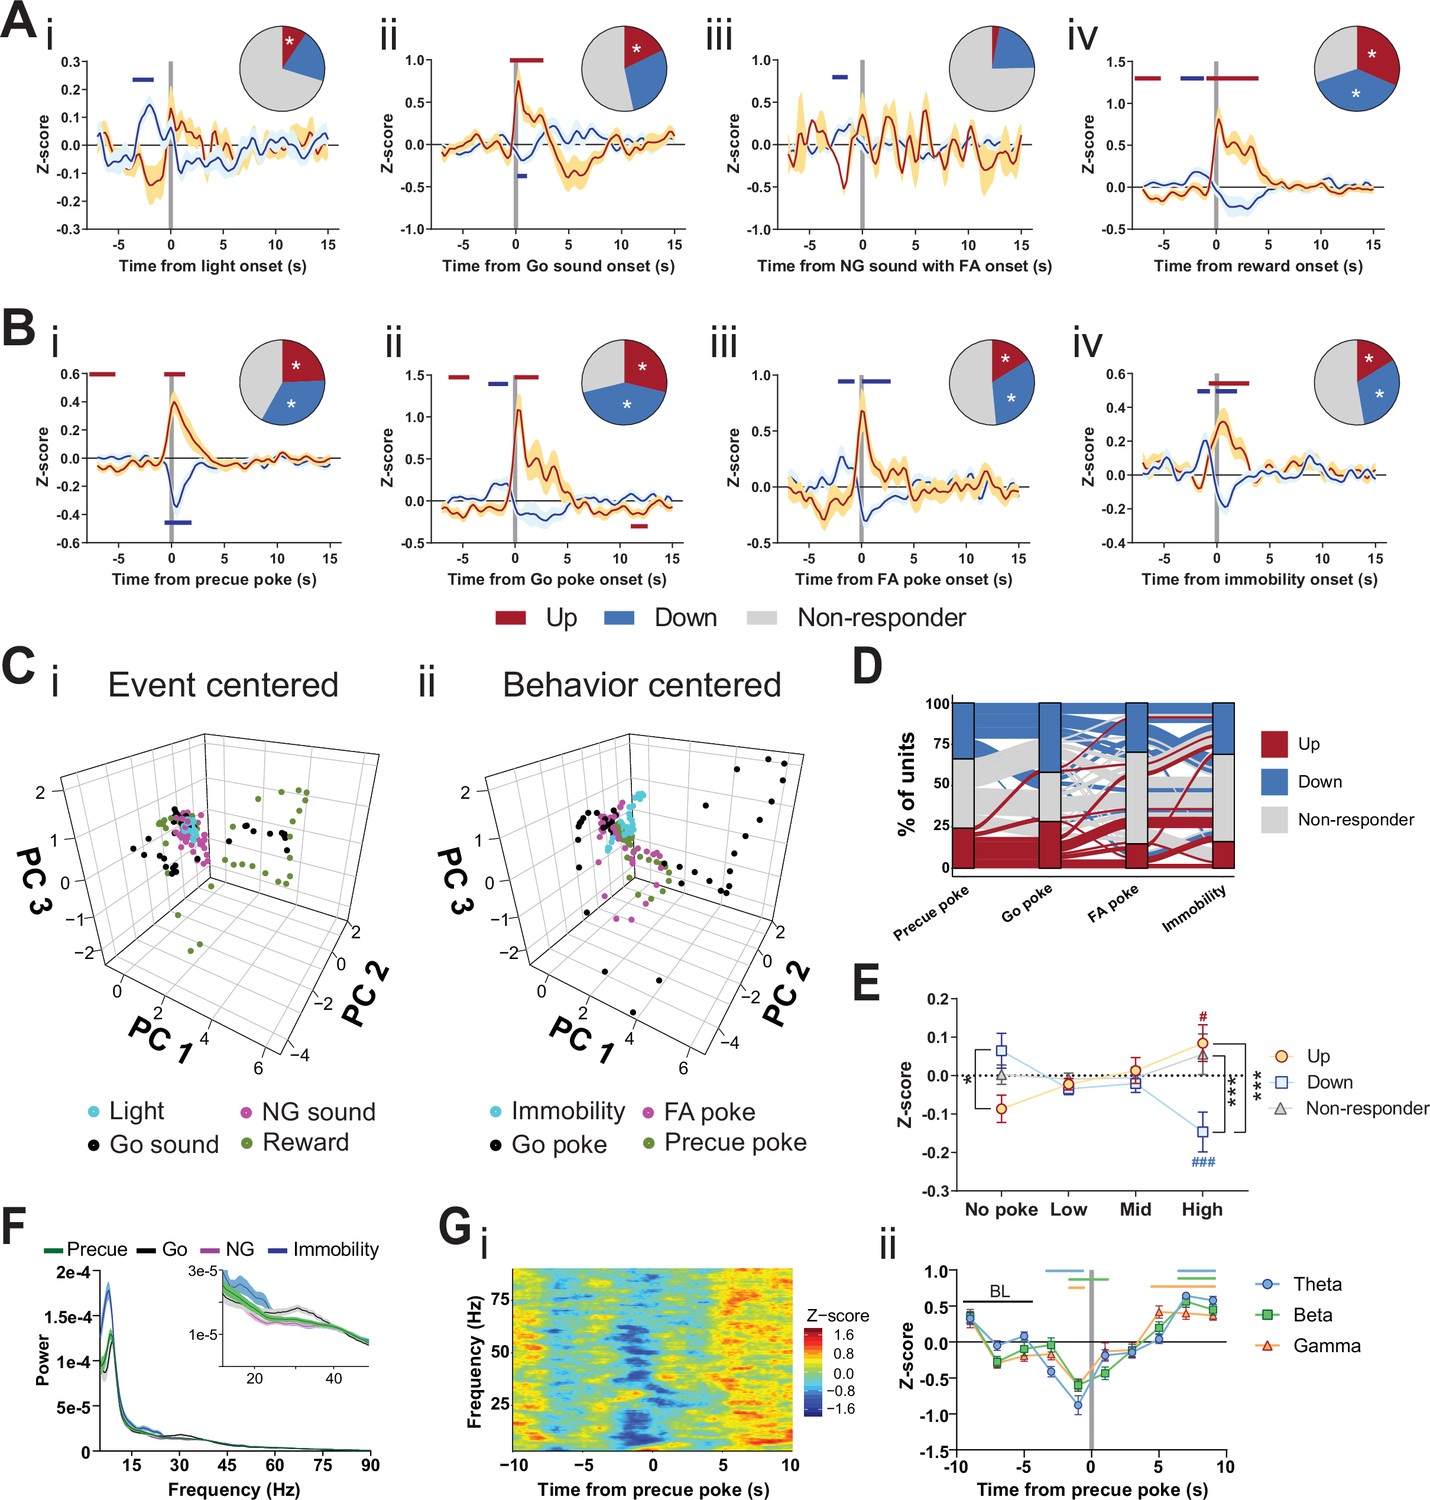
(A, B) Population traces of excited (up) and inhibited (down) units. (A) Peri-event data of unit responses aligned to stimulus onsets: light onset (Ai, nUp = 7, nDown = 15 from NAnimals = 3), Go sound followed by correct response (Aii), nUp = 13, nDown = 21 from NAnimals = 3), No-Go (NG) sound followed by false alarm (FA) (Aiii, nUp = 3, nDown = 14 from NAnimals = 3), reward (Aiv, nUp = 23, nDown = 28 from NAnimals = 3) and behavioral onsets (B) of precue poke (Bi, nUp = 18, nDown = 25), Go poke (Bii, nUp = 21, nDown = 31 from NAnimals = 3), FA poke (Biii, nUp = 11, nDown = 22 from NAnimals = 3), immobility (Biv, nUp = 12,nDown = 23 from NAnimals = 3). Horizontal colored bars at the top of each panel indicate time bins with a significantly different firing rate to the baseline firing rate (p < 0.05, cluster-based permutation tests). Circles represent the proportion of cells excited (red), inhibited (blue), or non-responsive to a given event (* given population reached significance in the permutation test). (C) Population activity vectors in PCA space for stimulus-driven peri-events in panel (A) (i) and behavior-driven peri-events shown in panel (B) (ii) in a –5 to 5 s time window. (D) Alluvial plot of individual STN units to precue poke, Go sound with correct response, NG sound followed by FA and immobility onsets. The width of the ribbon is proportional to the fraction of units with a given response pattern. Ribbons are color coded according to precue poke responses. (E) Change in mean firing rate during the entire precue period of unit populations (split by response to precue poke) on trials with no precue poke, low (<0.15), mid (0.15–0.3), and high (>0.3) precue response rate (nUp = 18, nDown = 25, nNon-responder = 31 from NAnimals = 3). *p < 0.05, ***p < 0.001. (F) LFP power spectra in STN during precue, Go sound, NG sound, and immobility periods (Nanimals = 3). (G) Within frequency Z-scored LFP spectrogram (i) and frequency band-averaged, 2s-binned time course thereof (ii) in the STN, both centered around precue pokes. Mean Z-score ± SEM from nChannels = 48, NAnimals = 3. Colored lines indicate significant differences to the baseline (BL) period in the respective frequency band, as determined by two-way ANOVA (significant main effect of time (F4.438,625.8 = 65.59, p < 0.0001) and time × frequency band interaction (F14,987 = 2.926, p = 0.0002) and Dunnet post hoc analysis (p < 0.05)).
-
Figure 2—source data 1
Related to Figure 2A, B, E, F and Gii.
- https://cdn.elifesciences.org/articles/62123/elife-62123-fig2-data1-v2.xlsx
Figure 2—figure supplement 1
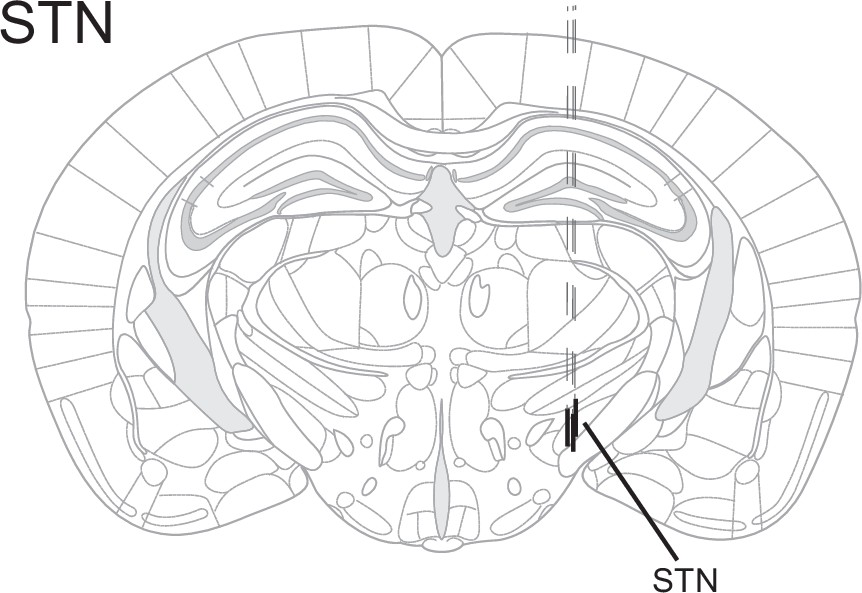
Electrode placement.
Electrode placement in electrophysiology experiments for subthalamic nucleus (STN). Each line represents one animal.
Figure 2—figure supplement 2
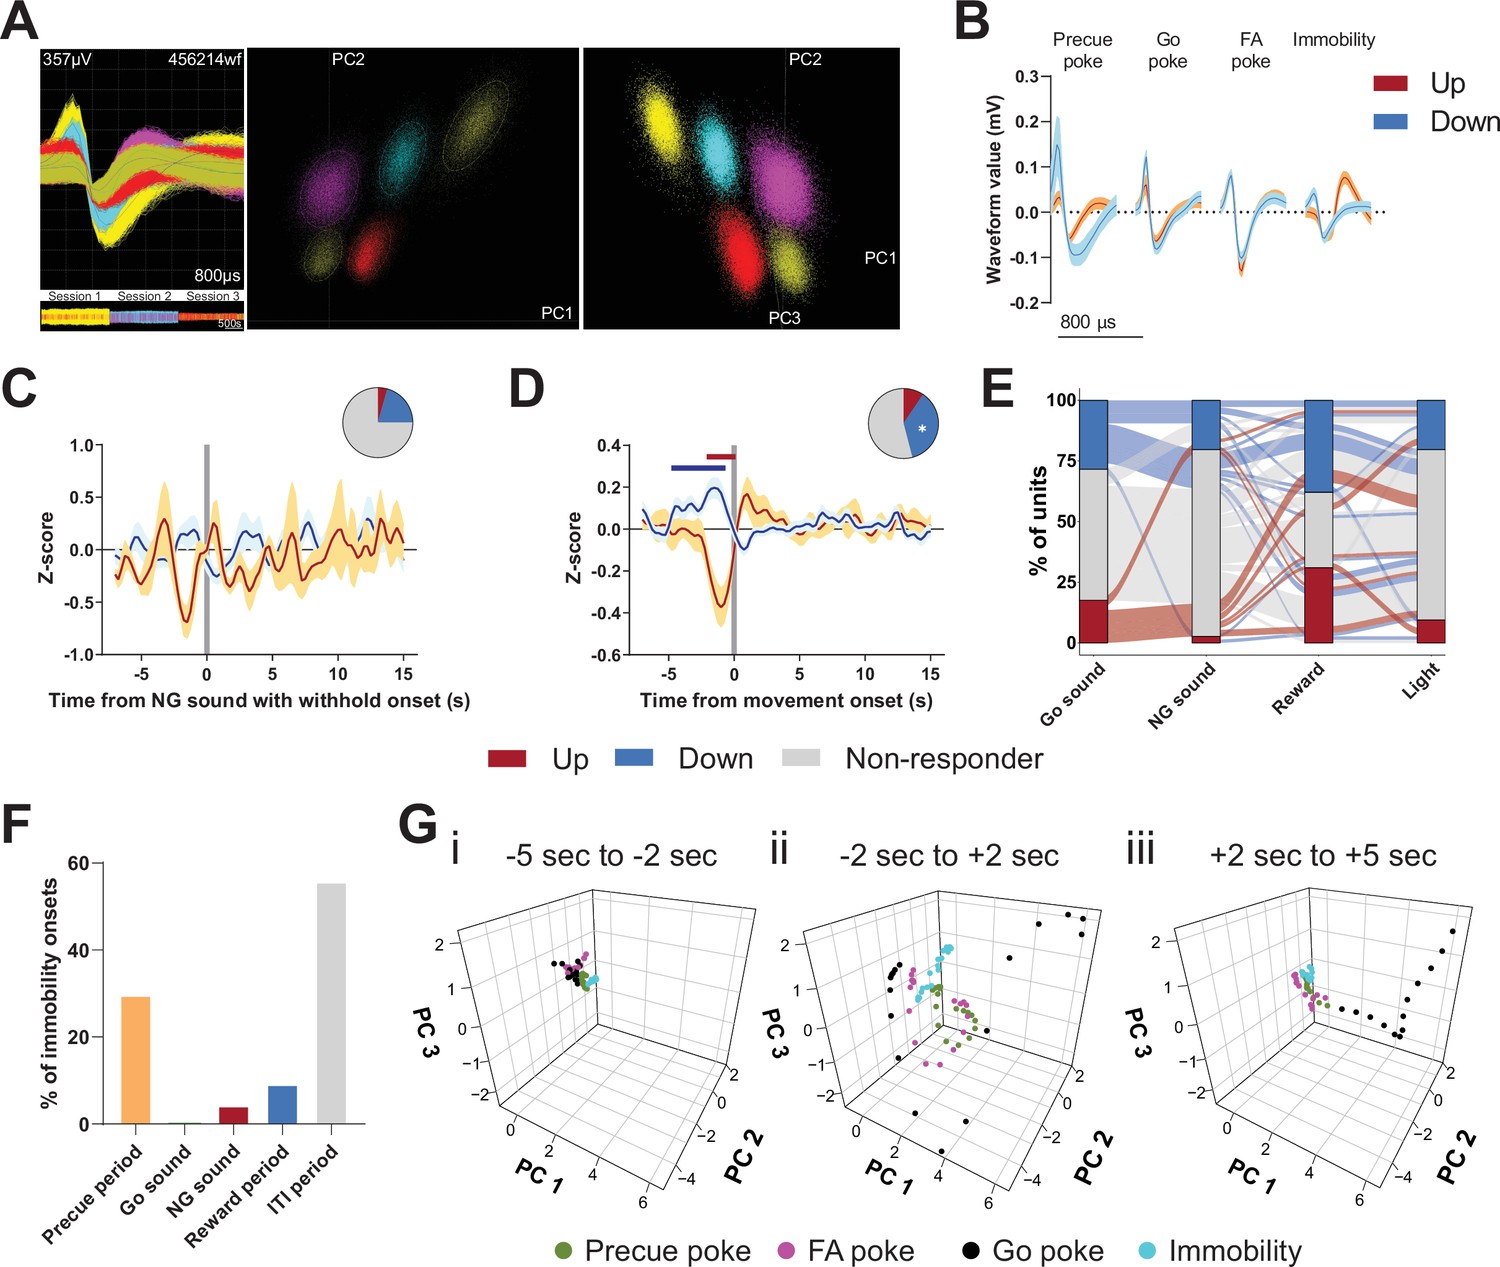
Encoding of Go/No-Go (GNG) task parameters in the subthalamic nucleus (STN).
(A) Example of waveforms and unit sorting in principal component analysis (PCA) space done on concatenated data from three behavioral sessions. (B) Representative waveforms for units shown in Figure 2. (C–D) Peri-event data showing unit responses aligned to onsets of sound in No-Go (NG) trials followed by withhold (C, nUp = 2, nDown = 15 from NAnimals = 3) and movement (D, nUp = 7, nDown = 27 from NAnimals = 3). Horizontal colored bars at the top of each panel indicate bins with a significantly different firing rate vs. baseline firing (p < 0.05, cluster-based permutation test). Circles represent the proportion of cells excited (red), inhibited (blue), or non-responding to a given event (* given population reached significance in permutation test). (E) Alluvial plot showing the variety of response patterns of STN units to Go sound and NG sound followed by poke, reward, and light onsets. The width of the ribbon is proportional to the fraction of units with a given response pattern. Ribbons are color-coded according to Go sound responses. (F) Distribution of immobility onsets across the different task periods. (G) Population activity vectors in PCA space for given peri-events from Figure 2Cii, split by time relative to event onset.
-
Figure 2—figure supplement 2—source data 1
Related to Figure 2—figure supplement 2B, C, D,F.
- https://cdn.elifesciences.org/articles/62123/elife-62123-fig2-figsupp2-data1-v2.xlsx
Figure 2—figure supplement 3
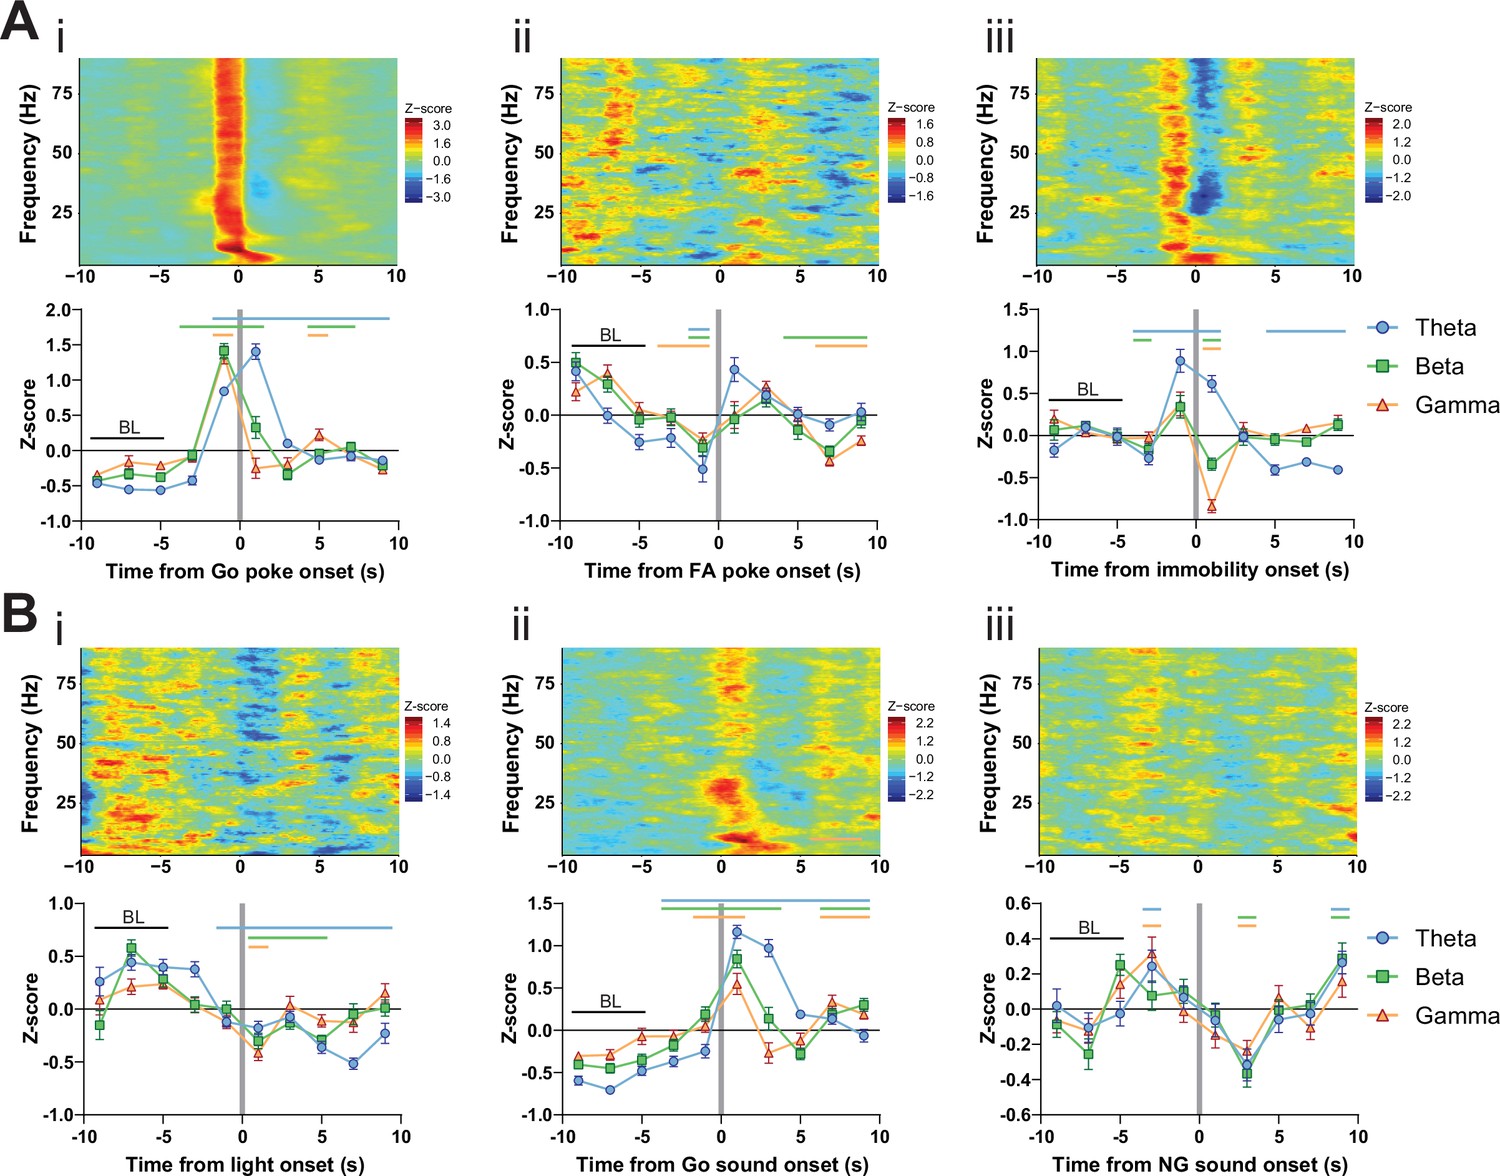
LFP time courses for Go/No-Go (GNG) task parameters in the subthalamic nucleus (STN).
(A) Within-frequency Z-scored LFP power spectra (upper) and frequency band-averaged, 2s-binned (lower) time courses in the STN aligned to Go pokes (i), false alarm (FA) pokes (ii) and immobility onset (iii). Two-way repeated measures (RM) ANOVA revealed significant main effects of time (F2.697,380.3 = 110.6, p < 0.0001) and frequency band (F2,141 = 11.62, p < 0.0001), and a significant time × frequency band interaction (F14,987 = 18.78, p < 0.0001) for (i), significant main effects of time (F3.805,536.6 = 18.69, p < 0.0001) and frequency band (F2,141 = 4.06, p = 0.019), and a significant time × frequency band interaction (F14,987 = 3.505, p < 0.0001) for (ii), and a significant main effect of time (F7,987 = 23.14, p < 0.0001), no main effect of frequency band (F2,141 = 0.824, p = 0.441), but a significant time × frequency band interaction (F14,987 = 16.97, p < 0.0001) for (iii). (B) Within-frequency Z-scored LFP power spectra (upper) and frequency band-averaged, 2s-binned (lower) time courses in the STN aligned to light onset (i), Go sound onset (ii) and No-Go (NG) sound onset (iii). Two-way RM ANOVA revealed a significant main effect of time (F4.571,644.5 = 21.10, p < 0.0001), no main effect of frequency band (F2,141 = 1.933, p = 0.149), but a significant time × frequency band interaction (F14,987 = 4.772, p < 0.0001) for (i), significant main effects of time (F2.960,417.3 = 56.93, p < 0.0001) and frequency band (F2,141 = 16.16, p < 0.0001), and a significant time × frequency band interaction (F14,987 = 13.00, p < 0.0001) for (ii), and a significant main effect of time (F4.620,651.4 = 15.04, p < 0.0001), no main effect of frequency band (F2,141 = 0.0417, p = 0.959), and no time × frequency band interaction (F14,987 = 0.956, p = 0.498) for (iii). Mean Z-score ± SEM from nChannels = 48, NAnimals = 3. Colored lines indicate significant differences to the baseline (BL) period in the respective frequency band, as determined by two-way RM ANOVA and Dunnet post hoc analysis (p < 0.05).
-
Figure 2—figure supplement 3—source data 1
Related to Figure 2—figure supplement 3.
- https://cdn.elifesciences.org/articles/62123/elife-62123-fig2-figsupp3-data1-v2.xlsx
Figure 3 with 2 supplements

Optogenetic perturbation of the STN modulates impulsivity.
Manipulation of STN activity during the precue period (A–B) or cue period (C–D) in the Go/No-Go (GNG) task. (A, C) Example behavioral traces for single animals from control (AAV::GFP), STN activation (AAV::ChR2), and STN inhibition (AAV::Arch) groups in the correct Go (Go), correct No-Go (NG), and NG trials with false alarm (FA). Top shows a no laser session. Bottom shows a behavior session with laser during the respective task period. Each row represents a single trial. (B) STN manipulation during the precue period (i) affects impulsivity parameters (two-way repeated measures (RM) MANOVA main effect of laser time F1,22 = 5.921, p = 0.0087, main effect of virus group F2,46 = 4.691, p = 0.0029, and interaction between the two F2,46 = 4.821, p = 0.0025). Two-way RM ANOVA on % correct Go trials (ii) showed a significant main effect of laser time (F1,23 = 6.985, p = 0.0145), but no significant main effect of virus group (F2,23 = 2.584, p = 0.097) and no significant interaction between the two (F2,23 = 2.613, p = 0.095). NControl = 7, NAAV::ChR2 = 11 and NAAV::Arch = 8. (D) Manipulation of the STN during the cue period (i) affects GNG task parameters (two-way RM MANOVA main effect of laser time F1,23 = 23.52, p < 0.0001, main effect of virus group F2,48 = 4.309, p = 0.0029, and interaction between the two F2,48 = 3.673, p = 0.0109). Two-way RM ANOVA on precue response rate (ii) showed no significant main effect of laser time (F1,24 = 2.089, p = 0.161), no significant main effect of virus group (F2,24 = 1.08, p = 0.356) and no interaction between the two (F2,24 = 1.1, p = 0.349). NControl = 10, NAAV::ChR2 = 7 and NAAV::Arch = 10. **p < 0.01, ***p < 0.001, ****p < 0.0001, #p vs. AAV::GFP during the same behavioral session (treatment level). On the scatterplot # indicates the axis-bound parameter.
-
Figure 3—source data 1
Related to Figure 3B,D and Figure 3—figure supplement 2Bi,Ci,Di,Ei.
- https://cdn.elifesciences.org/articles/62123/elife-62123-fig3-data1-v2.xlsx
Figure 3—figure supplement 1
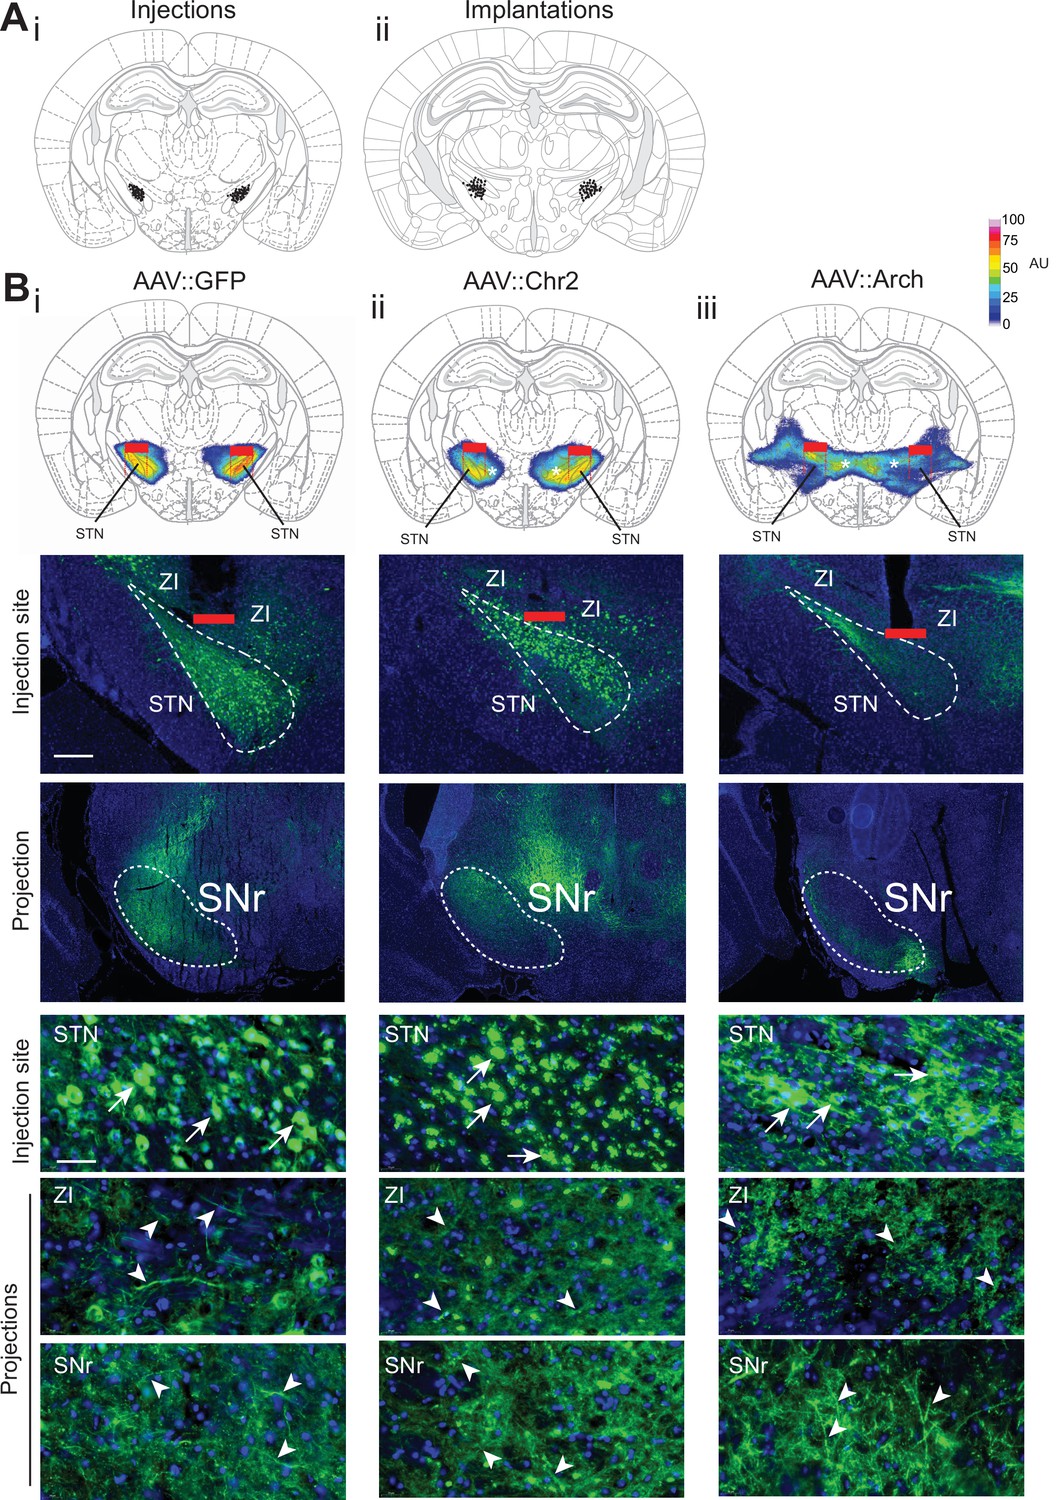
Histological evaluation of STN optogenetic viral injections.
(A) Histological evaluation for all animals used for optogenetic interrogation in Go/No-Go (GNG) and/or open field (OF), with center of viral injection (i) and fiber tip placement (ii). (B) Top, STN targeted viral expression across experimental groups (i–iii). The fiber placement has been marked in red and overlaid with quantification of the viral expression. Note that viral fluorescence also spreads into known STN projection fields zona incerta (ZI) (asterisks) and substantia nigra pars reticulata (SNr), driven by neurite targeting of Channelrhodopsin-2 (ChR2) and Archaerhodopsin (Arch) proteins (Han et al., 2011). Optogenetic illumination and modulation, however, is restricted to neurons in STN proper, up to 500 μm ventral to optical fiber (dotted red lines). Bottom, low and high magnification images of virally infected cells in the STN (arrows) and their projection targets (arrowheads) in ZI and SNr. Infected cell bodies are much more restricted to STN (bottom), reflecting the group averages of the fluorescent signals (top). Scale bar = 200 µm for low magnification injection/projection site images. Scale bar = 20 µm for high magnification injection/projection site images.
Figure 3—figure supplement 2
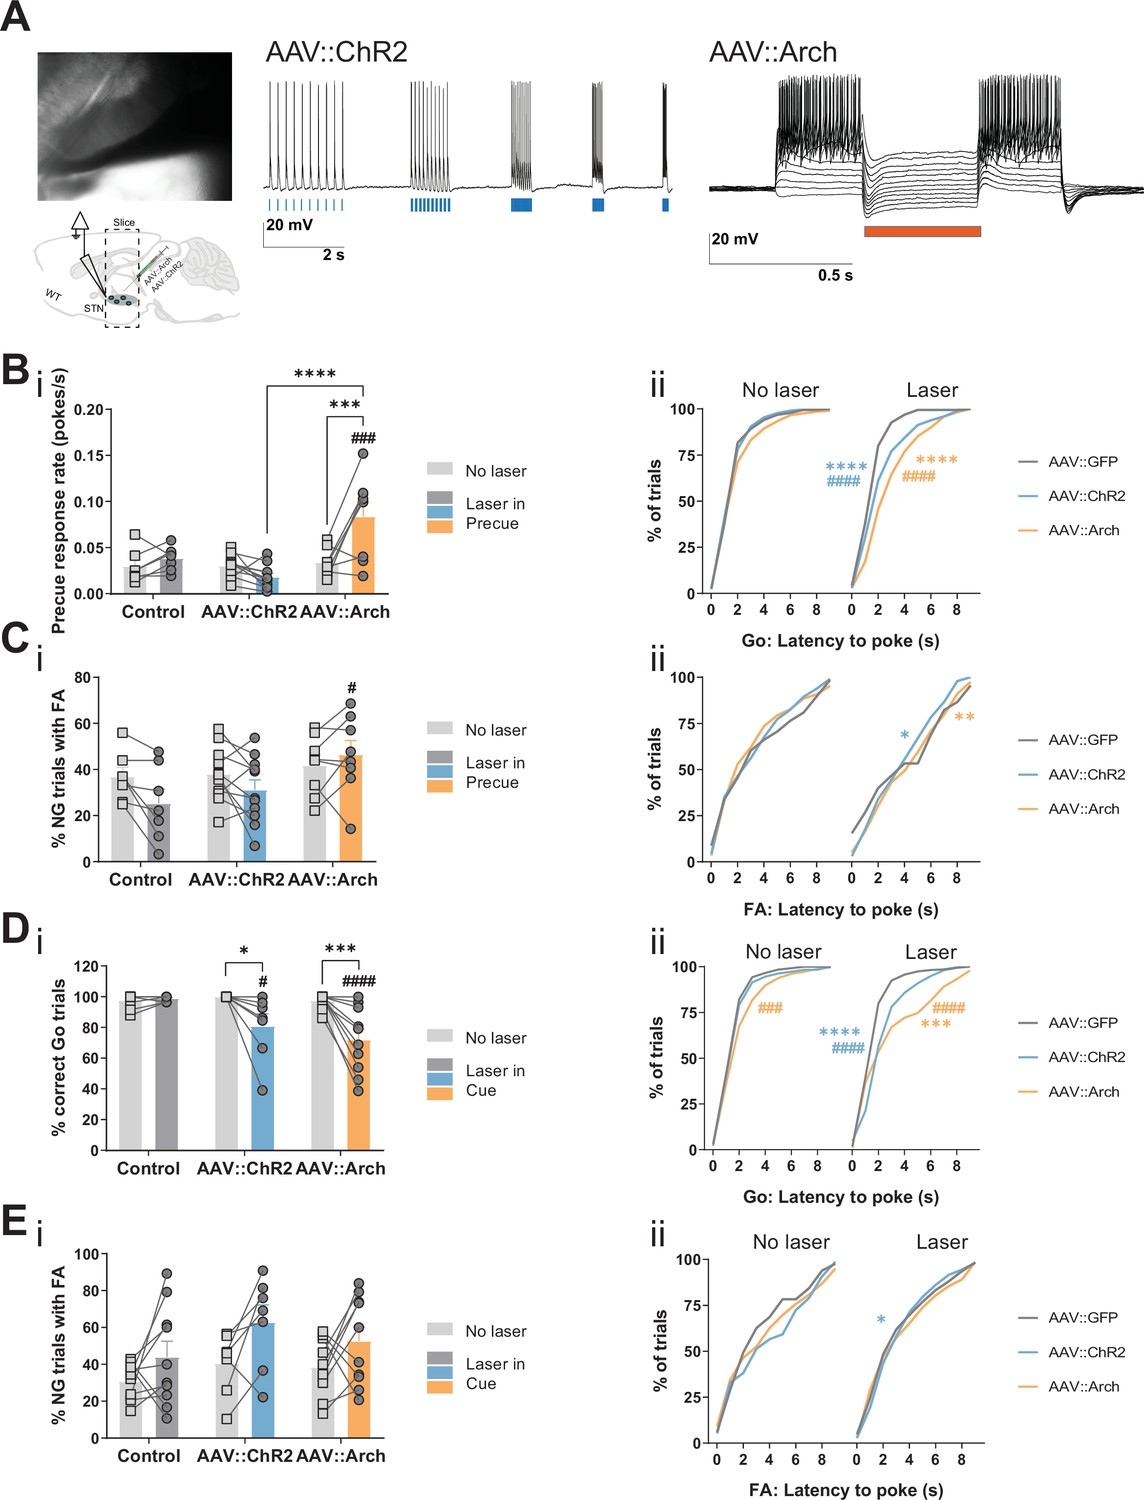
STN optogenetic manipulation of Go/No-Go (GNG) task parameters.
(A) Whole cell patch clamp recordings from neurons in the STN (left) show their responsiveness to optogenetic manipulation. 473 nm Laser pulses (5, 10, 20, 40, 80 Hz) induced action potentials with high fidelity in neurons infected with AAV::ChR2 (middle) whereas a 563 nm laser pulse (20 Hz) induced hyperpolarization in depolarized AAV::Arch infected neurons (right). (B–C) Laser in precue. NControl = 7, NAAV::ChR2 = 11, and NAAV::Arch = 8. (B) (i) Two-way repeated measures (RM) ANOVA on precue response rate revealed significant main effect of laser time (F1,23 = 7.122, p = 0.0137), significant main effect of virus group (F2,23 = 10.14, p = 0.0007), and an interaction between the two (F2,23 = 10.73, p = 0.0005). Cumulative distribution of latency to poke in correct Go trials (ii). (C) Two-way RM ANOVA on % of No-Go (NG) trials with false alarm (FA) (i) revealed no significant main effect of laser time (F1,23 = 3.336, p = 0.081), no significant main effect of virus group (F2,23 = 2.255, p = 0.128), but significant interaction between the two (F2,23 = 3.454, p = 0.0488). Cumulative distribution of latency to poke in incorrect NG trials (ii). (D–E) Laser in cue. NControl = 10, NAAV::ChR2 = 7, and NAAV::Arch = 10. (D) (i) Two-way RM ANOVA on % of correct Go trials (i) revealed a significant main effect of laser time (F1,24 = 21.79, p < 0.0001), a significant main effect of virus group (F2,24 = 5.221, p = 0.0131), and a significant interaction between the two (F2,24 = 7.691, p = 0.0026). Laser manipulation effect in the distribution of response latency in correct Go trials (Kolmogorov-Smirnov test) (ii). (E) Two-way RM ANOVA on % of NG trials with FA (i) revealed a significant main effect of laser time (F1,24 = 9.127, p = 0.006), no significant main effect of virus group (F2,24 = 1.964, p = 0.162), and no interaction between the two (F2,24 = 0.246, p = 0.784). Cumulative distribution of latency to poke in incorrect NG trials (ii). *p < 0.05, **p < 0.01, ***p < 0.001, ****p < 0.0001, #p vs. AAV::GFP during same behavioral session (treatment level).
-
Figure 3—figure supplement 2—source data 1
Related to Figure 3—figure supplement 2Bii, Cii, Dii, Eii.
- https://cdn.elifesciences.org/articles/62123/elife-62123-fig3-figsupp2-data1-v2.xlsx
Figure 4 with 2 supplements
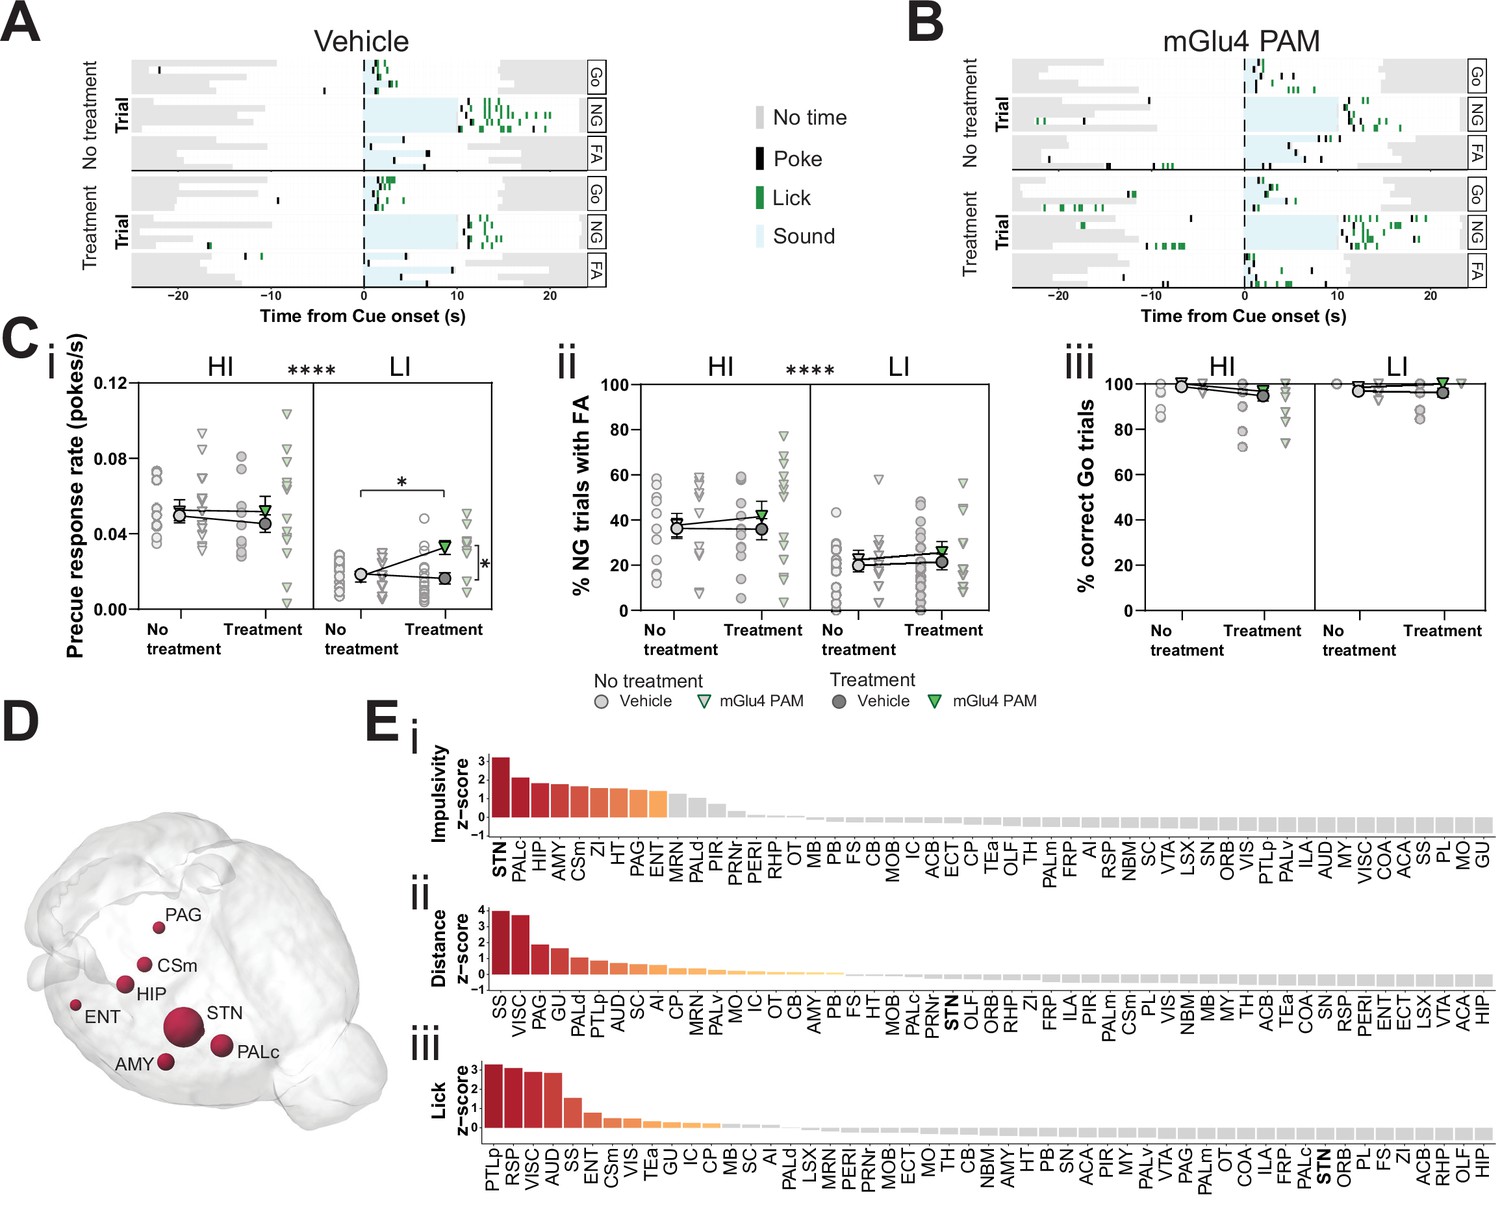
Metabotropic glutamate receptor 4 (mGlu4) positive allosteric modulator (PAM) modulates impulsivity and STN neuronal activity.
(A–B) Example behavioral traces upon vehicle (A) or mGlu4 PAM (B) treatment in the correct Go (Go), correct No-Go (NG), and NG trials with false alarm (FA). For each example, top graph shows no treatment session, and bottom shows a behavior session with drug treatment for a single animal. Each row represents a single trial. (C) Systemic administration of mGlu4 PAM increases waiting impulsivity (i) in low impulsive (LI) animals (three-way repeated measure (RM) ANOVA with a main effect on impulsivity (F1,50 = 62.72, p < 0.0001) and a phase × treatment interaction (F1,50 = 4.217, p = 0.045)), without affecting the FA rate (three-way RM ANOVA with a main effect on impulsivity (F1,50 = 14.34, p = 0.0004)) (ii) and % correct Go responses (three-way RM ANOVA with a phase × impulsivity interaction (F1,49 = 6.507, p = 0.0139)) (iii). HI NVehicle = 13 and NmGlu4 PAM = 13, LI NVehicle = 17 and NmGlu4 PAM = 11. One animal each was removed in (i, HI/mGlu4 PAM) and (iii, LI/mGlu4 PAM) after Grubb’s outlier test (alpha = 0.0001). (D–E) Brain-wide resting-state functional magnetic resonance imaging (rs-fMRI) screen for the interaction between mGlu4 PAM treatment and selected behavioral parameters in functional connectivity. (D) 3D visualization of the node-wise interaction score from a two-way RM ANOVA on treatment × impulsivity (size is correlated to F value) showing STN as the hotspot between the two. Only significantly scored nodes are shown. (E) Ordered, normalized two-way RM ANOVA F values from node-wise connectivity difference on interactions between treatment and group split by either impulsivity parameters (top), total distance traveled (middle), or number of licks (bottom) in the GNG task. Gray bars indicate that the p-value did not reach significance (Bonferroni corrected for multiple comparisons), whereas increased and significant differences are indicated in red. *p < 0.05, ****p < 0.0001.
-
Figure 4—source data 1
Related to Figure 4C.
- https://cdn.elifesciences.org/articles/62123/elife-62123-fig4-data1-v2.xlsx
Figure 4—figure supplement 1
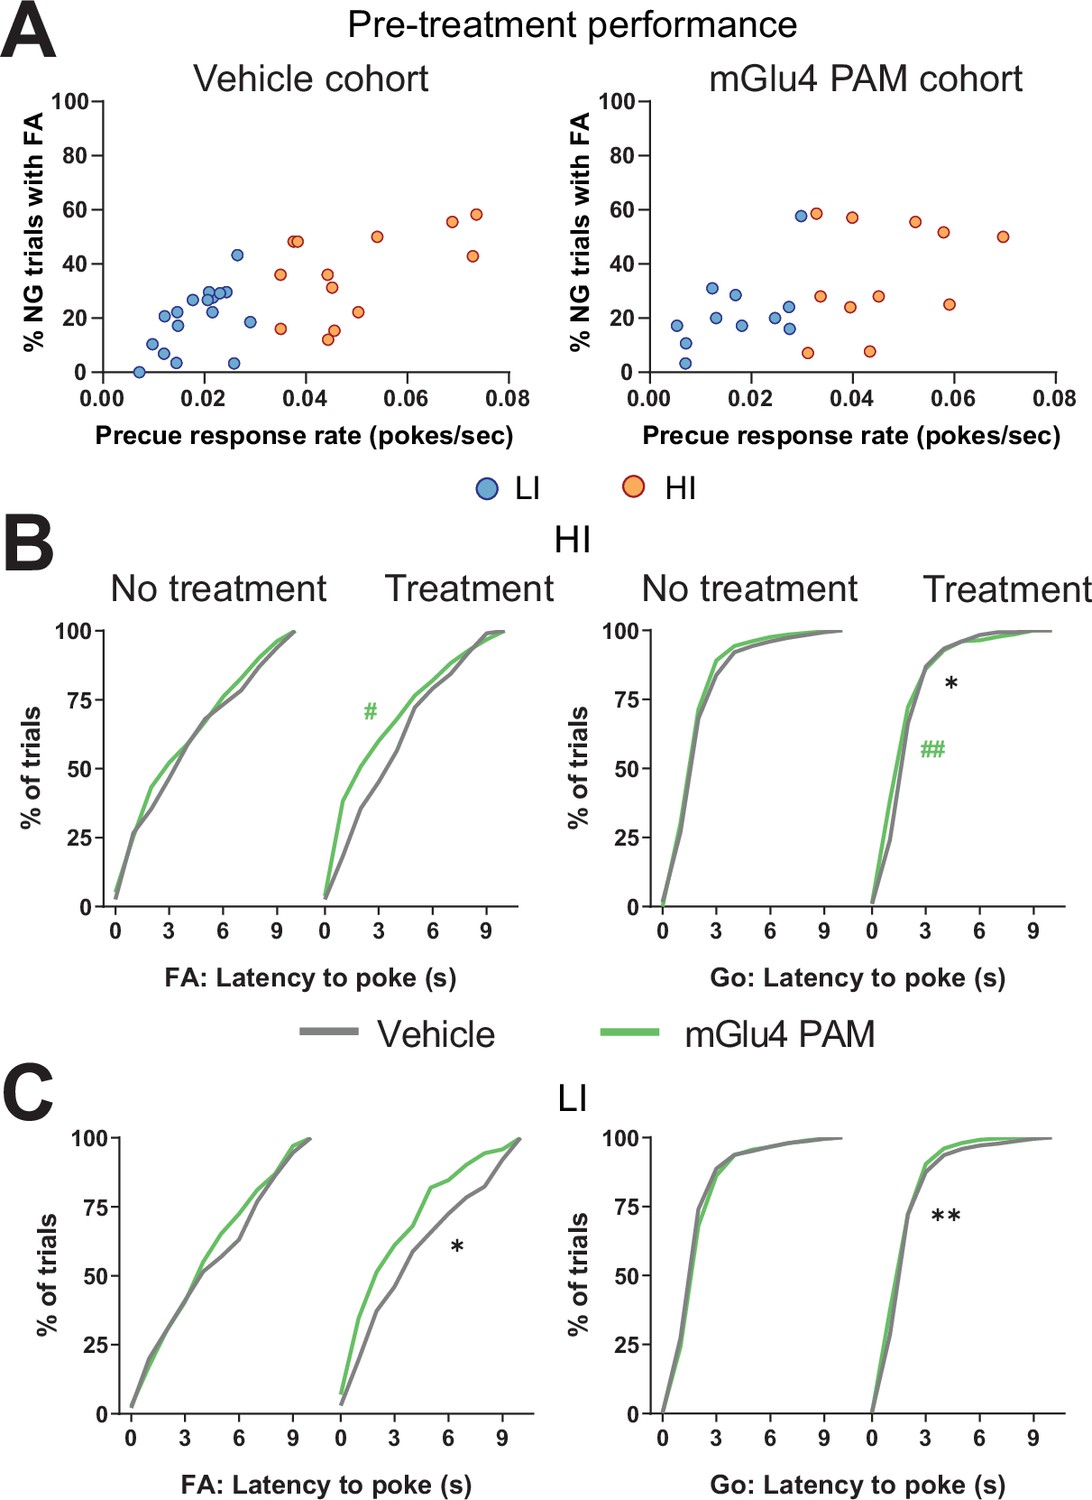
Metabotropic glutamate receptor 4 (mGlu4) positive allosteric modulator (PAM) modulates trait impulsivity parameters.
(A) Behavioral split into high impulsive (HI) (NVeh = 13, NmGlu4 PAM = 17) and low impulsive (LI) (NVeh = 17, NmGlu4 PAM = 11) animals based on the precue response rate. Mean single animal data over the last three training sessions. (B–C) Cumulative distribution of latency to poke for false alarm (FA) (left) and correct Go trials (right) in HI (B) and LI (C) animals.
-
Figure 4—figure supplement 1—source data 1
Related to Figure 4—figure supplement 1B, C.
- https://cdn.elifesciences.org/articles/62123/elife-62123-fig4-figsupp1-data1-v2.xlsx
Figure 4—figure supplement 2
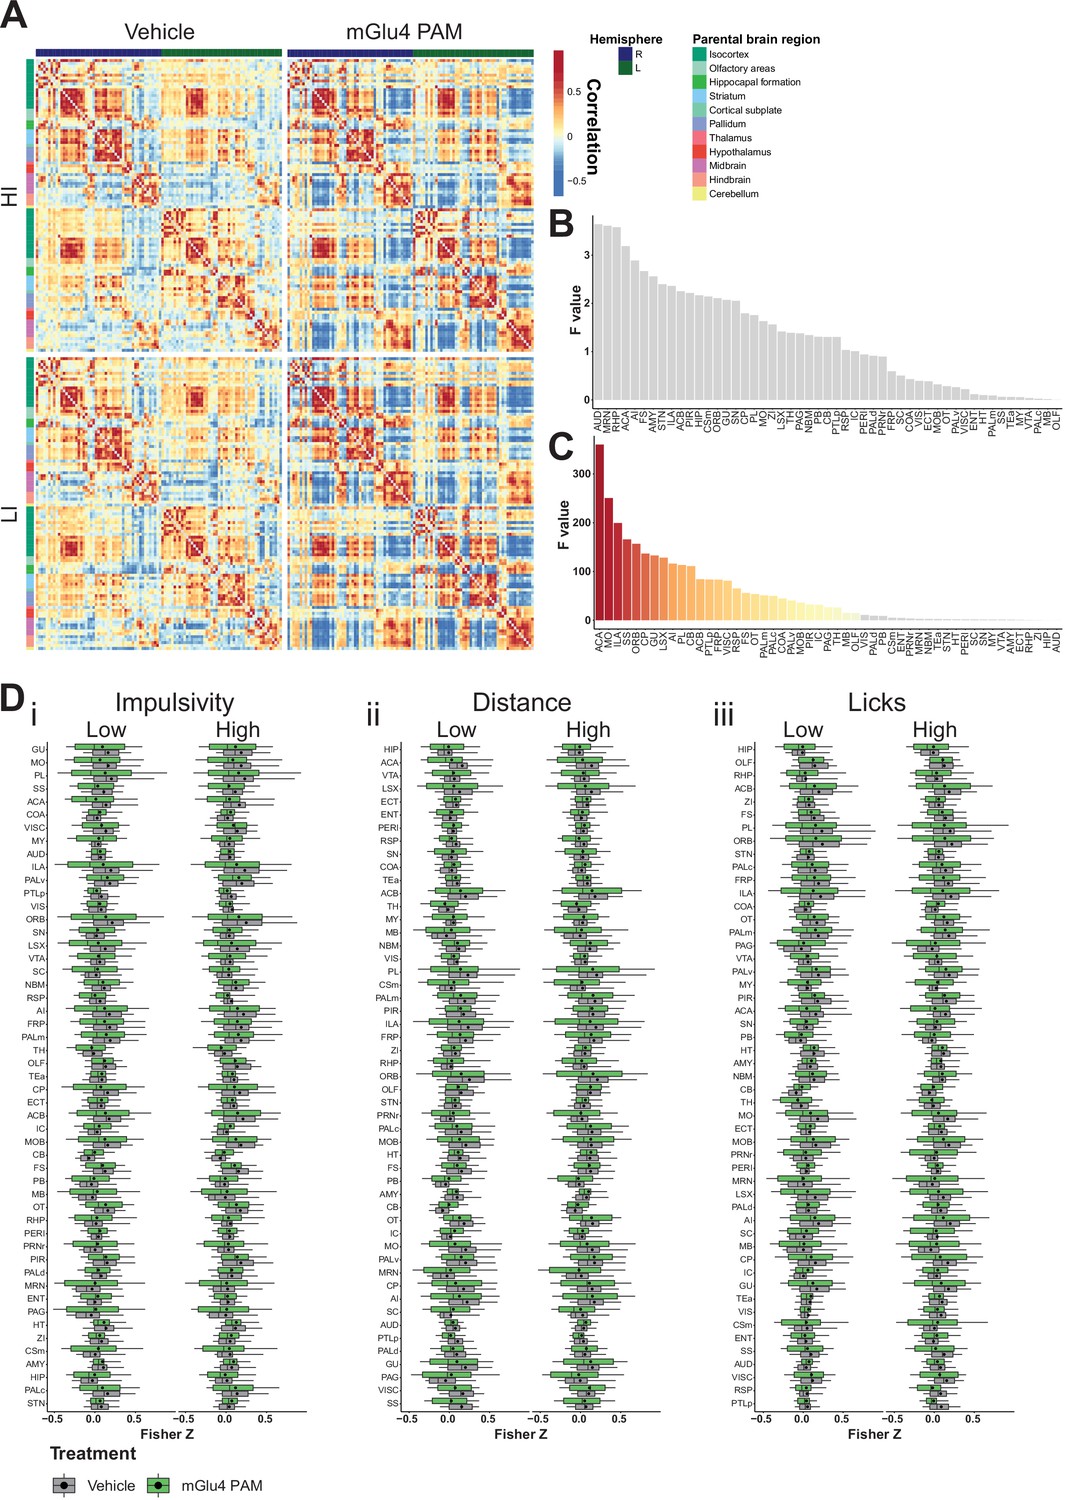
Brain-wide resting-state functional magnetic resonance imaging (rs-fMRI) screen for metabotropic glutamate receptor 4 (mGlu4) positive allosteric modulator (PAM) interaction.
(A) Mean cross-correlation heatmap for high impulsive (HI) and low impulsive (LI) groups of mice following vehicle and mGlu4 PAM treatment. (B) Ordered F values of main effects of impulsivity from two-way repeated measures (RM) ANOVA on treatment × impulsivity from node-wise connectivity. Gray bars indicate that the p-value did not reach significance, Bonferroni corrected for multiple comparisons. (C) Ordered F values of main effects of treatment from two-way RM ANOVA on treatment × impulsivity from node-wise connectivity. Gray bars mean that the p-value did not reach significance, Bonferroni corrected for multiple comparisons. (D) Node-wise Fisher Z-transform in HI vs. LI animals. Nodes ordered according to increasing F score of interaction of treatment × impulsivity of two-way RM ANOVA split on impulsivity, distance, and licks. Box–whisker plots display median, interquartile range, and tenth to ninetieth percentiles of the distribution, dots indicate mean. ACA – anterior cingulate area; ACB – nucleus accumbens; AI – agranular insular area; AMY – amygdalar nuclei; AUD – auditory area; CB – cerebellum; COA – amygdala cortex; CP – caudoputamen; Csm – superior central nucleus raphe; ECT – ectorhinal area; ENT – entorhinal area; FRP – frontal pole; FS – fundus of striatum; GU – gustatory areas; HIP – hippocampus; HT – hypothalamus; IC – colliculi inferior; ILA – infralimbic area; LSX – lateral septal complex; MO – somatomotor areas; MRN – MB reticular nucleus; MY – rostromedial medulla; NBM – nucleus basalis of Meynert; OLF – olfactory area; ORB – orbital Area; OT – olfactory tubercle; PAG – periaqueductal gray; PALc – pallidum caudal; PALd – pallidum dorsal; PALm – pallidum medial; PALv – pallidum ventral; PB – parabrachial nucleus; PERI – perirhinal area; PIR – piriform; PL – prelimbic area; PRNr – pontine reticular nucleus; PTLp – post parietal association area; RHP – retrohippocampal region; RSP – retrosplenial area; SC – superior colliculus; SNr – substantia nigra; SS – somatosensory areas; STN – subthalamic nucleus; TEa – temporal association area; TH – thalamus; VIS – visual area; VISC – visceral area; VTA – ventral tegmental area; ZI – zona incerta.
-
Figure 4—figure supplement 2—source data 1
Related to Figure 4Ei and Figure 4—figure supplement 2B, C.
- https://cdn.elifesciences.org/articles/62123/elife-62123-fig4-figsupp2-data1-v2.xlsx
Figure 5 with 4 supplements
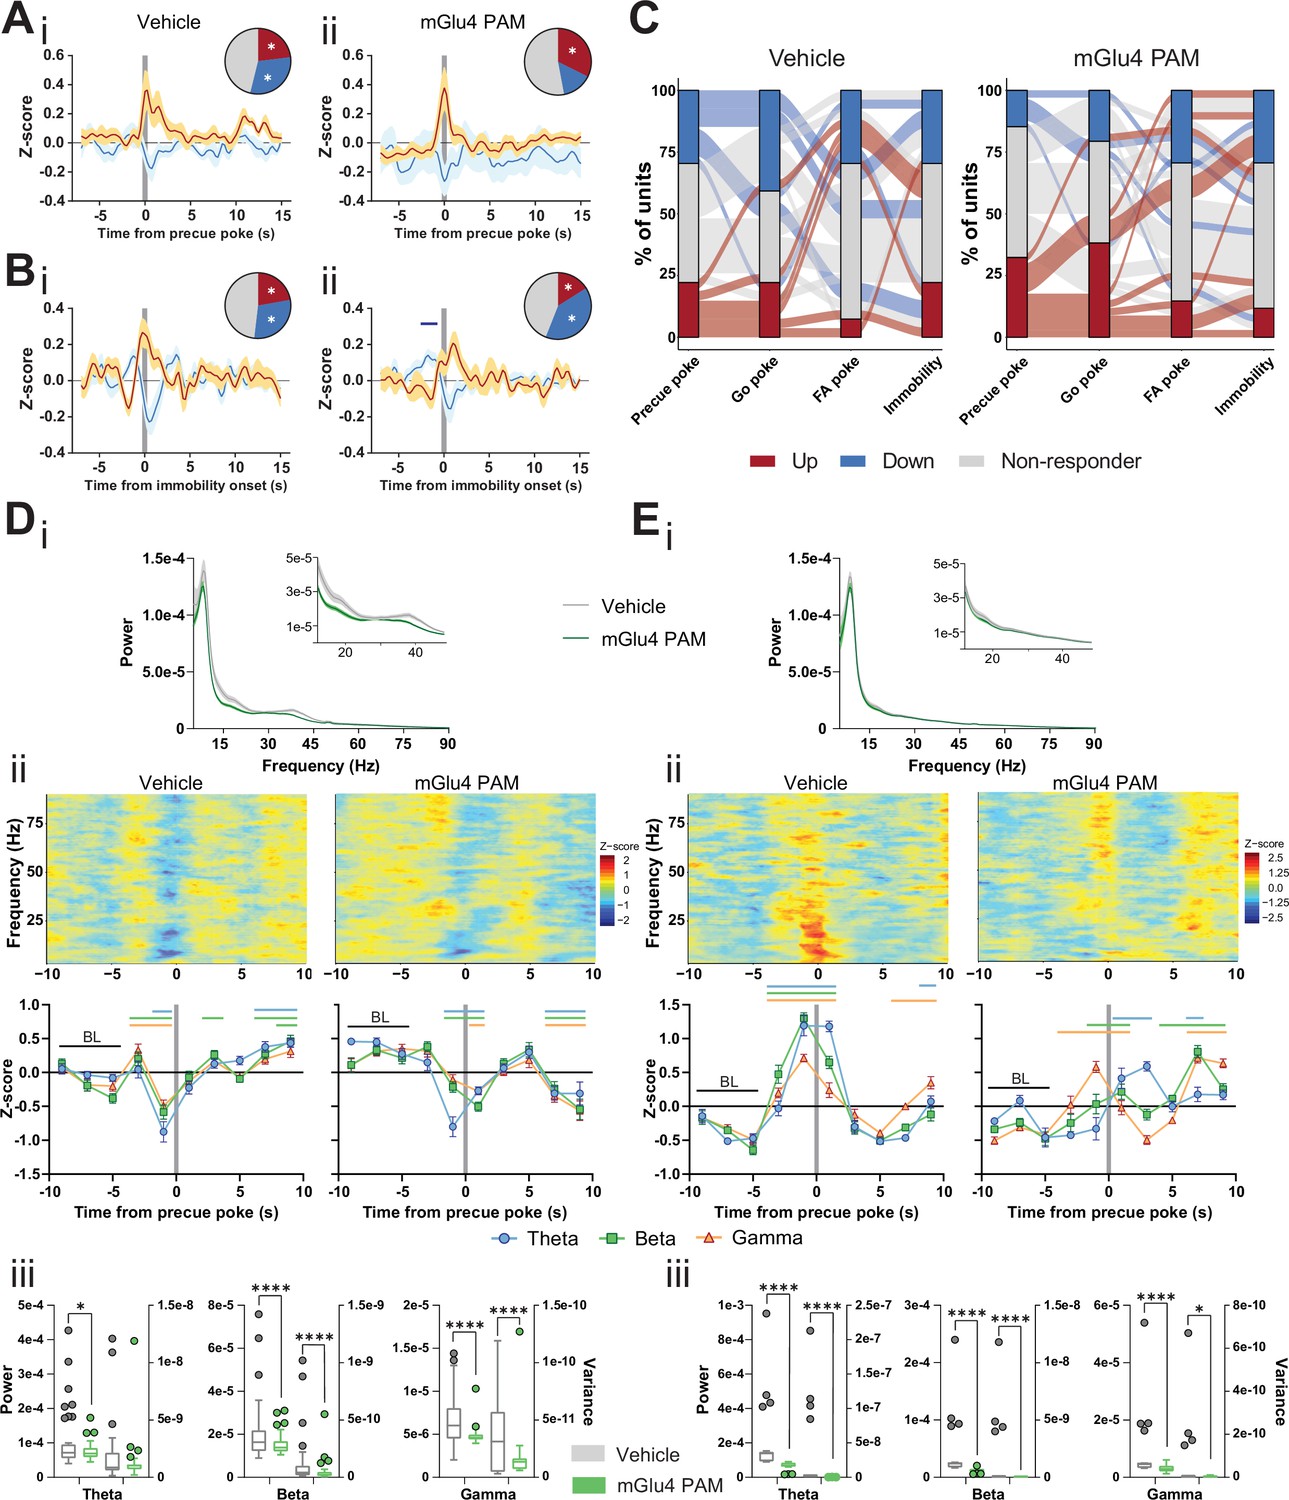
Metabotropic glutamate receptor 4 (mGlu4) positive allosteric modulators (PAM) modulates STN and substantia nigra pars reticulata (SNr) neuronal activity.
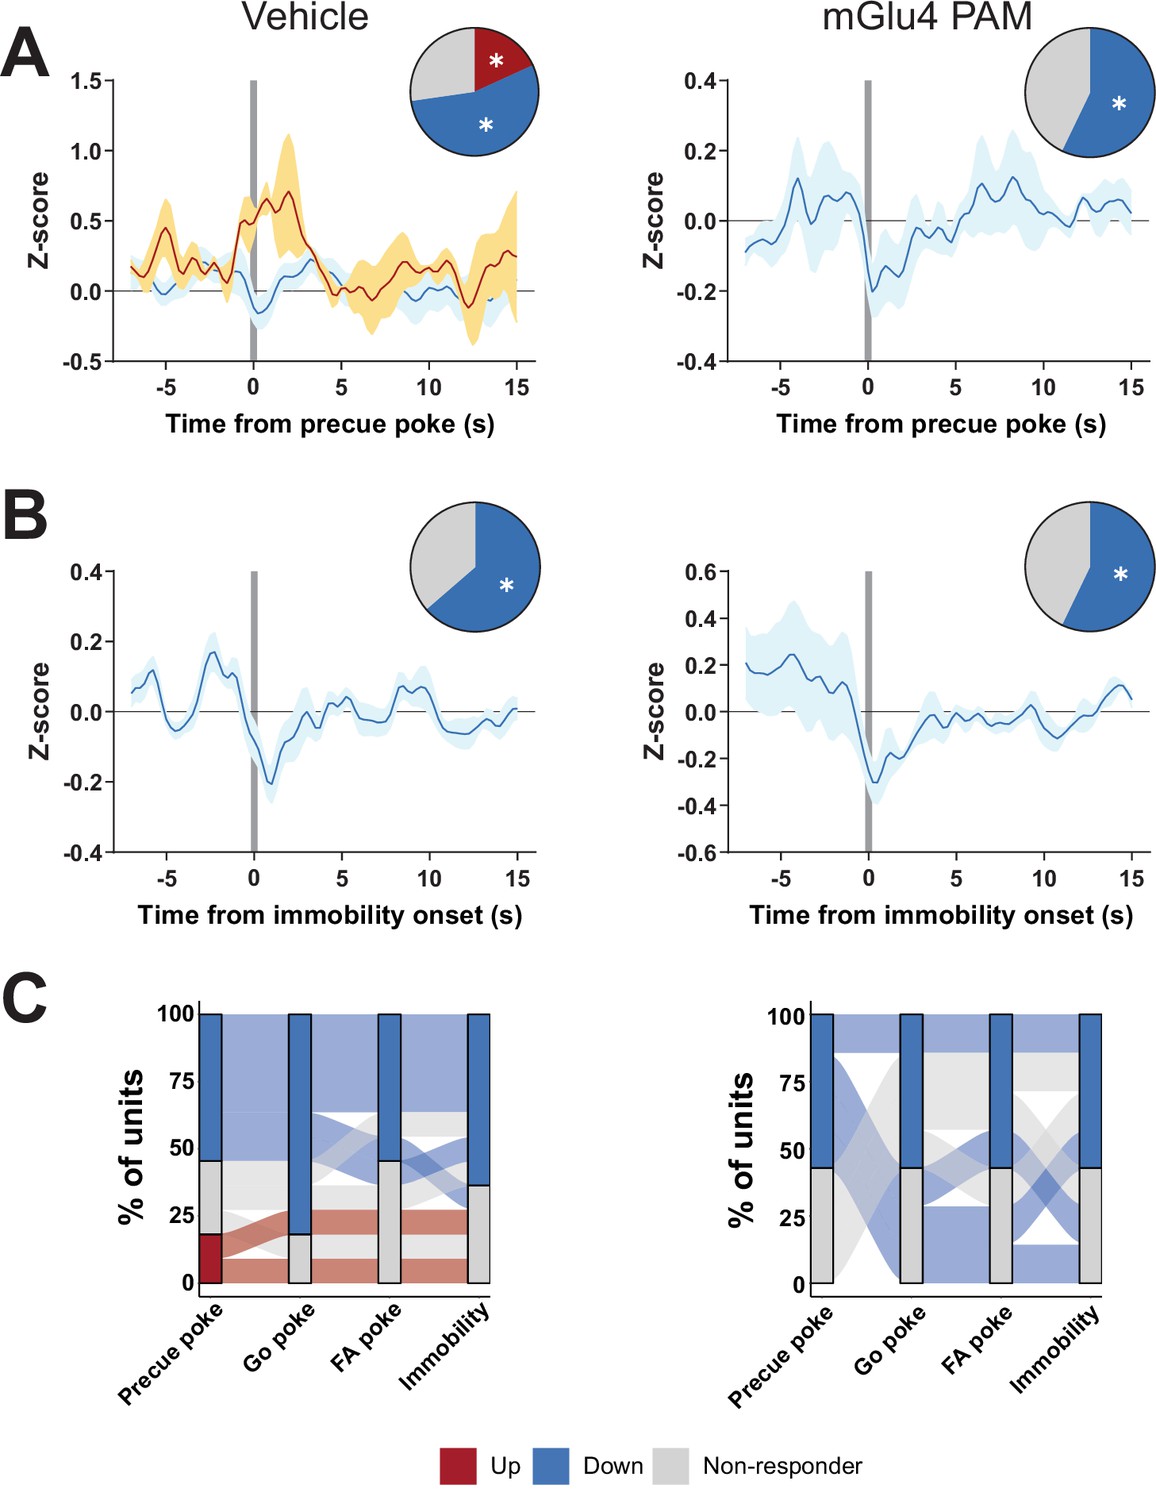
(A–B) Peri-event data from in vivo extracellular recordings during the Go/No-Go (GNG) task showing unit responses aligned to onset of precue poke (A) or immobility (B) for vehicle (i) and mGlu4 PAM (ii) treatment. Population traces of excited and inhibited units for each line (nPrecue, Vehicle, Up = 6, nPrecue, Vehicle, Down = 8, nPrecue, mGlu4 PAM, Up = 11, nPrecue, mGlu4 PAM, Down = 5; nImmobility, vehicle, Up = 6, nImmobility, Vehicle, Down = 8, nImmobility, mGlu4 PAM, Up = 4, nImmobility, mGlu4 PAM, Down = 10, from NAnimals = 3). The circles represent the proportion of cells excited (red), inhibited (blue) or non-responding to given event (* given population reached significance in permutation test). (C) Alluvial plot for individual STN units to precue, Go and false alarm (FA) pokes, and immobility onsets upon treatment. The width of the ribbon is proportional to the fraction of units with the given response pattern. Ribbons are color coded according to precue poke responses. (D) (i) LFP power spectra in STN during precue periods during vehicle or mGlu4 PAM treatment. (ii) Within-frequency Z-scored LFP power spectra (upper) and frequency band-averaged, 2s-binned (lower) time courses aligned to precue pokes during vehicle (left) or mGlu4 PAM treatment (right). Two-way repeated measures (RM) ANOVA revealed a significant main effect of time (F7,966 = 43.23, p < 0.0001), no main effect of frequency band (F2,138 = 1.449, p = 0.238), but a significant time × frequency band interaction (F14,966 = 2.054, p = 0.012) for vehicle, and a significant main effect of time (F7,966 = 30.65, p < 0.0001), no main effect of frequency band (F2,138 = 1.724, p = 0.182), but a significant time × frequency band interaction (F14,966 = 2.734, p = 0.0006) for mGlu4 PAM treatment. Mean Z-score ± SEM from nChannels = 48, NAnimals = 3. Colored lines indicate significant differences to the baseline (BL) period in the respective frequency band, as determined by two-way RM ANOVA and Dunnet post hoc analysis (p < 0.05). (iii) LFP power of the time bin preceding precue pokes (left axis) and LFP power variance of the entire time range in (ii) (right axis) in the STN during vehicle and mGlu4 PAM treatment for theta, beta, and gamma frequency bands, respectively. Wilcoxon paired signed rank test (*p < 0.05, ****p < 0.0001). (E) (i) LFP power spectra in SNr during precue periods during vehicle or mGlu4 PAM treatment. (ii) Within-frequency Z-scored LFP power spectra (upper) and frequency band-averaged, 2s-binned (lower) time courses aligned to precue pokes during vehicle (left) or mGlu4 PAM treatment (right). Two-way RM ANOVA revealed a significant main effect of time (F7,651 = 126.2, p < 0.0001), no main effect of frequency band (F2,93 = 1.395, p = 0.253), but a significant time × frequency band interaction (F14,651 = 10.34, p < 0.0001) for vehicle, and significant main effects of time (F7, 651 = 25.87, p < 0.0001) and frequency band F2,93 = 3.772, p = 0.027), and a significant time × frequency band interaction (F14,651 = 11.99, p < 0.0001) for mGlu4 PAM treatment. Mean Z-score ± SEM from nChannels = 32, NAnimals = 2. Colored lines indicate significant differences to the baseline (BL) period in the respective frequency band, as determined by two-way RM ANOVA and Dunnet post hoc analysis (p < 0.05). (iii) LFP power of the time bin preceding precue pokes (left axis) and LFP power variance of the entire time range in (ii) (right axis) during vehicle and mGlu4 PAM treatment in the SNr for theta, beta, and gamma frequency bands, respectively. Wilcoxon paired signed rank test (*p < 0.05, ****p < 0.0001).
-
Figure 5—source data 1
Related to Figure 5A, B, D and E.
- https://cdn.elifesciences.org/articles/62123/elife-62123-fig5-data1-v2.xlsx
Figure 5—figure supplement 1
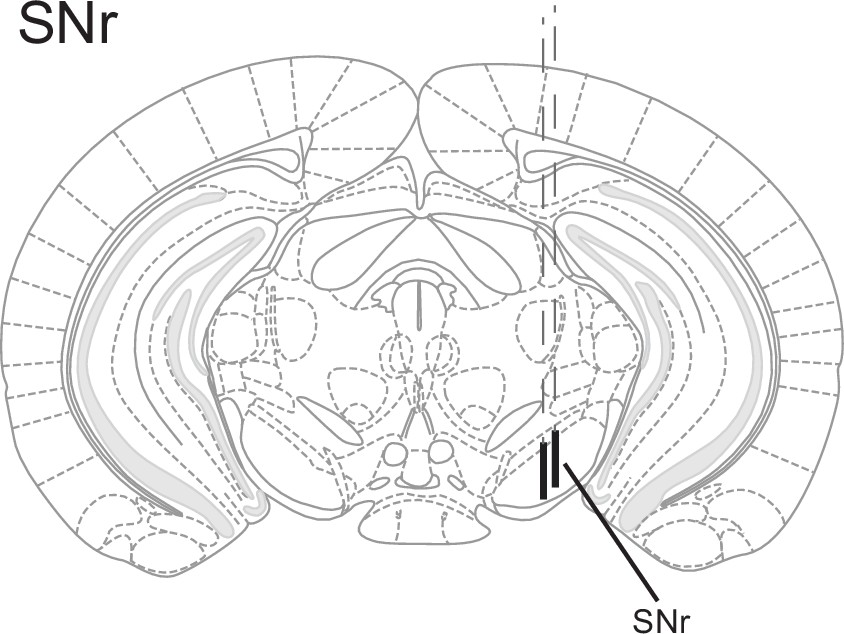
Electrode placement.
Electrode placement in electrophysiology experiments for substantia nigra pars reticulata (SNr). Each line represents one animal.
Figure 5—figure supplement 2
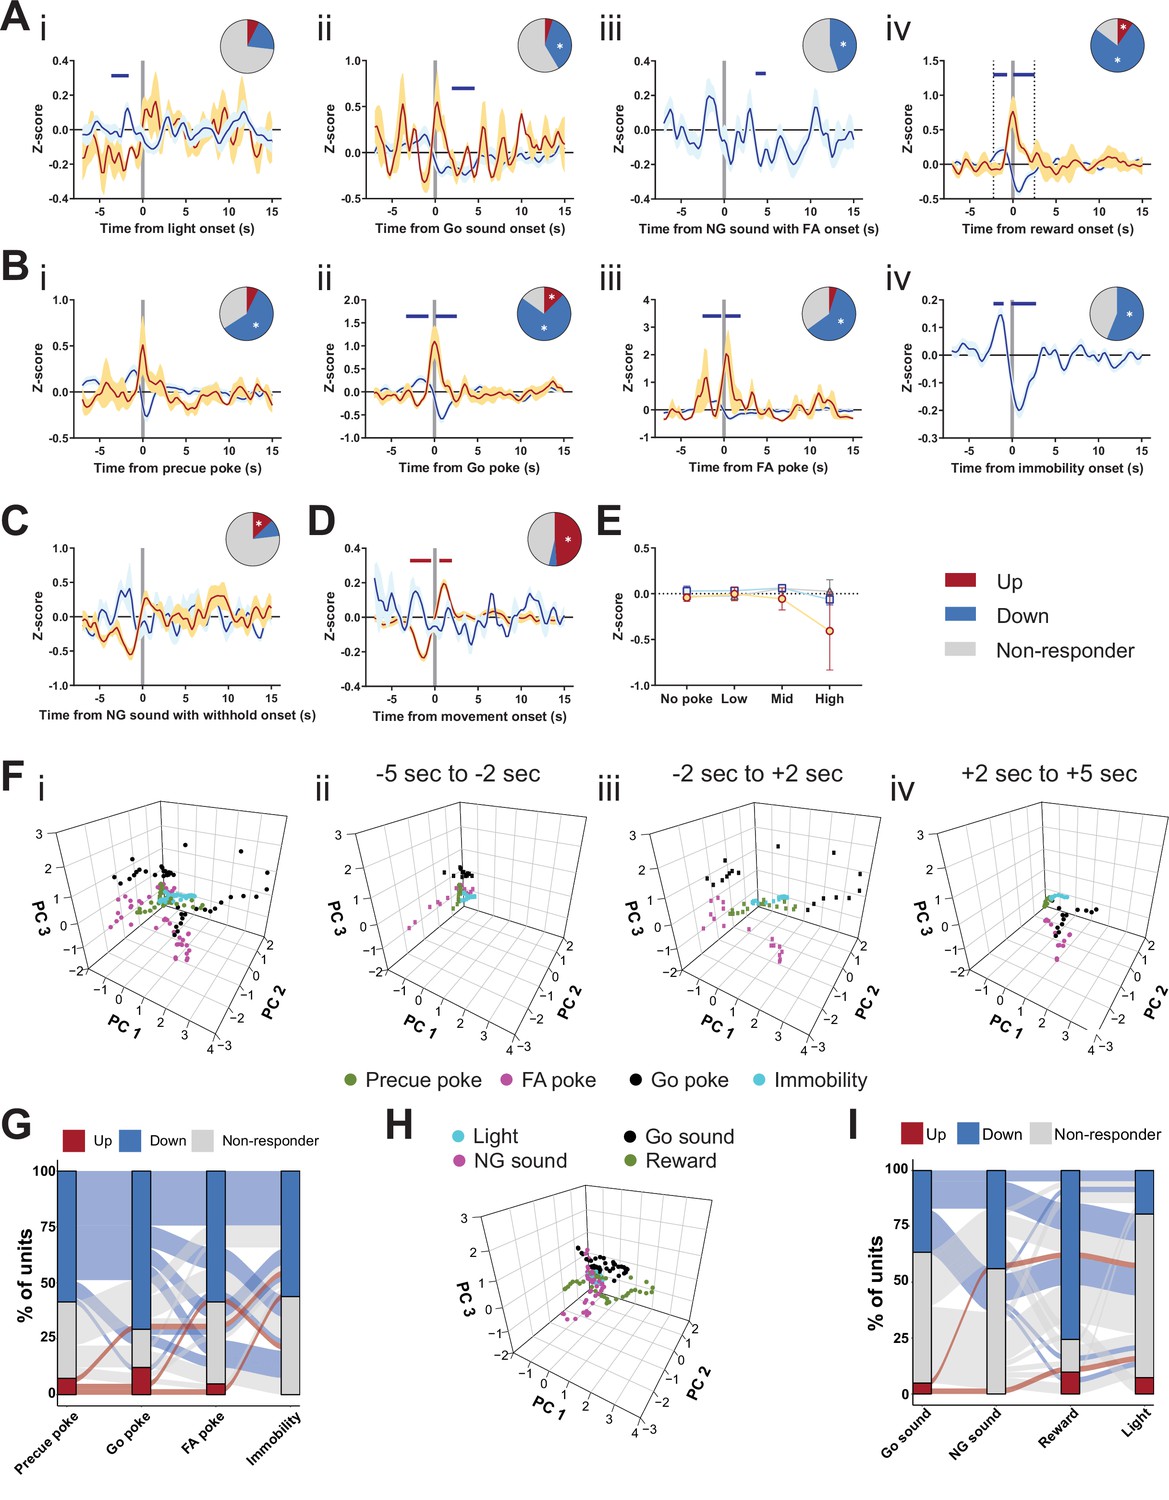
Encoding Go/No-Go (GNG) task parameters in substantia nigra pars reticulata (SNr).
(A–D) Population traces of excited and inhibited units, respectively, for each line. Horizontal colored bars at the top of each panel indicate bins with a significantly different firing rate vs. baseline firing (p < 0.05, cluster-based permutation test). Circles represent the proportion of cells excited (red), inhibited (blue), or non-responding to given event (* given population reached significance in permutation test). (A) Peri-event data showing SNr unit responses aligned to stimulus events, such as light onset (i, nUp = 3, nDown = 8 from NAnimals = 2), Go sound (ii, nUp = 2, nDown = 15 from NAnimals = 2), sound onset in No-Go (NG) trials with false alarm (FA) (iii, nUp = 0, nDown = 18 from NAnimals = 2), reward delivery onset (iv, nUp = 4, nDown = 31 from NAnimals = 2). (B) Peri-event data showing SNr unit responses aligned to behavioral events, such as precue poke (i, nUp = 3, nDown = 24 from NAnimals = 2), Go sound poke (ii, nUp = 5, nDown = 29 from NAnimals = 2), FA poke (iii, nUp = 2, nDown = 24 from NAnimals = 2), immobility onset (iv, nUp = 0, nDown = 23 from NAnimals = 2). (C) Peri-event data for sound onset in correct NG trials (NUp = 5, NDown = 4). (D) Peri-event data for movement onset (nUp = 20, nDown = 2 from NAnimals = 2). (E) No change in the mean firing rate during the entire precue period of unit populations (split by response to precue poke) on trials with no precue poke, low (<0.15), mid (0.15–0.3), and high ( > 0.3) precue response rate. (F) Population activity vectors in PCA space for behavior-driven peri-events (i), as well as split by time relative to event onset (ii–iv). (G) Alluvial plot showing the variety of response patterns of SNr units to precue poke, Go poke, FA poke, and immobility onsets. The width of the ribbon is proportional to the fraction of units with a given response pattern. Ribbons are color coded according to precue poke responses. (H) Population activity vectors in PCA space for stimulus-driven peri-events (left), as well as split by time relative to event onset (right). (I) Alluvial plot showing the variety of response patterns of SNr units to Go sound onset, NG sound onset followed by FA, reward, and light onsets. The width of the ribbon is proportional to the fraction of units with given response pattern. Ribbons are color coded according to Go sound responses.
-
Figure 5—figure supplement 2—source data 1
Related to Figure 5—figure supplement 2A–E.
- https://cdn.elifesciences.org/articles/62123/elife-62123-fig5-figsupp2-data1-v2.xlsx
Figure 5—figure supplement 3
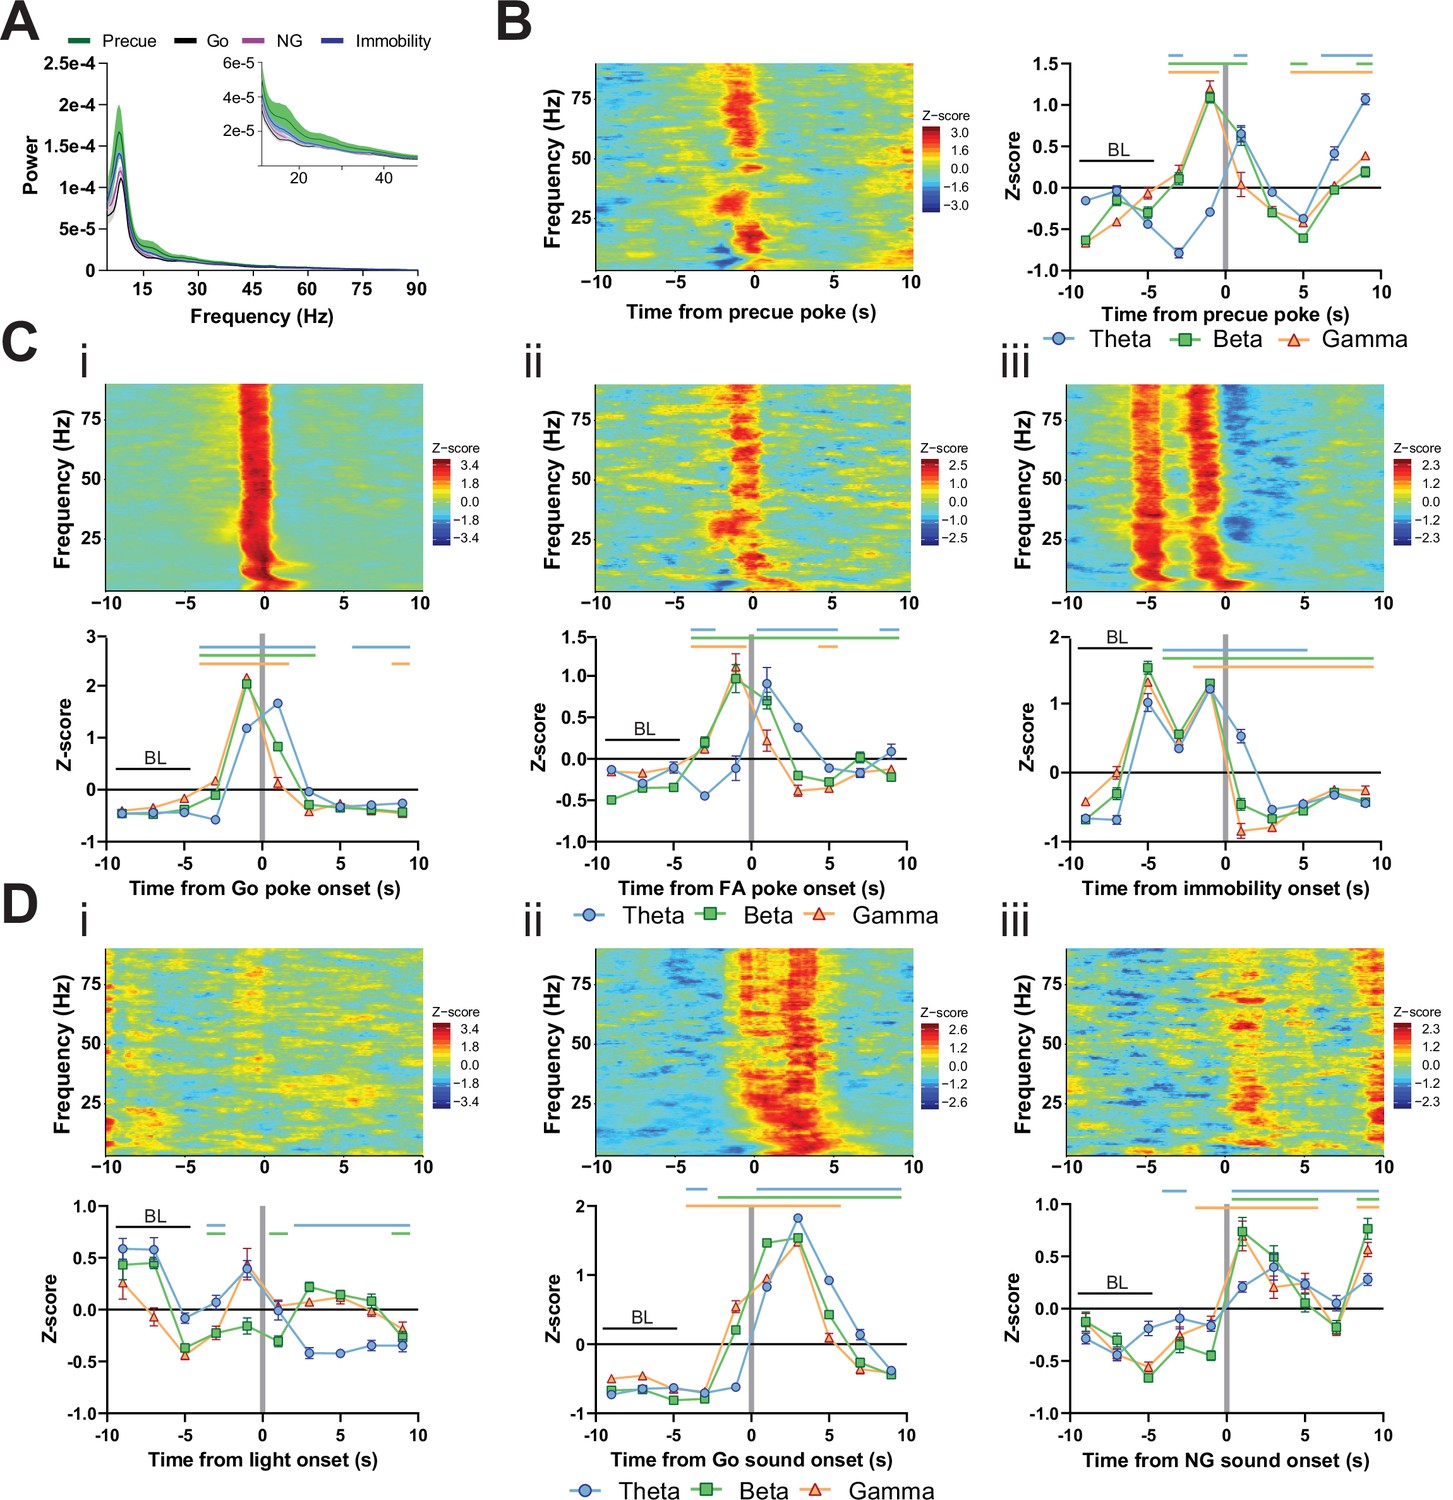
LFP time courses for Go/No-Go (GNG) task parameters in substantia nigra pars reticulata (SNr).
(A) LFP power spectra in SNr during precue, Go sound, No-Go (NG) sound and immobility periods. (B) Within frequency Z-scored LFP spectrogram (left) and frequency band-averaged, 2s-binned time course thereof (right), both centered around precue pokes. Two-way repeated measures (RM) ANOVA revealed significant main effects of time (F2.729,253.8 = 99.29, p < 0.0001) and frequency band (F2,93 = 11.28, p < 0.0001), and a significant time × frequency band interaction (F14,651 = 37.46, p < 0.0001). (C) Within-frequency Z-scored LFP power spectra (upper) and frequency band-averaged, 2s-binned (lower) time courses in SNr aligned to Go pokes (i), false alarm (FA) pokes (ii) and immobility onset (iii). Two-way RM ANOVA revealed significant main effects of time (F1.359,126.4 = 836.9, p < 0.0001) and frequency band (F2,93 = 16.02, p < 0.0001), and a significant time × frequency band interaction (F14,651 = 66.47, p < 0.0001) for (i), significant main effects of time (F1.654,153.8 = 45.07, p < 0.0001) and frequency band (F2,93 = 13.18, p < 0.0001), and a significant time × frequency band interaction (F14,651 = 15.05, p < 0.0001) for (ii), and significant main effects of time (F2.446,227.5 = 396.2, p < 0.0001) and frequency band (F2,93 = 10.02, p = 0.0001), and a significant time × frequency band interaction (F14,651 = 27.53, p < 0.0001) for (iii). (D) Within-frequency Z-scored LFP power spectra (upper) and frequency band-averaged, 2s-binned (lower) time courses in SNr aligned to light onset (i), Go sound onset (ii) and NG sound onset (iii). Two-way RM ANOVA revealed significant main effects of time (F2.698,250.9 = 14.81, p < 0.0001) and frequency band (F2,93 = 8.456, p = 0.0004), and a significant time × frequency band interaction (F14,651 = 13.55, p < 0.0001) for (i), significant main effects of time (F2.357,219.2 = 907.8, p < 0.0001) and frequency band (F2,93 = 14.88, p < 0.0001), and a significant time × frequency band interaction (F14,651 = 46.50, p < 0.0001) for (ii), and a significant main effect of time (F2.000,186.0 = 51.74, p < 0.0001), no significant main effect for frequency band (F2,93 = 0.464, p = 0.630), but a significant time × frequency band interaction (F14,651 = 4.519, p < 0.0001) for (iii). Colored lines indicate significant differences to the baseline (BL) period in the respective frequency band, as determined by Dunnet post hoc analysis (p < 0.05). Mean Z-score ± SEM from nChannels = 32, NAnimals = 2 for all graphs.
-
Figure 5—figure supplement 3—source data 1
Related to Figure 5—figure supplement 3A–D.
- https://cdn.elifesciences.org/articles/62123/elife-62123-fig5-figsupp3-data1-v2.xlsx
Figure 5—figure supplement 4
Metabotropic glutamate receptor 4 (mGlu4) positive allosteric modulator (PAM) interacts with substantia nigra pars reticulata (SNr) activity in the Go/No-Go (GNG) task.
(A–B) Peri-event data showing SNr unit responses aligned to onsets of precue poke (A, NVehicle, Up = 2, NVehicle, Down = 6, NmGlu4 PAM, Up = 0, NmGlu4 PAM, Down = 4) or immobility (B, NVehicle, Up = 0, NVehicle, Down = 7, NmGlu4 PAM, Up = 0, NmGlu4 PAM, Down = 4) for vehicle (left) and mGlu4 PAM treatment (right). Population traces of excited and inhibited units, respectively, for each line. The circles represent the proportion of cells excited (red), inhibited (blue), or non-responding to given event (* given population reached significance in permutation test). (C) Alluvial plot showing the variety of response patterns of SNr units to precue, Go, and false alarm (FA) pokes immobility onsets. The width of the ribbon is proportional to the fraction of units with a given response pattern. Ribbons are color coded according to precue poke responses.
-
Figure 5—figure supplement 4—source data 1
Related to Figure 5—figure supplement 4A, B.
- https://cdn.elifesciences.org/articles/62123/elife-62123-fig5-figsupp4-data1-v2.xlsx
Figure 6 with 7 supplements
Subthalamic nucleus (STN) metabotropic glutamate receptor 4 (mGlu4) dissociates impulsive traits from motor function.
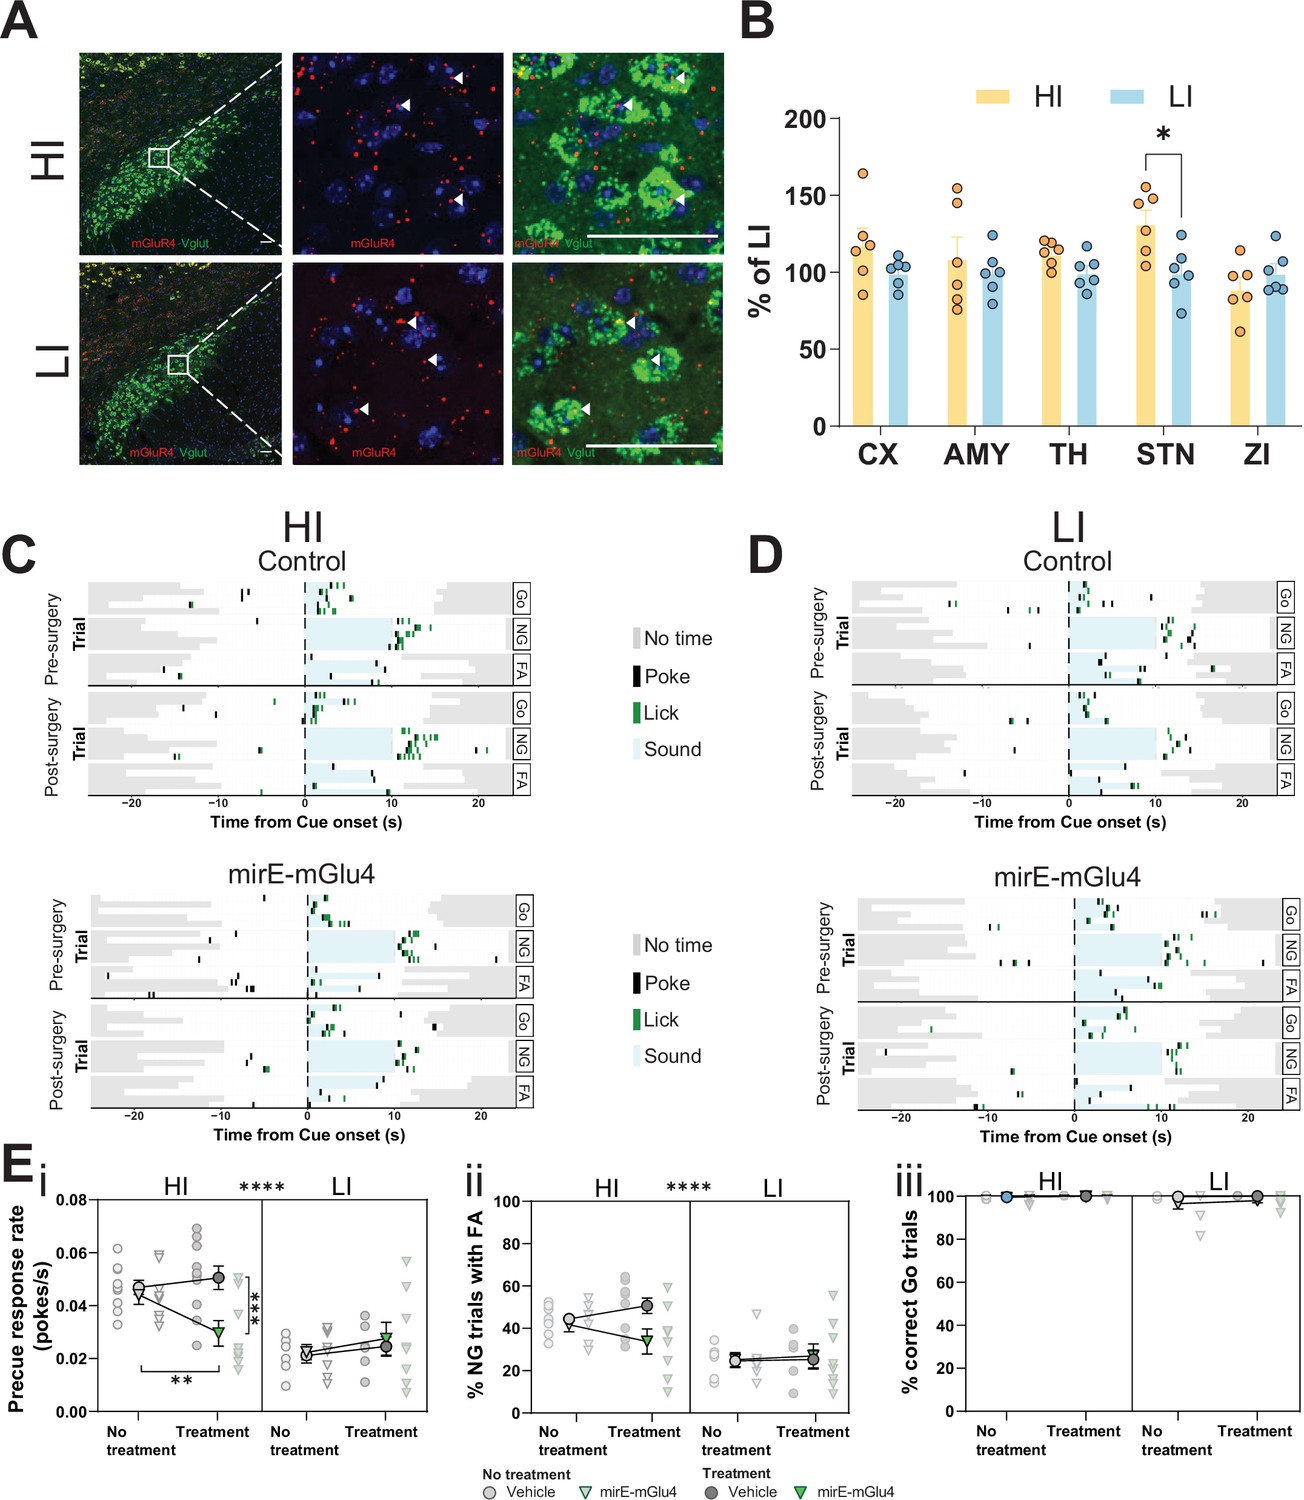
(A) STN brain sections from high impulsive (HI) and low impulsive (LI) animals analyzed by in situ mRNA hybridization using probes against vesicular glutamate transporter (VGlut (Slc17a6/Slc17a7), green) and mGlu4 (red) transcripts. White arrows mark positive cells for receptor expression. Scale bars = 40 μm. (B) Two-way repeated measures (RM) ANOVA of the signal quantification between somatosensory cortex (CX), basolateral nucleus of amygdala (AMY), ventral anterior-lateral complex of the thalamus (TH), STN, and zona incerta (ZI) revealed no significant main effect of impulsivity level (F1,40 = 2.927, p = 0.118), but a significant main effect of brain area (F4,40 = 2.841, p = 0.037), and interaction between the two (F4,40 = 2.841, p = 0.037), with a significant increase of mGlu4 receptor only in the STN of HI animals compared to their LI littermates (nsections = 6, Nanimals = 3 per group). (C–D) Exemplary behavioral traces of single HI (C) and LI (D) animals, part of either the control group (top panels) or mirE-mGlu4 group (lower panels), in correct Go (Go), correct No-Go (NG), and NG trials with false alarm (FA). Top shows a session prior to surgery. Bottom shows a post-surgery behavior session. Each row represents a single trial. (E) mirE-mediated knockdown of mGlu4 decreases waiting impulsivity with a phase × impulsivity × virus interaction (three-way RM ANOVA, F1,28 = 4.375, p = 0.046) (i), without significantly affecting FA rate (three-way RM ANOVA, main impulsivity effect (F1,28 = 24.18, p < 0.0001)) (ii) or correct Go responses (three-way RM ANOVA, no main impulsivity effect (F1,28 = 2.471, p = 0.127)) (iii). HI NControl = 10 and NmirE-mGlu4 = 8, LI NControl = 6 and NmirE-mGlu4 = 8. No animals were removed after Grubb’s outlier test (alpha = 0.0001).
-
Figure 6—source data 1
Related to Figure 6B and E.
- https://cdn.elifesciences.org/articles/62123/elife-62123-fig6-data1-v2.xlsx
Figure 6—figure supplement 1
Knockdown of STN metabotropic glutamate receptor 4 (mGlu4) modulates impulsivity.
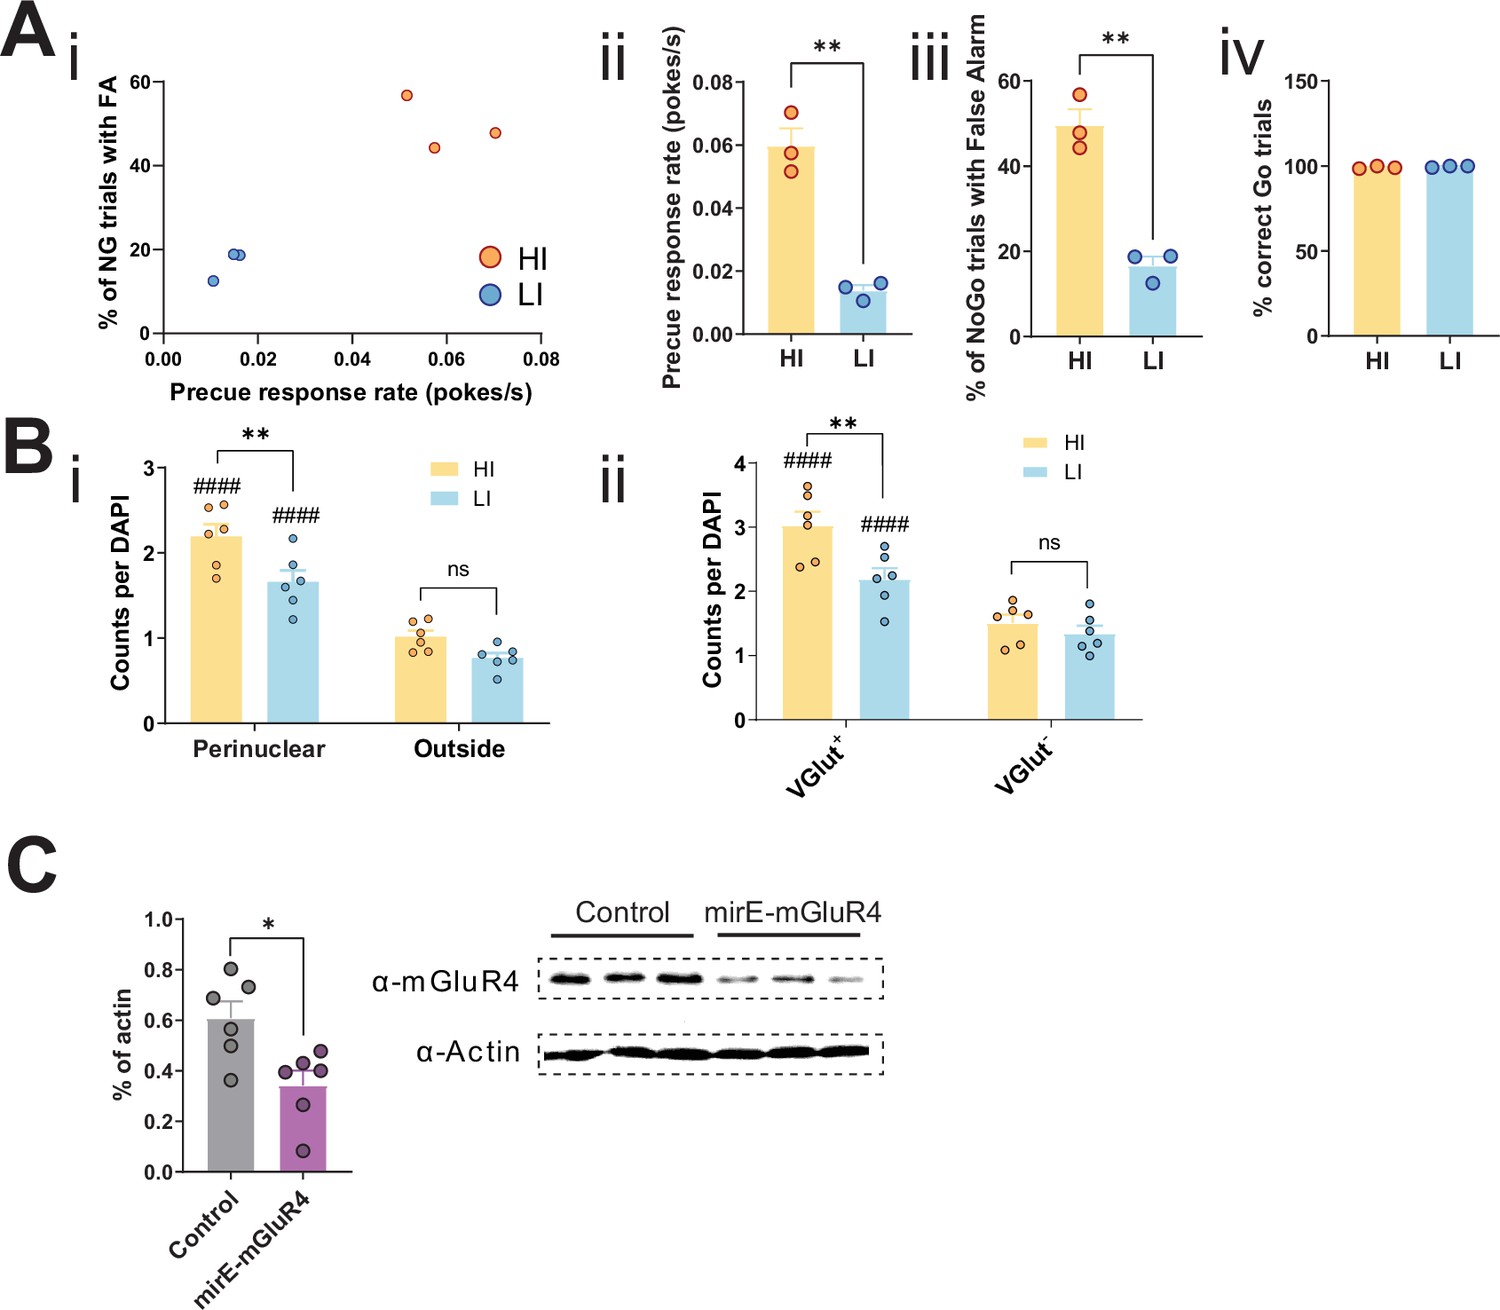
(A) Behavioral parameters of HI/LI animals used for the in situ hybridization assay, N = 3 per group. Mean of the last three sessions was significantly different across groups for precue response rate (two-tailed t-test t4 = 7.927, p = 0.0014) (i,ii) and % of No-Go (NG) trials with false alarm (FA) (two-tailed t-test t4 = 7.726, p = 0.0015) (i,iii), but not for % of correct Go responses (two-tailed t-test t4 = 1.031, p = 0. 361) (iv). (B) mGlu4 signals enriched in VGlut+ cells in a trait-dependent manner. (i) Two-way repeated measures (RM) ANOVA of the mGlu4 signal in STN split between perinuclear and non-perinuclear (outside) foci revealed significant main effect of impulsivity level (F1,10 = 7.796, p = 0.0191), significant main effect of area (F1,10 = 279.0, p <0.0001), and an interaction between the two (F1,40 = 5.084, p = 0.0478), with a significant increase of mGlu4 only in the perinuclear signal in HI animals, as compared to their LI littermates (nsections = 6, Nanimals = 3 per group). ####p < 0.0001 for perinuclear vs. outside for the same impulsivity level. (ii) mGlu4 perinuclear signal in VGlut+ and VGlut- cells in STN of HI and LI animals with a main effect of impulsivity level (F1,10 = 5.262, p = 0.0447), a main effect of VGlut expression (F1,10 = 287.6, p <0.0001), and interaction between the two (F1,40 = 23.30, p = 0.0007), with a significant increase of mGlu4 in the perinuclear signal in HI animals, as compared to their LI littermates (nsections = 6, Nanimals = 3 per group). VGlut+ and VGlut- cells were defined as cells with above and below average VGlut expression in a given section, respectively. (C) mGlu4 expression upon mirE-mGlu4 virus infection in Neuro-2a cells. (Left) Quantification of Western blot signals (two-tailed t-test t10 = 2.983, p = 0.0137; N = 6 infection/Western blot experiments). (Right) Exemplary Western blot with three replicates of one of such experiments.
-
Figure 6—figure supplement 1—source data 1
Related to Figure 6—figure supplement 1A–C.
- https://cdn.elifesciences.org/articles/62123/elife-62123-fig6-figsupp1-data1-v2.xlsx
Figure 6—figure supplement 2
Histological evaluation.
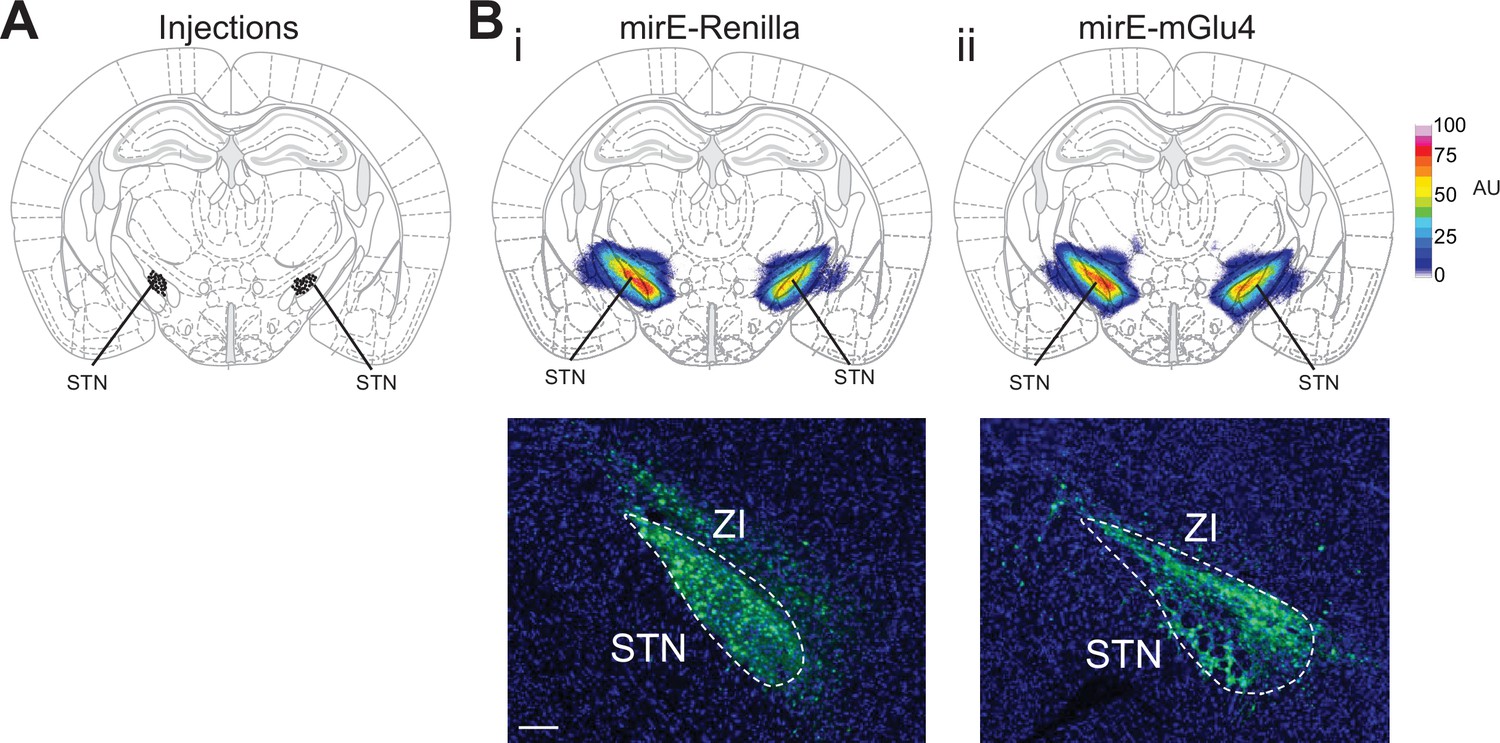
(A) Histological evaluation for all animals used for metabotropic glutamate receptor 4 (mGlu4) knockdown experiments in the Go/No-Go (GNG) and open-field (OF) experiments, showing the center of viral injection. (B) Mean viral spread across mirE-Renilla (control) (i) and mirE-mGlu4 (ii) experimental groups (top) and representative viral expression images from each group (bottom). AU – arbitrary units. Scale bar = 200 µm.
Figure 6—figure supplement 3
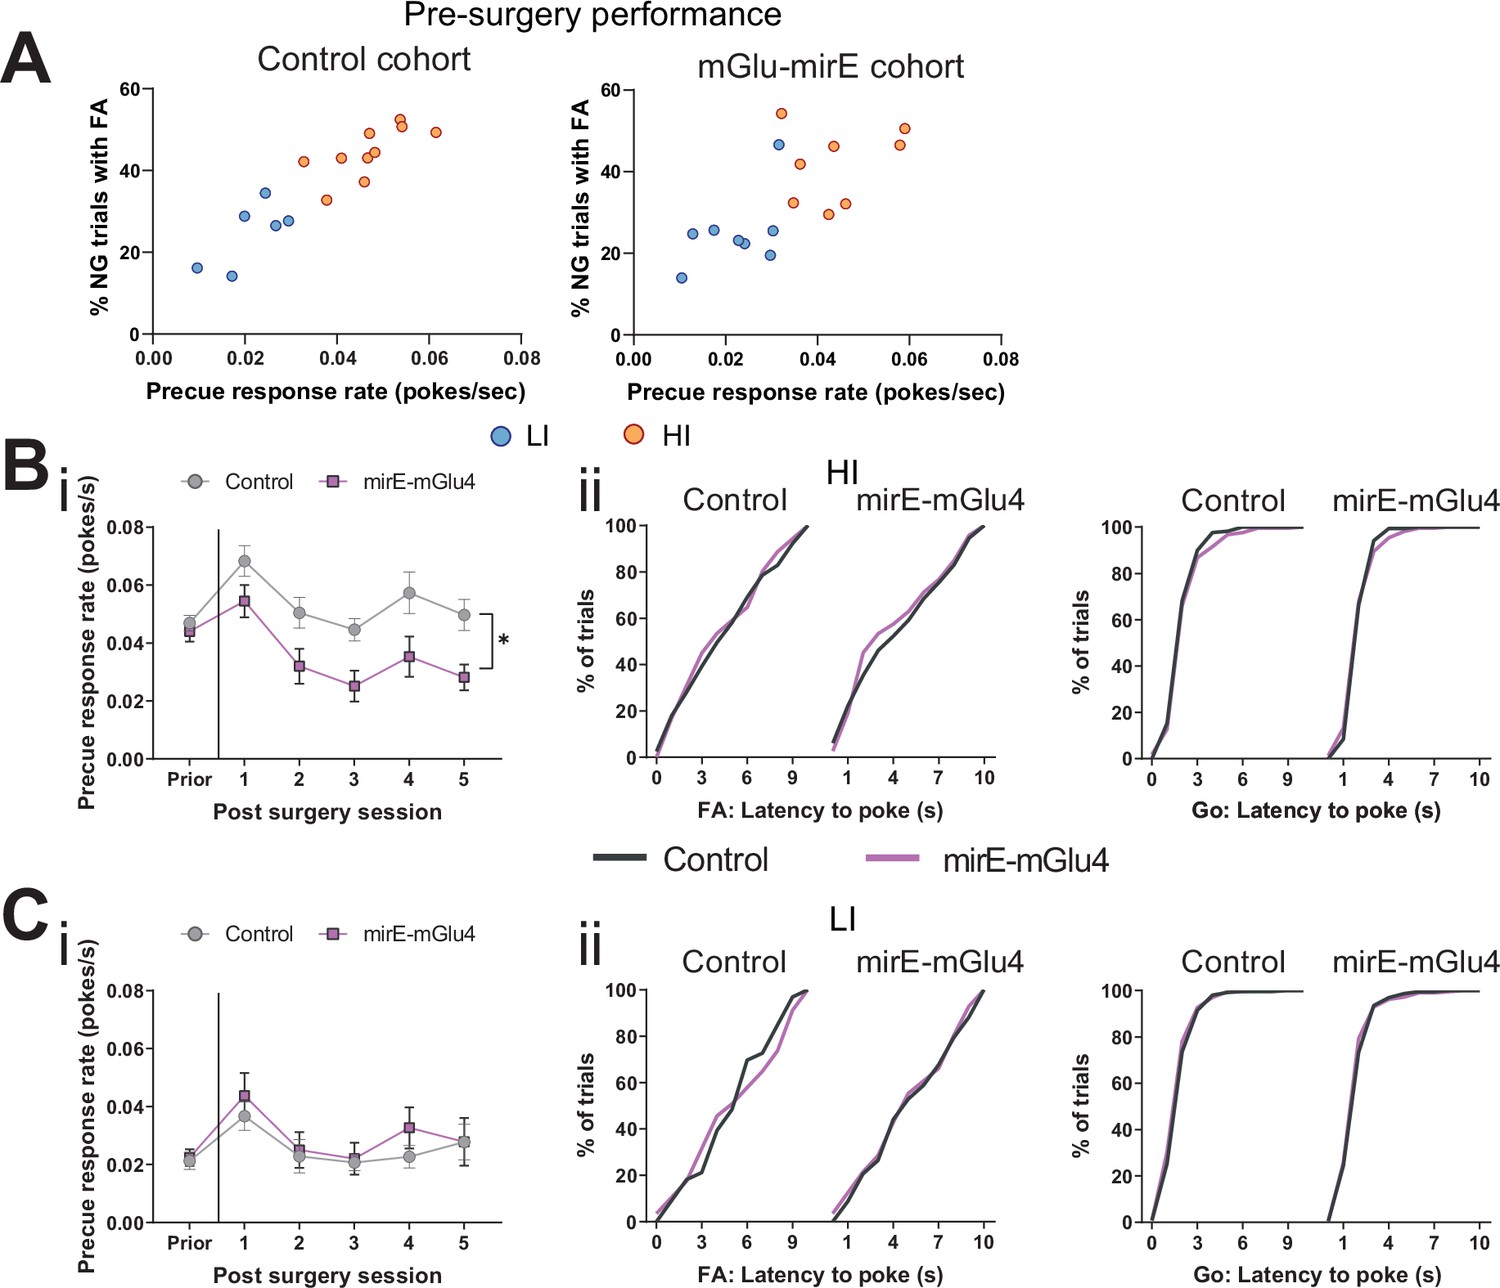
Knockdown of STN metabotropic glutamate receptor 4 (mGlu4) modulates impulsivity.
(A) Behavioral split into HI (NControl = 10, NmirE-mGlu4 = 8) and LI animals (NControl = 6, NmirE-mGlu4 = 8) based on the precue response rate. Mean single animal data over the last three training sessions. (B) HI animals. NControl = 10 and NmirE-mGlu4 = 8. (i) Two-way repeated measures (RM) ANOVA on precue response rate across experimental sessions revealed a significant main effect of time (F5,80 = 11.48, p < 0.0001), a significant main effect of virus group (F1,16 = 8.397, p = 0.0105), but no interaction between the two (F5,80 = 1.775, p = 0.1275). (ii) (left) Cumulative distribution of latency to poke in incorrect No-Go (NG) trials. (Right) Cumulative distribution of latency to poke in correct Go trials. (C) LI animals. NControl = 6 and NmirE-mGlu4 = 8. (i) Two-way RM ANOVA on precue response rate across experimental session revealed a significant main effect of time (F5,60 = 5.5, p = 0.0003), but no significant main effect of virus group (F1,12 = 0.301, p = 0.5933), and no interaction between the two (F5,60 = 0.439, p = 0.8195). (ii) (Left) Cumulative distribution of latency to poke in incorrect NG trials. (Right) Cumulative distribution of latency to poke in correct Go trials. *p < 0.05.
-
Figure 6—figure supplement 3—source data 1
Related to Figure 6—figure supplement 3B, C.
- https://cdn.elifesciences.org/articles/62123/elife-62123-fig6-figsupp3-data1-v2.xlsx
Figure 6—figure supplement 4
STN gates impulsive traits independent from general motor function.
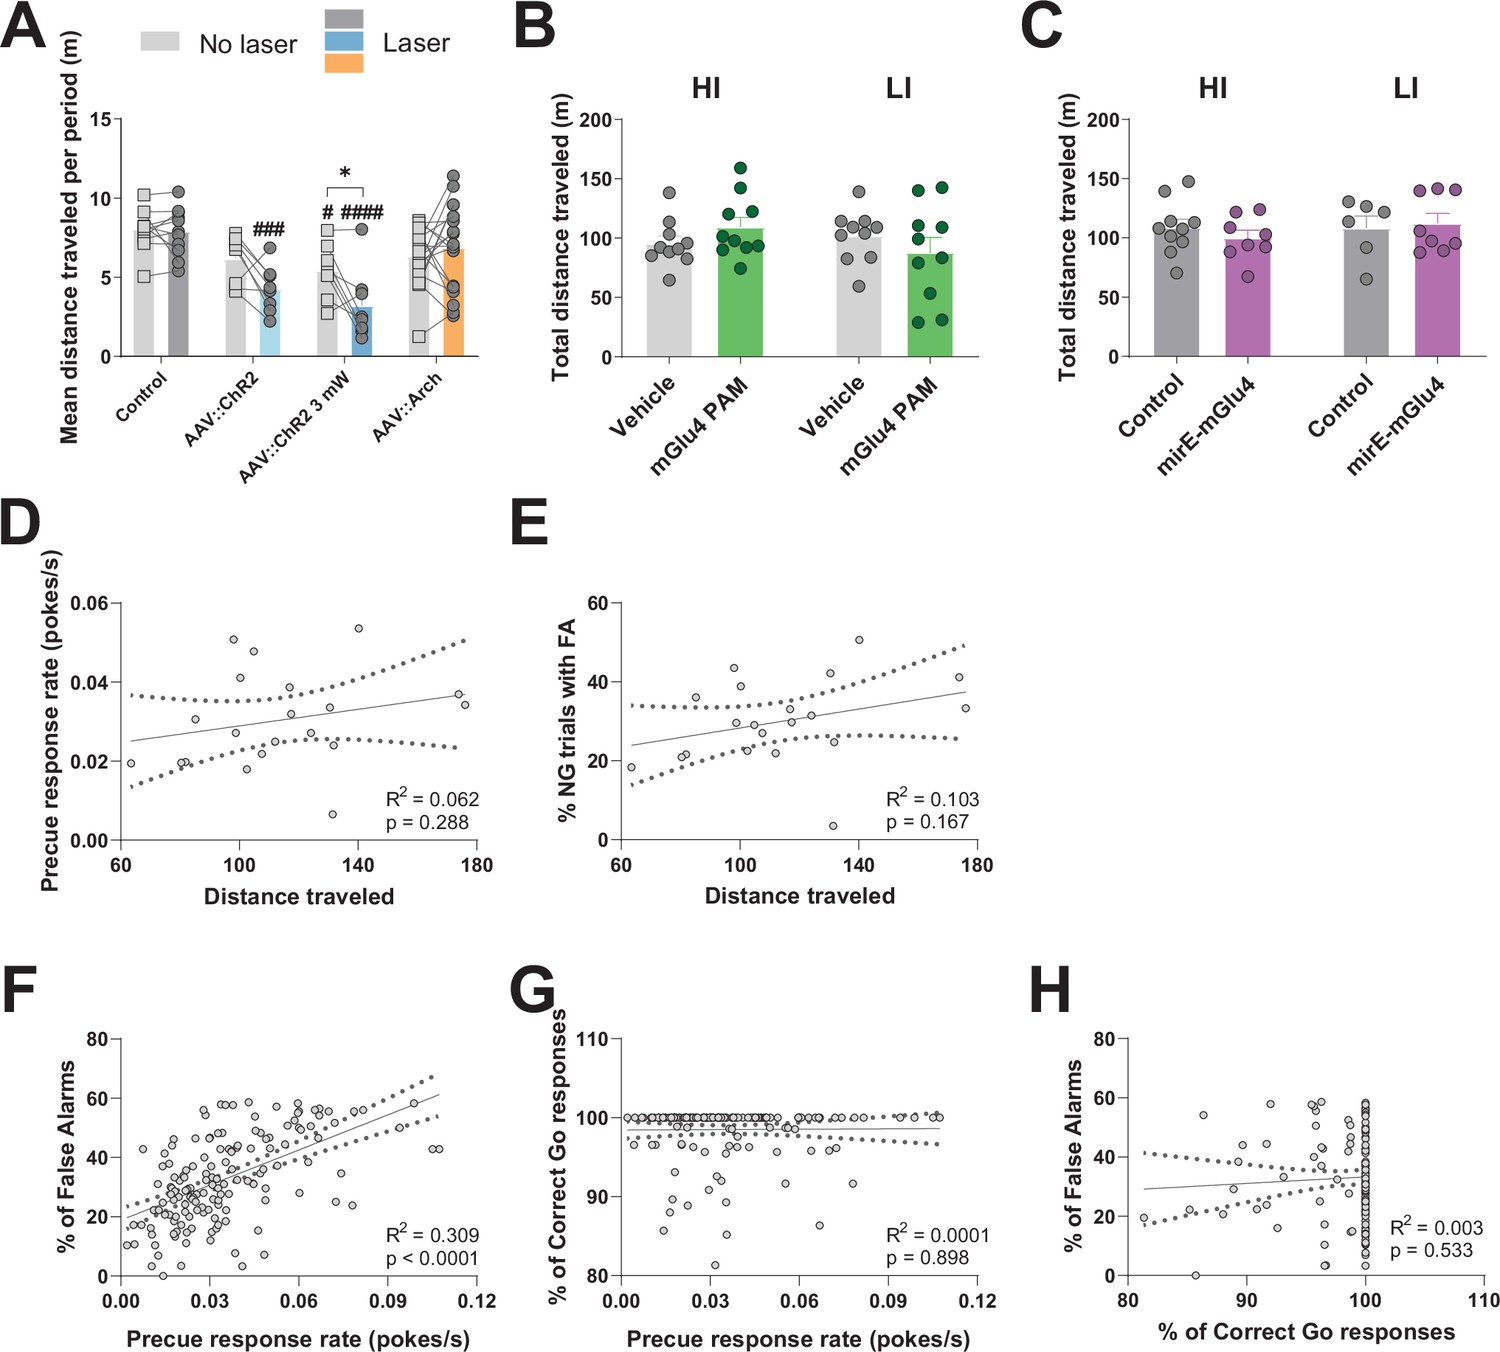
(A–C) Total distance traveled in Open Field (OF) experiments. (A) Optogenetic interrogation. Two-way RM ANOVA on total distance traveled in the OF revealed a significant main effect of laser time (F1,41 = 6.245, p = 0.0166), significant main effect of virus group (F3,41 = 10.07, p < 0.0001), and interaction between the two (F3,41 = 3.553, p = 0.0224). NControl = 11, NAAV::ChR2 = 8, NAAV::ChR2 3mW = 8, NAAV::Arch = 18. (B) mGlu4 PAM treatment did not affect the measure when considering all animals (two-tailed t-test; t19 = 0.016, p = 0.9871). N = 20 per group. No significant difference in the measure was also seen when splitting the animals into HI and LI groups as revealed by two-way RM ANOVA on distance traveled, as no main effect of treatment session (F1,18 = 0.0002, p = 0.9878), no main effect of group (F1,18 = 0.8124, p = 0.3793), and no interaction between the two (F1,18 = 2.199, p = 0.1554) was discovered. N = 10 per group. (C) Two-way RM ANOVA on distance traveled in the OF for mirE-mGlu4 groups showed no main effect of time (F1,28 = 0.5372, p = 0.4697), no main effect of impulsivity level (F1,28 = 0.5372, p = 0.4697), and no interaction between the two (F1,28 = 0.6171, p = 0.4387). NHI, Control = 10, NHI mirE-mGlu4 = 8, NHI, Control = 6, NHI mirE-mGlu4 = 8. *p < 0.05, **p < 0.01, ***p < 0.001, ****p < 0.0001, #p vs. control during the same behavioral session (treatment level). (D–E) Scatterplot for distance traveled in OF and impulsivity parameters showed no correlation between the measure and precue response rate (D) nor % of No-Go (NG) trials with false alarm (FA) (E). (F–H) Correlation between parameters in the Go/No-Go (GNG) task in animals from all experiments from no treatment sessions. (F) Significant correlation between precue response rate and % of trials with FA. (G) No correlation between precue response rate and % of correct Go responses. (H) No correlation between % of correct Go responses and % of trials with FA.
-
Figure 6—figure supplement 4—source data 1
Related to Figure 6—figure supplement 3A–H.
- https://cdn.elifesciences.org/articles/62123/elife-62123-fig6-figsupp4-data1-v2.xlsx
Figure 6—figure supplement 5
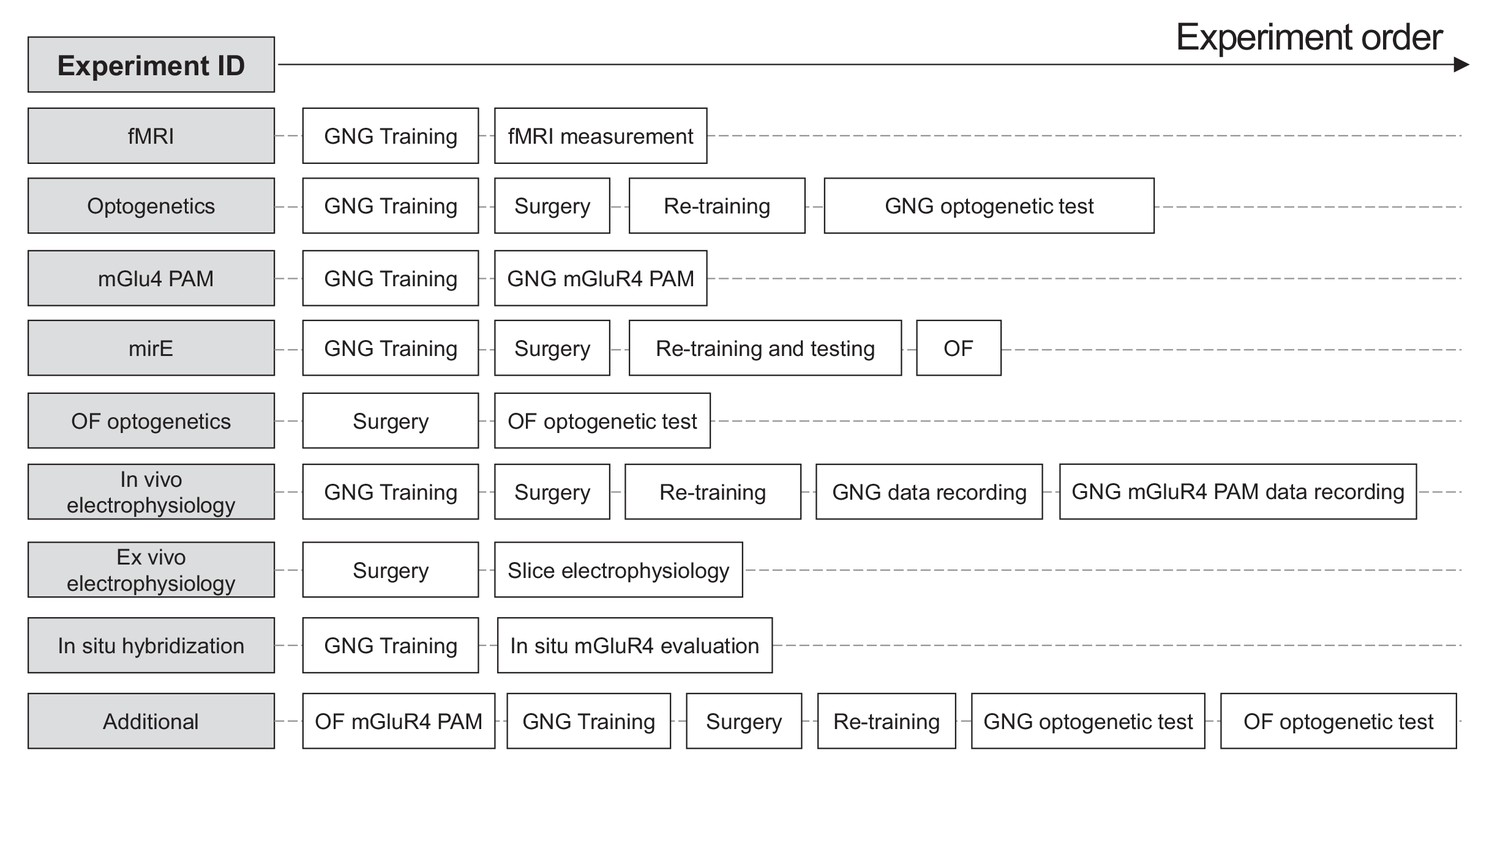
Subject history of the different mouse cohorts used in this study.
Figure 6—figure supplement 6
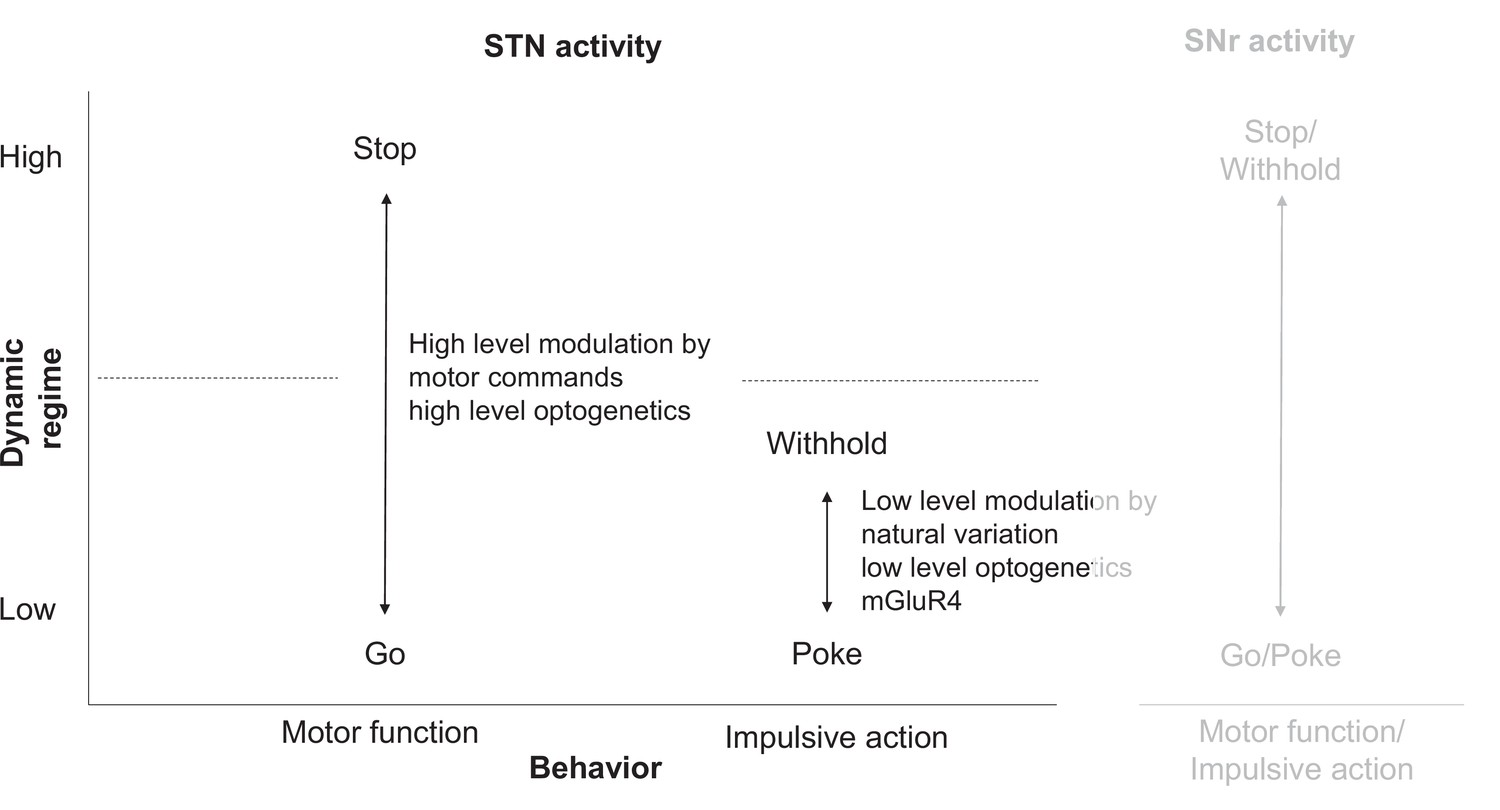
STN circuitry multiplexes motor function and impulsive traits as dissociable states.
(Left) Motor function (mobility) and impulsive action (precue pokes) are differentially encoded in STN (Figure 2). Low-level modulation of STN affects primarily impulsive traits but not general motor function. (Right) STN might influence substantia nigra pars reticulata (SNr) to modulate both impulsive and motor action. Note that motor function is less dissociated from impulsive traits in SNr, potentially due to SNr’s proximity to basal ganglia motor output.
Figure 6—figure supplement 7
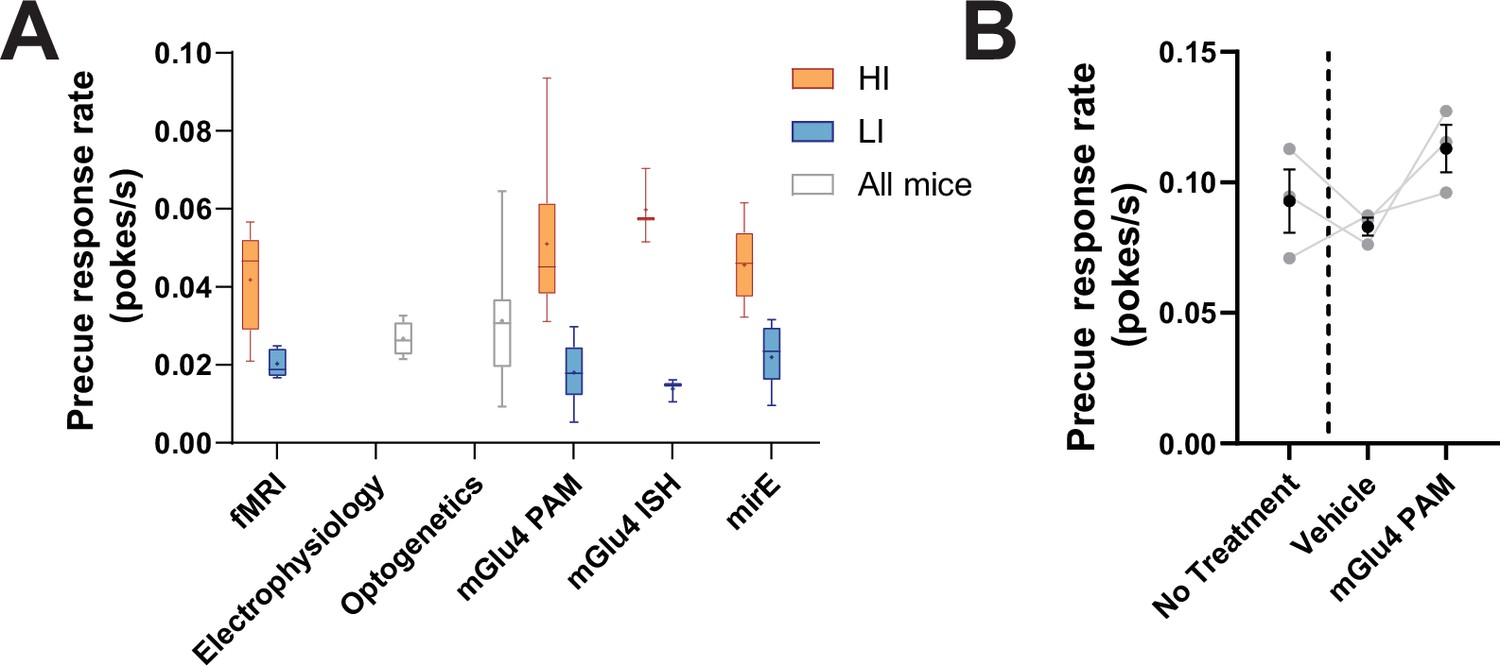
Distribution of precue response rates across behavioral cohorts.
(A) Whisker plots for precue response rate from all behavioral cohorts used, including the pre-surgery group used for electrophysiological assessment, split for HI/LI when appropriate. (B) Precue response rate for animals used for STN electrophysiological analysis. Data shown as mean ± SEM. Each line shows a single animal (N = 3).
-
Figure 6—figure supplement 7—source data 1
Related to Figure 6—figure supplement 7.
- https://cdn.elifesciences.org/articles/62123/elife-62123-fig6-figsupp7-data1-v2.xlsx
Tables
Table 1
Disease association score.
The disease-gene association scores for Grm4, filtered for psychiatric disorders that share the impulsivity domain. Data extracted from Open targets database (Carvalho-Silva et al., 2019) and DISEASES (Pletscher-Frankild et al., 2015). N.D. – not determined.
| Disorder | Data sources | |
|---|---|---|
| Open targets(Overall association score) | Diseases(Z-score) | |
| Parkinson’s disease | 0.070 | 4.7 |
| Schizophrenia | 0.061 | 4 |
| Mood disorder | 0.064 | 3.1 |
| Anxiety disorder | 0.066 | 2.4 |
| Autistic disorder | 0.015 | 1 |
| Schizoaffective disorder | 0.015 | 1.5 |
| Movement disease | 0.058 | 1.5 |
| Drug/alcohol dependence | 0.016 | 1.4 |
| Alzheimer’s disease | N.D. | 1.3 |
| Withdrawal disorder | N.D. | 1.3 |
| Unipolar depression | 0.063 | N.D. |
| Nervousness | 0.040 | N.D. |
| Bipolar disorder | 0.019 | N.D. |
Key resources table
| Reagent type (species) or resource | Designation | Source or reference | Identifiers | Additional information |
|---|---|---|---|---|
| Strain, strain background (Mus musculus, male) | Wild-type | Jackson Laboratory | C57BL/6J background | |
| Cell line (Mus musculus) | Neuro-2a | ATCC | CCL-131 | |
| Other | mGlu4-shRNA(mirE-mGlu4) | This paper | AAV2/5.SFFV.GFP.mGlu4-miR-E.WPRE | AAV vectors to transduce brain tissue; Titer: 4.24 × 10¹³ |
| Other | Renilla-Control shRNA(mirE-Renilla) | This paper | AAV2/5.SFFV.GFP.Renilla-miR-E.WPRE | AAV vectors to transduce brain tissue; Titer: 1.86 × 10¹³ |
| Other | syn-GFP | Penn Vector Core | AAV5.hsyn.eGFP.WPRE.hGH | AAV vectors to transduce brain tissue; Titer: 1.15 × 10¹³ |
| Other | syn-ChR2 | Penn Vector Core/Addgene | AAV2/5.hsyn.hChR2(H134R).eYFP.WPRE | AAV vectors to transduce brain tissue; Titer: 1.3 × 10¹³ |
| Other | syn-Arch | Penn Vector Core | AAV5.hsyn.ArchT.YFP.WPRE.hGH | AAV vectors to transduce brain tissue; Titer: 4.68 × 10¹² |
| Chemical compound, drug | DAPI | Life Technologies | DAPI | 1 µg/ml |
| Chemical compound, drug | mGlu4 PAM | Boehringer Ingelheim | 4-((E)-styryl)-pyrimidin-2-ylamine | 80 mg/kg |
| Commercial assay or kit | RNAscope Multiplex Fluorescent v2 kit | Advanced Cell Diagnostics | Cat no. 323100 | |
| Commercial assay or kit | Proprietary probes againstGmr4 (mGlu4) | Advanced Cell Diagnostics | Cat no. 480991 | |
| Commercial assay or kit | Proprietary probes against Slc17a6+ Slc17 a7 (VGlut2 +1) | Advanced Cell Diagnostics | Cat no. 416631 and 319171 | |
| Commercial assay or kit | TMR Fluorescein Evaluation kit | Perkin Elmer | Cat no. NEL 760001KT | |
| Software, algorithm | GraphPad Prism 7&8 | GraphPad Software, Inc | Version 8.1.1 | |
| Software, algorithm | scikit-learn package | doi:10.1007/s13398-014-0173-7.2 | Python 3 | |
| Software, algorithm | MATLAB | Mathworks | R2015b | |
| Software, algorithm | Ethovision | Noldus Information Technology | XT 8 and 12 | |
| Software, algorithm | AnyMaze | Stoelting | ||
| Software, algorithm | TSE VideoMot 3D | TSE Systems | Version 7.01 | |
| Software, algorithm | Offline Sorter | Plexon | Version 4 | |
| Software, algorithm | CinePlex Studio & Editor | Plexon | Version 3.6 | |
| Software, algorithm | Neuroexplorer | Plexon | Version 5 | |
| Software, algorithm | Clampfit software | Molecular Devices | ||
| Software, algorithm | Omniplex | Plexon | Version 1.16.2 | |
| Software, algorithm | R | The R Project | Version 3.4 | |
| Software, algorithm | DPABI | DPABI R-fMRI Network | Version 2.1 | |
| Software, algorithm | Paravision | Bruker | Version 6.1 | |
| Software, algorithm | Adobe Illustrator | Adobe | RRID:SCR_010279 | |
| Sequence-based reagent | Grm4.1332 | EntrezID: 268,934Guide: TTCTGATGTACTTAAGCAGCTG | Gene-specific sequences for mGlu4-shRNA knock down | 97mer: TGCTGTTGACAGTGAGCGAAGCT GCTTAAGTACATCAGAATAGTGAAGCCAC AGATGTATTCTGATGTACTTAAGCAGCTG TGCCTACTGCCTCGGA |
| Sequence-based reagent | Grm4.337 | EntrezID: 268,934Guide:TTAGAGACCCATGAATAGCGGG | Gene-specific sequences for mGlu4-shRNA knock down | 97mer: TGCTGTTGACAGTGAGCGACCGCTAT TCATGGGTCTCTAATAGTGAAGCCACAGATG TATTAGAGACCCATGAATAGCGGGTGCCTA CTGCCTCGGA |
| Sequence-based reagent | Grm4.2087 | EntrezID: 268,934Guide: TTGACAATGGGTATGGGCTGGC | Gene-specific sequences for mGlu4-shRNA knock down | 97mer: TGCTGTTGACAGTGAGCGACCAGCC CATACCCATTGTCAATAGTGAAGCCACAGAT GTATTGACAATGGGTATGGGCTGGCTGCCT ACTGCCTCGGA |
| Sequence-based reagent | Grm4.788 | EntrezID: 268,934Guide: TTTGATGATCTTGTCAAACTCC | Gene-specific sequences for mGlu4-shRNA knock down | 97mer: TGCTGTTGACAGTGAGCGAGAGTTTGA CAAGATCATCAAATAGTGAAGCCACAGA TGTATTTGATGATCTTGTCAAAC TCCTGCCTACTGCCTCGGA |
Additional files
-
Transparent reporting form
- https://cdn.elifesciences.org/articles/62123/elife-62123-transrepform1-v2.pdf
-
Source code 1
Code for assessing behavioral parameters.
- https://cdn.elifesciences.org/articles/62123/elife-62123-supp1-v2.zip
-
Source code 2
Code for post-processing in vivo electrophysiological data.
- https://cdn.elifesciences.org/articles/62123/elife-62123-supp2-v2.zip
-
Source code 3
Data and code for fMRI.
- https://cdn.elifesciences.org/articles/62123/elife-62123-supp3-v2.zip
-
Source code 4
Code for cell counting from histological images.
- https://cdn.elifesciences.org/articles/62123/elife-62123-supp4-v2.zip
Download links
A two-part list of links to download the article, or parts of the article, in various formats.
Downloads (link to download the article as PDF)
Open citations (links to open the citations from this article in various online reference manager services)
Cite this article (links to download the citations from this article in formats compatible with various reference manager tools)
Dissociation of impulsive traits by subthalamic metabotropic glutamate receptor 4
eLife 11:e62123.
https://doi.org/10.7554/eLife.62123


