A dual role for Cav1.4 Ca2+ channels in the molecular and structural organization of the rod photoreceptor synapse
- Department of Molecular Physiology and Biophysics, University of Iowa, United States
- Iowa Neuroscience Institute, University of Iowa, United States
- Pappajohn Biomedical Institute, University of Iowa, United States
- Department of Neuroscience, University of Wisconsin-Madison, United States
- Department of Ophthalmology, University of California, San Francisco, United States
- Department of Biochemistry, University of Iowa, United States
- Department of Ophthalmology, United States
- Department of Ophthalmology and Visual Science, University of Wisconsin-Madison, United States
Figures
Figure 1 with 2 supplements
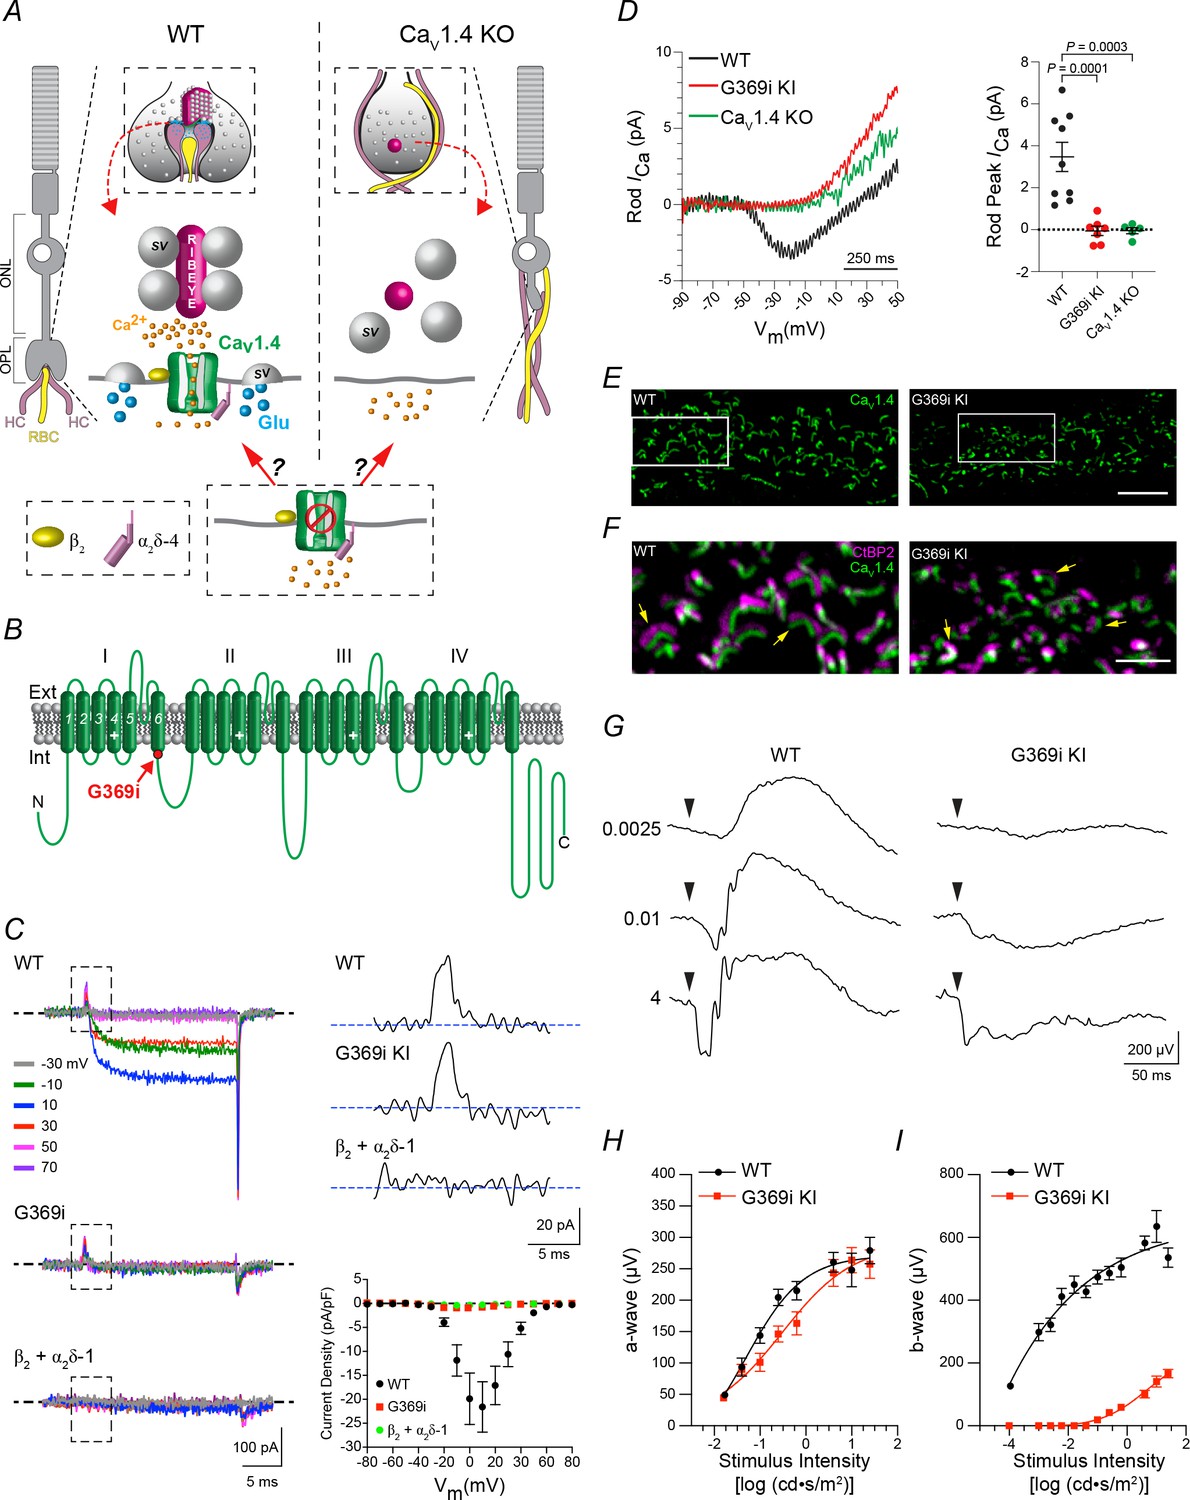
Characterization of G369i KI mouse strain to study the requirement of Cav1.4 Ca2+ signals in rod synaptogenesis.
(A), potential roles of Cav1.4 in the assembly of rod synapses. In the outer plexiform layer (OPL) of WT mice, neurites of two horizontal cells (HCs) and one rod bipolar cell (RBC) invaginate into the rod spherule; Cav1.4 clusters beneath the ribbon that tethers glutamate (Glu)-filled synaptic vesicles (SVs). In Cav1.4 KO retina, ribbons do not form, and HC and RBC neurites sprout into the outer nuclear layer (ONL). The efficacy of a non-conducting Cav1.4 mutant channel to support rod synaptogenesis will depend on whether Ca2+ influx through Cav1.4 is required. (B), schematic of Cav1.4 pore-forming subunit with four homologous repeats (I–IV) each with six transmembrane domains; location of the glycine insertion in domain I (G369i) is indicated. G369i mutation (red). (C), left, representative Ba2+ currents (IBa) evoked by 20 ms voltage steps from −90 mV to the indicated voltages in transfected HEK293T cells. Boxed regions indicate gating currents evident in cells co-transfected with β2 + α2δ−1 and WT or G369i mutant channels but not in cells transfected with β2 and α2δ−1 alone. Upper right, representative gating currents from boxed regions (left) elicited by a voltage step to +70 mV. Lower right, graph shows I–V relationship for cells co-transfected with β2 + α2δ−1 alone (n = 5), or co-transfected with WT (n = 9) or G369i mutant channels (n = 6). Points represent mean ± SEM. (D), representative traces (left) and average amplitudes of peak rod Ca2+ currents (ICa, right) recorded in acute slices from WT, G369i KI, and Cav1.4 KO mouse retinas. Stimulus protocol was a 1 s voltage ramp from −90 to +50 mV. Points represent individual recorded rods with the mean and SEM indicated with bars. P values were determined by one-way ANOVA with Uncorrected Fisher’s Least Significant Difference post-hoc test. (E), confocal micrographs of the OPL of wild-type (WT) and G369i KI retina double-labeled with antibodies against Cav1.4 and CtBP2 (CtBP2 labeling removed here for clarity). (F), expanded view of the boxed regions in E showing both CtBP2 and Cav1.4 labeling. Arrows depict arc-shaped ribbons apposed to Cav1.4 labeling. Scale bars, 5 μm. (G) representative voltage responses from flash ERGs recorded in dark- adapted WT (n = 4) and G369i KI (n = 4) mice. Arrowheads indicate time of flash. Numbers indicate flash intensities (cd•s /m2). (H, I), a-wave amplitudes (H) and b-wave amplitudes (I) measured from recordings obtained as in (G). Points represent mean ± SEM.
-
Figure 1—source data 1
Traces corresponding to ICa that were used for analyses of rod peak ICa in Figure 1D are shown in the ‘.PDF’ file.
Individual values obtained for peak ICa in different cells are listed in the ‘.xlsx’ file.
- https://cdn.elifesciences.org/articles/62184/elife-62184-fig1-data1-v2.xlsx
Figure 1—figure supplement 1
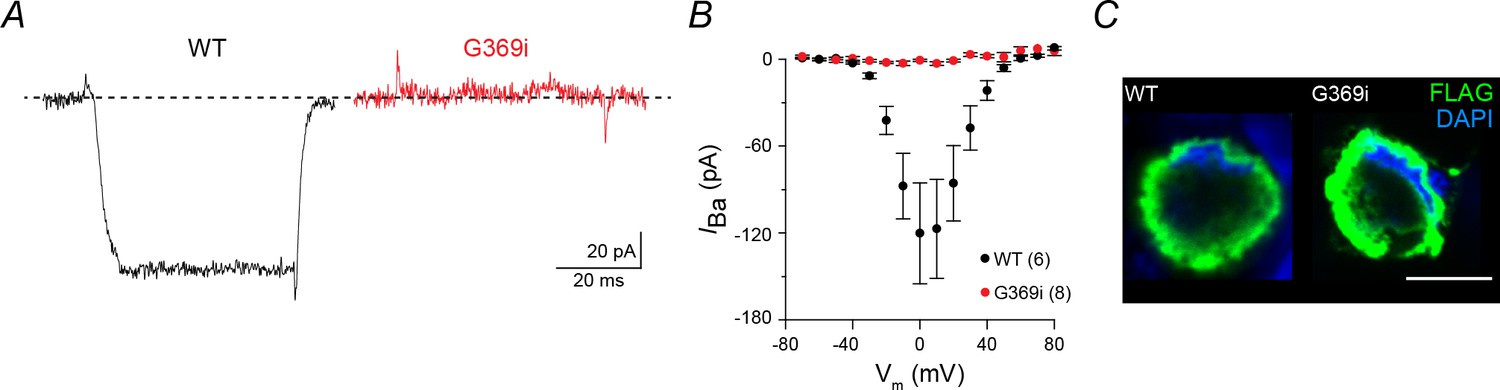
Characterization of G369i mutation in transfected HEK293T cells.
(A) Representative Ba2+ currents (IBa) evoked by 50 ms voltage step from −80 to 0 mV in HEK293T cells co-transfected with wild-type (WT) (black) or G369i (red) Cav1.4 channels and auxiliary subunits β2 and α2δ−4. (B) Graph showing I–V relationship for cells co-transfected with WT or G369i mutant channels. IBa was evoked by 50 ms voltage steps from −70 to +70 mV in +10 mV increments. IBa is plotted against each test voltage (Vm). Points represent mean ± SEM. Parentheses indicate number of cells. (C) HEK293T cells co-transfected as in A and immunofluorescently labeled using FLAG-tag antibodies. Scale bar = 10 μm.
Figure 1—figure supplement 2

Characterization of the G369i KI mouse line.
(A) CRISPR-Cas9 genome editing was used to insert a glycine residue between G369 and V370. The restriction site recognized by the endonuclease Fnu4HI was included in the repair template for genotyping. PAM, protospacer adjacent motif. cRNA, CRISPR RNA. (B) Gel image of PCR products that were amplified from genomic DNA followed by Fnu4HI digestion. Following digestion, two DNA fragments of ~330 base pairs (bp) and 60 bp (not shown) are present if the G369i mutation and Fnu4HI restriction site are within the CACNA1F gene. Note: the CACNA1F gene lies on the X chromosome, which precludes male mice from being heterozygous for the G369i mutation. (C) Western blot analysis of whole retina lysates collected from WT, G369i KI and Cav1.4 KO mice. Blots were probed with antibodies against Cav1.4 and β-actin. Bands corresponding to Cav1.4 were present in WT and G369i KI retina lysates, but not lysates from Cav1.4 KO mice.
Figure 2
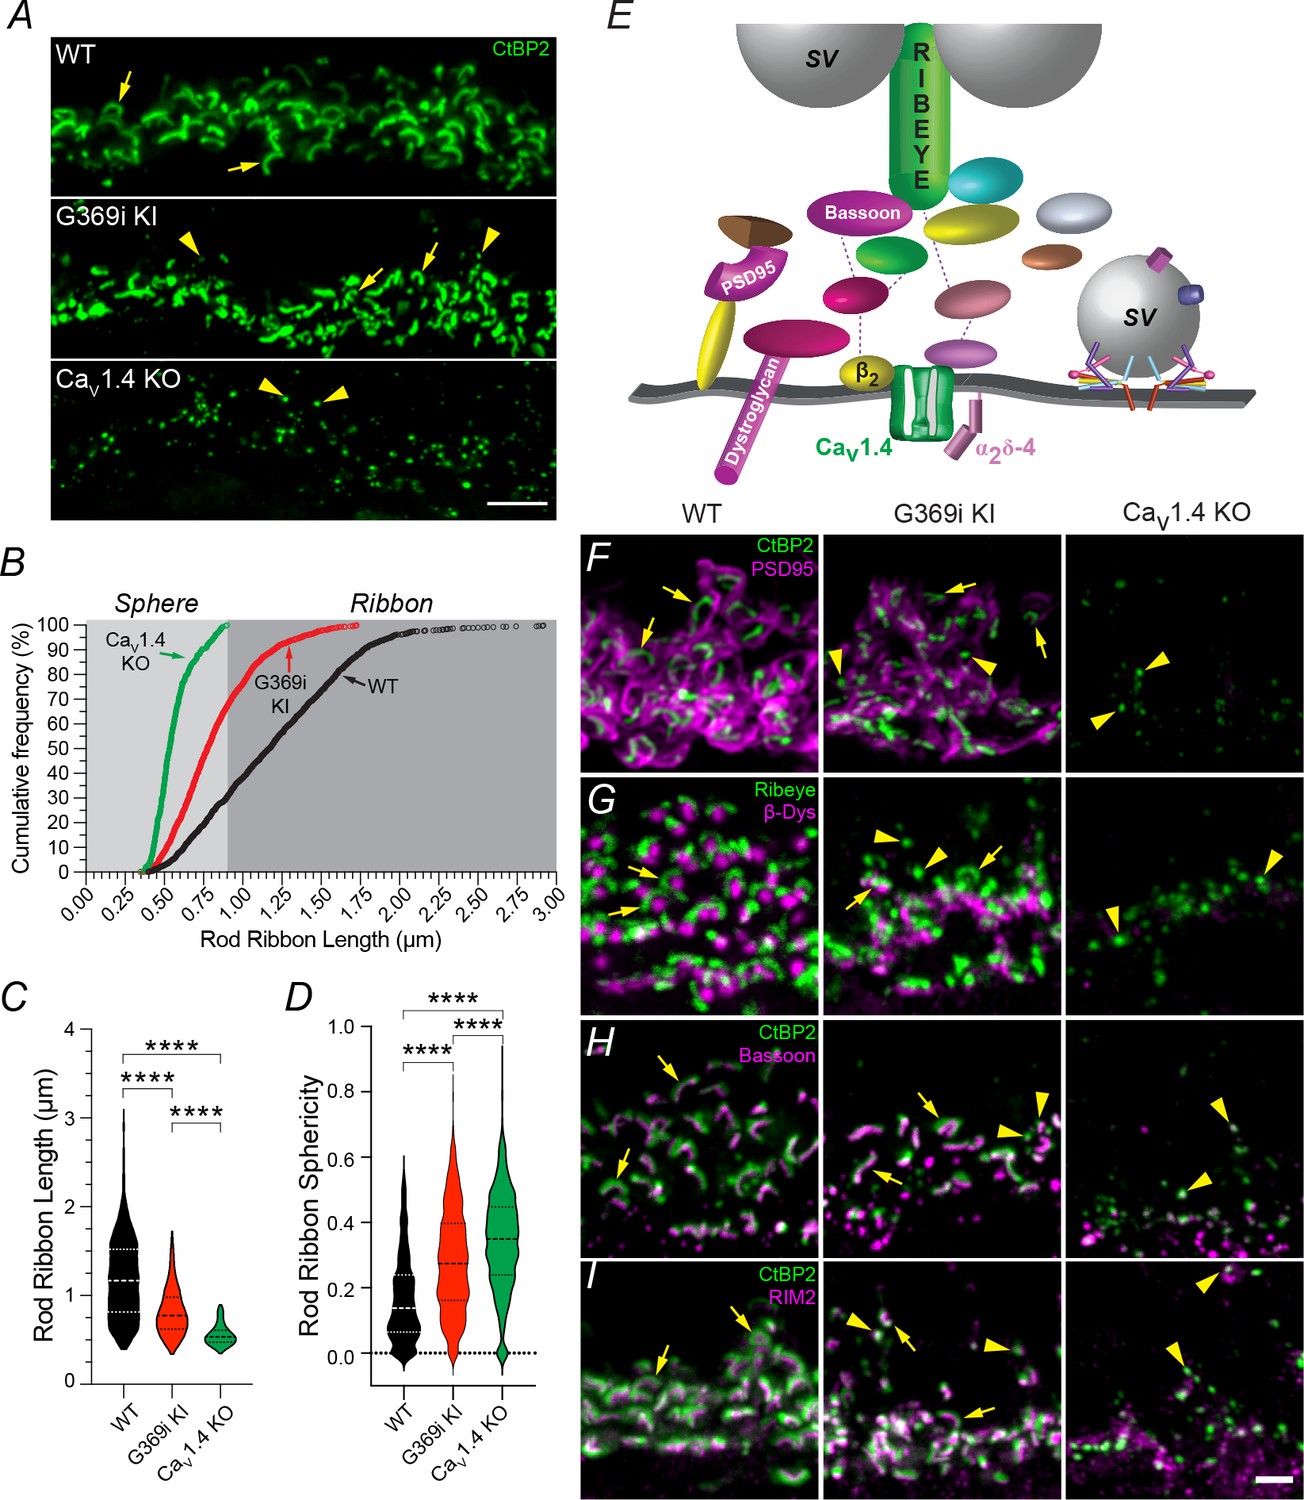
Rod ribbons still form in the absence of Cav1.4 Ca2+ signals.
(A) Confocal micrographs of the OPL of WT, G369i KI and Cav1.4 KO mice labeled with antibodies against CtBP2 to mark ribbons (arrows). Arrowheads depict spheres resembling immature ribbons. (B) Cumulative frequency of rod ribbon lengths in WT, G369i KI, and Cav1.4 KO. Ribbon states less than and greater than 0.95 µm were classified as spheres and ribbons, respectively. (C, D) Violin plots of rod ribbon lengths (C) and sphericity (D) obtained from dataset in B. **** p<0.001 by one-way ANOVA with Tukey’s multiple comparison post-hoc test. WT, n = 1264 ribbons; KO, n = 348 ribbons; G369i KI, n = 1322 ribbons. Data were collected from the retinas of at least six individual mice per genotype. (E) Schematic of a rod active zone and associated proteins. SV, synaptic vesicle. (F–I) Confocal micrographs (maximum z-projections) of the OPL of WT, G369i KI and Cav1.4 KO mice double-labeled with antibodies against CtBP2 and PSD95 (F), Ribeye and β-dystroglycan (β-Dys), (G) CtBP2 and Bassoon (H) and CtBP2 and RIM2 (I). Arrows and arrowheads depict ribbons and spheres, respectively. Scale bars, 5 μm in A, 2 μm in F-I.
-
Figure 2—source data 1
The image archive contains all images used in quantitative analyses in Figure 2B–D.
The data were exported as 8-bit ‘tif’ files (1600 × 1600 pixels). Values obtained for individual data points (and outlier analysis) for summary graphs in Figure 2B–D are contained in ‘.xlsx’ files.
- https://cdn.elifesciences.org/articles/62184/elife-62184-fig2-data1-v2.zip
Figure 3
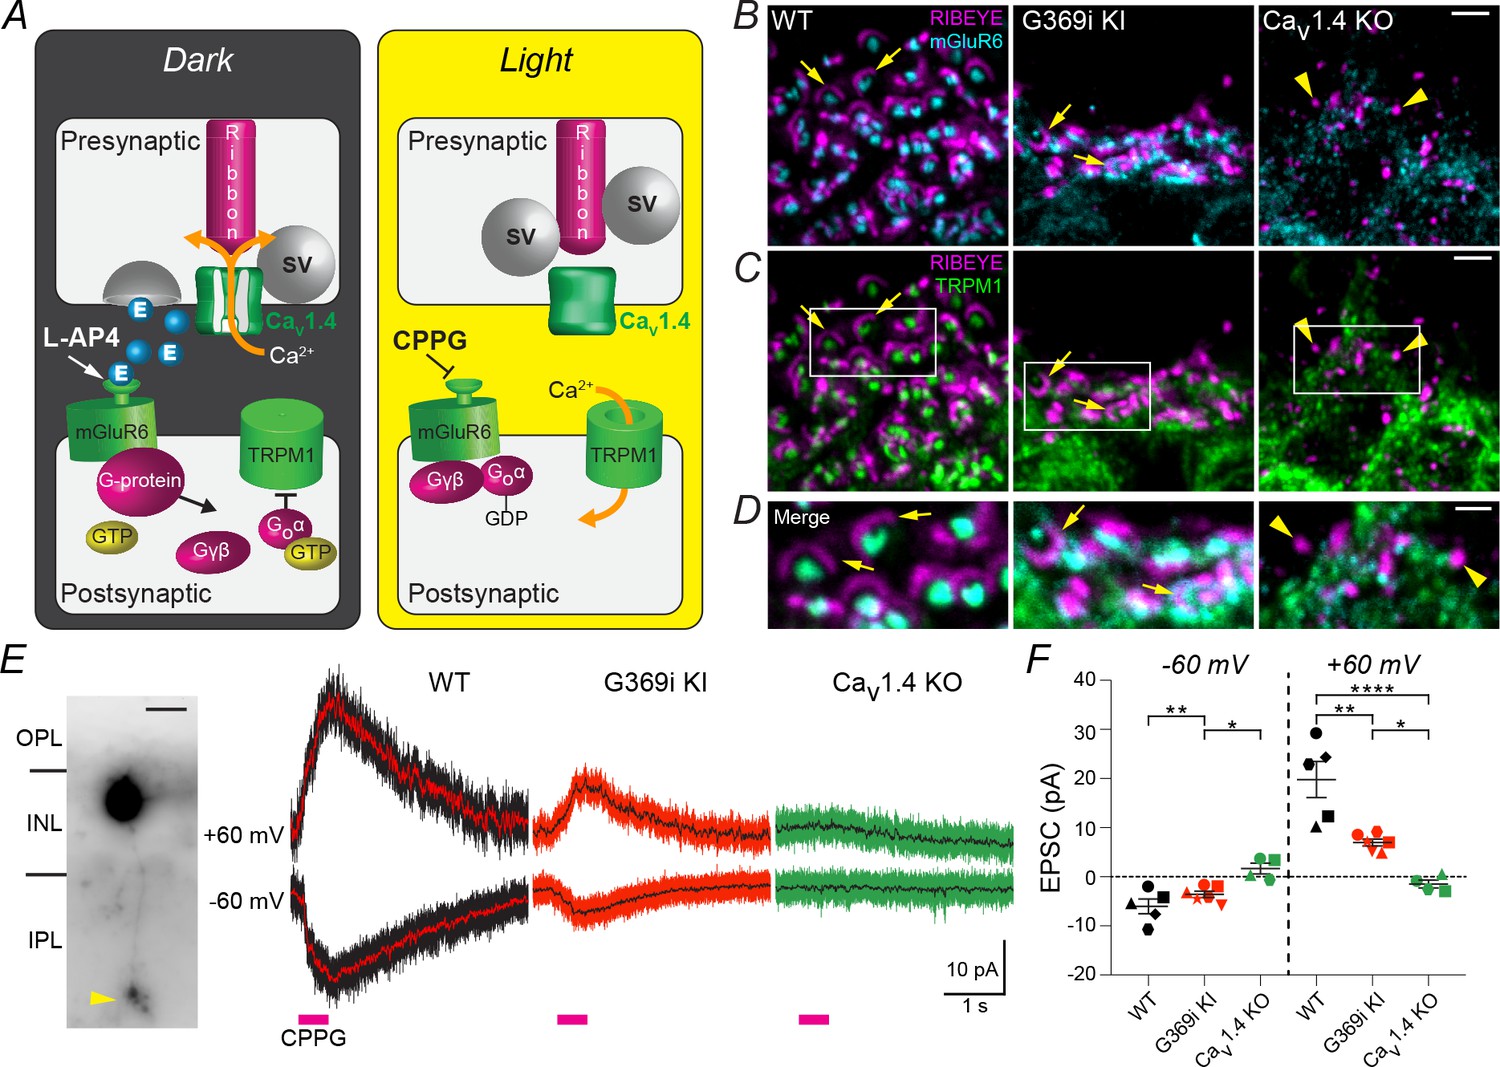
Postsynaptic signaling at rod synapses is partially intact in the absence of Cav1.4 Ca2+ signals.
(A), schematic illustrating synaptic transmission at rod-RBC synapses. In the dark, rods are depolarized, which activates Cav1.4 and Ca2+-triggered glutamate (E) release. Activation of the mGluR6/G-protein pathway by glutamate or L-AP4 inhibits TRPM1-dependent channels. Light signals or the mGluR6 antagonist CPPG activate the ON pathway by disinhibiting the TRPM1-dependent conductance. (B–D), confocal micrographs of the OPL of WT, G369i KI and Cav1.4 KO mice triple-labeled with antibodies against Ribeye, mGluR6, and TRPM1. In B,C, only signals for Ribeye and mGluR6 (B) or TRPM1 (C) are shown for clarity. (C) Higher magnification views of boxed regions are shown in the merged image (D). Arrows and arrowheads depict ribbons and spheres, respectively. (E–F), whole-cell patch clamp electrophysiology of RBCs recorded in WT, G369i KI, and Cav1.4 KO mouse retinal slices. E, left, representative image of Lucifer Yellow-filled RBC showing typical lobular-shaped terminal (arrowhead). Right, representative current responses to CPPG puffs in RBCs held at −60 mV and +60 mV. Lines within each current trace are low-pass FFT filtered data. F, peak amplitudes of CPPG-evoked EPSCs. Each shape represents individual cells recorded at −60 and +60 mV. Bars represent mean ± SEM. ****p<0.0001, **p<0.01, *p<0.05, by one-way ANOVA with Fishers least significant difference post-hoc test. Scale bars, 2 μm in B,C, 1 μm in D, 15 μm in E.
-
Figure 3—source data 1
Traces corresponding to EPSCs that were used for analyses of EPSC amplitudes in Figure 3F are included in the ‘.PDF’ file; individual values obtained for EPSC amplitudes in different cells are listed in the ‘.xlsx’ file.
- https://cdn.elifesciences.org/articles/62184/elife-62184-fig3-data1-v2.zip
Figure 4 with 2 supplements
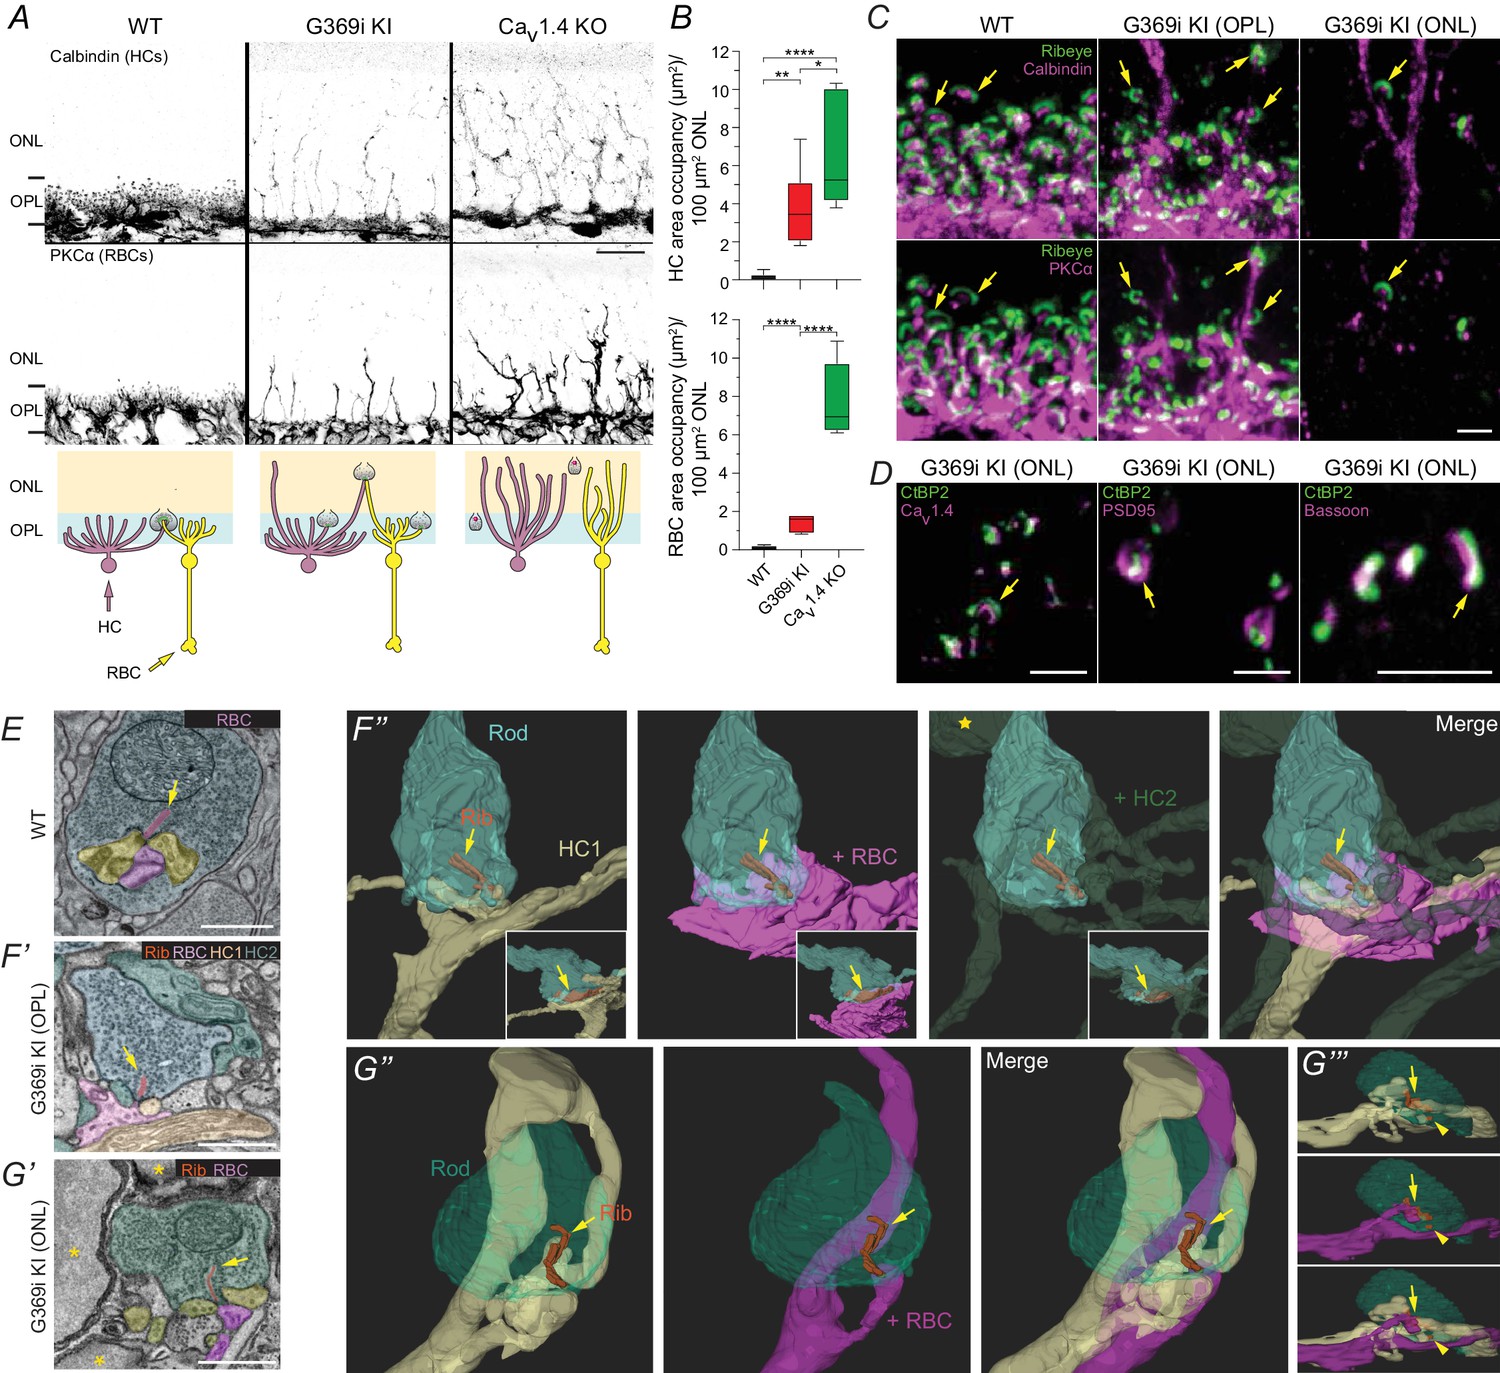
Rod synapses lack invaginating HC and RBC neurites in the absence of Cav1.4 Ca2+ signals.
(A), confocal micrographs of the ONL and OPL of WT, G369i KI and Cav1.4 KO retinas immunolabeled for calbindin and PKCα. The schematic below illustrates neurite sprouting in each genotype. (B), quantification of the area in the ONL occupied by HCs (calbindin) or RBCs (PKCα). One-way ANOVA with Fishers least significant difference post-hoc test. ****p<0.0001, **p<0.01, *p<0.05. n = 6 mice for each genotype. (C), confocal micrographs of the OPL of WT and the ONL and OPL of G369i KI retinas immunolabeled for Ribeye and Calbindin (upper panels) or PKCα (lower panels). (D), confocal micrographs of the ONL of G369i KI retinas that were immunolabeled for CtBP2 and Cav1.4 (left), PSD95 (middle) or Bassoon (right). (E), TEM image of a rod terminal in a WT retina. (F,G), serial block-face scanning electron microscopy images (F’,G’) and 3D reconstructions (F’’–G’’’) of rod terminals in a G369i KI retina. Rod terminals located within the OPL (F) and ONL (G). The yellow star F’’ indicates a neurite from HC2 sprouting into the ONL. Insets in F’’ are a rotated view. G’’’ is a side view of G’’. Arrows depict anchored ribbons. Arrowheads in G’’’ depict additional ribbon. Asterisks in G’ indicate rod somas. Scale bars, 10 μm in A, 2 μm in C-D, 1 μm in E,F’,G’. Rib, ribbon. RBC, rod bipolar cell. HC, horizontal cell.
-
Figure 4—source data 1
The image archive contains all images used in quantitative analyses in Figure 4B.
The data were exported as 8-bit ‘tif’ files (800 × 600 pixels). Values obtained for individual data points (and outlier analysis) for summary graphs in are contained in ‘.xlsx’ files.
- https://cdn.elifesciences.org/articles/62184/elife-62184-fig4-data1-v2.zip
Figure 4—figure supplement 1
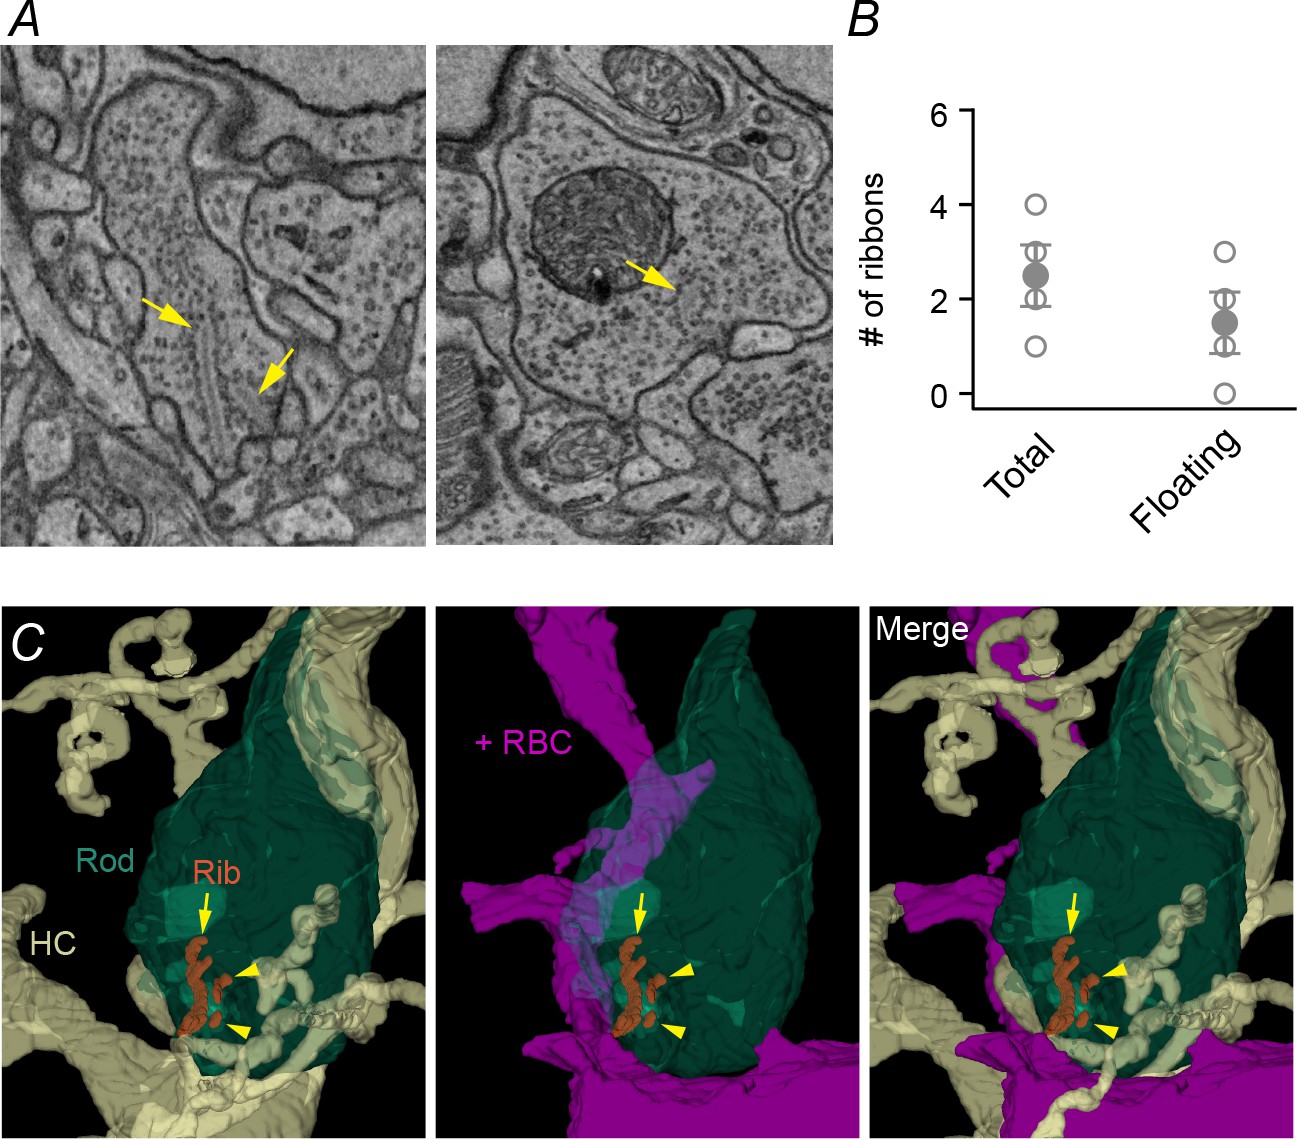
Multiple ribbons are found in rod terminals of G369i KI mice.
(A) Electron micrographs of rod terminals with multiple ribbons (left) and a club-shaped ribbon (right). Arrows depict separate ribbons. (B) Number of total and floating ribbons in four rod terminals of G369i KI mice. Filled circles represent the means. Bars represent the SEM. (C) Additional SBFSEM reconstruction of a G369i KI spherule at the OPL/ONL border. Panels are labeled as in Figure 4F–G.
Figure 4—figure supplement 2
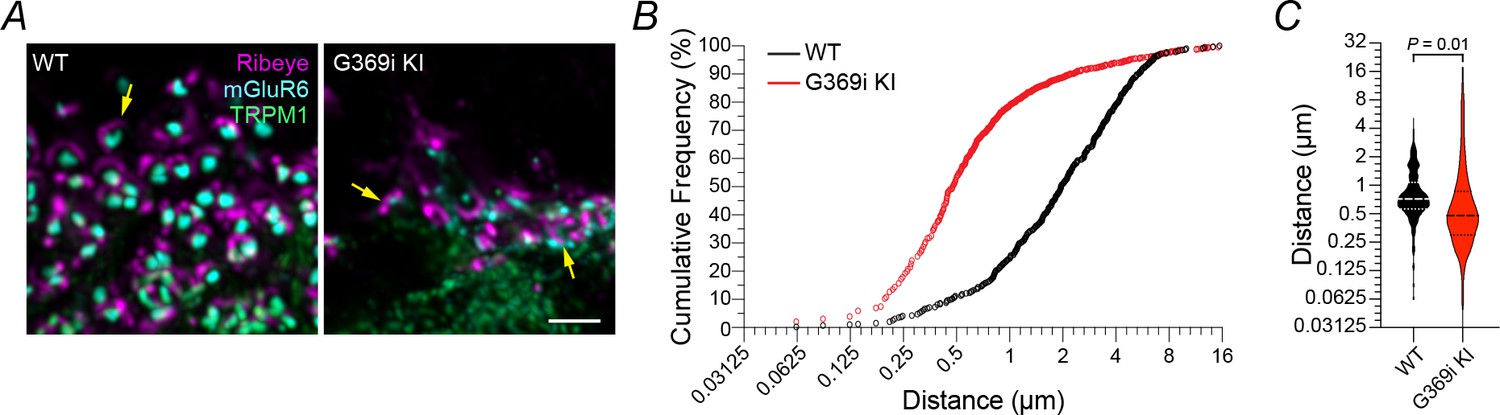
Nearest-neighbor analysis of Ribeye- and mGluR6-labeled structures.
(A) Deconvolved confocal images from Figure 2B-D. Arrows indicate arc-shaped ribbons in apposition to mGluR6/TRPM1. (B) Cumulative frequency of distances between Ribeye and mGluR6. (C) Violin plot of Ribeye-mGluR6 distances. Solid lines represent the medians. Dashed lines represent the quartiles. p-value determined by unpaired t-test. WT, n = 864. G369i KI, n = 1390.
-
Figure 4—figure supplement 2—source data 1
The image archive contains all images used in quantitative analyses in Figure 4—figure supplement 2B; Figure 4—figure supplement 2C.
The data were exported as 8-bit ‘tif’ files (1024 × 1024 pixels). Values for individual data points (and outlier analysis) for summary graphs in Figure 4—figure supplement 2B are Figure 4—figure supplement 2C contained in excel files.
- https://cdn.elifesciences.org/articles/62184/elife-62184-fig4-figsupp2-data1-v2.zip
Tables
Table 1
Antibodies used in this study.
| Antibody | Host/clonality | Manufacturer | Cat no. | RRID |
|---|---|---|---|---|
| Bassoon | ms-IgG2A | Thermo Fisher Scientific | MA1-20689 | AB_2066981 |
| Cone Arrestin | rabbit | Millipore | AB15282 | AB_1163387 |
| Calbindin (D-28K) | mouse-IgG1 | Sigma | C9848 | AB_476894 |
| PKCα | mouse-IgG2A | Invitrogen | MA1-157 | AB_2536865 |
| rabbit | UC Santa Cruz | SC-208 | AB_2168668 | |
| Ctbp2 | mouse-IgG1 | BD Biosciences | 612044 | AB_399431 |
| Ribeye | rabbit | Synaptic Systems | 192 103 | AB_2086775 |
| Psd95 | mouse-IgG2A | UC Davis/NIH NeuroMab | 75–028 | AB_2292909 |
| RIM2 | rabbit | Synaptic Systems | 140–103 | AB_887776 |
| mGluR6-366 | mouse | Dr. Theodore Wensel | N/A | N/A |
| TRPM1 | mouse-IgG1 | Dr. Theodore Wensel | N/A | N/A |
| Cav1.4 | rabbit | Lee Lab Ab167 | N/A | AB_2650487 |
Additional files
Download links
A two-part list of links to download the article, or parts of the article, in various formats.
Downloads (link to download the article as PDF)
Open citations (links to open the citations from this article in various online reference manager services)
Cite this article (links to download the citations from this article in formats compatible with various reference manager tools)
A dual role for Cav1.4 Ca2+ channels in the molecular and structural organization of the rod photoreceptor synapse
eLife 9:e62184.
https://doi.org/10.7554/eLife.62184


