APOE2 is associated with longevity independent of Alzheimer’s disease
- Department of Neuroscience, Mayo Clinic, United States
- Department of Aging Neurobiology, National Center for Geriatrics and Gerontology, Japan
- Neuroscience Graduate Program, Mayo Clinic, United States
- United Graduate School of Child Development, Osaka University, Japan
- Barshop Institute for Longevity and Aging Studies, University of Texas Health Science Center at San Antonio, United States
- Duke University School of Medicine, Durham Veterans Health Administration Medical Center's Geriatric Research, Education and Clinical Center, United States
- Department of Neuroscience, Georgetown University Medical Center, United States
- Division of Biomedical Statistics and Informatics, Mayo Clinic, United States
Figures
Figure 1
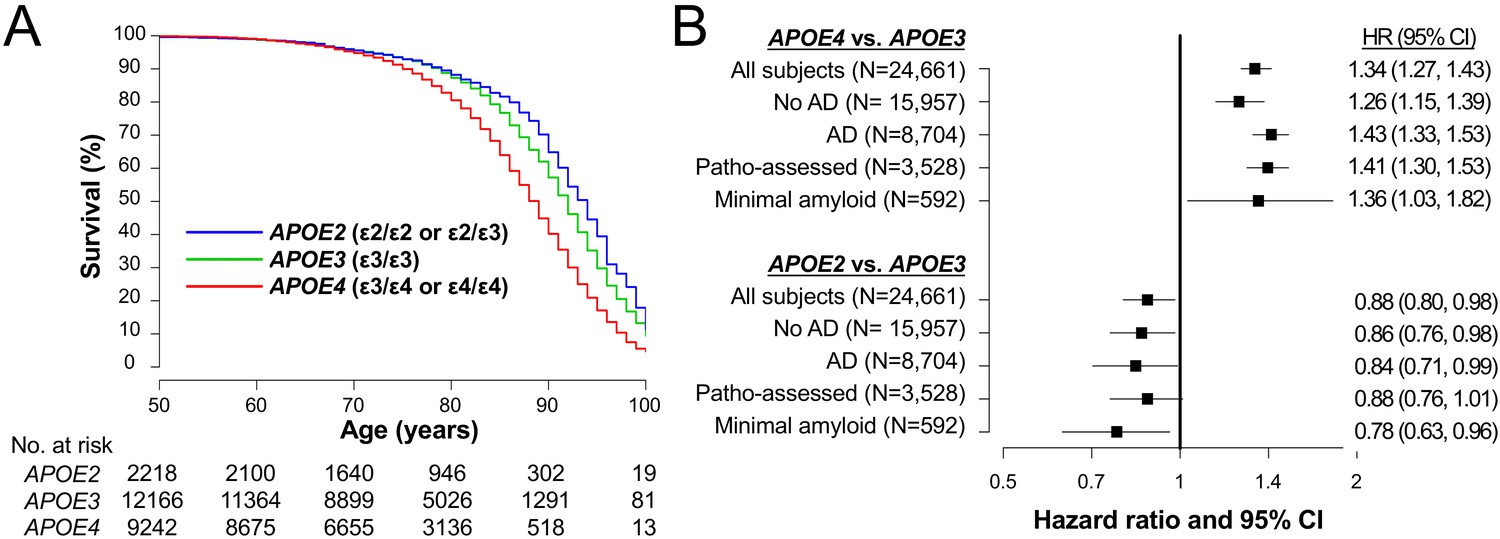
APOE associate with lifespan irrespective of AD in clinical cohorts.
(A) Kaplan-Meier survival curve according to APOE genotype. (B) Effects of APOE4 (ε3/ε4 or ε4/ε4) or APOE2 (ε2/ε3 or ε2/ε2) on survival compared to APOE3 (ε3/ε3) as a reference in all subjects (‘All subjects’), when stratifying by AD diagnosis at last visit (‘No AD’ or ‘AD’), in subjects with neuropathologically-assessment (‘Patho-assessed’), and subjects with minimal amyloid pathology (‘Minimal amyloid’). HR = hazard ratio. CI = confidence interval. HRs and 95% CIs result from Cox proportional hazards regression models. Models for all subjects were adjusted for sex, race, cognitive status at last visit, presence of AD at last visit, and cardiovascular factors. The models for subjects with neuropathological assessment were adjusted for sex, race, CERAD diffuse plaque score, CERAD neuritic plaque score, Braak NFT stage, presence of vascular pathology, and cardiovascular factors. All other models were adjusted for sex, race, and cardiovascular factors.
Figure 2
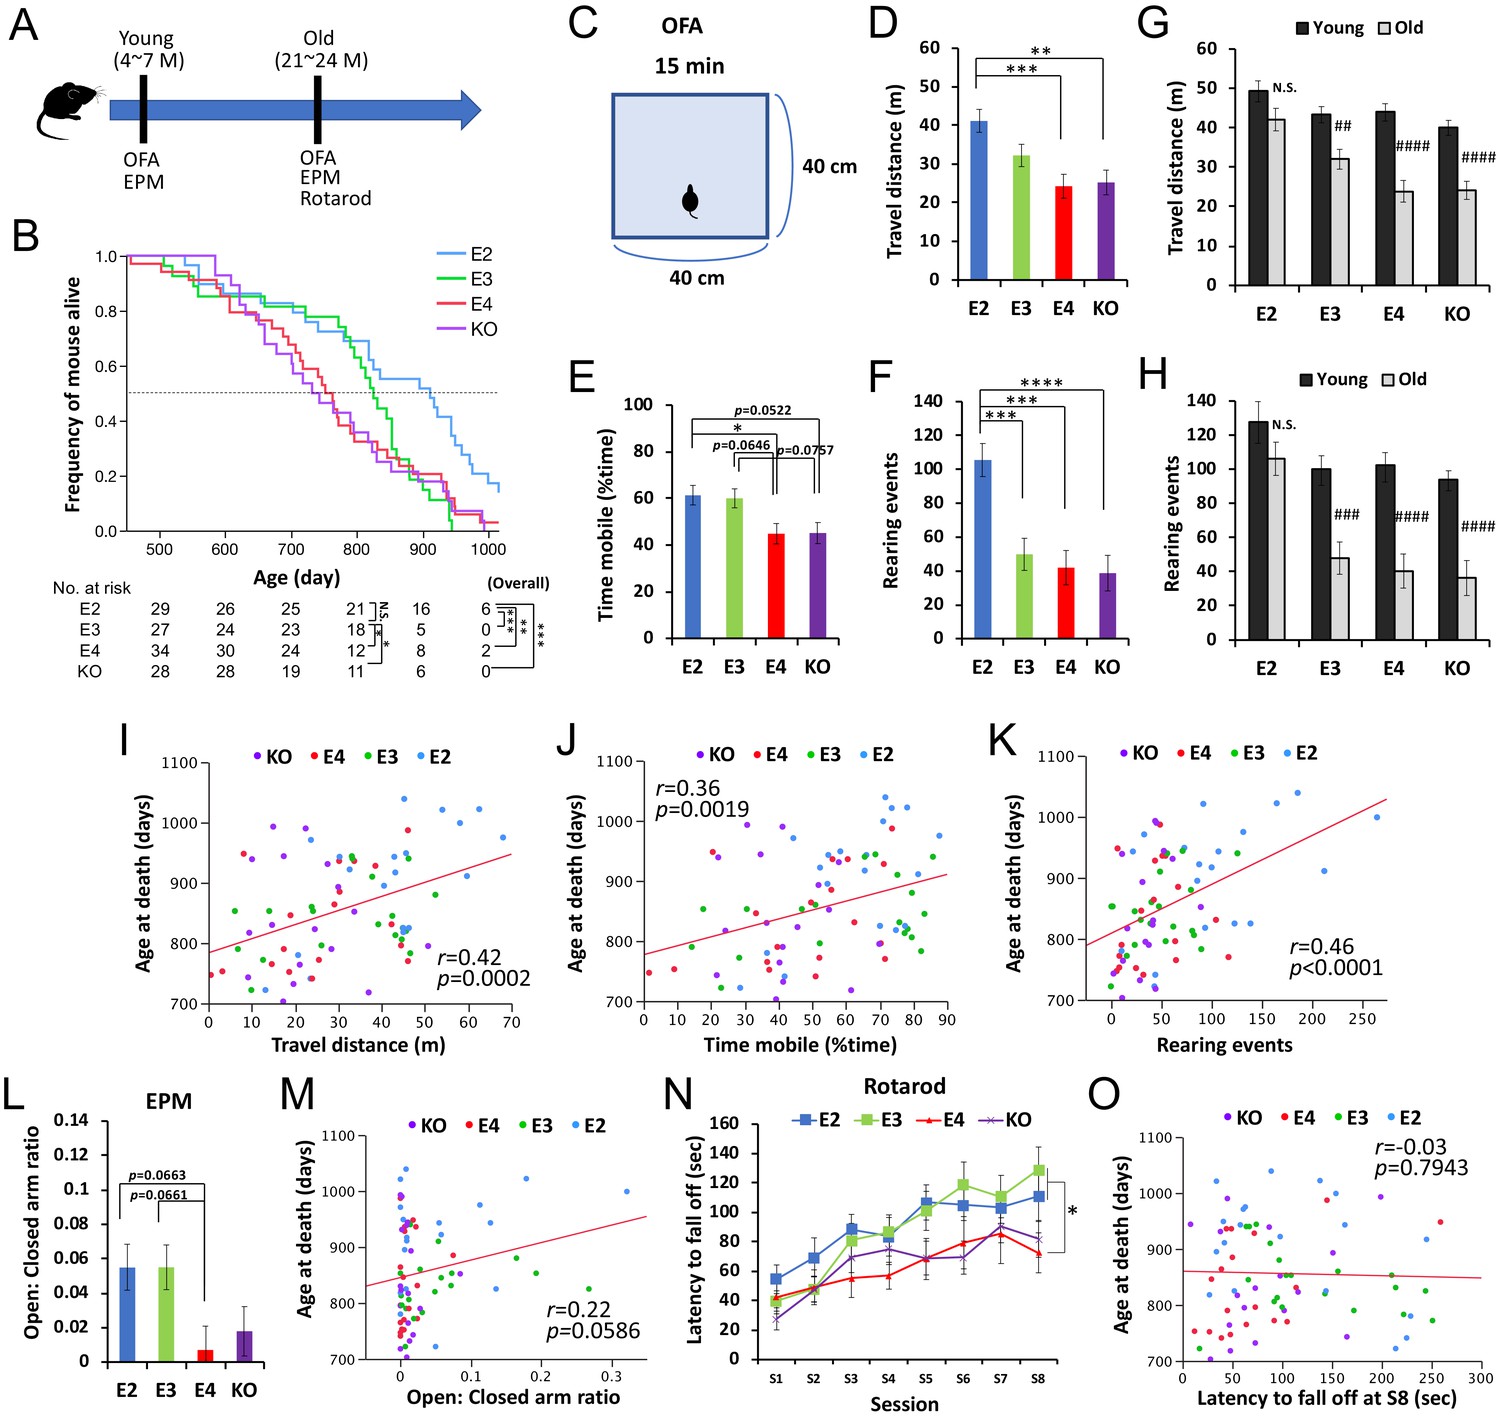
APOE2 benefits lifespan and preserved activity levels in animal models.
(A) The timeline of the survival cohort. The OFA and EPM were performed at both young (4–7 months) and old (21–24 months) ages. Rotarod test was also performed at old age. (B) Kaplan-Meier survival curve of apoE-TR and Apoe-KO mouse models (n = 118), categorized by APOE carrier status with number of mice at risk. *p<0.05, **p<0.01, ***p<0.001 after Bonferroni correction for multiple comparisons; calculated by Cox proportional hazards regression models that were adjusted for sex. Median survival for each group is the point at which the Kaplan-Meier survival curves intersects with the dotted horizontal line. (C) Diagram of OFA. (D–I) Total distance traveled (D and G), percent time spent mobile (E), and number of rearing events (F and H) in the OFA were compared among APOE genotype groups at old age (D–F) or between young and old ages within the same APOE genotype (G and H) after adjusting for sex (n = 17–20 mice/group). (I–J) Total distance traveled (I), percent time spent mobile (J), and number of rearing events (K) in the OFA performed at old age are plotted against the age at death. (L and M) Ratios of time stayed at open arm vs. closed arm measured by EPM test at old age were compared among APOE genotype groups after adjusting for sex (L), and plotted against following age at death (M) (n = 17–20 mice/group). (N and O) Latency to fall off at each session of rotarod test at old age was compared among APOE genotype groups after adjusting for sex (N), and plotted against following age at death (O) (n = 17–20 mice/group). Data are presented as adjusted means ± standard errors of the means. *p<0.05, **p<0.01, ***p<0.001, ****p<0.0001; compared among APOE genotype groups using the Tukey’s HSD test (D-F and L) or repeated-measures one-way ANOVA followed by Tukey-Kramer test (N)., or #p<0.05, ##p<0.01, ###p<0.001, ####p<0.0001; compared with young mice using two-sided Student’s t test (G and H). (I-K, M and O) Correlation coefficients (r) and p-values were calculated using the Pearson correlation test. N.S. = not significant.
-
Figure 2—source data 1
Survival data of apoE-TR and Apoe-KO mouse for Figure 2A as well as Supplementary file 1d.
- https://cdn.elifesciences.org/articles/62199/elife-62199-fig2-data1-v2.xlsx
-
Figure 2—source data 2
Scores in the OFA and EPM and age at death for Figure 2D–F & I–M.
- https://cdn.elifesciences.org/articles/62199/elife-62199-fig2-data2-v2.xlsx
-
Figure 2—source data 3
OFA scores between young and old for Figure 2G&H.
- https://cdn.elifesciences.org/articles/62199/elife-62199-fig2-data3-v2.xlsx
-
Figure 2—source data 4
Rotarod scores and age at death for Figure 2N&O.
- https://cdn.elifesciences.org/articles/62199/elife-62199-fig2-data4-v2.xlsx
Figure 3

APOE2 is associated with preserved activity in clinical cohorts.
(A) Odds ratio with 95% CIs of APOE2 or APOE4 on ‘dropped activities and interests’, ‘total GDS score’, and ‘memory problem’ compared to APOE3, as calculated by logistic regression models that were adjusted for sex, race, and age at the time of the GDS questionnaire. (B) Kaplan–Meier survival curve of subjects with/without ‘dropped activities and interests’; dropped activities and interests were associated with poorer survival (Hazard ratio = 1.20, p=0.010). *p<0.05; calculated by Cox proportional hazards regression analysis adjusting for sex, race, and APOE genotype group.
Figure 4
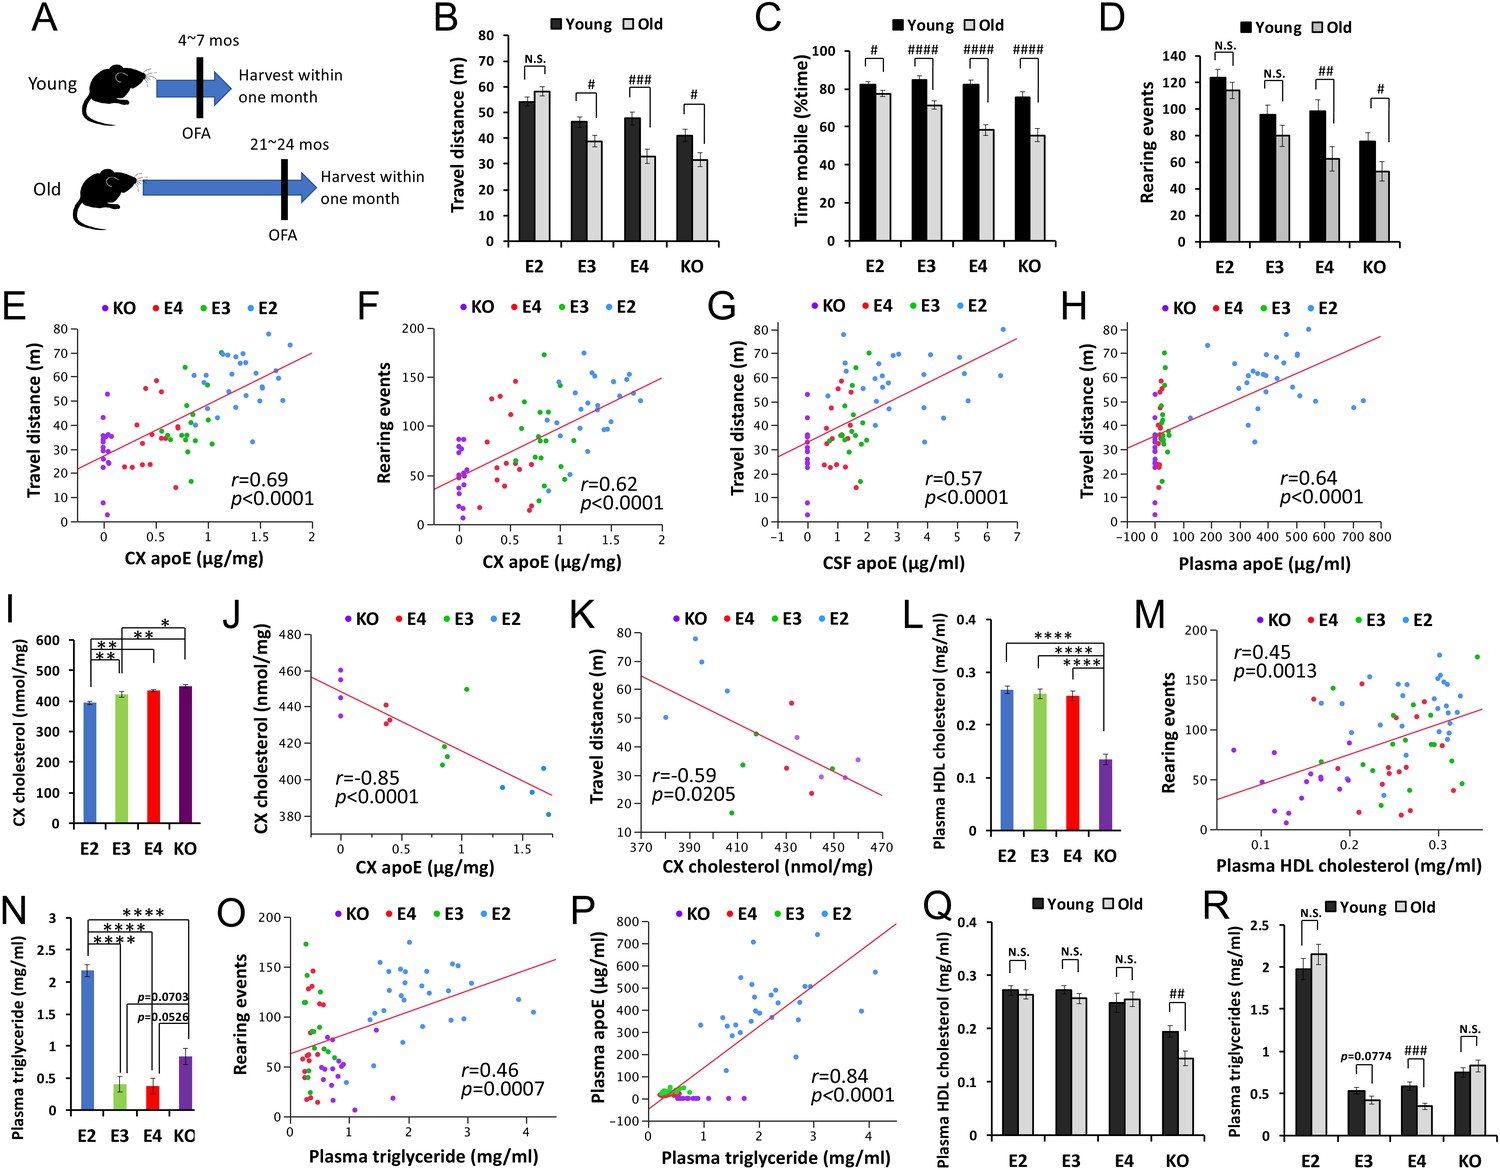
ApoE and lipid levels correlate with activity.
(A) The timeline of biochemically assessed cohort. The OFA was performed within one month before harvest. (B–D) Total distance traveled (B), percent time spent mobile (C), and number of rearing events (D) were compared between young and old mice within the same APOE genotype after adjusting for sex (n = 16–28 mice/group). (E–H) ApoE levels in the brain cortex (CX, E, and F), CSF (G) and plasma (H) are plotted against the total distance traveled (E, G and H), or number of rearing events in the OFA (F). (I) Levels of cholesterol in the brain cortex of old male mice were compared among APOE genotypes (n = 3–4 mice/group) and are plotted against apoE levels in the cortex (J) and total distance traveled in the OFA (K). (L–R) Plasma HDL-cholesterol levels (L and M) or triglyceride levels (N–P) were compared among APOE genotypes in old mice (L and N) or between young and old mice within the same APOE genotype (Q and R) after adjusting for sex and plotted against the number of rearing events in the OFA (M and O) or plasma apoE levels (P) (n = 9–27 mice/group). Data are presented as adjusted means ± standard errors of the means. *p<0.05, **p<0.01, ***p<0.001, ****p<0.0001; compared among APOE genotypes using the Tukey-Kramer test (I), Tukey’s HSD test (L and N), or #p<0.05, ##p<0.01, ###p<0.001, ####p<0.0001; compared between young and old mice using two-sided Student’s t test (B-D, Q, and R). (E-H, J, K, M, O, and P) Correlation coefficients (r) and p-values were calculated using the Pearson correlation test. N.S. = not significant.
-
Figure 4—source data 1
OFA scores between young and old for Figure 4B–D.
- https://cdn.elifesciences.org/articles/62199/elife-62199-fig4-data1-v2.xlsx
-
Figure 4—source data 2
OFA scores and several biochemical measurements for Figure 4E–H and L–P as well as Supplementary file 1f.
- https://cdn.elifesciences.org/articles/62199/elife-62199-fig4-data2-v2.xlsx
-
Figure 4—source data 3
Brain cholesterol and OFA scores for Figure 4I–K.
- https://cdn.elifesciences.org/articles/62199/elife-62199-fig4-data3-v2.xlsx
-
Figure 4—source data 4
Plasma lipids between young and old for Figure 4Q and R.
- https://cdn.elifesciences.org/articles/62199/elife-62199-fig4-data4-v2.xlsx
Tables
Key resources table
| Reagent type (species) or resource | Designation | Source or reference | Identifiers | Additional information |
|---|---|---|---|---|
| Genetic reagent (Mus. musculus) | Apoetm1(APOE*2)Mae or apoE2-TR | Sullivan et al., 1998 | RRID:MGI:3695702 | |
| Genetic reagent (Mus. musculus) | Apoetm2(APOE*3)Maeor apoE3-TR | Sullivan et al., 1997 | RRID:MGI:3695698 | |
| Genetic reagent (Mus. musculus) | Apoetm3(APOE*4)Maeor apoE4-TR | Knouff et al., 1999 | RRID:MGI:4355228 | |
| Genetic reagent (Mus. musculus) | Apoetm1Unc or Apoe-KO | Piedrahita et al., 1992 | RRID:MGI:4358709 | |
| Antibody | Goat polyclonal anti-ApoE-biotin | Meridian Life Science | Cat#: K74180B | ELISA detection (1:4000) |
| Antibody | Goat polyclonal anti-Apolipoprotein E Antibody | Millipore | Cat#: AB947 | ELISA capture (1:4000) |
| Peptide, recombinant protein | ApoE3 | Fitzgerald | Cat#: 30 R-2381 | ELISA standard |
| Commercial assay or kit | Cholesterol E | Wako | Cat. #: 999–02601 | |
| Commercial assay or kit | L-Type Triglyceride M | Wako | Cat. #: 994–02891 | |
| Commercial assay or kit | HDL-Cholesterol E | Wako | Cat. #: 997–01301 | |
| Software, algorithm | SAS | SAS Institute, Inc | version 9.4 | |
| Software, algorithm | R Statistical Software | R Foundation for Statistical Computing | version 3.2.3 | |
| Software, algorithm | JMP Pro | SAS Institute, Inc | version 12 | |
| Software, algorithm | AnyMaze software | Stoelting Co | Animal behavior test |
Additional files
-
Supplementary file 1
Supplementary information of additional analyses etc.
(a) Subject characteristics in the overall NACC cohort. The sample median (minimum, maximum) is given for continuous variables. Information was unavailable regarding hypertension (N = 28), transient ischemic attack (N = 116), pacemaker (N = 260), angioplasty/endarterectomy/stent (N = 19), heart attack/cardiac arrest (N = 42), cardiac bypass procedure (N = 9), atrial fibrillation (N = 48), hypercholesterolemia (N = 102), congestive heart failure (N = 25), and stroke (N = 45). (b) Subject characteristics for individuals in the NACC cohort with a neuropathological assessment. The sample median (minimum, maximum) is given for continuous variables. Information was unavailable regarding hypertension (N = 3), transient ischemic attack (N = 24), pacemaker (N = 1), heart attack/cardiac arrest (N = 4), atrial fibrillation (N = 3), hypercholesterolemia (N = 17), congestive heart failure (N = 4), stroke (N = 7),. density of neocortical neuritic plaques CERAD score (N = 12), density of diffuse plaques CERAD score (N = 328), Braak NFT stage (N = 55), presence of vascular pathology (N = 51), and minimal amyloid pathology. (c) Association between APOE genotype and survival using the NACC data. HR = hazard ratio; CI = confidence interval; AD = Alzheimer’s disease; CV = cardiovascular. HRs, 95% CIs, and p-values result from Cox proportional hazards regression models. 1 These analyses were only performed when considering all subjects. 2 Cognitive status at final visit and AD at final visit were adjusted for only in the model involving all subjects. 3 CV factors included hypertension, transient ischemic attack, pacemaker, angioplasty/endarterectomy/stent, heart attack/cardiac arrest, atrial fibrillation, hypercholesterolemia, congestive heart failure, and stroke. 4 For the neuropathological assessment cohort, all models were additionally adjusted for CERAD diffuse plaque score, CERAD neuritic plaque score, Braak NFT stage, and the presence of vascular pathology. p-values<0.025 are considered as statistically significant after applying a Bonferroni correction for multiple testing for the two primary comparisons of survival that were made (i.e. between APOE3 and APOE4 subjects, and between APOE3 and APOE2 subjects). (d) Summary of mouse cohorts. For continuous data, values are means ± SD [range]. P-values were calculated using one-way ANOVA (continuous data), the Pearson’s chi-square test (categorical value) or log-rank test (median age at death). (e) Effects of APOE on ‘Dropped activities and interests’ and other GDS items in cognitively normal subjects over 60 years old. ORs, 95% CIs, and p-values result from binary logistic regression models for analysis of individual GDS items, and from proportional odds logistic regression models for analysis of the ordinal total GDS score, which is described as the mean (25th percentile, 75th percentile). Information was unavailable for GDS items for a maximum of 23 subjects. (f) Associations between activity levels in the OFA and protein/lipid levels across APOE genotype groups at old age. Correlation coefficients (r) and p-values were calculated using the Pearson correlation test. P-values were corrected by Bonferroni test adjusted for the number of protein/lipids analyzed in the entire cohort. CX = cortical, HP = hippocampal. (g) List of NACC contributors.
- https://cdn.elifesciences.org/articles/62199/elife-62199-supp1-v2.docx
-
Transparent reporting form
- https://cdn.elifesciences.org/articles/62199/elife-62199-transrepform-v2.docx
Download links
A two-part list of links to download the article, or parts of the article, in various formats.
Downloads (link to download the article as PDF)
Open citations (links to open the citations from this article in various online reference manager services)
Cite this article (links to download the citations from this article in formats compatible with various reference manager tools)
APOE2 is associated with longevity independent of Alzheimer’s disease
eLife 9:e62199.
https://doi.org/10.7554/eLife.62199


