Biological constraints on GWAS SNPs at suggestive significance thresholds reveal additional BMI loci
- Center for Spatial and Functional Genomics, Children’s Hospital of Philadelphia, United States
- Division of Human Genetics, The Children’s Hospital of Philadelphia, United States
- Naomi Berrie Diabetes Center, Vagelos College of Physicians and Surgeons, Columbia University, United States
- Department of Pathology and Cell Biology, Vagelos College of Physicians and Surgeons, Columbia University, United States
- Columbia Stem Cell Initiative, Vagelos College of Physicians and Surgeons, Columbia University, United States
- Department of Orthopaedic Surgery, University of Michigan Medical School, United States
- Division of Molecular Genetics (Pediatrics) and the Naomi Berrie Diabetes Center, Columbia University Vagelos College of Physicians and Surgeons, United States
- Department of Pathology, The Children’s Hospital of Philadelphia, United States
- Department of Pathology and Laboratory Medicine, Perelman School of Medicine, University of Pennsylvania, United States
- University of Pennsylvania, United States
- The Children’s Hospital of Philadelphia, United States
Figures
Figure 1
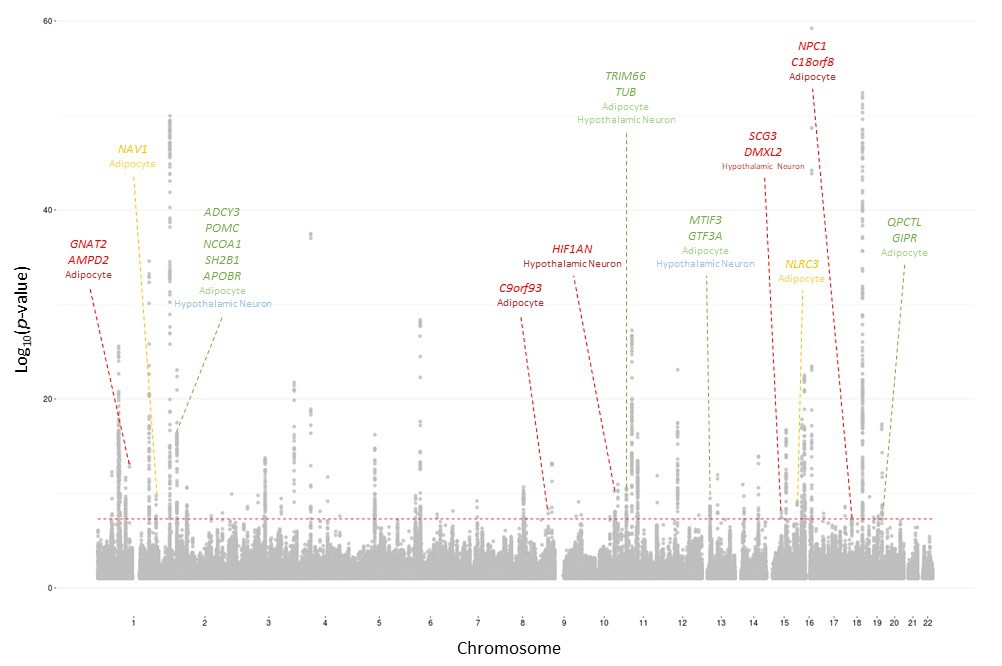
2015 BMI Manhattan plot depicting loci identified with 2010 salvaged SNPs 2015 BMI loci identifiable with 2010 salvaged SNPs.
Cell type where locus was identified indicated below locus name. Color indicates the p-value threshold where the locus became implicated (Locke et al., 2015). Color key: Green – 5×10⁻⁸≤p<5×10⁻⁷, blue – 5×10⁻⁷≤p<5×10⁻⁶, orange – 5×10⁻⁶≤p<5×10⁻⁵, red – 5×10⁻⁵≤p<5×10⁻⁴.
Figure 2
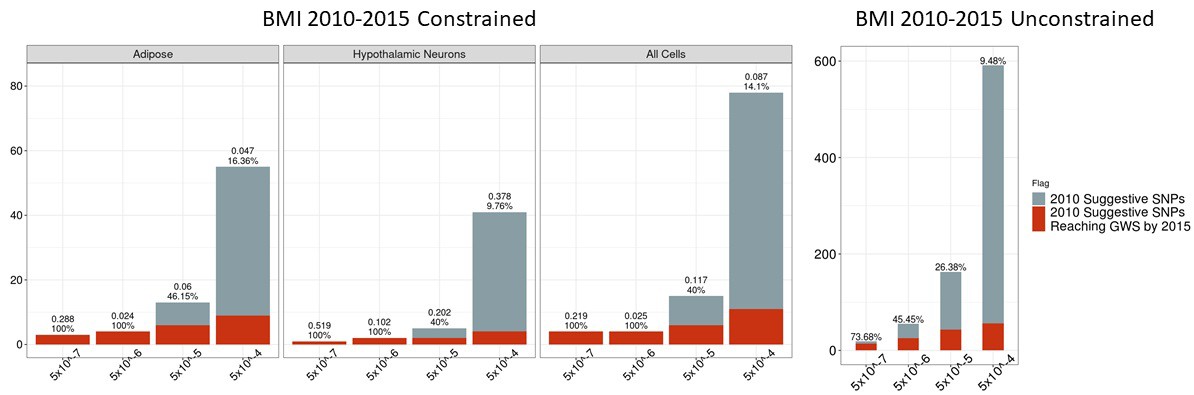
Independent 2010 BMI SNPs identified via variant-to-gene mapping that go on to reach genome-wide significance by 2015, as well as the set of unconstrained 2010 suggestive SNPs that achieve genome-wide significance by 2015.
Positive predictive value is depicted as a percentage for each bar. Above these percentages, the p-value, as identified through Fisher’s exact test, is posted. These p-values depict the probability that the proportions of salvaged SNPs using variant-to-gene mapping differ from simply salvaging all suggestive SNPs within the same suggestive bin.
-
Figure 2—source data 1
Number of 2010 loci identified by constrained method and the number that achieved GWS by 2015 in each cell type.
- https://cdn.elifesciences.org/articles/62206/elife-62206-fig2-data1-v2.csv
-
Figure 2—source data 2
Number of 2010 loci identified with no constraint and the number that achieved GWS by 2015.
- https://cdn.elifesciences.org/articles/62206/elife-62206-fig2-data2-v2.csv
Figure 3
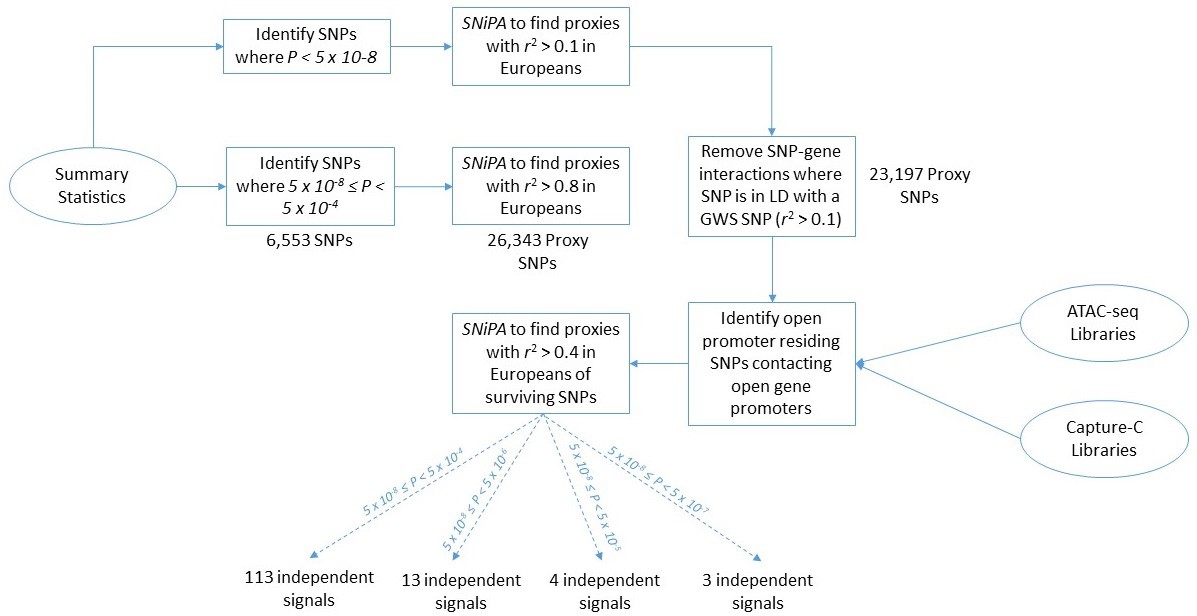
Flowchart of the pipeline describing each computational step.
BMI 2010–2015 data is utilized here as an example to report the number of SNPs and loci that occur at each step of the analysis.
Figure 4 with 1 supplement
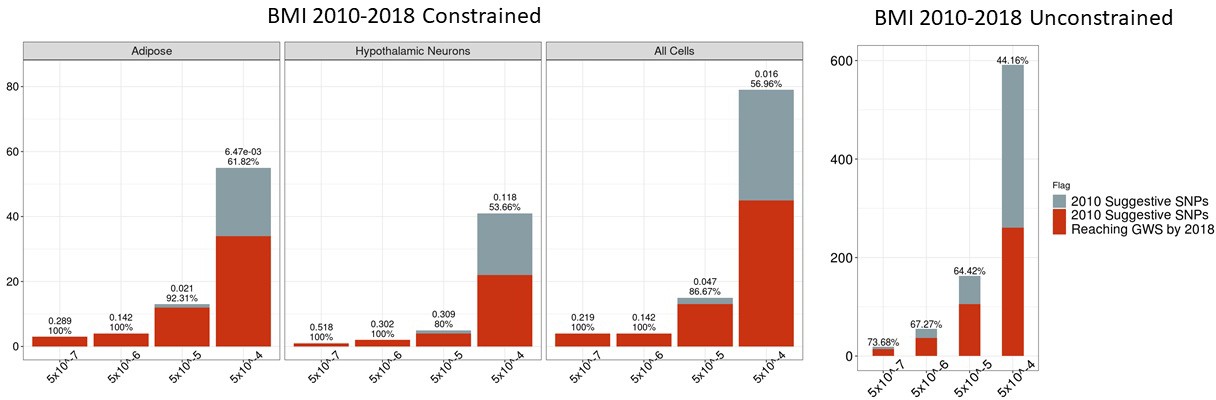
Independent 2010.
BMI SNPs salvaged via variant-to-gene mapping that go on to reach genome-wide significance by 2018, as well as the set of unconstrained 2010 suggestive SNPs that achieve genome-wide significance by 2018. Positive predictive value is depicted for each bar. Above these percentages, the p-value, as identified through Fisher’s exact test, is posted. These p-values depict the probability that the proportions of salvaged SNPs using variant-to-gene mapping differ from simply salvaging all suggestive SNPs within the same suggestive bin.
-
Figure 4—source data 1
Number of 2010 loci identified by constrained method and the number that achieved GWS by 2018 in each cell type.
- https://cdn.elifesciences.org/articles/62206/elife-62206-fig4-data1-v2.csv
-
Figure 4—source data 2
Number of 2010 loci identified with no constraint and the number that achieved GWS by 2018.
- https://cdn.elifesciences.org/articles/62206/elife-62206-fig4-data2-v2.csv
Figure 4—figure supplement 1
Empirical distribution of positive predictive values of suggestive 2010 BMI SNPs achieving GWS by 2018.
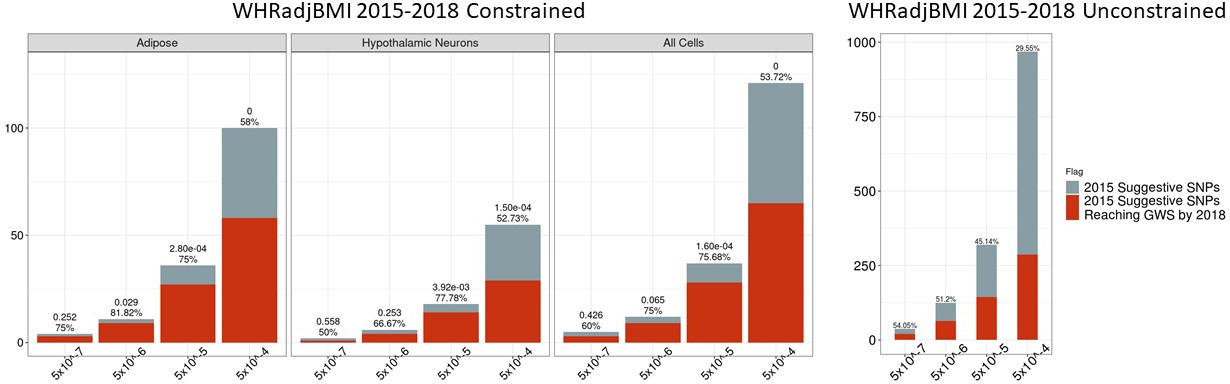
Figure 5

Independent 2015.
BMI SNPs salvaged via variant-to-gene mapping that go on to reach genome-wide significance by 2018, as well as the set of unconstrained 2015 suggestive SNPs that achieve genome-wide significance by 2018. Positive predictive value is depicted for each bar. The posterior probability that loci identified by our chromatin-based constraint more often achieve GWS than loci with no constraint is posted above these percentages.
-
Figure 5—source data 1
Number of 2015 loci identified by constrained method and the number that achieved GWS by 2018 in each cell type.
- https://cdn.elifesciences.org/articles/62206/elife-62206-fig5-data1-v2.csv
-
Figure 5—source data 2
Number of 2015 loci identified with no constraint and the number that achieved GWS by 2018.
- https://cdn.elifesciences.org/articles/62206/elife-62206-fig5-data2-v2.csv
Figure 6 with 3 supplements
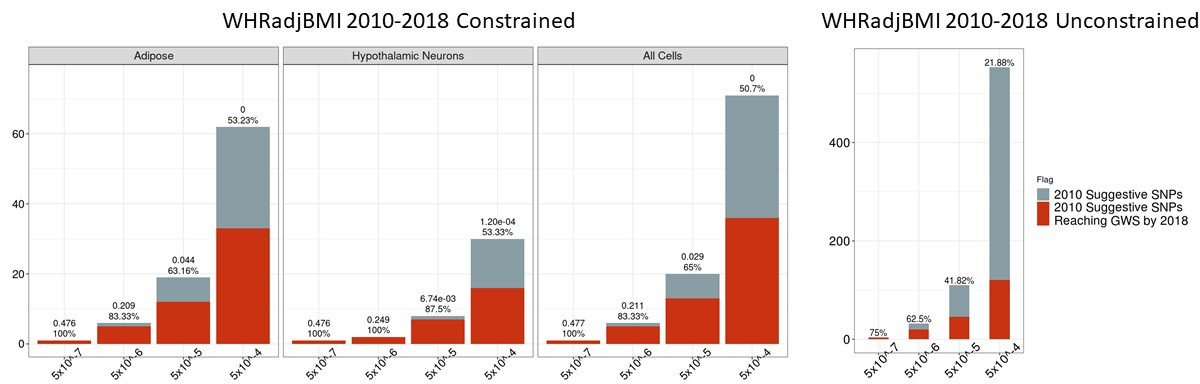
Independent 2010.
WHRadjBMI SNPs salvaged via variant-to-gene mapping that go on to reach genome-wide significance by 2018, as well as the set of unconstrained 2010 suggestive SNPs that achieve genome-wide significance by 2018. Positive predictive value is depicted for each bar. Above these percentages, the p-value, as identified through Fisher’s exact test, is posted. These p-values depict the probability that the proportions of salvaged SNPs using variant-to-gene mapping differ from simply salvaging all suggestive SNPs within the same suggestive bin.
-
Figure 6—source data 1
Number of 2010 loci identified by constrained method and the number that achieved GWS by 2018 in each cell type.
- https://cdn.elifesciences.org/articles/62206/elife-62206-fig6-data1-v2.csv
-
Figure 6—source data 2
Number of 2010 loci identified with no constraint and the number that achieved GWS by 2018.
- https://cdn.elifesciences.org/articles/62206/elife-62206-fig6-data2-v2.csv
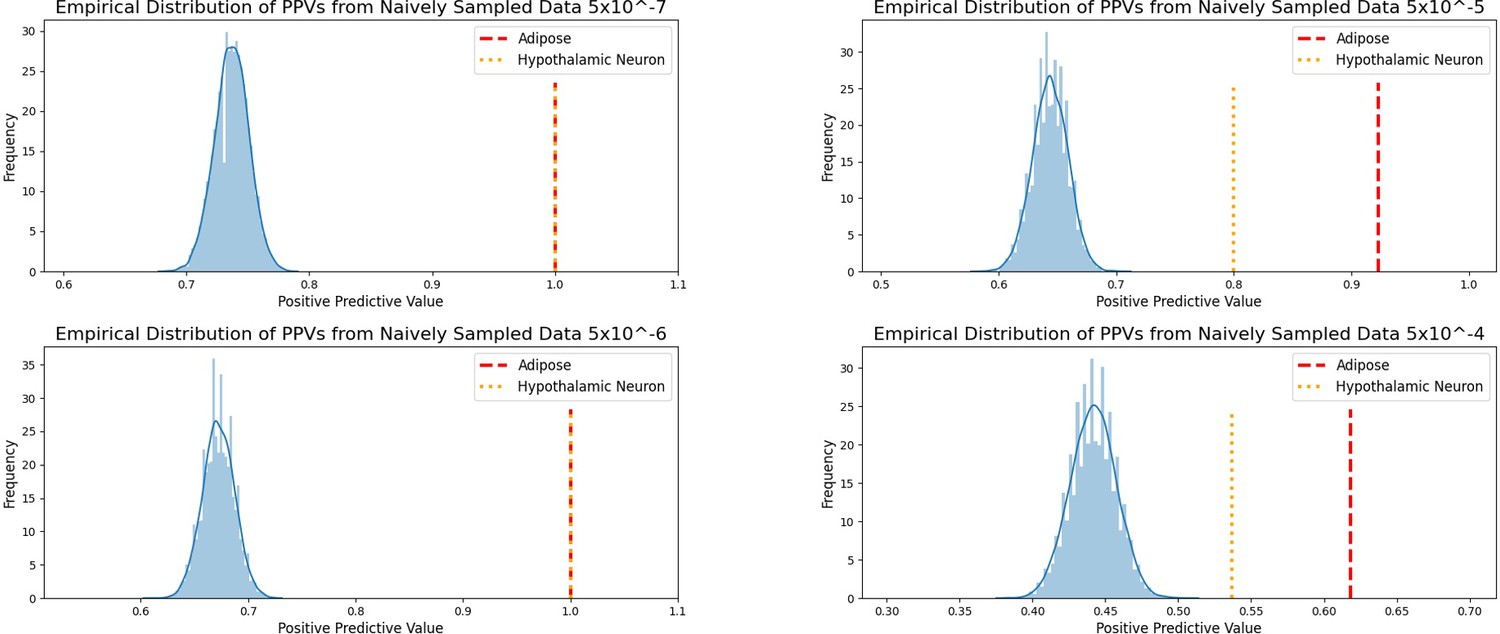
Figure 6—figure supplement 1
Empirical distribution of positive predictive values of suggestive 2010 WHRadjBMI SNPs achieving GWS by 2018.
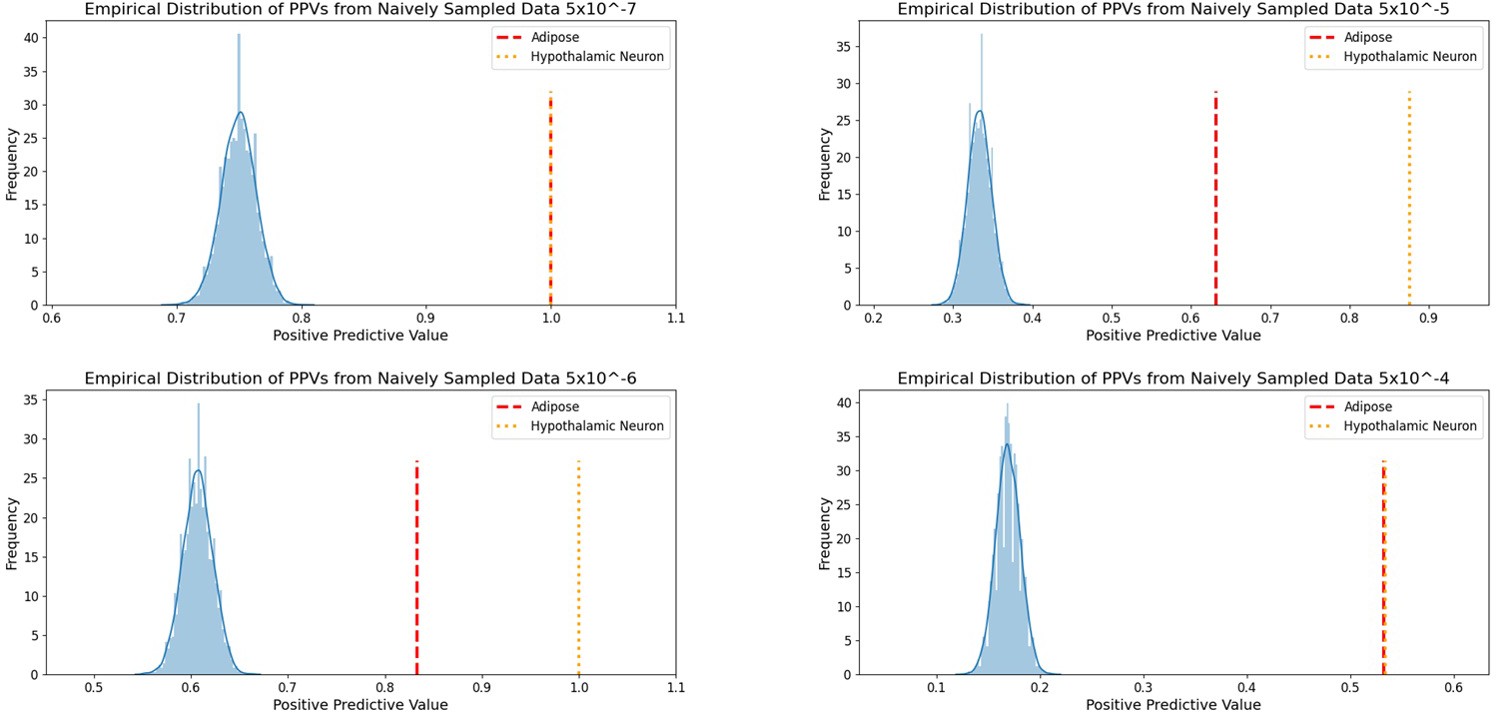
Figure 6—figure supplement 2
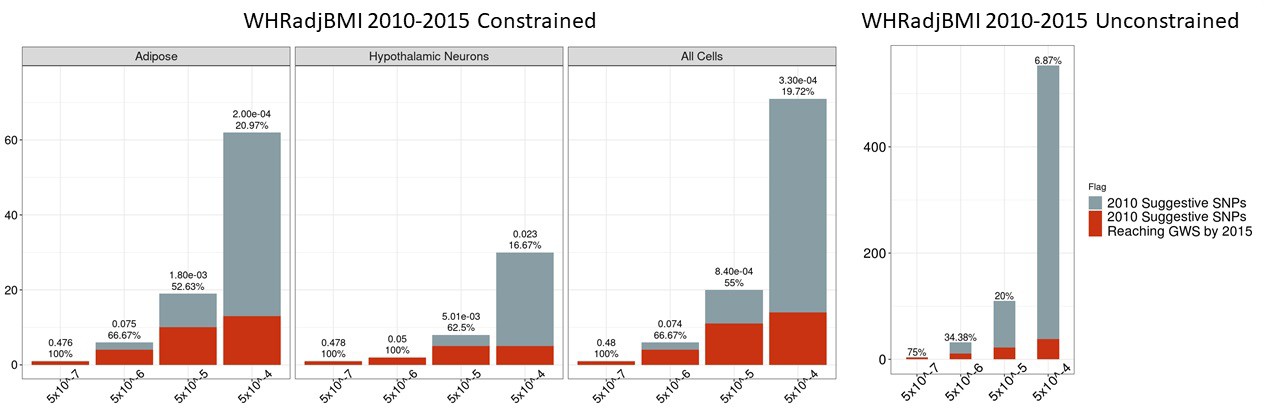
Independent 2010.
WHRadjBMI SNPs salvaged via variant-to-gene mapping that go on to reach genome-wide significance by 2015, as well as the set of unconstrained 2010 suggestive SNPs that achieve genome-wide significance by 2015. Positive predictive value is depicted for each bar. The posterior probability that loci identified by our chromatin-based constraint more often achieve GWS than loci with no constraint is posted above these percentages.
-
Figure 6—figure supplement 2—source data 1
Number of 2010 loci identified by constrained method and the number that achieved GWS by 2015 in each cell type.
- https://cdn.elifesciences.org/articles/62206/elife-62206-fig6-figsupp2-data1-v2.csv
-
Figure 6—figure supplement 2—source data 2
Number of 2010 loci identified with no constraint and the number that achieved GWS by 2015.
- https://cdn.elifesciences.org/articles/62206/elife-62206-fig6-figsupp2-data2-v2.csv
Figure 6—figure supplement 3
Independent 2015.
WHRadjBMI SNPs salvaged via variant-to-gene mapping that go on to reach genome-wide significance by 2018, as well as the set of unconstrained 2015 suggestive SNPs that achieve genome-wide significance by 2018. Positive predictive value is depicted for each bar. The posterior probability that loci identified by our chromatin-based constraint more often achieve GWS than loci with no constraint is posted above these percentages.
-
Figure 6—figure supplement 3—source data 1
Number of 2015 loci identified by constrained method and the number that achieved GWS by 2018 in each cell type.
- https://cdn.elifesciences.org/articles/62206/elife-62206-fig6-figsupp3-data1-v2.csv
-
Figure 6—figure supplement 3—source data 2
Number of 2015 loci identified with no constraint and the number that achieved GWS by 2018.
- https://cdn.elifesciences.org/articles/62206/elife-62206-fig6-figsupp3-data2-v2.csv
Figure 7
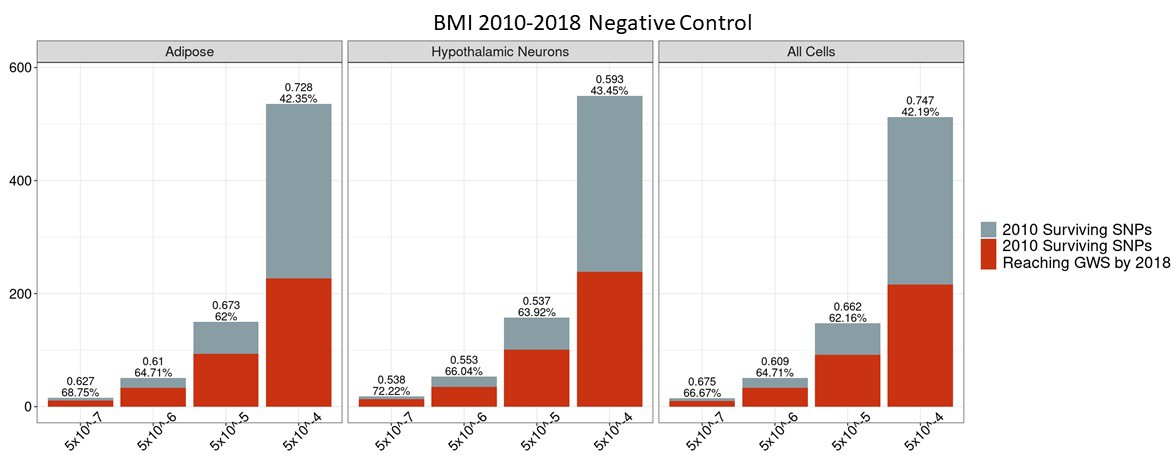
Independent 2010.
BMI SNPs failing the variant-to-gene mapping filter that go on to reach genome-wide significance by 2018. Positive predictive value is depicted for each bar. The posterior probability that loci identified by our chromatin-based constraint more often achieve GWS than loci with no constraint is posted above these percentages. There is no threshold where this data differs significantly from the unconstrained set.
-
Figure 7—source data 1
Number of 2010 loci identified by constrained method and the number that achieved GWS by 2018 in each cell type.
- https://cdn.elifesciences.org/articles/62206/elife-62206-fig7-data1-v2.csv
Figure 8

Independent 2010.
WHRadjBMI SNPs failing the variant-to-gene mapping filter that go on to reach genome-wide significance by 2018. Positive predictive value is depicted for each bar. The posterior probability that loci identified by our chromatin-based constraint more often achieve GWS than loci with no constraint is posted above these percentages. There is no threshold where this data differs significantly from the unconstrained set.
-
Figure 8—source data 1
Number of 2010 loci identified by constrained method and the number that achieved GWS by 2018 in each cell type.
- https://cdn.elifesciences.org/articles/62206/elife-62206-fig8-data1-v2.csv
Tables
Table 1
2015 BMI loci that were implicated with our method in the 2010 data set.
The 2015 genome-wide significant BMI loci whose sentinel SNP was in LD with SNPs implicated from suggestive association in the 2010 BMI GWAS. Key: Notable genes from biological relevance to obesity (B); copy number variation (C); DEPICT analyses (D); GRAIL results (G); BMI-associated variant is in strong LD (r2 ≥ 0.8) with a missense variant in the indicated gene (M); gene nearest to index SNP (N); association and eQTL data converge to affect gene expression (Q) (Locke et al., 2015).
| Novel as of 2015 (Locke et al.) | ||||
|---|---|---|---|---|
| 2015 sentinel SNP | 2010 implicated SNPs | 2015 assigned locus name | Interacting gene | |
| rs4740619 | rs10810462 | C9orf93(C,M,N) | TCONS_00015651 | |
| rs17094222 | rs117597828 | HIF1AN(N) | PAX2 | |
| rs2820292 | rs12086240, rs2820315 | NAV1(N) | TIMM17A | |
| rs758747 | rs2238435 | NLRC3(N) | TCONS_00024950, TCONS_00024564, TCONS_00024949, TCONS_00024562, RP11-462G12.1, TCONS_00024568, TCONS_00024570, RP11-95P2.1, TCONS_00024567, TCONS_00024569, TCONS_00024320, TCONS_00024952 | |
| rs3736485 | rs7183479 | SCG3(B,D); DMXL2(M,N) | LYSMD2, SCG3, CTD-2308G16.1, TMOD2 | |
| Identified between 2010 (Speliotes et al.) and 2015 (Locke et al.) | ||||
| 2015 Sentinel SNP | 2010 Implicated SNPs | 2015 Assigned locus name | Interacting gene | |
| rs17024393 | rs72705210 | GNAT2(N); AMPD2(D) | GSTM3, AHCYL1 | |
| rs4256980 | rs10840079, rs10840087, rs11041999, rs11042023, rs12803166, rs4256980, | TRIM66(D,M,N); TUB(B) | PBLD, RPL27A, TRIM66 | |
| Identified in 2010 (Speliotes et al.), but was not genome-wide significant | ||||
| 2015 Sentinel SNP | 2010 Implicated SNPs | 2015 Assigned Locus Name | Interacting gene | |
| rs10182181 | rs12713419, rs13012304, rs6718510, rs7597332, rs7608976 | ADCY3(B,M,N,Q); POMC(B,G); NCOA1(B); SH2B1(B,M,Q); APOBR(M,Q); | ADCY3, TCONS_00003602 | |
| rs12016871 | rs7988412, | MTIF3(N); GTF3A(Q) *~1 Mb from sentinel | MTIF3 | |
| rs1808579 | rs1788783 | NPC1(B,G,M,Q); C18orf8(N,Q) | NPC1 | |
| rs2287019 | rs11672660, rs34783010 | QPCTL(N); GIPR(B,M) | GIPR | |
Table 2
2018 BMI loci that were identified using 2010 salvaged.
SNPs 2018 BMI loci identified as genes nearest to genome-wide significant SNPs that could be identified using SNPs salvaged from suggestive regions of the 2010 BMI GWAS.
| Nearest gene to sentinel | Surviving proxy SNPs | Lowest threshold found |
|---|---|---|
| ABHD17A | rs893543, rs893542, rs11671347 | 5 × 10⁻⁴ |
| AC007879.5 | rs11677847, rs72951700, rs11689163, rs72966483, rs11694560, rs11692026, rs964621, rs964622 | 5 × 10⁻⁴ |
| ADCY3 | rs6718510, rs7597332, rs7608976, rs13012304, rs12713419 | 5 × 10⁻⁴ |
| ADCY9 | rs710893, rs2531993, rs2238435 | 5 × 10⁻⁵ |
| AK5 | rs12729914 | 5 × 10⁻⁵ |
| AP000439.5 | rs11605729 | 5 × 10⁻⁴ |
| BCL7A | rs7299842 | 5 × 10⁻⁴ |
| C10orf32 | rs7085104 | 5 × 10⁻⁴ |
| C18orf8 | rs1788826 | 5 × 10⁻⁴ |
| C1orf61 | rs11264483 | 5 × 10⁻⁴ |
| CCDC171 | rs10810462 | 5 × 10⁻⁴ |
| CNNM2 | rs1926032 | 5 × 10⁻⁴ |
| COQ4 | rs1468648 | 5 × 10⁻⁴ |
| CRTC1 | rs4808845, rs4808844 | 5 × 10⁻⁴ |
| DPYD | rs12077442 | 5 × 10⁻⁴ |
| EIF2B5 | rs3914188, rs35637422 | 5 × 10⁻⁴ |
| EXOSC10 | rs1884429, rs12041740 | 5 × 10⁻⁴ |
| FAIM2 | rs422022 | 5 × 10⁻⁴ |
| GAB2 | rs869202 | 5 × 10⁻⁴ |
| GIPR | rs34783010, rs11672660 | 5 × 10⁻⁷ |
| GPR61 | rs72705210 | 5 × 10⁻⁴ |
| HIF1AN | rs117597828 | 5 × 10⁻⁴ |
| HOXB1 | rs2326013 | 5 × 10⁻⁴ |
| IFNGR1 | rs17258750 | 5 × 10⁻⁴ |
| IPO9 | rs2820315 | 5 × 10⁻⁵ |
| KCNJ12 | rs9906072 | 5 × 10⁻⁴ |
| LMOD1 | rs2047264 | 5 × 10⁻⁴ |
| MAP2K3 | rs2001651, rs3785542 | 5 × 10⁻⁴ |
| MAP3K7CL | rs928277 | 5 × 10⁻⁴ |
| MEF2D | rs2274319, rs1925950, rs12038396, rs3818463, rs2274320, rs2274317 | 5 × 10⁻⁴ |
| MLN | rs11752353, rs6921487, rs72880511, rs1887340, rs73746509 | 5 × 10⁻⁴ |
| MLXIP | rs28530689, rs10773037, rs28737311, rs36158849, rs2280573 | 5 × 10⁻⁴ |
| MST1R | rs3774758, rs2252833, rs6446187 | 5 × 10^−4 |
| MTIF3 | rs7988412 | 5 × 10⁻⁷ |
| MTOR | rs11581010, rs10864490 | 5 × 10⁻⁴ |
| NAV1 | rs12086240 | 5 × 10⁻⁵ |
| NPC1 | rs1788783 | 5 × 10⁻⁴ |
| RASA2 | rs2042864 | 5 × 10⁻⁴ |
| RCAN2 | rs3934393 | 5 × 10⁻⁵ |
| RNU6-543P | rs10761689 | 5 × 10⁻⁴ |
| RP11-493K19.3 | rs13100903 | 5 × 10⁻⁴ |
| RP11-562L8.1 | rs12887636 | 5 × 10⁻⁵ |
| RP11-68I18.10 | rs10788800 | 5 × 10⁻⁵ |
| RP11-707P17.1 | rs7183479 | 5 × 10⁻⁴ |
| SAE1 | rs466477 | 5 × 10⁻⁴ |
| SKAP1 | rs16951519, rs2240121 | 5 × 10⁻⁵ |
| STK33 | rs10840087, rs11041999, rs34009921 | 5 × 10⁻⁴ |
| TNRC6B | rs6001834, rs4820409 | 5 × 10⁻⁴ |
| TRIM66 | rs10840079, rs4256980, rs11042023, rs12803166 | 5 × 10⁻⁶ |
| TTC34 | rs6424062 | 5 × 10⁻⁵ |
| URM1 | rs7859557, rs2240948 | 5 × 10⁻⁴ |
| XXYLT1 | rs58434965 | 5 × 10⁻⁴ |
Additional files
-
Source data 1
Classification metrics for each condition.
- https://cdn.elifesciences.org/articles/62206/elife-62206-data1-v2.zip
-
Transparent reporting form
- https://cdn.elifesciences.org/articles/62206/elife-62206-transrepform-v2.docx
Download links
A two-part list of links to download the article, or parts of the article, in various formats.
Downloads (link to download the article as PDF)
Open citations (links to open the citations from this article in various online reference manager services)
Cite this article (links to download the citations from this article in formats compatible with various reference manager tools)
Biological constraints on GWAS SNPs at suggestive significance thresholds reveal additional BMI loci
eLife 10:e62206.
https://doi.org/10.7554/eLife.62206


