Failures of nerve regeneration caused by aging or chronic denervation are rescued by restoring Schwann cell c-Jun
- Department of Cell and Developmental Biology, University College London, United Kingdom
- Instituto de Neurociencias de Alicante, Universidad Miguel Hernández‐CSIC, Spain
- University College London Great Ormond Street Institute of Child Health, United Kingdom
- Centre for Regenerative Medicine, Institute for Regeneration and Repair, University of Edinburgh, United Kingdom
- Department of Comparative Biosciences, School of Veterinary Medicine, University of Wisconsin‐Madison, United States
- Division of Plastic and Reconstructive Surgery, The Hospital for Sick Children, Canada
- John Van Geest Centre for Brain repair, Department of Clinical Neurosciences, University of Cambridge, United Kingdom
- Hospital General Universitario de Alicante, ISABIAL, Spain
Figures
Figure 1 with 1 supplement
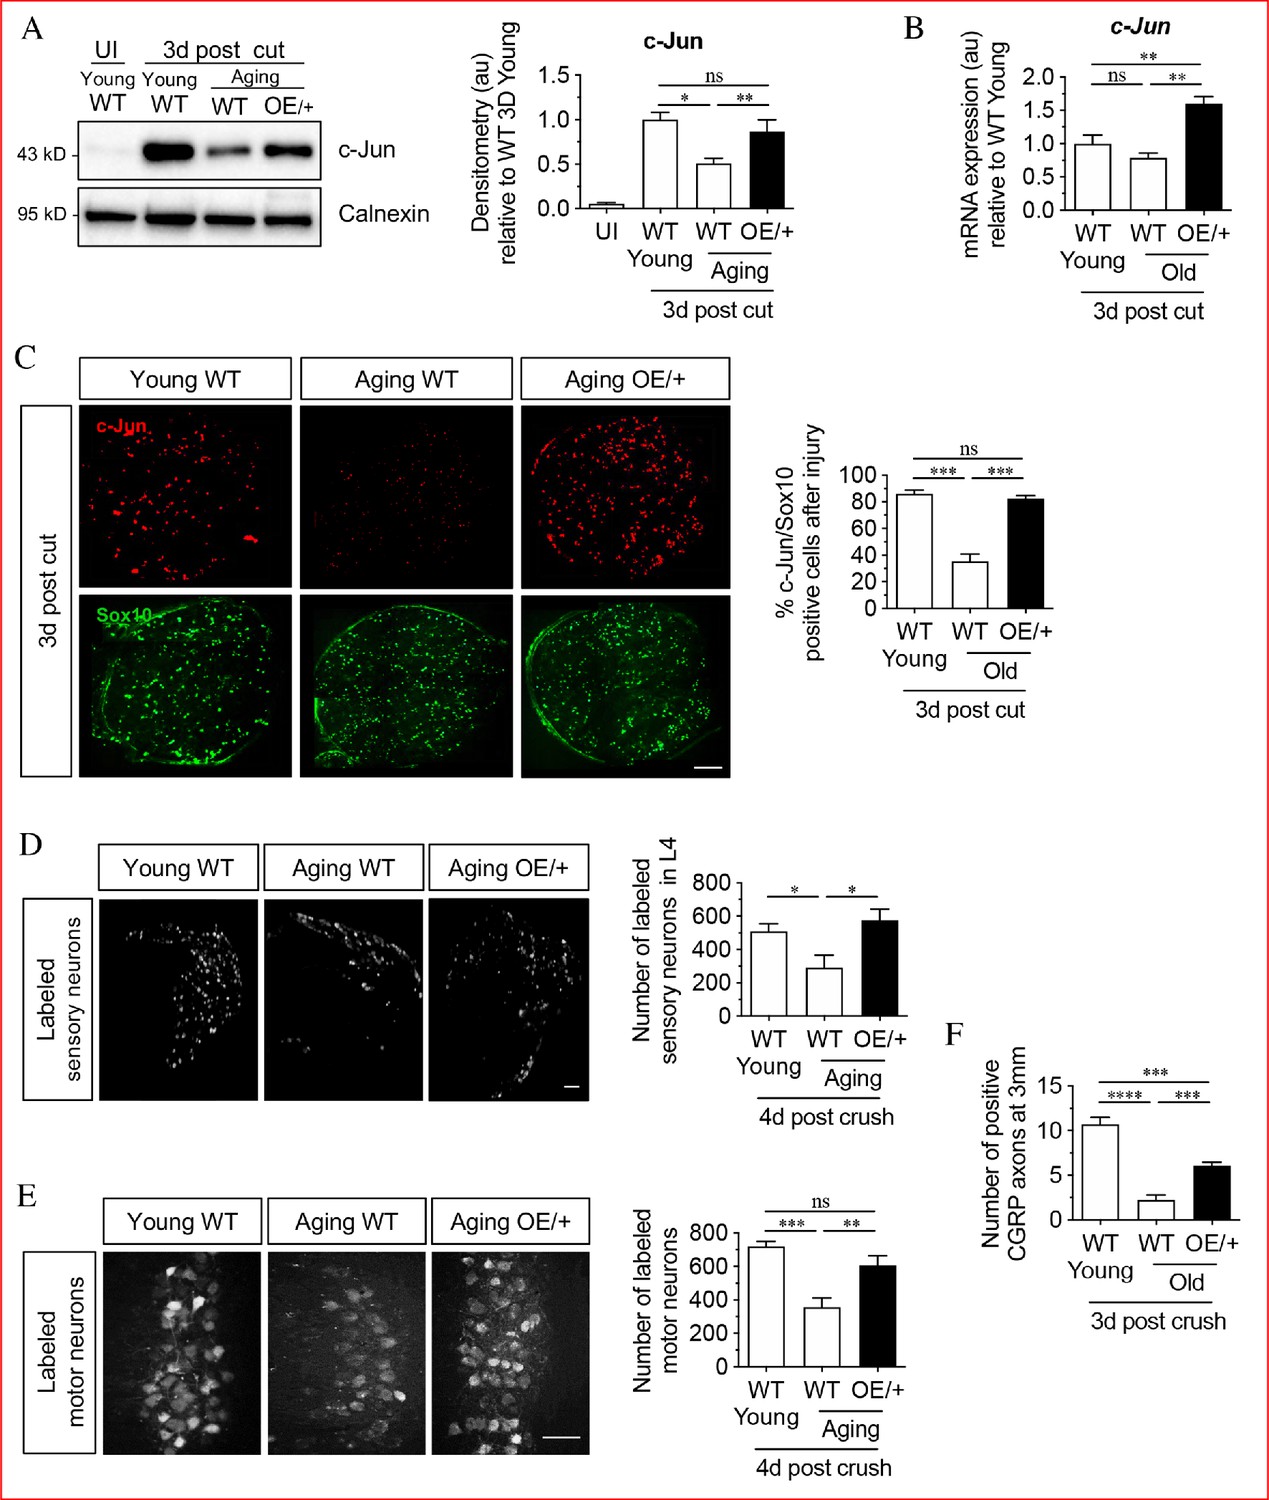
Restoring Schwann cell c-Jun protein reverses the age-related decline in nerve regeneration.
(A) Representative western blots of c-Jun in young and aging WT nerves and aging c-Jun OE/+ nerves 3 days post-injury. The graph shows densitometric quantitation of the western blots. c-Jun upregulation is impaired in WT aged nerves but restored in aged c-Jun OE/+ nerves. Data are normalized to young WT 3 days post-cut; *p<0.05, **p<0.005, ns, non-significant. Young UI WT n = 6, n = 5 for all other experimental groups. (B) RTqPCR analysis of 3-day cut nerves. Data normalized to young WT 3 days post-cut.; **p<0.005, ns, non-significant, n = 4. (C) Representative images showing immunofluorescence of c-Jun in double labeling with Schwann cell nuclear marker Sox10 in sections of the distal nerve stump in young and aging WT and aging c-Jun OE/+ mice 3 days post-cut. In the graph, the results are quantitated by cell counting. In aging WT Schwann cells, c-Jun is reduced, but elevated to youthful levels in aging c-Jun OE/+ Schwann cells; **p<0.001, ns, non-significant. n = 3 for each experimental group. (D) Representative images showing Fluorogold-labeled sensory neurons in L4 DRGs of young WT and aging WT and c-Jun OE/+ mice 1-week post back-filling following a 4-day crush injury. The graph shows quantitation by cell counting. There is an age-related decrease in back-filled neurons in WT samples (p=0.0309), while the high number of regenerating neurons in young WT mice is maintained in aging c-Jun OE/+ DRGs (p=0.0211). Unpaired Student's t-test. Young WT n = 6, aging WT n = 5, aging c-Jun OE/+ n = 6. (E) Representative images of Fluorogold-labeled motor neurons in young WT and aging WT and c-Jun OE/+ mice 1-week post back-filling following a 4-day crush injury. The graph shows quantitation of the results. Counts of labeled motor neurons mirrors those of sensory neurons since in WT mice, but not in c-Jun OE/+ mice, the number of back-labeled motor neurons decreases with age; ***p<0.001, **p<0.005, n = 6 for all experimental groups. (F) Counts of calcitonin gene-related peptide (CGRP)+ regenerating axons 3 mm from crush injury of the sciatic nerve of young and aged WT mice, and of aging c-Jun OE/+ mice; ****p<0.0001, ***p<0.001. Young WT n = 5, aging WT and c-Jun OE/+ n = 6. All numerical data are analyzed by one-way ANOVA with Tukey’s multiple comparison test and represented as means ± SEM. All scale bars: 100 μm.
Figure 1—figure supplement 1
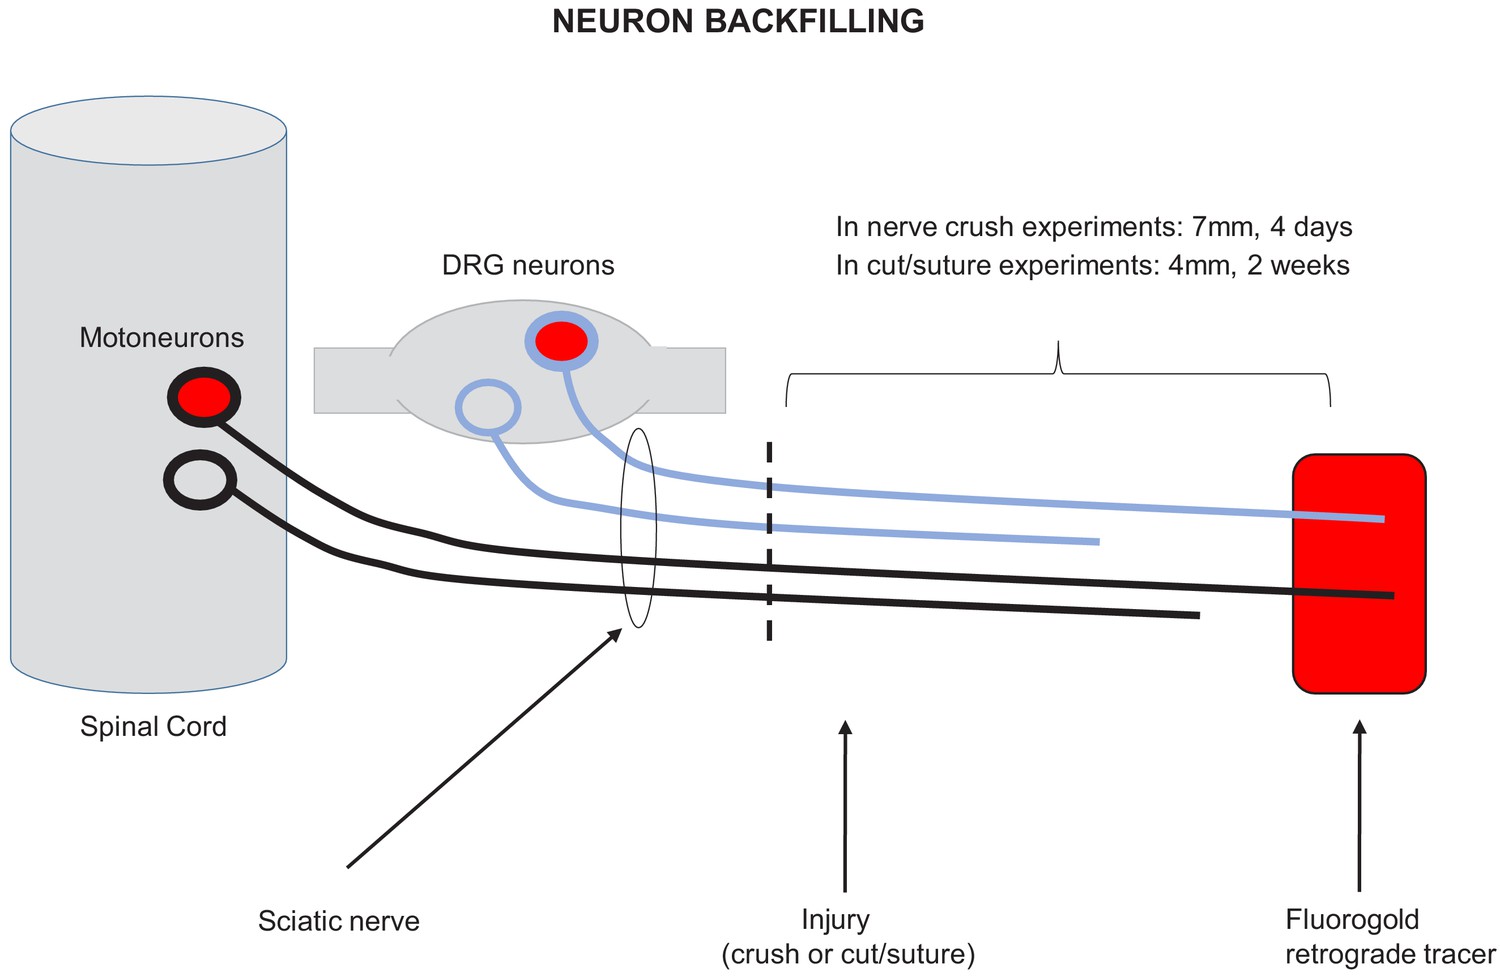
Schematic representation of neuron backfilling.
Figure 2 with 1 supplement
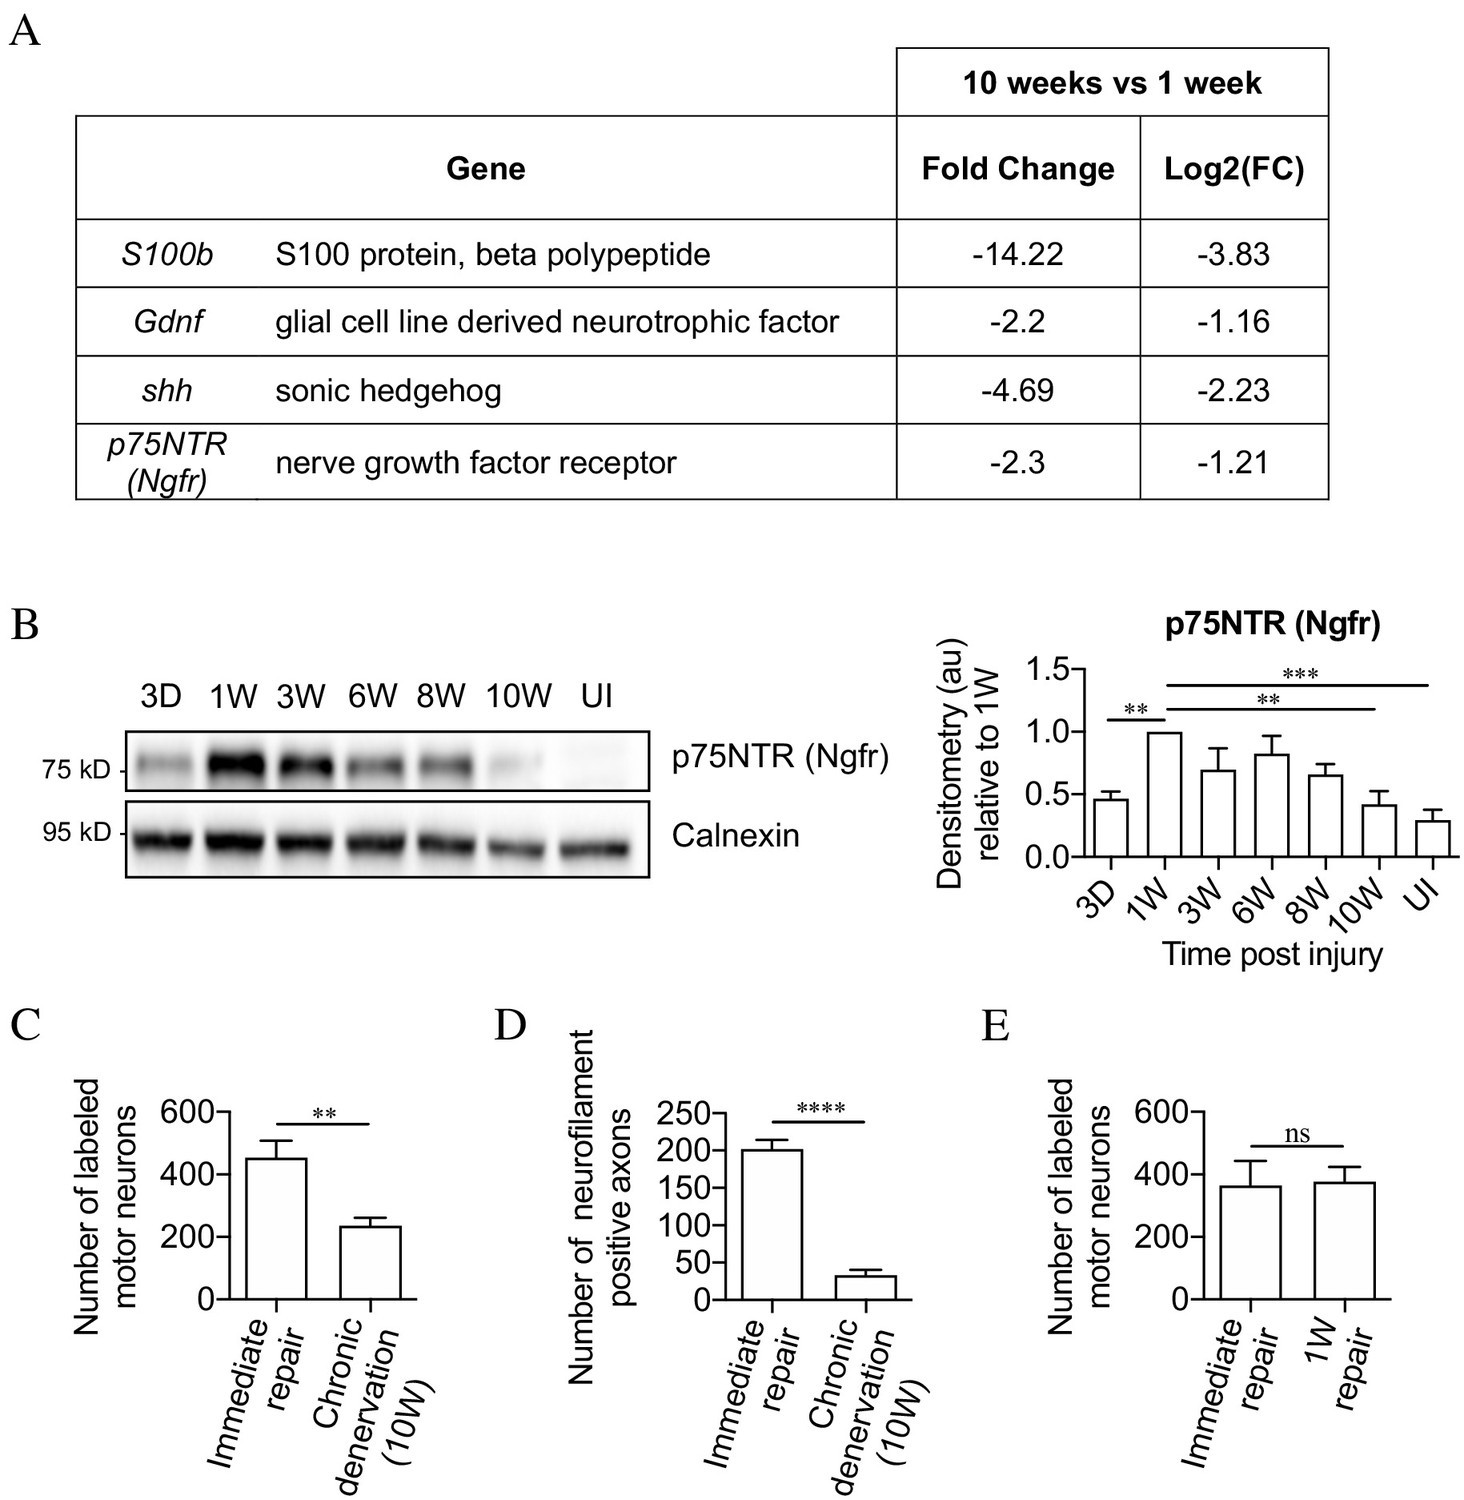
The mouse model of chronic denervation.
(A) Analysis of RNA sequencing data showing decrease in gene expression during chronic denervation. (B) Representative western blot showing p75NTR expression in uninjured (UI) nerves and distal nerve stumps following 3 days, and 1, 3, 6, 8 and 10 weeks of denervation. The graph shows quantitation of the results. P75NTR peaks 1 week after injury and gradually declines during prolonged denervation. Data normalized to 1 week after injury. One-way ANOVA with Dunnett's multiple comparison test; **p<0.005, ***p<0.001. n = 4. (C) Counts of back-filled Fluorogold-labeled regenerating motor neurons following immediate repair or chronic 10-week denervation show a decrease in motor neuron regeneration into chronically denervated stumps. Unpaired Student’s t-test; **p=0.0020. n = 6 for each time point. (D) Counts of neurofilament+ axons mirrors the decline in regeneration observed with chronic denervation shown in C. Counts were performed on transverse sections taken 3 mm from the repair site1 week after repair. Unpaired Student’s t-test; ****p<0.0001. Immediate repair n = 5, chronic denervation n = 4. (E) Counts of back-filled Fluorogold-labeled motor neurons showing similar numbers of regenerating neurons following immediate repair or repair after 1 week of denervation. Unpaired Student’s t-test; p=0.9. n = 3. All numerical data represented as means ± SEM.
Figure 2—figure supplement 1
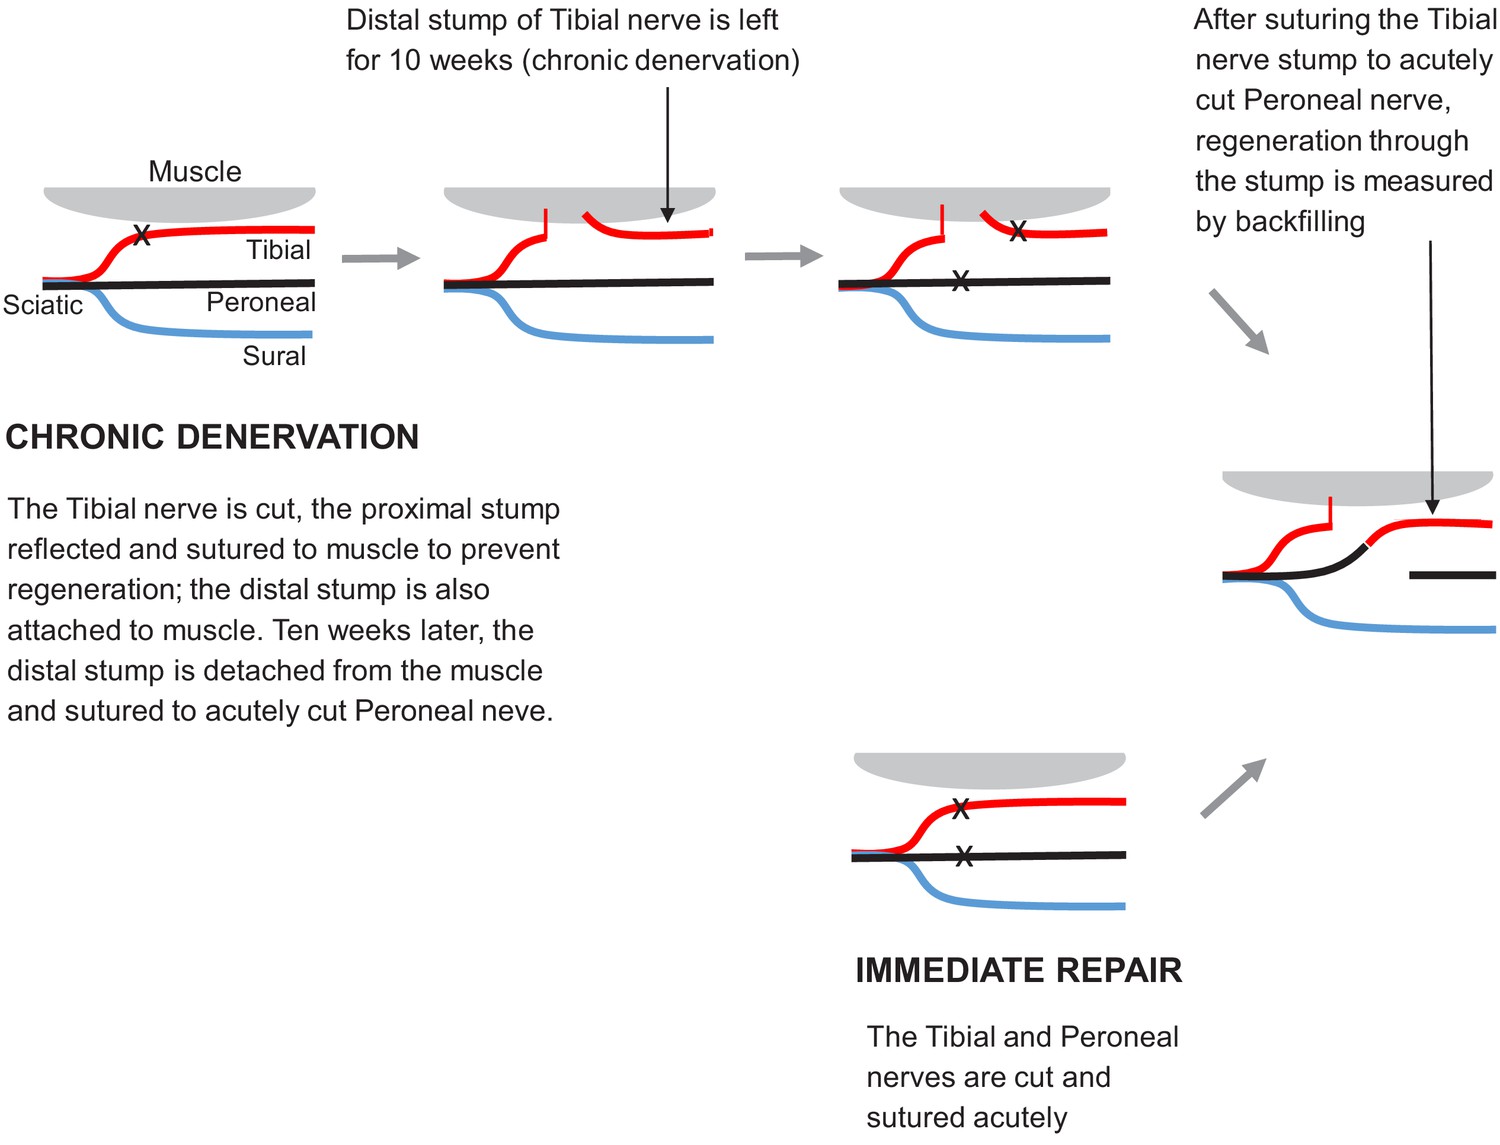
Surgical procedures used to study regeneration after immediate repair and chronic denervation.
Figure 3
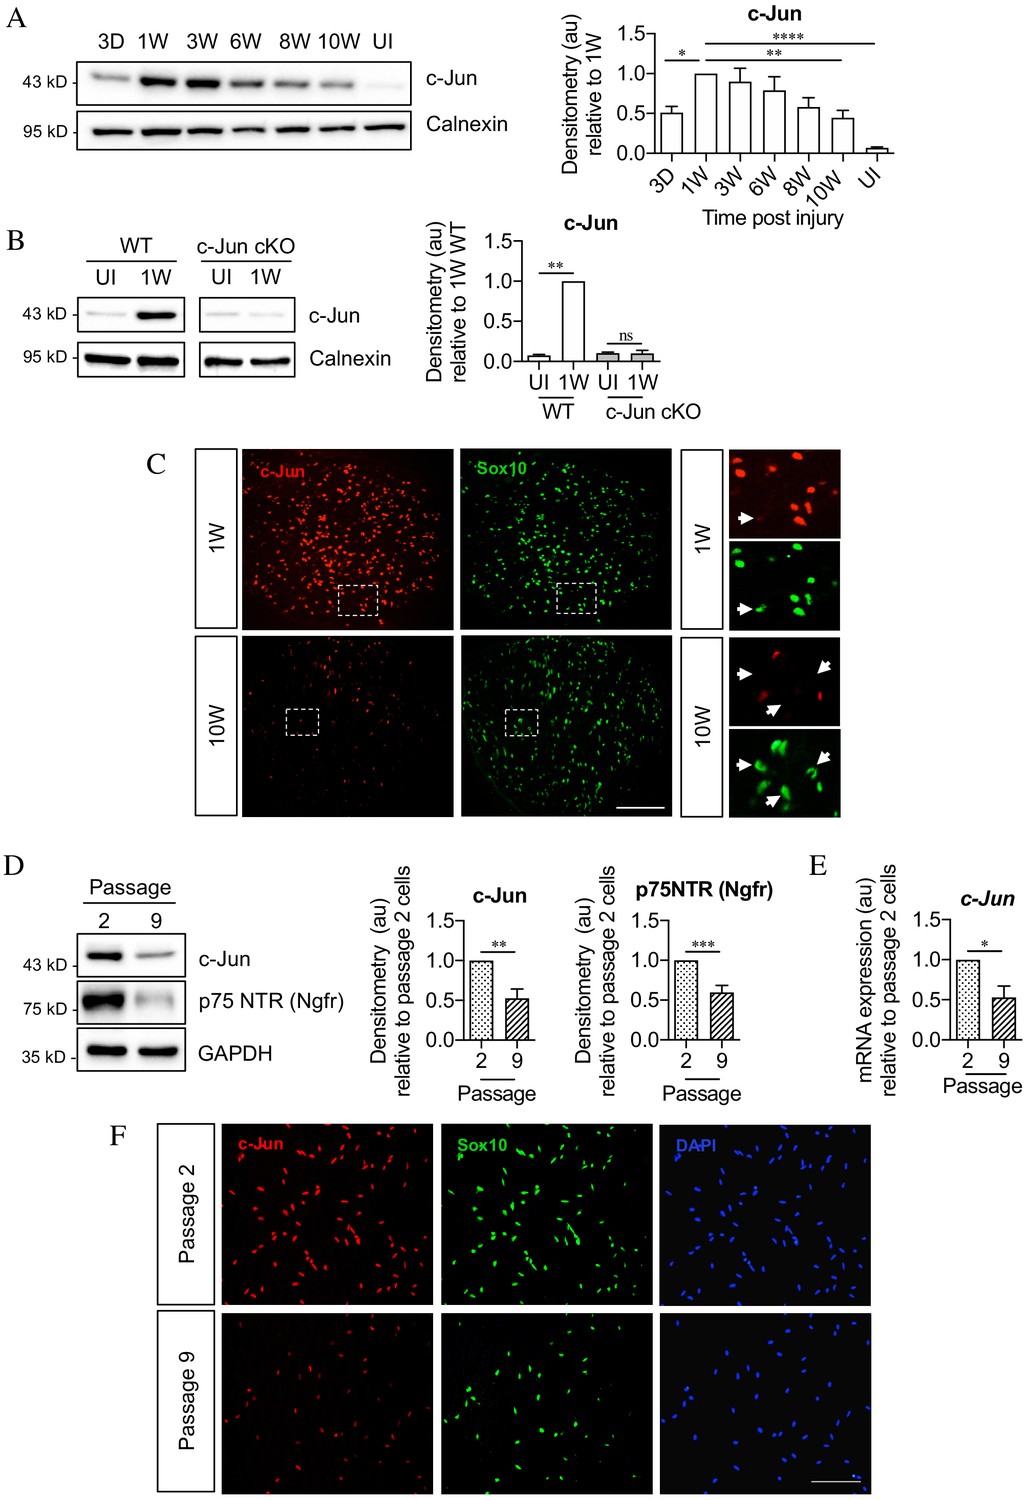
c-Jun declines in the distal nerve stump during chronic denervation and long-term culture.
(A) Representative Western blot of c-Jun in WT uninjured (UI) nerves and distal stumps following 3 days and 1, 3, 6, 8, and 10 weeks of denervation. The graph quantitates the results, showing an initial increase followed by a decline in c-Jun levels. Data normalized to 1 week post-injury. One-way ANOVA with Dunnett’s multiple comparisons test; *p<0.05, **p<0.005, ****p<0.0001. n = 5. (B) Representative western blot comparing c-Jun expression 1 week after injury in WT and c-Jun cKO mice. The graph quantitates the results, showing upregulation of c-Jun in WT nerves but not in c-Jun cKO nerves, demonstrating that the c-Jun upregulation after injury is Schwann cell specific. Data normalized to WT 1 week post-injury. Two-way ANOVA with Sidak’s multiple comparison test; ****p<0.0001. n = 5. (C) Representative immunofluorescence images of c-Jun/Sox10 double labeling in transverse sections of the distal stumps 1 and 10 weeks after cut. Boxed areas shown at higher magnification in right hand panels. Note loss of c-Jun protein from Schwann cell nuclei at 10 weeks (arrows). (D) Representative Western blot of c-Jun and p75NTR in Schwann cell cultures after two or nine passages. The results are quantitated in the graphs, showing decline in c-Jun and p75NTR with time in vitro. Data normalized to passage 2. Unpaired Student’s t-test; **p=0.0023, ***p=0.0007. n = 6 for c-Jun, n = 7 for p75NTR. (E) qPCR analysis showing reduction in c-Jun mRNA in Schwann cultures following nine passages. Data normalized to passage 2. Unpaired Student’s t-test; *p=0.0299. n = 3. (F) c-Jun/Sox10 double labeling with nuclear marker DAPI after two or nine passages. Note decline of nuclear c-Jun in passage 9 cells. All numerical data represent means ± SEM.
Figure 4

c-Jun expression is maintained in c-Jun OE/+ Schwann cells during chronic denervation.
(A) Representative western blots of c-Jun in WT and c-Jun OE/+ distal stumps after 1, 3, and 10 weeks of denervation. The results are quantitated in the graph. In contrast to WT nerves, c-Jun OE/+ nerves maintain consistent levels of c-Jun during 10-week chronic denervation. Data normalized to WT 1 week post-injury. Two-way ANOVA with Sidak’s multiple comparisons test; *p<0.05. n = 5. (B) Representative images showing c-Jun/Sox10 double immunofluorescence in transverse sections of WT and OE/+ uninjured and injured distal stumps. The graph shows quantitation by cell counting. The c-Jun labeling of Sox10-positive nuclei in the two genotypes is comparable at 1 week, but reduced at 10 weeks in WT nerves only. Two-way ANOVA with Tukey’s multiple comparison test; ***p<0.001. n = 3. All numerical data represented as means ± SEM, all scale bars: 100 µm.
Figure 5
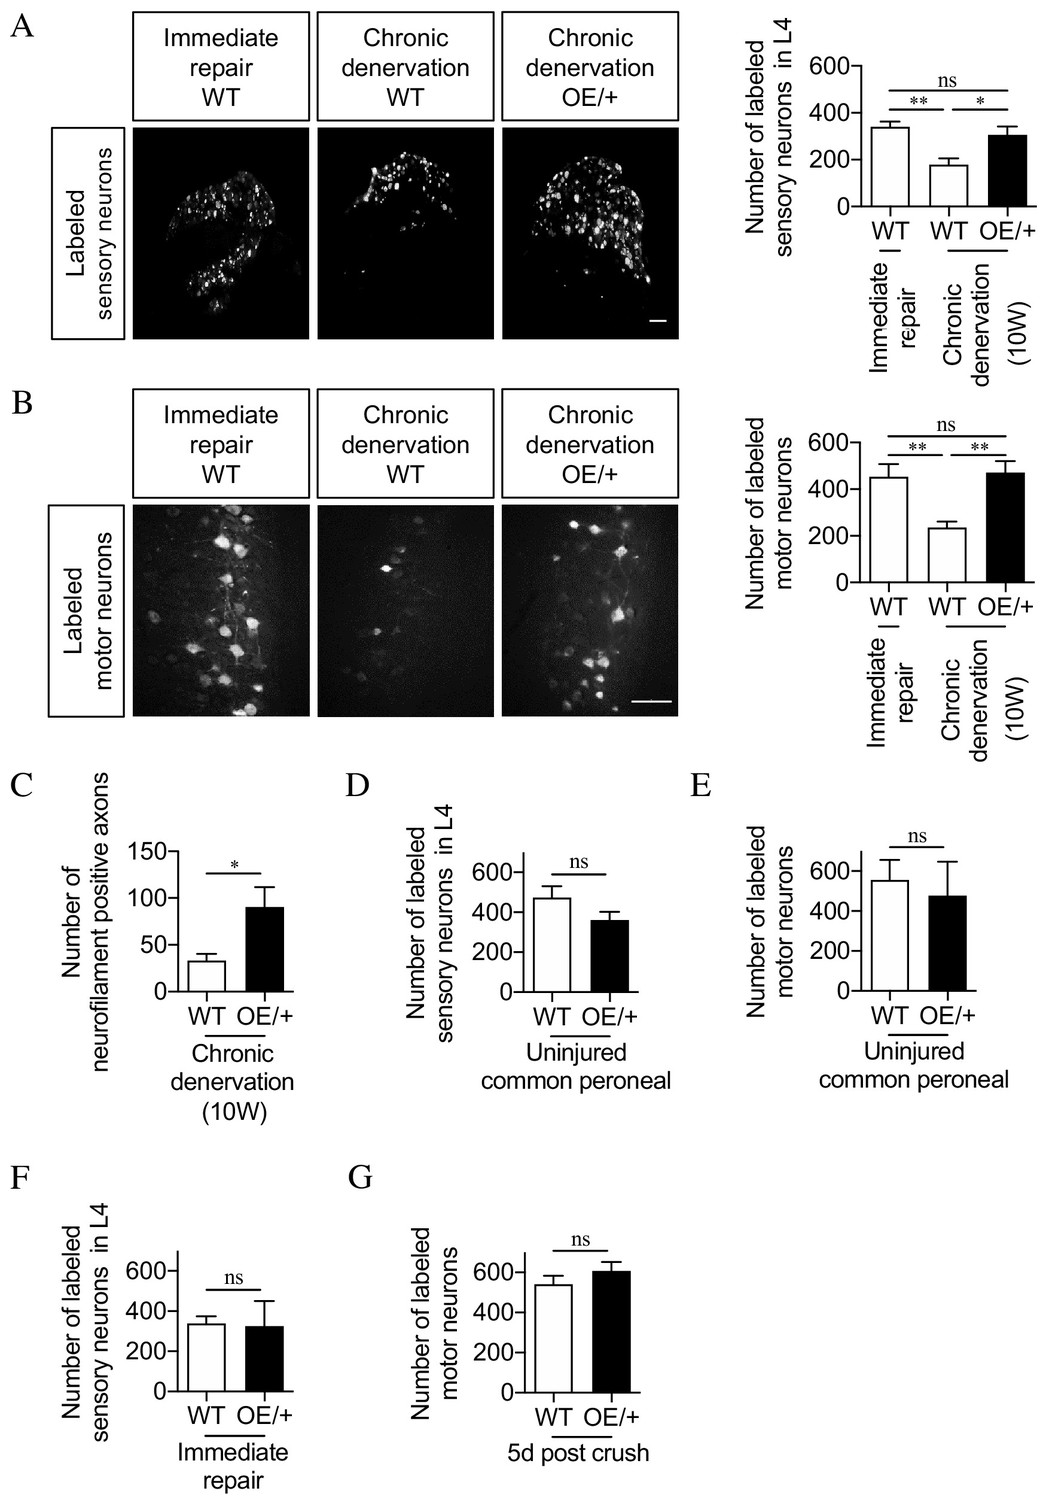
The regenerative capacity of c-Jun OE/+ nerves is maintained during chronic denervation.
(A) Representative images showing Fluorogold-labeling of neurons in L4 DRGs of WT and c-Jun OE/+ mice after 2 weeks of regeneration into acutely transected (immediate repair) or chronically denervated (10 weeks) distal stumps. Quantification by cell counting is in the graph. The number of back-filled DRG neurons following regeneration through chronically denervated WT stumps was reduced, but maintained after regeneration through chronically denervated c-Jun OE/+ stumps. One-way ANOVA with Tukey’s multiple comparison test; **p<0.005, *p<0.05, ns non-significant. WT immediate repair and chronic denervation n = 6, OE/+ chronic denervation n = 8. (B) Representative images showing Fluorogold- labeling of back-filled motor neurons in WT and c-Jun OE/+ mice after 2 weeks of regeneration into acutely transected (immediate repair) or chronically denervated distal stumps. Quantification is in the graph, showing that compared to immediate repair, the number of labeled neurons is reduced after regeneration through chronically denervated WT stumps, but not after regeneration through chronically denervated c-Jun OE/+ stumps. One-way ANOVA with Tukey’s multiple comparison test; **p<0.005. WT immediate repair and chronic denervation n = 6, c-Jun OE/+ chronic denervation n = 8. (C) Counts of neurofilament+ immunofluorescent fibers in the distal stump 1 week after repair following chronic denervation of WT and c-Jun OE/+ nerves. In parallel experiments, the number of neurofilament+ fibers in WT nerves after immediate repair was about 200 (see Figure 2D). Unpaired Student’s t-test; *p=0.0334. WT n = 4, c-JunOE/+ n = 3. (D, E) Counts of Fluorogold-labeled sensory (D) and motor (E) neurons in WT and c-Jun OE/+ mice following transection with immediate application of tracer. The number of back-filled sensory (p=0.1872) and motor (p=0.7153) neurons is similar. Unpaired Student’s t-tests, n = 3 for each experimental condition. (F) The number of back-filled sensory neurons in WT and c-Jun OE/+ mice is similar after transection followed by immediate repair. Unpaired Student’s t-test; p=0.9195. n = 3. (G) The number of labeled motor neurons in WT and c-Jun OE/+ mice is similar when tracer was applied 5 days after sciatic nerve crush. Unpaired Student’s t-test; p=0.312. WT n = 5, c-Jun OE/+ n = 4. All numerical data represented as means ± SEM, all scale bars: 100 µm.
Figure 6
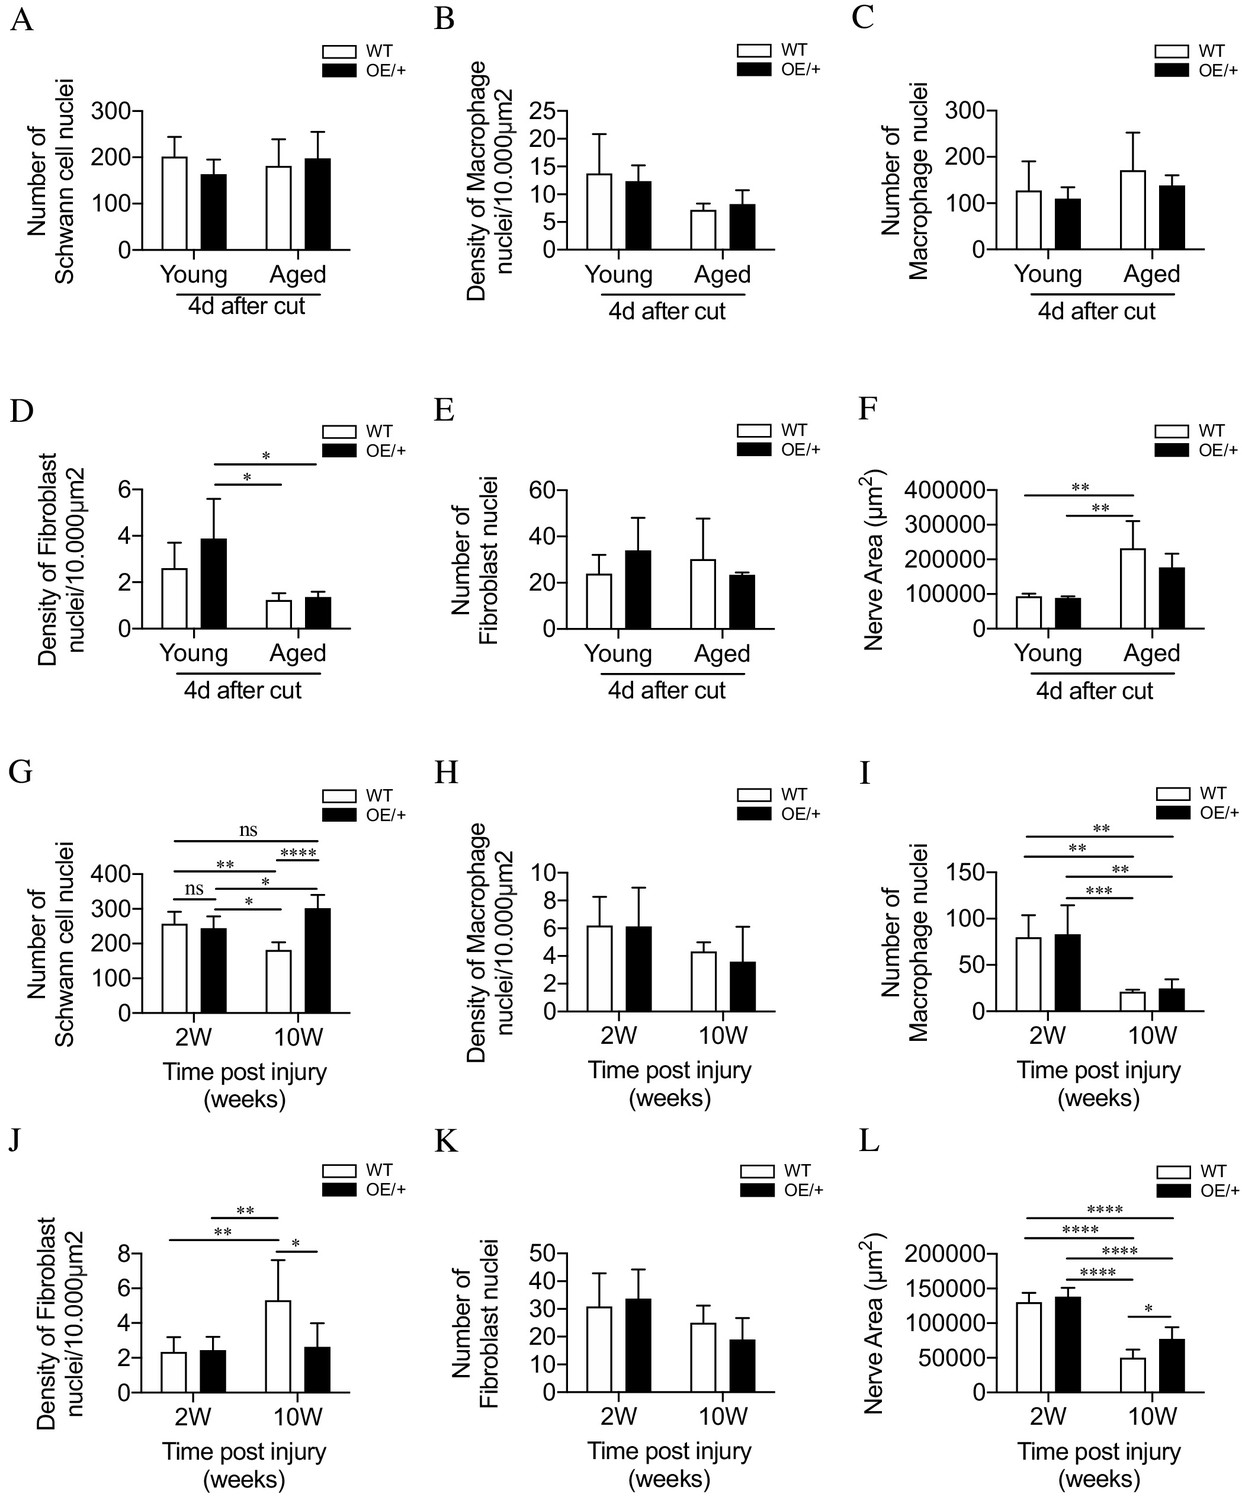
Cell number and nerve size in injured WT and c-Jun OE/+ nerves Cell nuclei were counted in whole transverse profiles of the tibial nerve, 5 mm from the injury site, using the electron microscope.
(A) Schwann cell numbers in young and aged WT and c-Jun OE/+ nerves. (B) Macrophage density and (C) number in young and aged WT and c-Jun OE/+ nerves. (D) Fibroblast density and (E) number in young and aged WT and c-Jun OE/+ nerves: *p<0.05. (F) Whole transverse profiles of the tibial nerve were measured for the nerve area of young and aged WT and c-Jun OE/+ nerves; **p<0.005. For counts in A-F, n = 4 for each condition. (G) Schwann cell numbers in 2- and 10-week cut nerves of WT and c-Jun OE/+ mice; *p<0.05, **p<0.005, ****p<0.0001. (H) Macrophage density and (I) number in 2- and 10-week cut nerves of WT and c-Jun OE/+ mice; **p<0.005, ***p<0.001. (J) Fibroblast density and (K) number in 2- and 10-week cut nerves of WT and c-Jun OE/+ mice; *p<0.05, **p<0.005. (L) Whole transverse profiles of the tibial nerve were measured for the nerve area of 2- and 10-week cut nerves of WT and c-Jun OE/+ mice; *p<0.05, ****p<0.0001. For counts in G-L, 2-week WT and c-Jun OE/+ n = 7, 10-week WT and c-Jun OE/+ n = 5. All number data represented as means ± SEM analyzed by two-way ANOVA with Tukey’s multiple comparison test.
-
Figure 6—source data 1
Cell counts and measurements relating to Figure 6.
- https://cdn.elifesciences.org/articles/62232/elife-62232-fig6-data1-v1.docx
Figure 7
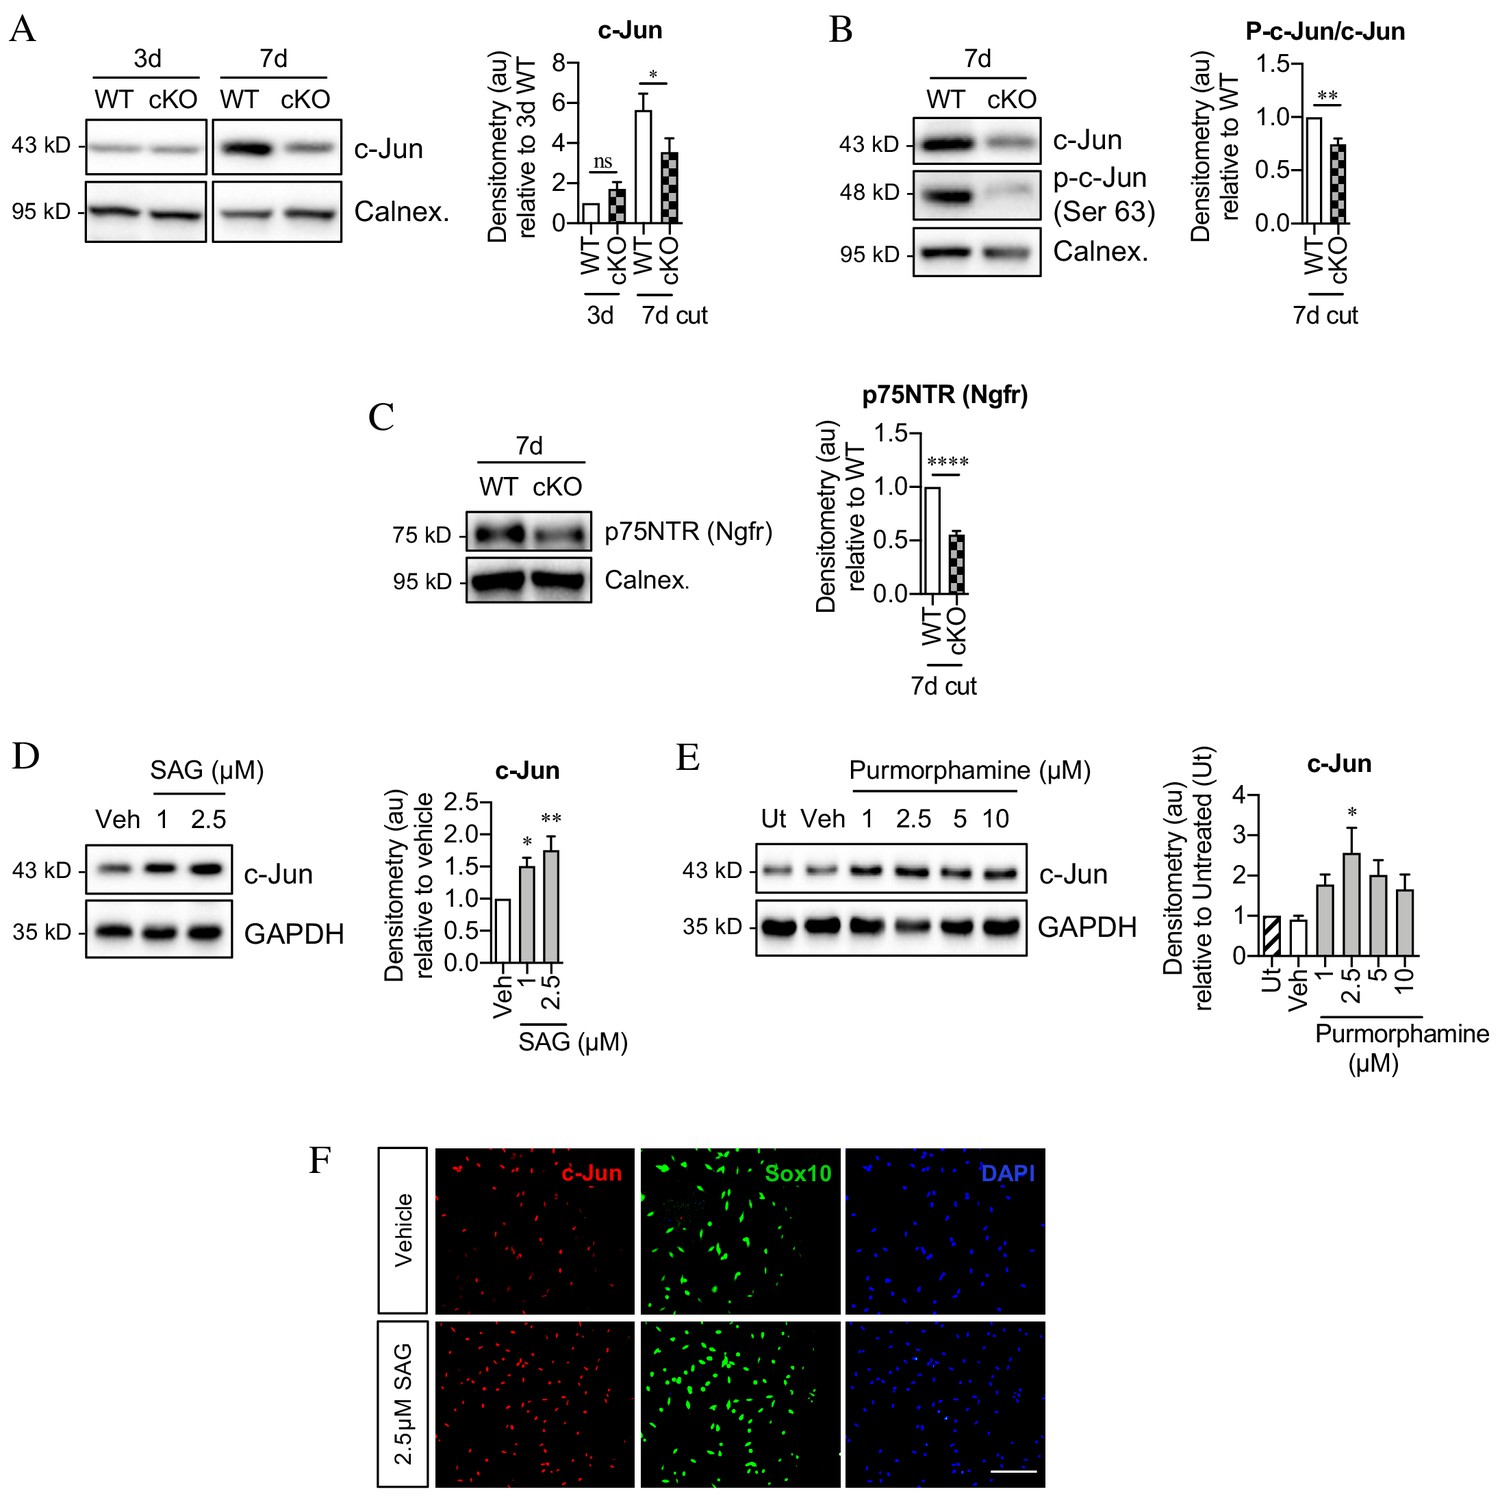
Sonic hedgehog promotes c-Jun activation in Schwann cells in vivo and in vitro.
(A) Representative western blot showing c-Jun expression in WT and Shh cKO (cKO) nerves 3 and 7 days after cut. Quantitation is shown in the graph where the data are normalized to WT 3 days post-cut. Two-way ANOVA with Sidak’s test; *p<0.05. n = 5 for each genotype. (B) Representative Western blot showing c-Jun and phosphorylated c-Jun (p-c-Jun) in WT and Shh cKO distal nerve stumps 7 days post-cut. Quantitation is shown in the graph where the data are normalized to WT 7 days post-cut. Unpaired Student’s t-test; **p=0.0014, n = 5 for each genotype. (C) Representative western blot showing p75NTR protein in WT and Shh cKO nerves 7 days post-cut. The graph shows quantitation of the results. Data are normalized to WT 7 days post-injury. Unpaired Student’s t-test; ****p=<0.0001. n = 5 for each genotype. (D) Representative western blot showing c-Jun in Schwann cell cultures exposed to SAG for 48 hr. (Veh: DMSO vehicle). Quantitation is shown in the graph where the data are normalized to vehicle. One-way ANOVA with Dunnet’s test; *p<0.05, **p<0.005. n = 6. (E) Representative western blot showing c-Jun in Schwann cell cultures exposed to purmorphamine for 48 hr. Quantitation is shown in the graph where the data are normalized to vehicle. One-way ANOVA with Dunnet’s test; *p<0.05. n = 3. (F) Representative immunofluorescence images showing increased c-Jun labeling of Sox10-positive Schwann cell nuclei after 48 hr incubation with SAG compared to vehicle (DMSO). Scale bar: 100 µm.
Figure 8
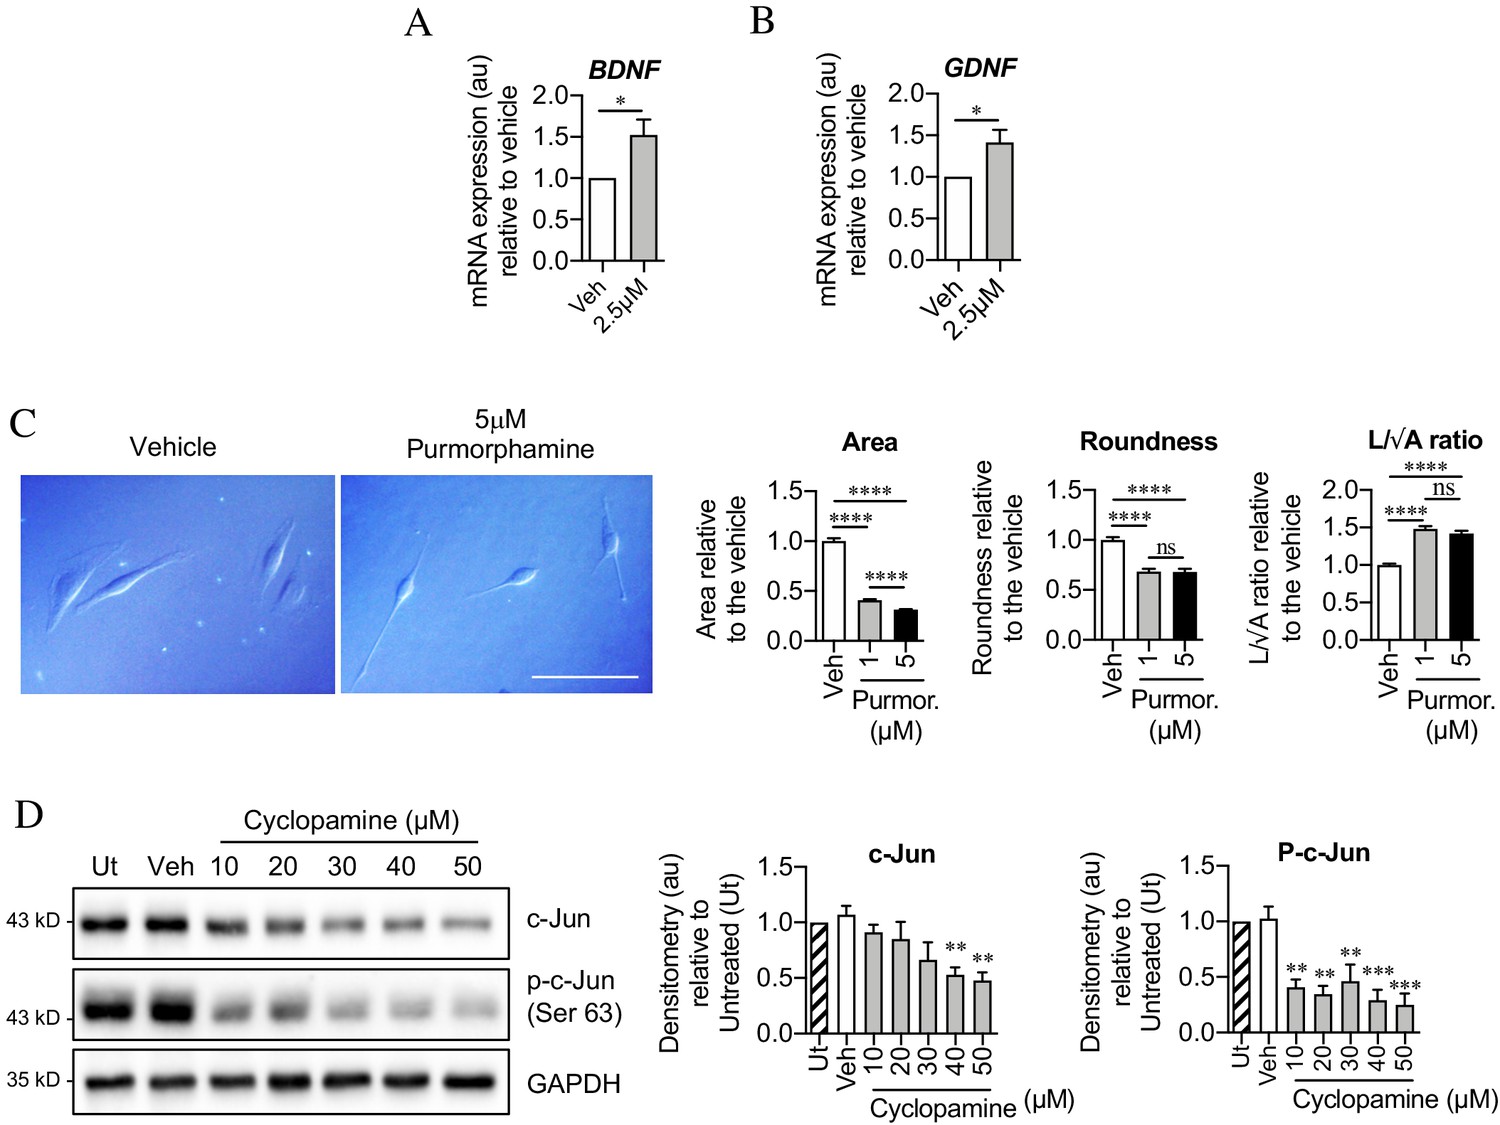
Sonic hedgehog plays a role in c-Jun activation in Schwann cells via autocrine signaling.
(A, B) qPCR showing mRNA expression of (A) Bdnf *p=0.0314 and (B) Gdnf *p=0.0382 in Schwann cell cultures incubated for 48 hr with SAG. Data normalized to vehicle. Unpaired Student’s t-tests. n = 4 for each condition. (C) Differential interference contrast (DIC) microscopy showing changes in Schwann cell morphology after 48 hr incubation with purmorphamine (DMSO vehicle). Scale bar: 50 µm. Graphs depict changes in cell area, roundness and length/√area following incubation with purmorphamine, demonstrating enhancement of elongated morphology. One-way ANOVAs with Tukey’s multiple comparison test ***p<0.001. n = 3, each experiment involving measurement of 100 cells per condition. (D) Representative Western blots showing c-Jun and phosphorylated c-Jun in cultured Schwann cells after 48 hr incubation with cyclopamine alone (DMSO vehicle). The graphs show quantitation of the blots. Data are normalized to vehicle. One-way ANOVA with Dunnet’s multiple comparisons test; **p<0.005; ***p<0.001. n = 3. All numerical data represented as means ± SEM.
Figure 9 with 1 supplement
Bioinformatics analysis of RNA seq.
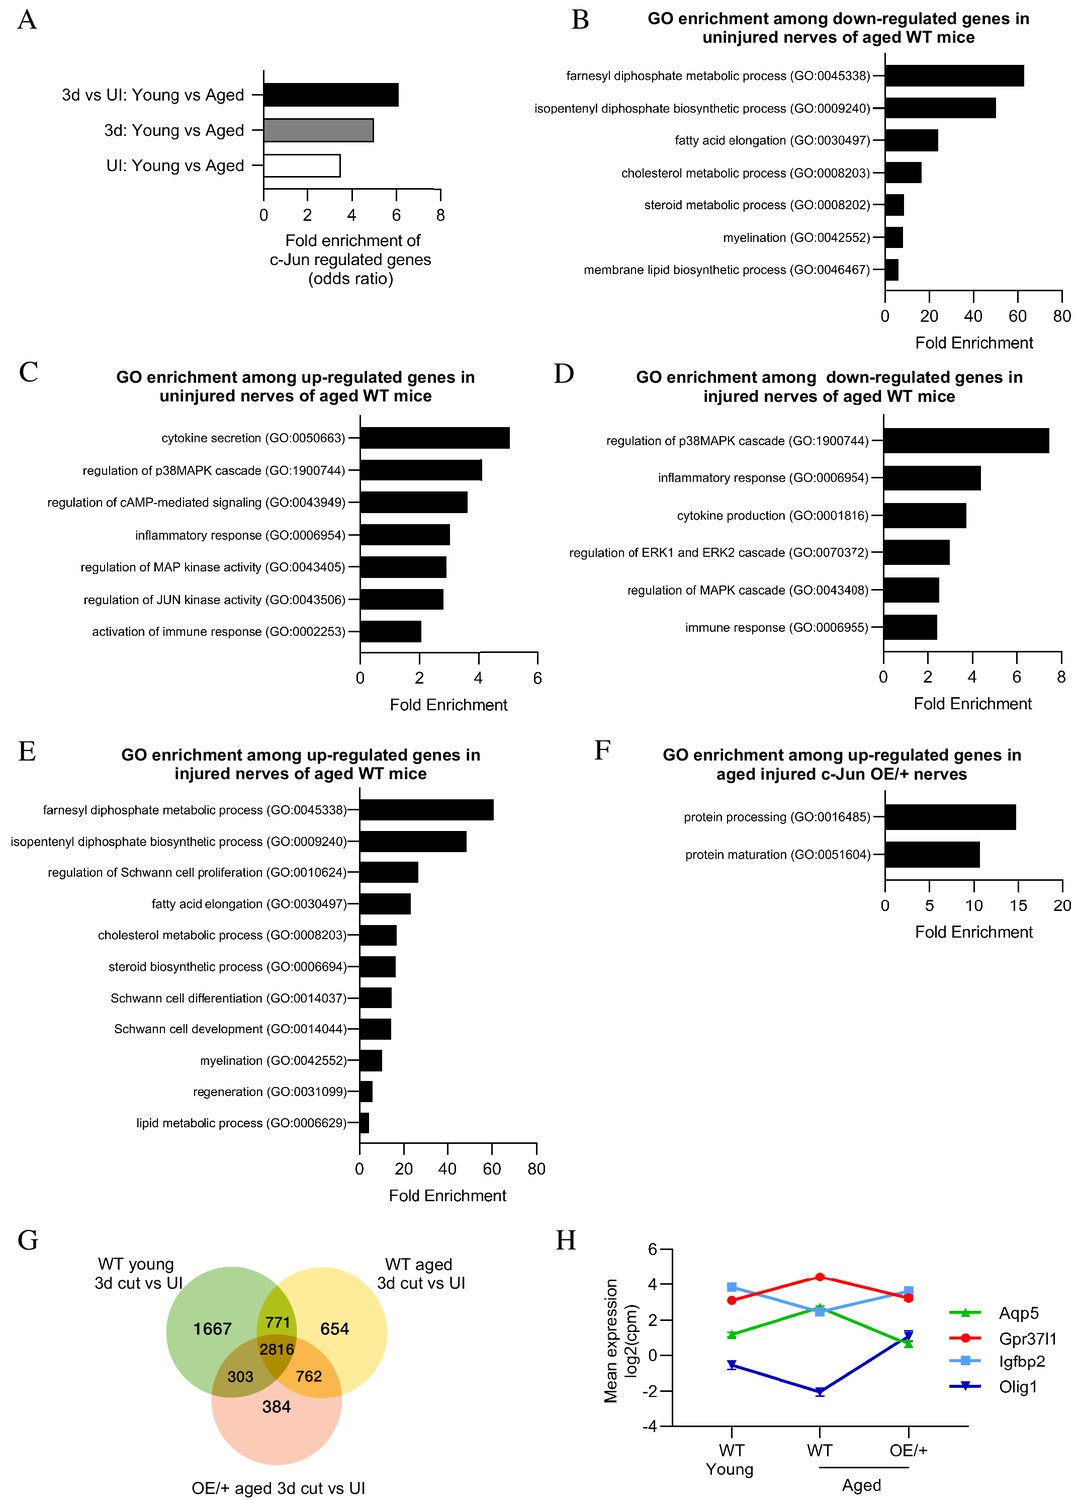
data from young and aged nerves. (A) Over-representation analysis showing enrichment of c-Jun-regulated genes in various WT injury paradigms. p=3.2×10⁻⁸ for UI young vs aged; p=1×10 x −7 for 3-day cut young vs aged; p=2.3×10⁻¹³ for the injury response. p-Values computed by one-sided Fisher’s exact test. (B) GO terms downregulated and (C) upregulated in uninjured nerves of aged WT mice (absolute fold change >2 and FDR < 0.05). (D) GO terms downregulated and (E) upregulated in the injury response of aged WT mice (absolute fold change >2 and FDR < 0.05). (F) When aged c-Jun OE/+ and WT nerves are compared, genes associated with protein processing (FDR = 0.00318) and maturation (FDR = 0.0153) are significantly enriched in aged c-Jun OE/+ nerves compared to aged WT. (G) Venn diagram showing numbers of differentially expressed genes between young and aged 3-day cut WT nerves and aged 3-day cut OE/+ nerves, compared to their uninjured counterparts. (H) Mean expression of four c-Jun-regulated genes with significantly different expression between young and aged WT nerves but not between young WT and aged c-Jun OE/+ nerves(absolute fold change >2 and FDR < 0.05).
Figure 9—figure supplement 1
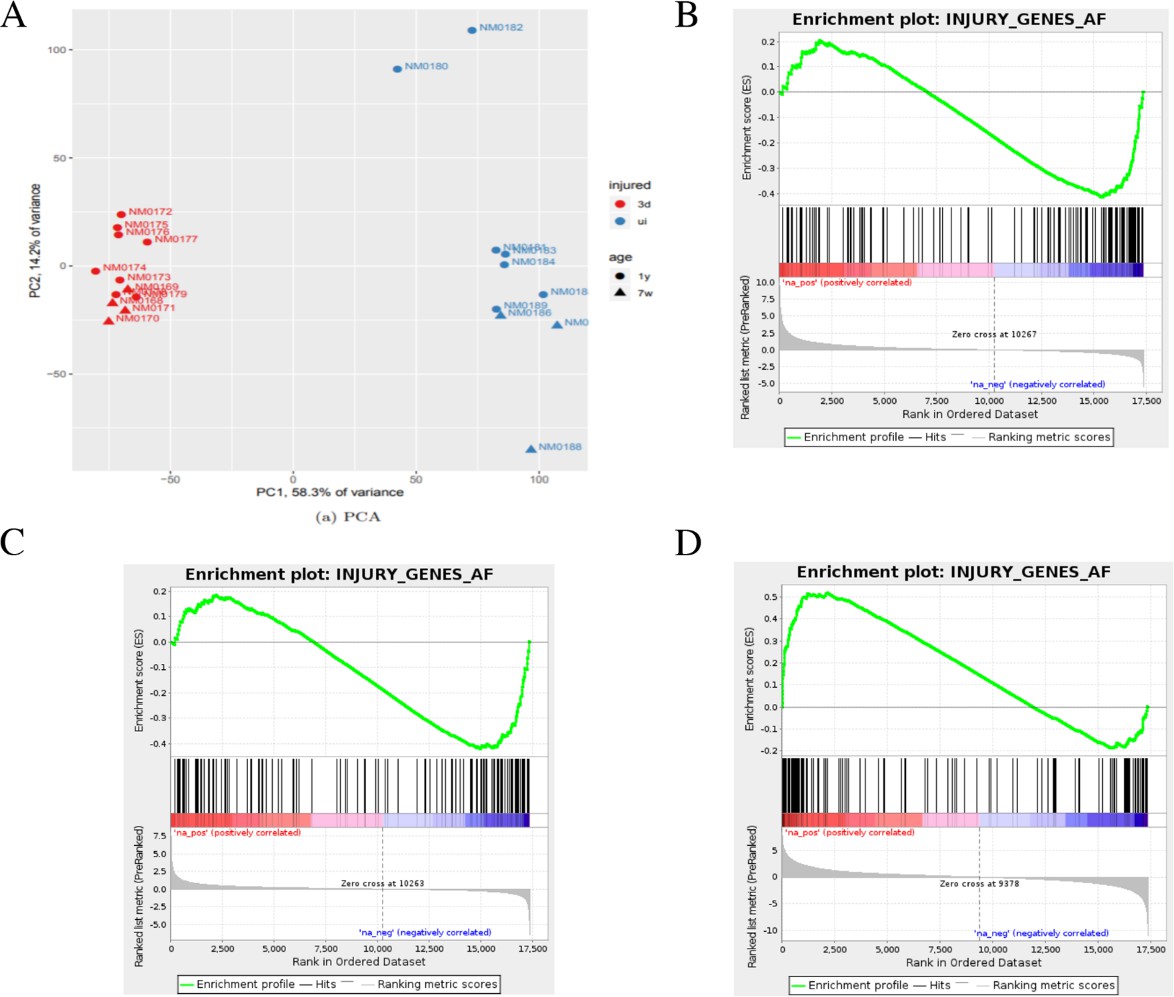
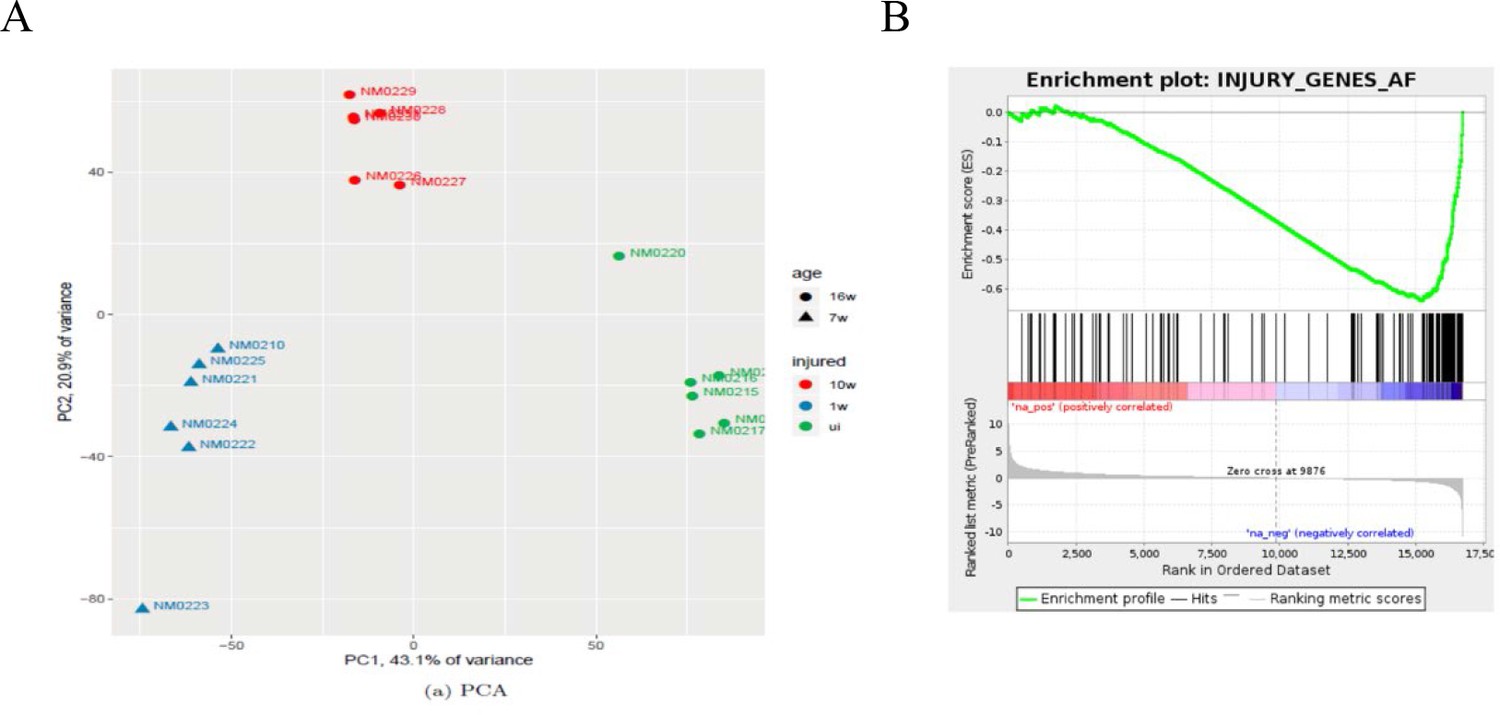
Bioinformatics analysis of aged and young nerves following injury.
(A) Principal component analysis (PCA) shows that the key source of variance in our aging analysis is injury status with samples clustering together after injury (red) regardless of age or genotype. (B) Gene set enrichment analysis (GSEA) of uninjured young and aged WT nerves showed enrichment in the downregulation of c-Jun-regulated genes in aged nerves. Normalized enrichment score (NES) = −1.85, q-value = 0.0. (C) GSEA analysis comparing injured old and young nerves showed a similar enrichment of c-Jun genes in the downregulation of these genes, suggesting a failure of c-Jun regulation in aged nerves. NES = −1.61, q-value = 0.0. (D) GSEA of young and aged nerves compared to their uninjured controls and then to each other to examine the differential expression between the two in response to injury. Analysis shows that c-Jun gene upregulation was highly enriched by injury. NES = 2.01, q-value = 0.0.
Figure 10 with 1 supplement
Bioinformatics analysis of RNA seq. data from acutely and chronically denervated nerves.
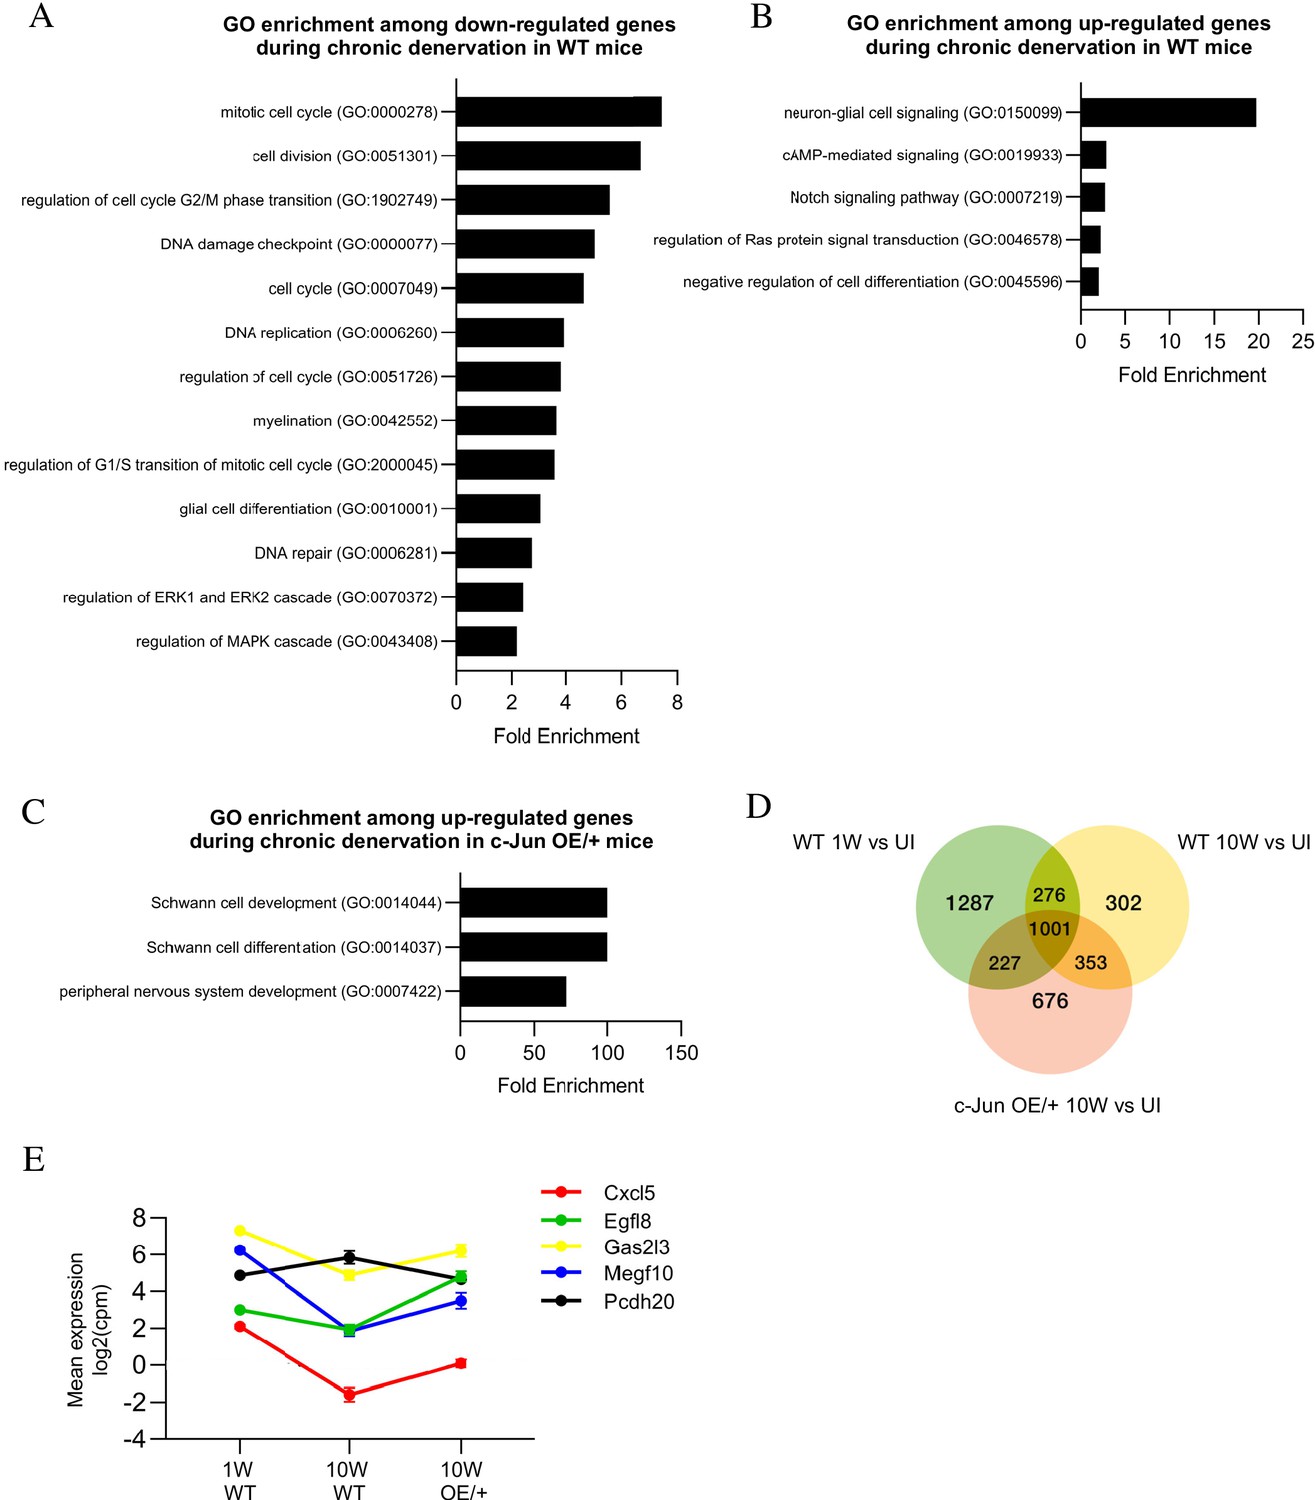
(A) GO terms downregulated and (B) upregulated in WT nerves during chronic denervation. (C) When chronically denervated c-Jun OE/+ and WT nerves were compared, GO terms associated with Schwann cell differentiation (FDR = 0.00397) and PNS development (FDR = 0.0173) were enriched in c-Jun OE/+ nerves. (D) Venn diagram showing numbers of differentially expressed genes between WT nerves following acute (1 week) and chronic (10-week) denervation and c-Jun OE/+ nerves following chronic denervation, compared to their uninjured counterparts. (E) Mean expression of five c-Jun-regulated genes with significantly different expression between acute and chronic WT nerves, but not between acute WT and chronic c-Jun OE/+ nerves (absolute fold change >2 and FDR < 0.05).
Figure 10—figure supplement 1
Bioinformatics analysis of nerves after chronic injury.
(A) PCA showing the key sources of variance in our chronic injury analysis are not only injury dependent but also time post-injury dependent, with samples clustering based on length of denervation regardless of genotype. (B) GSEA of WT chronically denervated nerves showed that c-Jun genes were some of the most downregulated genes during chronic denervation NES = −2.5, q-value = 0.0.
Tables
Key resources table
| Reagent type (species) or resource | Designation | Source or reference | Identifiers | Additional information |
|---|---|---|---|---|
| Mpz < Cre/+>; Rosa26c-Junstopf < f/+>, C57BL/6J background, Mus musculus both sexes used | c-Jun OE/+ mouse | Fazal et al., 2017 | RRID:MGI: | |
| Mpz < Cre/+>; Jun < f/+>, C57BL/6J background, Mus musculus both sexes used | c-Jun cKO mouse | Arthur-Farraj et al., 2012 | Juntm4Wag | RRID:MGI:2445420 |
| Mpz < Cre/+>; Shh < f/+>, C57BL/6J background, Mus musculus both sexes used | Shh cKO mouse | Jackson Laboratory | B6;129-Shhtm2Amc/J | RRID:IMSR_JAX:004293 |
| Mpz < Cre/+>, C57BL/6J background, Mus musculus both sexes used | Mpz-Cre mouse | Jackson Laboratory | B6N.FVB-Tg(Mpz-cre)26Mes/J; | RRID:IMSR_JAX:017927 |
| Antibody | Anti- c-Jun (rabbit monoclonal) | Cell Signaling | Cat #9165; RRID:AB_2130165 | WB (1:1000) IF (1:800) |
| Antibody | Anti- P-c-Jun (rabbit polyclonal) | Cell Signaling | Cat#9261; RRID:AB_2130162 | WB (1:1000) |
| Antibody | Anti- p75NTR (Ngfr) (rabbit polyclonal) | Millipore | Cat#AB1554; RRID:AB_90760 | WB (1:1000) |
| Antibody | Anti- GAPDH (rabbit polyclonal) | Sigma-Aldrich | Cat#G9545; RRID:AB_796208 | WB (1:5000) |
| Antibody | Anti- Canelxin (rabbit polyclonal) | Enzo Life Sciences | Cat#ADI-SPA-860-D; RRID:AB_2038898 | WB (1:1000) |
| Antibody | Anti- sox10 (goat polyclonal) | R and D Systems | Cat#AF2864; RRID:AB_442208 | IF (1:100) |
| Antibody | Anti- CGRP (rabbit monoclonal) | Peninsula Laboratories | Cat#T-4032; RRID:AB_518147 | IF (1:1000) |
| Antibody | Anti- Neurofilament (chicken polyclonal) | Abcam | Cat#ab4680; RRID:AB_304560 | IF (1:1000) |
| Antibody | Anti- Rabbit IgG, HRP-linked (Goat polyclonal) | Cell Signaling | Cat#7074; RRID:AB_2099233 | WB (1:2000) |
| Antibody | Cy3 anti-Rabbit IgG (H+L) (Donkey polyclonal) | Jackson Immuno Research Labs | Cat#711-165-152; RRID:AB_2307443 | IF (1:500) |
| Antibody | Anti-Goat Alexa 488 Conjugated (Donkey polyclonal) | Molecular Probes - Thermo Fisher | Cat#A11057; RRID:AB_2534104 | IF (1:1000) |
| Antibody | Anti-Rabbit Alexa 488 Conjugated (Donkey polyclonal) | Molecular Probes - Thermo Fisher | Cat#A11008; RRID:AB_143165 | IF (1:1000) |
| Antibody | Anti-Chicken Alexa 488 Conjugated (Goat polyclonal) | Molecular Probes - Thermo Fisher | Cat#A-11039; RRID:AB_2534096 | IF (1:1000) |
| Sequence-based reagent | Bdnf_F | Benito et al., 2017 | PCR primers | TCATACTTCGGTTGCATGAAGG |
| Sequence-based reagent | Bdnf_R | Benito et al., 2017 | PCR primers | AGACCTCTCGAACCTGCCC |
| Sequence-based reagent | c-Jun_F (Cells) | Benito et al., 2017 | PCR primers | AATGGGCACATCACCACTACAC |
| Sequence-based reagent | c-Jun_R (Cells) | Benito et al., 2017 | PCR primers | TGCTCGTCGGTCACGTTCT |
| Sequence-based reagent | c-Jun_F (Tissue) | Benito et al., 2017 | PCR primers | CCTTCTACGACGATGCCCTC |
| Sequence-based reagent | c-Jun_R (Tissue) | Benito et al., 2017 | PCR primers | GATTCGGGCCACTTGGAGTT |
| Sequence-based reagent | Gdnf_F | Benito et al., 2017 | PCR primers | GATTCGGGCCACTTGGAGTT |
| Sequence-based reagent | Gdnf_R | Benito et al., 2017 | PCR primers | GACAGCCACGACATCCCATA |
| Sequence-based reagent | Calnexin_F | Benito et al., 2017 | PCR primers | CAACAGGGGAGGTTTATTTTGCT |
| Sequence-based reagent | Calnexin_R | Benito et al., 2017 | PCR primers | TCCCACTTTCCATCATATTTGGC |
| Sequence-based reagent | Gapdh_F | Benito et al., 2017 | PCR primers | AGGTCGGTGTGAACGGATTTG |
| Sequence-based reagent | Gapdh_R | Benito et al., 2017 | PCR primers | TGTAGACCATGTAGTTGAGGTCA |
| Sequence-based reagent | Mpz_F | Benito et al., 2017 | PCR primers | GCTGGCCCAAATGTTGCTGG |
| Sequence-based reagent | Mpz_R | Benito et al., 2017 | PCR primers | CCACCACCTCTCCATTGCAC |
| Commercial assay or kit | Kapa mRNA HyperPrep Kit | Roche | Cat#KK8581, 08098123702 | |
| Commercial assay or kit | RNeasy Micro Extraction Kit | Qiagen | Cat#74004 | |
| Chemical compound, drug | Purmorphamine | Sigma-Aldrich | Cat#540220 | Concentration: various, see figures |
| Chemical compound, drug | Smoothened Agonist (SAG) | Merck-Sigma-Aldrich-Calbiochem | Cat#566660 | Concentration: various, see figures |
| Chemical compound, drug | Cyclopamine | Merck-Sigma-Aldrich-Calbiochem | Cat#CAS 4449-51-8 | Concentration: various, see figures |
| Software, algorithm | Samtools version 1.2 | Li et al., 2009 | RRID:SCR_002105 | |
| Software, algorithm | Picard tools version 1.140 | http://broadinstitute.github.io/picard/ | RRID:SCR_006525 | |
| Software, algorithm | featureCounts | Liao et al., 2014 | RRID:SCR_012919 | |
| Software, algorithm | edgeR | Robinson et al., 2010 | RRID:SCR_012802 | |
| Software, algorithm | Gen ser enrichment analysis (GSEA) | Subramanian et al., 2005 | RRID:SCR_003199 | |
| Software, algorithm | Gen ontology (GO) analysis – PANTHER classification system | Mi et al., 2013 | RRID:SCR_004869 | |
| Software, algorithm | GraphPad Prism 9.0.0 | GraphPad Prism | RRID:SCR_002798 | |
| Software, algorithm | Bio Rad ChemiDoc MP Imaging System | Bio Rad | RRID:SCR_019037 | |
| Other | Fluorogold | Fluorochrome | Fluoro-gold 20 mg | Made up to 4% |
| Other | DAPI | Thermo Fisher | Cat#D1306 | IF (1:40,000) |
Additional files
-
Supplementary file 1
The 15 most regulated genes in the tibial nerve of WT mice during aging.
The data compare (A) uncut nerves, (B) 3-day cut nerves, and (C) the injury response. In (A) and (B), genes expressed at higher levels in aged mice under the conditions indicated are in blue (top), while genes with reduced expression in aged mice are in red (bottom). In (C), genes that respond more strongly to injury in aged mice are in blue (top), while genes with weaker injury response in aged mice are in red (bottom).
- https://cdn.elifesciences.org/articles/62232/elife-62232-supp1-v1.xlsx
-
Supplementary file 2
All significantly regulated genes in the tibial nerve of WT mice during aging and chronic denervation.
(A, B) Genes expressed at higher levels in aged mice under the conditions indicated are in blue (top), while genes with reduced expression in aged mice are in red (bottom). (C) Genes that respond more strongly to injury (3-day cut vs UI) in aged mice are in blue (top), while genes with weaker injury response are in red (bottom). (D) The 303 genes that are significantly expressed in young WT vs UI and aged c-Jun OE/+ vs UI 3 days after injury. (E) Genes expressed at higher levels after chronic denervation are in blue (top), while genes with reduced expression are in red (bottom). (F) The 227 genes that are significantly expressed in WT 1 week vs UI and c-Jun OE/+ 10 week vs UI.
- https://cdn.elifesciences.org/articles/62232/elife-62232-supp2-v1.xlsx
-
Supplementary file 3
138 genes regulated by c-Jun in injured nerves derived from Arthur-Farraj et al., 2012.
Blue (top) indicates genes expressed at higher levels in cut nerves of WT mice compared with nerves of mice with conditional c-Jun inactivation selectively in Schwann cells (92 genes), while red (bottom) indicates genes expressed at lower levels in cut WT nerves compared to c-Jun mutant nerves (46 genes).
- https://cdn.elifesciences.org/articles/62232/elife-62232-supp3-v1.xlsx
-
Supplementary file 4
The 15 most regulated genes in the tibial nerve during chronic denervation.
Genes expressed at higher levels after chronic denervation are in blue (top), while genes with reduced expression are in red (bottom).
- https://cdn.elifesciences.org/articles/62232/elife-62232-supp4-v1.xlsx
-
Transparent reporting form
- https://cdn.elifesciences.org/articles/62232/elife-62232-transrepform-v1.docx
Download links
A two-part list of links to download the article, or parts of the article, in various formats.
Downloads (link to download the article as PDF)
Open citations (links to open the citations from this article in various online reference manager services)
Cite this article (links to download the citations from this article in formats compatible with various reference manager tools)
Failures of nerve regeneration caused by aging or chronic denervation are rescued by restoring Schwann cell c-Jun
eLife 10:e62232.
https://doi.org/10.7554/eLife.62232


