A Non-stop identity complex (NIC) supervises enterocyte identity and protects from premature aging
- Rappaport Research Institute and Faculty of Medicine, Technion-Israel Institute of Technology, Israel
- Division of Pediatric Hematology and Oncology, Washington University, United States
- Department of Genetics, Developmental & Evolutionary Biology, School of Biological and Chemical Sciences University of Missouri, United States
- Department of the Control of Genetic Processes, Institute of Gene Biology Russian Academy of Sciences, Russian Federation
Figures
Figure 1 with 2 supplements
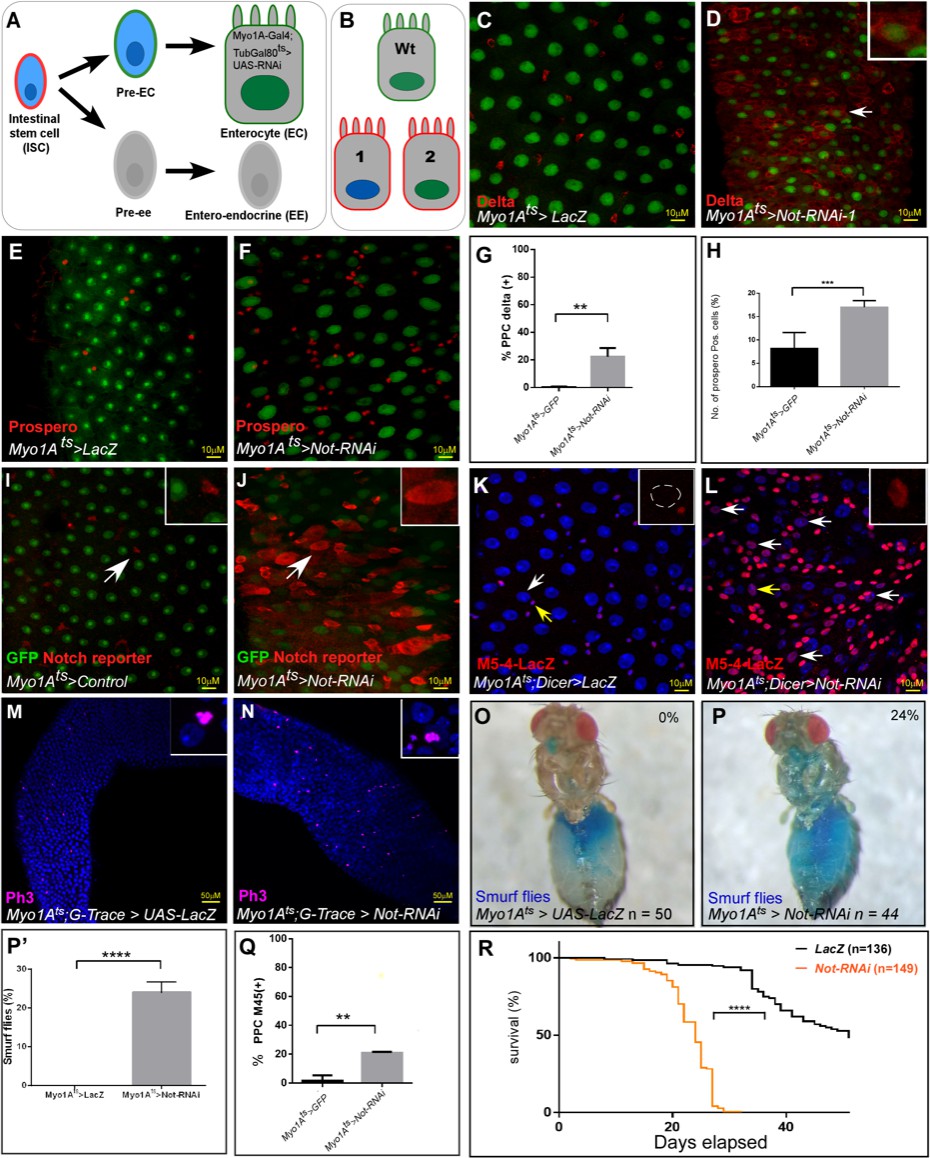
RNAi Screen identified Non-stop (Not) as an ECs identity supervisor.
(A) Schematic diagram of midgut differentiation and an outline of the Ub/UbL screen (see text for details). The Notch ligand, Delta, is expressed on the surface of Intestinal stem cells (ISC) marked in red. (B) Phenotypes expected from positive hits: 1. Loss of expression of EC-specific GFP (expressed only in fully differentiated ECs using MyoIA>Gal4/Gal80ts system), along with ectopic expression of the ISC marker Delta (red). 2. Polyploid cells that ectopically express Delta and retain expression of GFP. (C–F) Confocal images using UAS-LacZ (C, E) or UAS-Non-stop RNAi (D, F) along with UAS-GFP expressed under the control of MyoIA>Gal4/Gal80ts system. Scale bar is 10 μM. The stem cell marker Delta (C, D) and EE marker Prospero (E, F) are shown in red. (G, H) Quantification of three biological repeats of experiments similar to that shown in C-F. *(I, J) Expression of UAS-Non-stop RNAi, but not control, in ECs for 48 hr using MyoIA>Gal4/Gal80ts results in ectopic expression of the Notch-reporter (red) in polyploid cells. (K, L, Q) Expression of the escargot progenitor enhancer reporter M5-4-LacZ in control or Non-stop-targeted ECs (red). Yellow arrows points to cells shown in the insets. White arrows in L are examples of EC-like polyploid cells ectopically expressing the reporter. (M, N) Loss of Non-stop in ECs resulted in an increase in the mitosis marker p-H3 in small cells. (O, P, P’) Loss of Non-stop in ECs impairs gut integrity as evident by the leakage of blue-colored food into the abdomen (smurf assay); 24% of Non-stop-RNAi flies show loss of gut integrity versus 0% in control flies (n = 50, 44 respectively, p<0.0001) (Q) Quantification of M5-4 positive PPCs in control and upon targeting Non-stop in ECs. (*** = p<0.001 **p<0.01). (R) Survival analysis of flies expressing the indicated transgenes in ECs under the control of MyoIA-Gal4/Gal80ts (Log-rank test ****=p<0.0001).
-
Figure 1—source data 1
Summary of the screen Ub/UbL screen results.
- https://cdn.elifesciences.org/articles/62312/elife-62312-fig1-data1-v2.xlsx
-
Figure 1—source data 2
Results of primary and secondary transgenic RNAi screens.
- https://cdn.elifesciences.org/articles/62312/elife-62312-fig1-data2-v2.xlsx
Figure 1—figure supplement 1
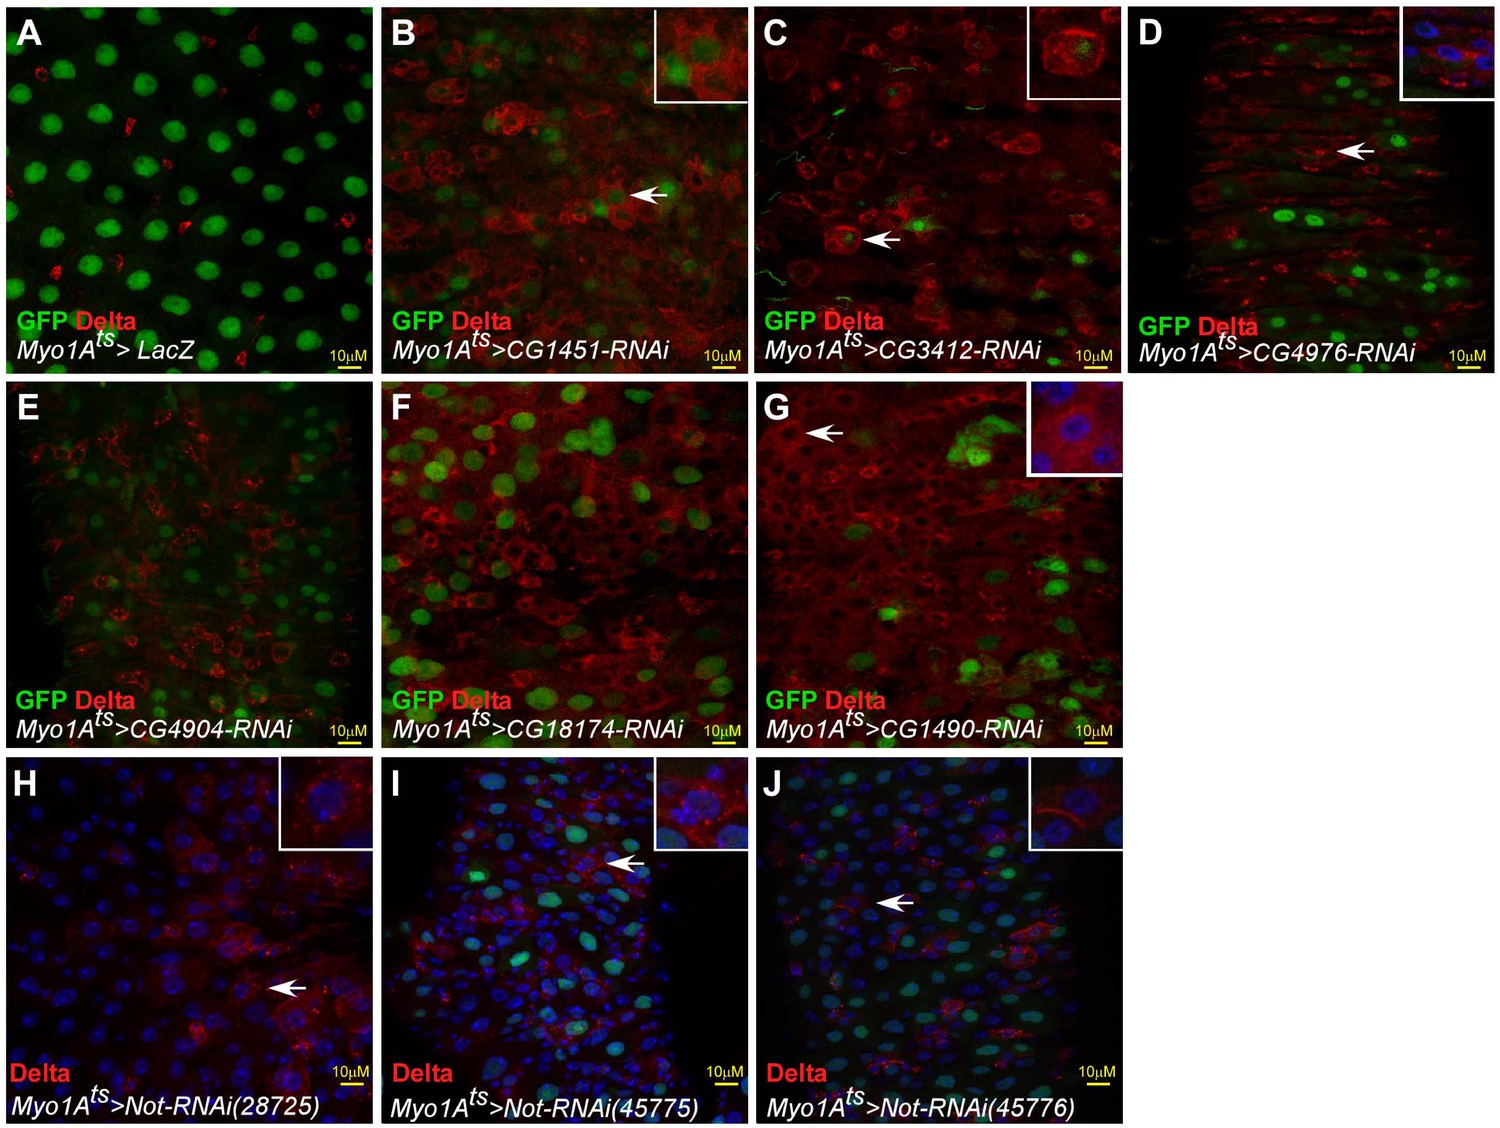
Examples of positive hits of the Ub/UbL screen.
(A–J) Confocal images of the midgut tissue and the indicated transgenes expressed in ECs using the MyoIA-Gal4/Gal80ts. White arrows indicate cells shown in insets. Scale bar is 10 μM MyoIA>UAS-GPF marks fully differentiated ECs, Delta is shown in red, and DAPI (blue) marks DNA. (A-G) Examples of positive hits from the screen. (H–J) Loss of Non-stop in ECs using three independent UAS-RNAi transgenic lines results in loss of EC identity.
Figure 1—figure supplement 2
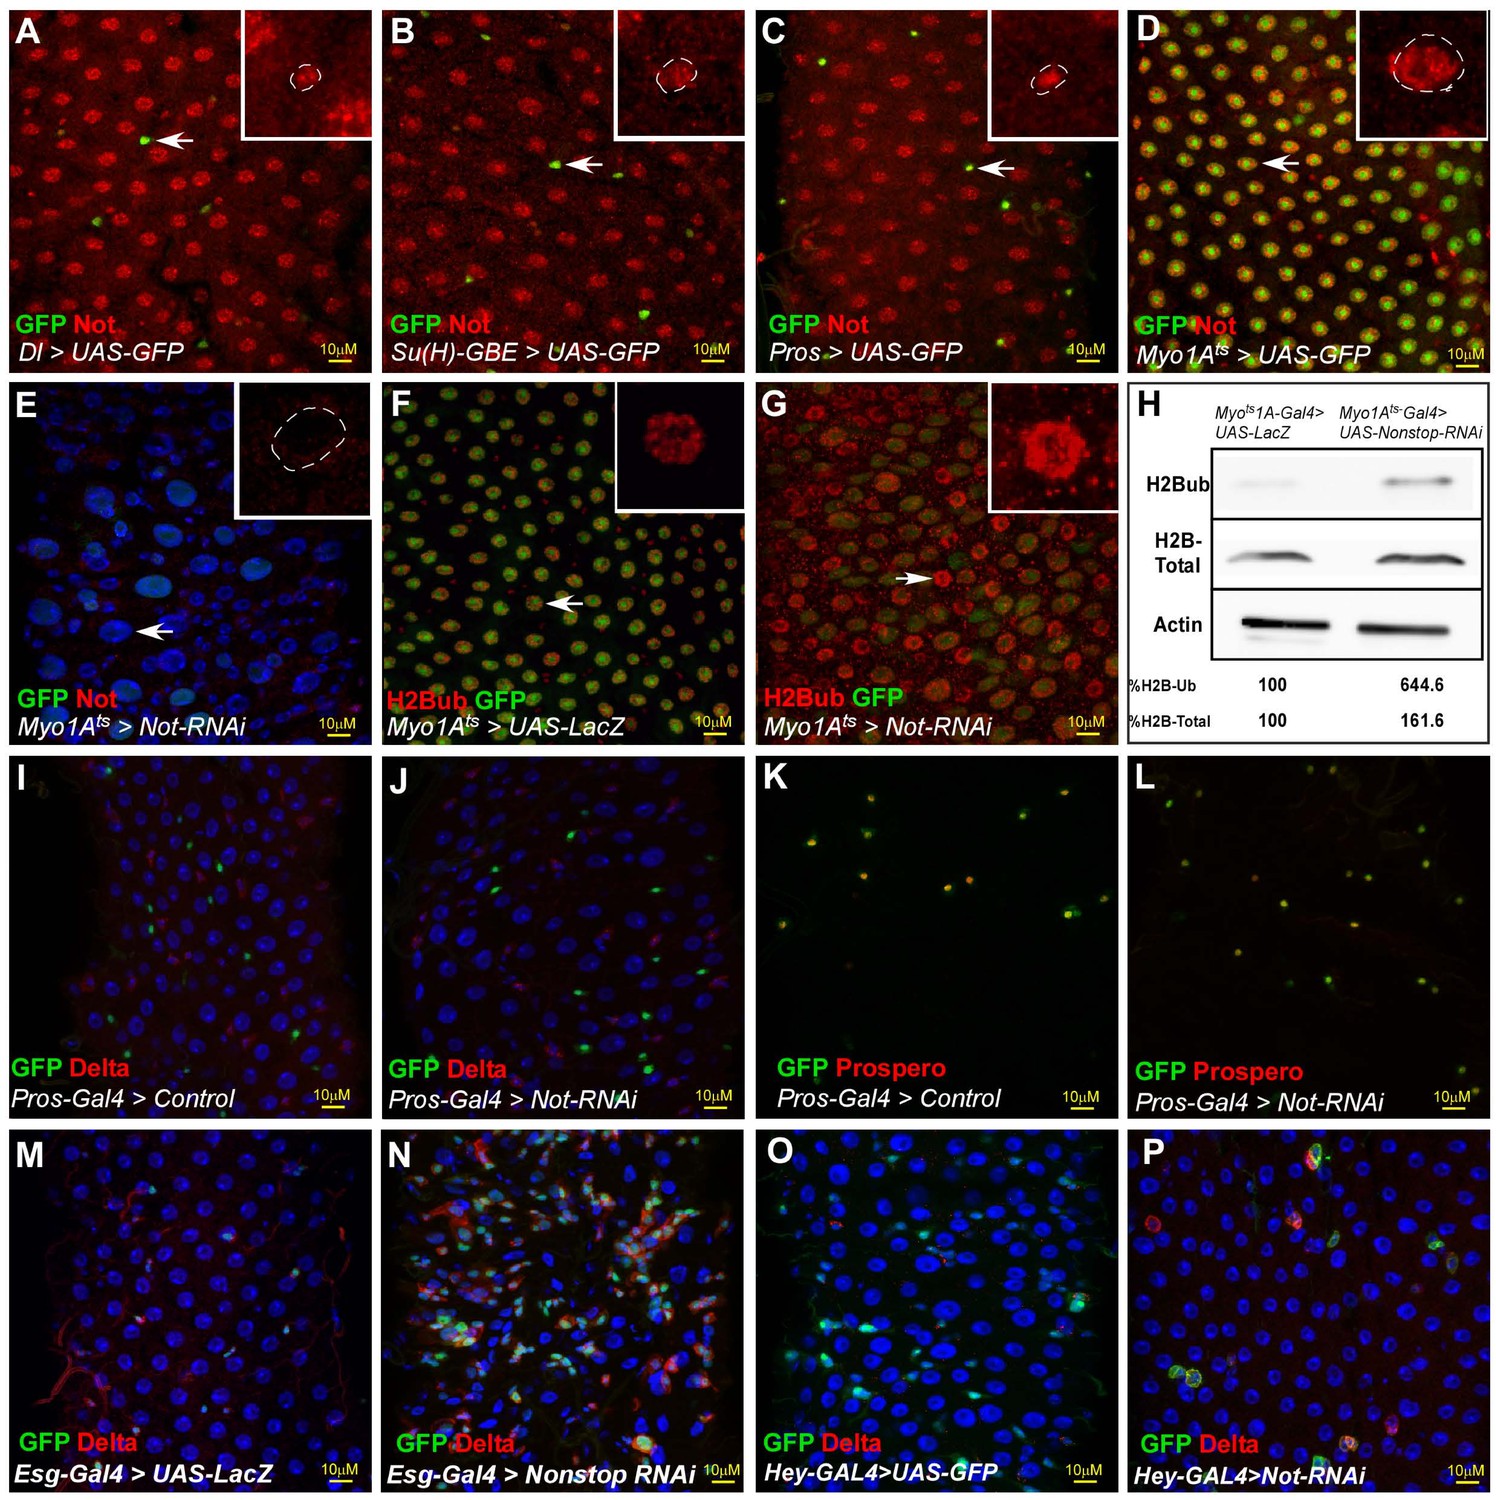
Characterization of Non-stop in midgut cells (A–G).
(A–G)Confocal images of the midgut tissue and the indicated transgenes expressed in EC using the MyoIA-Gal4/Gal80ts. (A–D) Non-stop is expressed in all midgut cells. Expression of endogenous Non-stop protein (red) was tested relative to the expression of UAS-GFP that was expressed under the cell-specific GAL4 drivers: Dl>GAL4 (ISC); Su(H)>Gal4 (EBs); Prospero Gal4 (EE’s) and MyoIA>Gal4 (ECs). Arrow point to cells shown in insets. (E) Expression of Non-stop upon activating UAS-Non-stop-RNAi in ECs. (F, G) Level of H2Bub (red) in midguts expressing the control (F), or UAS-Non-stop-RNAi (G) in ECs using the MyoIA>Gal4, UAS-GFP system. (H) Western-blot analysis of H2Bub and H2B in midgut derived extracts of the indicated genotypes. Actin serves as a loading control. (I–L) Expression of Delta (I, J, red) or Prospero (K, L, red) in midguts expressing control (I, K) or the UAS-Non-stop RNAi (J, L) in EE using prospero>GAL4ts, UAS-GFP system. (M–P) Expression of Delta (red) in midguts expressing control (M, O) or the UAS-Non-stop RNAi (N, P) in progenitor cells using esg>GAL4ts, UAS-GFP system (M, N), or predominantly in EBs using Hey GAL4ts, UAS-GFP (O,P). Scale bar is 10 μM.
Figure 2 with 3 supplements

G-TRACE-Lineage characterization of Non-stop targeted young ECs and, aged ECs.
(A) Schematic diagram of EC-G-TRACE-lineage tracing system adapted from Flint Brodsly et al., 2019. PPC** (RFP-GFP+), are EC that are no-longer differentiated. PPC* (RFP-GFP-) are miss-differentiated progenitors. (B–Q) Confocal microscopy of midguts expressing the indicated transgenes, under the control of MyoIAts G-TRACE system using the indicated antibodies. DAPI (blue) marks DNA. Arrows point to cells shown in the insets with individual far-RFP, RFP and GFP channels. scale bar is 10 μM. (B–G) G-TRACE of EC in control young midgut expressing either UAS-LacZ (B, D, F), or UAS-Non-stop- RNAi (C, E, G). Arrows point to cells shown in the insets with individual far-RFP, RFP and GFP channels. (H–I) Expression of Delta (purple) on the surface of the indicated PPCs. Numbered cells are shown in (I) with individual channels dashed circle outlines the nucleus. (J) G-TRACE-based quantification of PPC types (wildtype, PPC* PPC**) observed in control midguts or where Non-stop was targeted ECs. (K–Q) Confocal microscopy of midguts expressing MyoIAts> G-TRACE system using the indicated antibodies. (B, L, N, P) G-TRACE of EC in young, and (K, M, O, Q) old midguts. (R) Quantification of indicated PPCs expressing Odd-Skipped, and Delta similar to experiments shown in L-O (**** = p<0.0001).
-
Figure 2—source data 1
Quantification data for Figure 2J and R,.
- https://cdn.elifesciences.org/articles/62312/elife-62312-fig2-data1-v2.xlsx
Figure 2—figure supplement 1
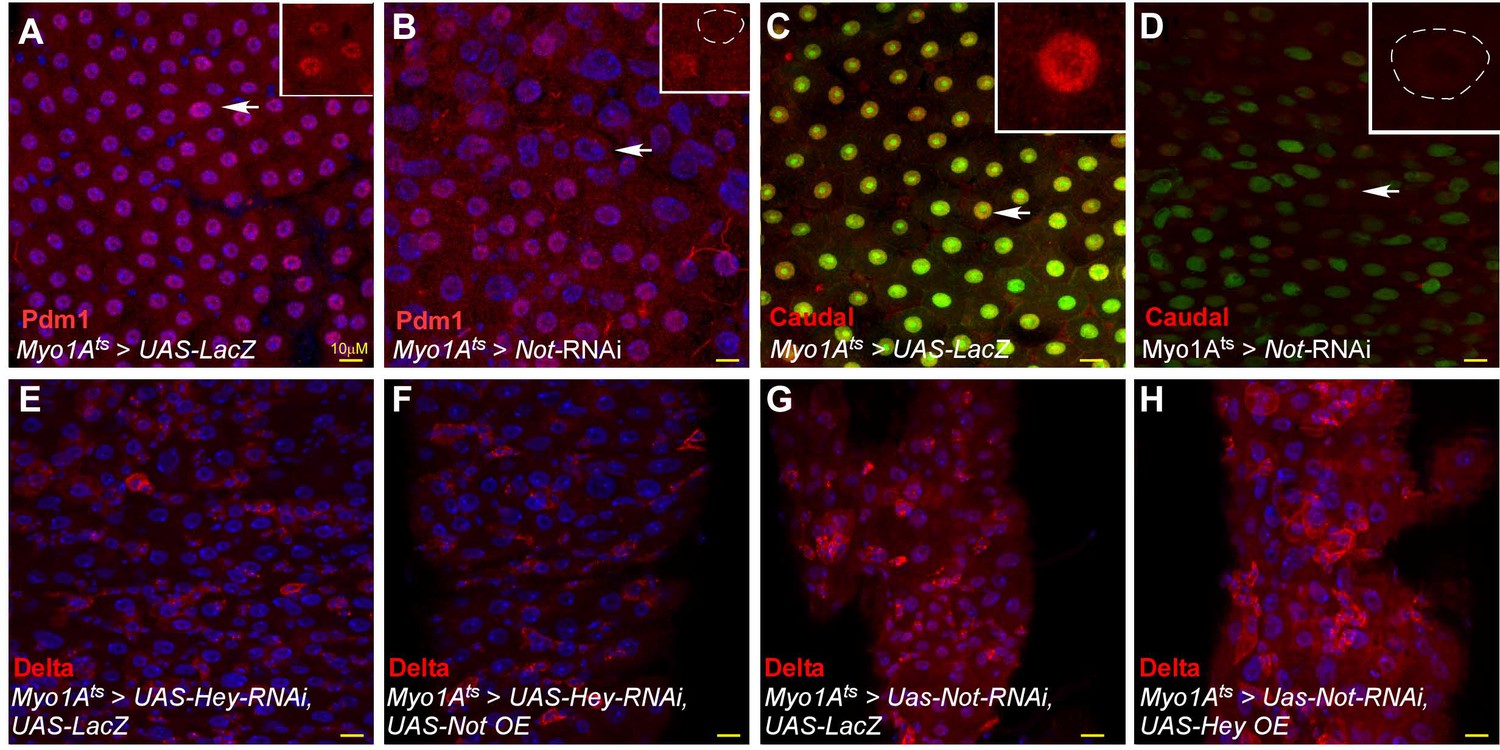
Non-stop is required for expression of EC transcription factors, and epistatic studies with Hey (A–H).
(A–H)Confocal images of the midgut tissue and the indicated transgenes expressed in EC using the MyoIA-Gal4/Gal80ts. DAPI marks DNA and Scale bar is 10 μM. (A, B) anti-Pdm1 (C, D) anti-Caudal Arrows point to cells shown in the inset. Scale bar is 10 μM. (E–F) Co-expression of Non-stop does not suppress the loss of identity and ectopic Delta expression observed upon loss of Hey in ECs. (G, H) Co-expression of Hey does not suppress the loss of identity and ectopic Delta expression observed upon loss of Non-stop in ECs.
Figure 2—figure supplement 2
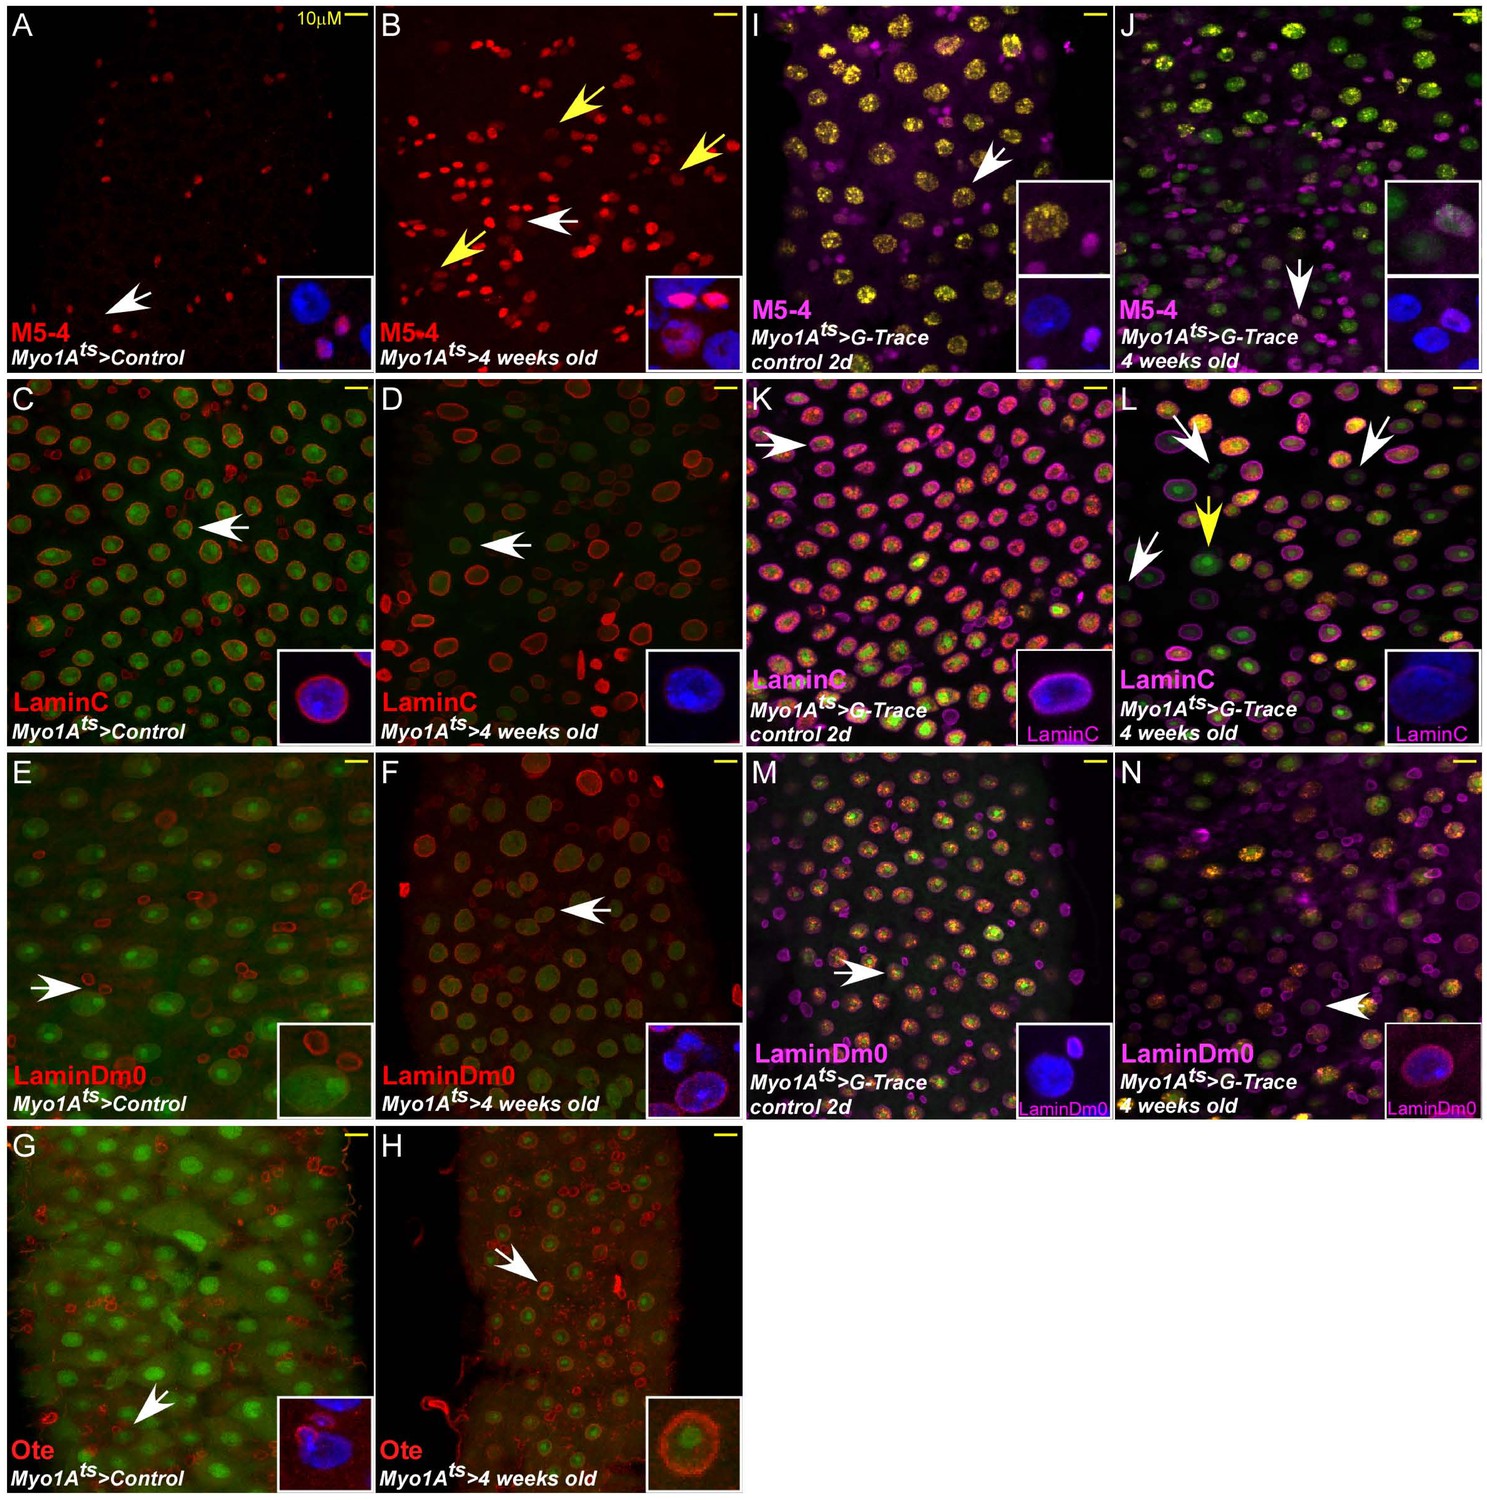
Miss-regulation of enhancers activity and nuclear Lamins in aged enterocytes.
(A–N) Confocal images with the indicated antibodies of adult Drosophila midgut epithelium expressing the indicated transgenes, DAPI marks DNA, and scale bar is 10 μm. (A–H) transgenic lines expressing UAS-GFP under the control of the EC- specific promoter MyoIA-GAL4/Gal80ts system. (I–P) Transgenic lines expressing G-TRACE system under the control of the enterocyte specific promoter MyoIAts system. The expression of M5-4::LacZ stem cells enhancer of esg gene is shown in A, B, I, and J. The protein level and distribution of the indicated protein is shown; LamC expression (C, D, K, L). Lamin Dm0 (LamDm0), E, F, M, N., and Otefin (Ote) protein level in control young ECs or old (G, H).
Figure 2—figure supplement 3
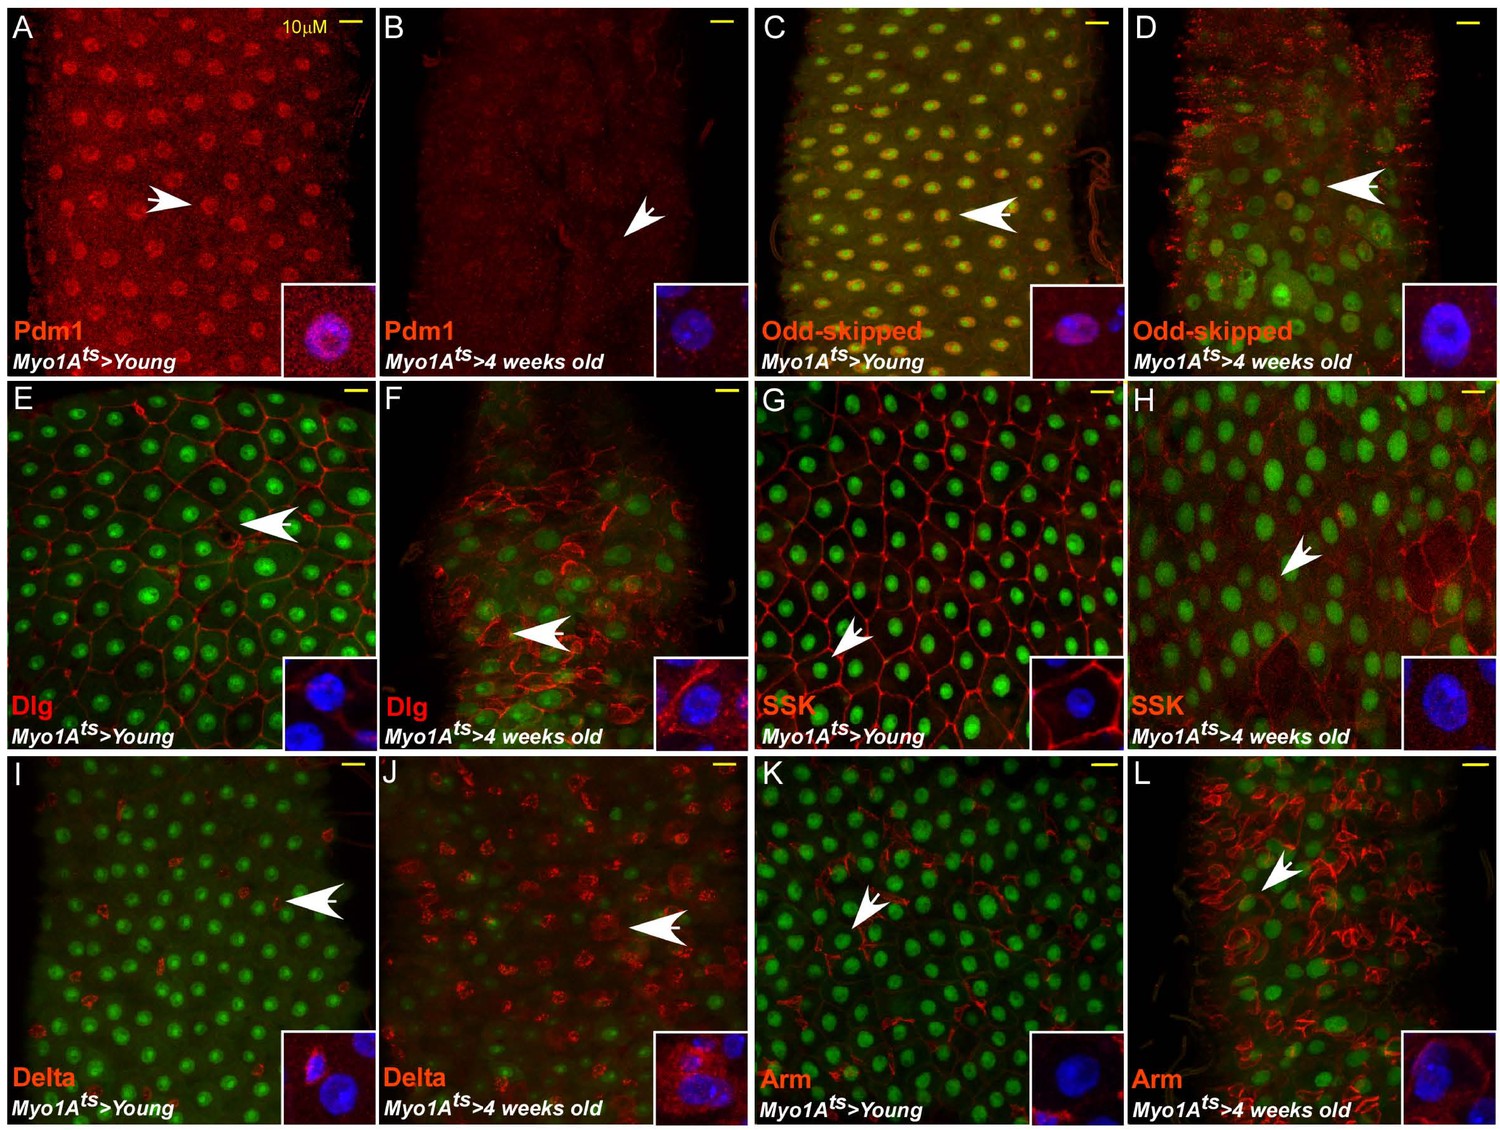
Hallmarks of aging in the Drosophila midgut (A–L).
(A–L) Confocal images of indirect immunofluorescence staining with the indicated antibodies of adult Drosophila midgut intestinal epithelium expressing termed MyoIAts. Scale bar is 10 μm. (A, C, E, G, I, K): Young mid-guts (four days old adults). (B, D, F, H, J, L) Four weeks old guts. DAPI marks DNA and arrows indicates cells shown in the insets. SSK; Snake Skin; Arm, Armadillo; Dlg, Disc large.
Figure 3 with 1 supplement
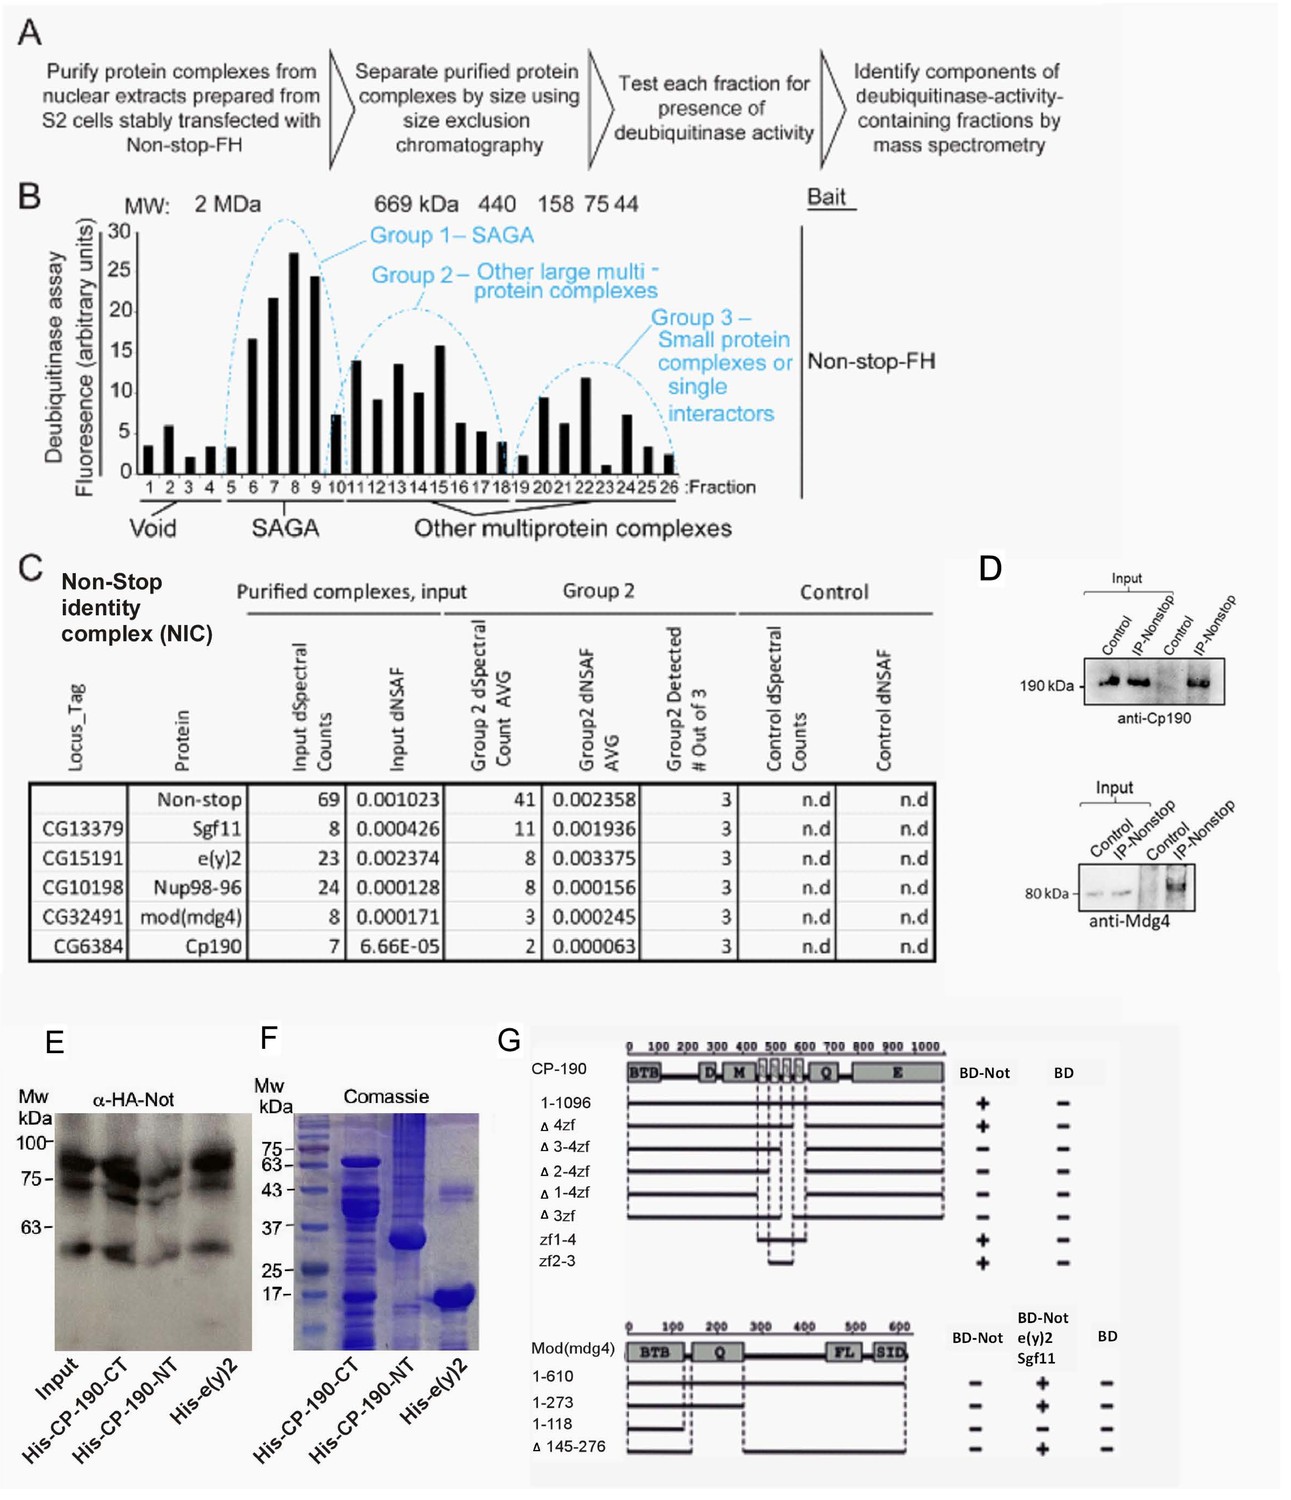
Identification of a Non-stop-identity complex (NIC).
(A–C) Purification scheme of nuclear Not-associated complexes from Drosophila S2 cells. (see text and methods; Reproduced from Figure 1B and E, Cloud et al., 2019), eLife, published under the Creative Commons Attribution 4.0 International Public License (CC BY 4.0; https://creativecommons.org/licenses/by/4.0/). (B) Identification of Not-associated isopeptidase activity proteins by immunoprecipitation followed by size fractionation and mass-spectrometry. CP190, Mod (mdg4), Nup96-98, and E(y)two were all present in Group 2. Not-FH; IP with full length Not FLAG-HA tagged (C) Summary of protein complexes isolated identified by mass-spectrometry (D, E) Not binds to the C-terminal portion of CP190 and to E(y)2. (D) Immunoprecipitation confirms Non-stop specifically interacts with NIC subunits Cp190 and Mdg4. Endogenous Non-stop was immunoprecipitated from whole cell extracts prepared from adult OregonR flies using an α-Non-stop antibody. Control immunoprecipitations were performed with α-guinea-pig IGG. The presence of NIC subunits was assayed by immunoblotting with antibodies specific for Cp190 or Mdg4 as indicated. (E) Western-blot of in vitro binding between HA-Not derived from S2 cell extract and the indicated bacterially expressed purified His-tagged proteins. 10% input is shown. (F) Coomassie blue staining of the indicated bacterially expressed His-tagged proteins used in the binding assay in (E). (G) Upper panel: Schematic diagram of Y2H interaction assay between CP190 and Non-stop. Different fragments of CP190 were fused to the activation domain (AD) of GAL4 and tested for interaction with Non-stop fused to the DNA-binding domain (BD) of GAL4. Protein domains of full-length CP190 are indicated as boxes, and lines represent the different deletion fragments. Zf denote zinc-fingers; BTB, BTB/POZ domain; D, aspartic acid -rich region; M, microtubule-interacting region; E, acid glutamate-rich region of CP190. The results are summarized in columns on the right (BD-Not and BD alone), with the ‘+” and “- “signs denotes presence and absence of interaction, respectively. Lower panel: Schematic diagram of Y2H and Y4H interaction assay between Mod(mdg4) and Non-stop. Different fragments of Mod(mdg4) were fused to the activation domain (AD) of GAL4 and tested for interaction with Non-stop fused to the DNA-binding domain (BD) of GAL4 and complex of BD-Non-stop with Eny2 and Sgf11. Protein domains of full-length Mod(mdg4) are indicated as boxes, and lines represent the different deletion fragments. BTB, BTB/POZ domain; Q, glutamine-rich region; FL, FLYWCH-type zinc finger domain; SID, Su(Hw) interaction domain. The results are summarized in columns on the right (BD-Not, BD-Not/Eny2/Sgf11 and BD alone), ‘+” and “- “signs denotes presence and absence of interaction, respectively.
-
Figure 3—source data 1
Proteomic analysis of Non-stop bound proteins.
- https://cdn.elifesciences.org/articles/62312/elife-62312-fig3-data1-v2.xlsx
Figure 3—figure supplement 1
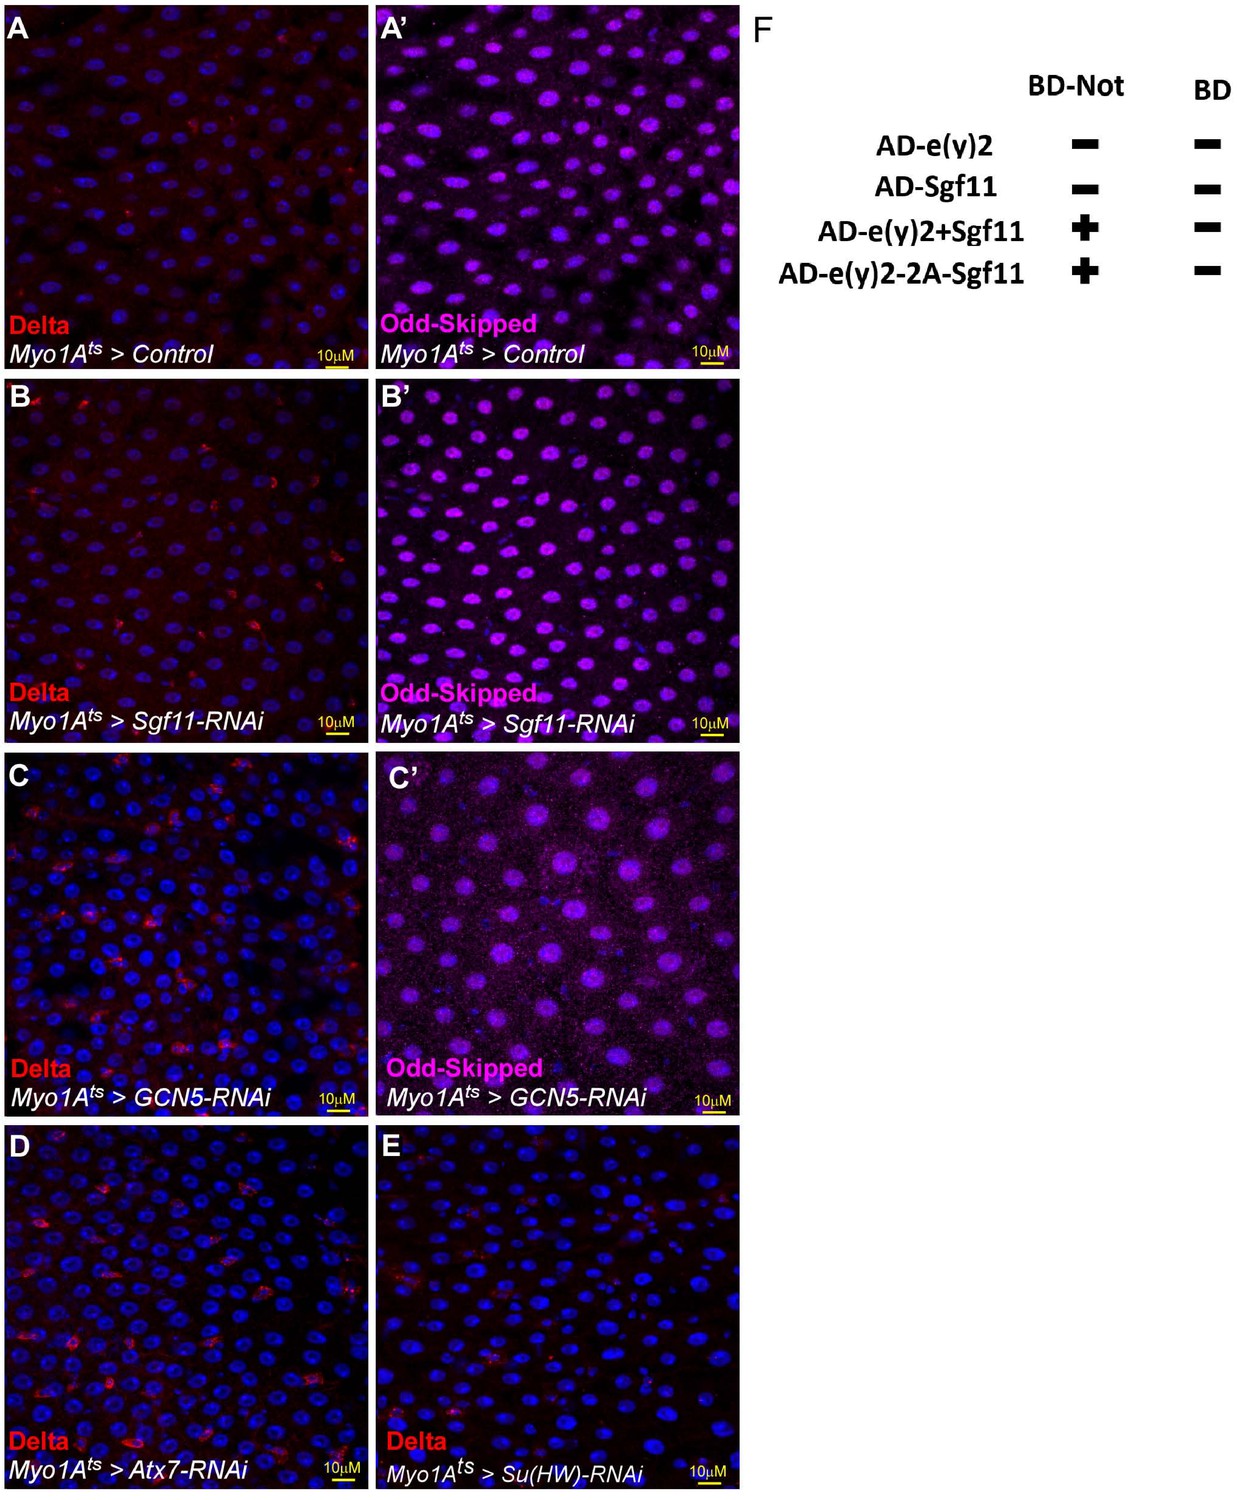
SAGA subunits and Su(Hw) do not regulate EC identity.
(A–E) Confocal images of the midgut tissue and the indicated transgenes expressed in EC using the MyoIA-Gal4/Gal80ts. (A–E) anti-Delta (A’–C’) anti-Odd-skipped. (A, A’) UAS-LacZ, (B, B’) UAS-Sgf11-RNAi; (C, C’) UAS GCN5-RNAi, (D) UAS-Atx7 RNAi (E) UAS-Su(Hw)- RNAi. DAPI marks DNA, Scale bar is 10 μM. (F) Schematic diagram of Y3H interaction assay between Eny2, Sgf11 and Non-stop. Full-sized Eny2 and Sgf11 were fused to the activation domain (AD) of GAL4 and tested for interaction with Non-stop fused to the DNA-binding domain (BD) of GAL4 in Y2H. In a simple Y2H we did not observe any interaction. Y3H assay demonstrated assembly of tertiary Eny2-Sgf11-Non-stop complex. Y3H was combined in two variants: 1 – BD-Non-stop, AD-Eny2 and Sgf11 (as additional plasmid); 2 - BD-Non-stop and AD-Eny2-2A-Sgf11 (plasmid coding fusion protein consisting of AD-Eny2 and Sgf11 separated by a self-cleavage 2A-peptide). The results are summarized in columns on the right (BD-Not and BD alone), with the ‘+” and “- “signs denotes presence and absence of interaction, respectively.
Figure 4
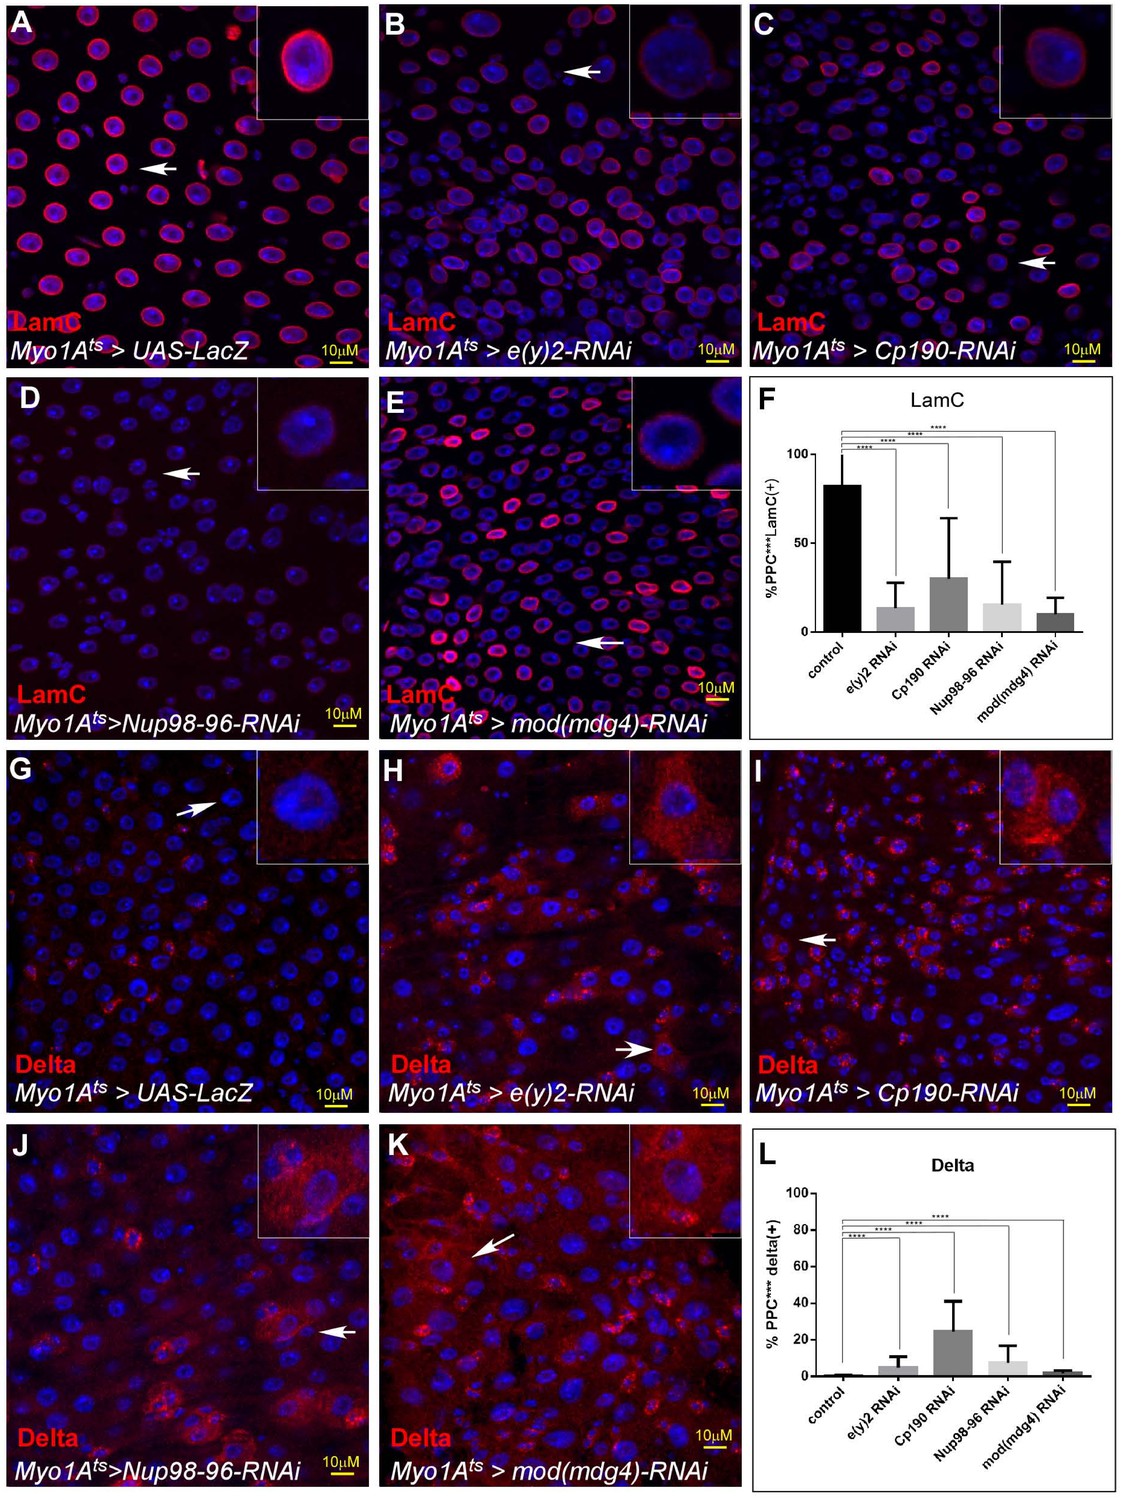
Non-stop identity complex (NIC) regulates EC identity.
Confocal images of the midgut tissue using the indicated antibodies; (A–E) LamC, (G–K) Delta, DAPI marks DNA (blue). The indicated transgenes were expressed in EC using the MyoIA-Gal4/Gal80ts system for forty-eight hours. (A, G) UAS-LacZ (B, H) UAS-e(y)2-RNAi; (C, I) UAS-CP190-RNAi;. (D, J) Nup98-96 (E, K) Mod (mdg4) White arrows points to cells shown in insets, and scale bar is 10 μM. Quantification is shown in (F) for LamC. and (L) for Delta.
-
Figure 4—source data 1
Quantification of cell populations described in 4F, 4L.
- https://cdn.elifesciences.org/articles/62312/elife-62312-fig4-data1-v2.xlsx
Figure 5 with 2 supplements
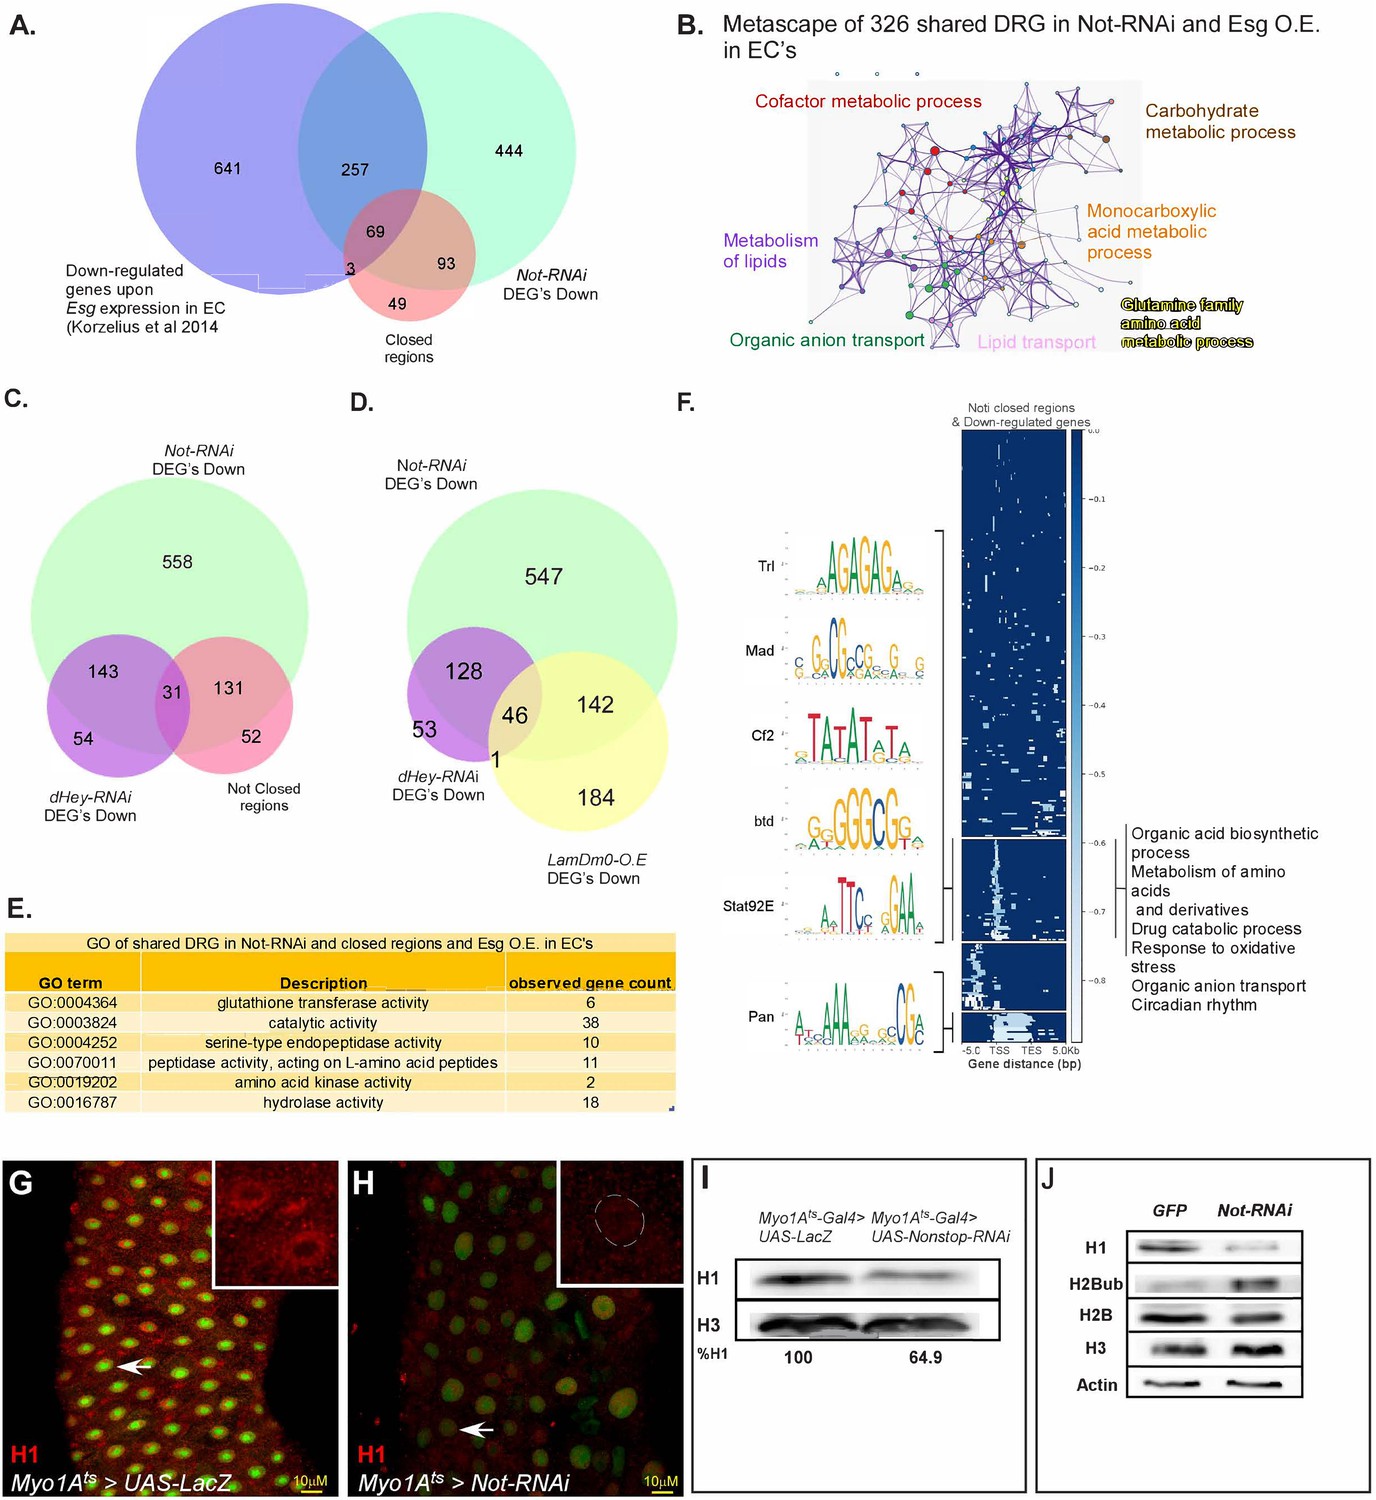
Not regulates EC-gene expression and is required for chromatin accessibility.
(A) Venn diagram comparing EC-related genes (Blue; Korzelius et al., 2014), genes exhibiting reduced expression upon loss of Not in ECs (Green), and chromatin regions with reduced accessibility upon loss of Not in ECs identified by ATAC-seq (Orange). (B) Metascape analysis of shared Non-stop-down-regulated genes and Esg over-expression in ECs. (C) Venn diagram comparison of genes that exhibit reduced expression upon loss of either Non-stop or Hey in ECs, as well as genes in the vicinity of regions showing reduced accessibility upon loss of Non-stop. (D) Venn diagram of genes that exhibit reduced expression upon loss of Non-stop or Hey and of genes with reduced expression upon over expression of LamDm0 in ECs (E) GO analysis of genes downregulated by loss of Non-stop in and Esg over-expression in ECs exhibiting reduced accessibility. Observed gene count; number of genes identified from this group in both ATAC-seq and RNA-seq (F) Genome-wide alignment and MEME analysis of regions with reduced accessibility in the vicinity of down-regulated genes upon loss of Non-stop in ECs. TSS, transcriptional start site; TES, transcription end site. (G–H) Confocal images of the midgut tissue using α-Histone H1 (red), and expressing the indicated transgenes in ECs using the MyoIA-Gal4/Gal80ts system for forty-eight hours, DAPI marks DNA (blue). (G) UAS-LacZ (control) (H), UAS-Non-stop RNAi. Scale bar is 10 μM. (I, J) western-blot analysis of the indicated proteins derived from gut extract (I), or S2 Drosophila cell extract (J) Histone H3 and Actin serve as loading controls.
-
Figure 5—source data 1
RNA-seq of Non-stop-regulated genes.
- https://cdn.elifesciences.org/articles/62312/elife-62312-fig5-data1-v2.xls
-
Figure 5—source data 2
ATAC-seq profiling of non-stop dependent changes in chromatin accessibility.
- https://cdn.elifesciences.org/articles/62312/elife-62312-fig5-data2-v2.xlsx
Figure 5—figure supplement 1
Analysis of Not-related RNA-seq and ATAC-seq.
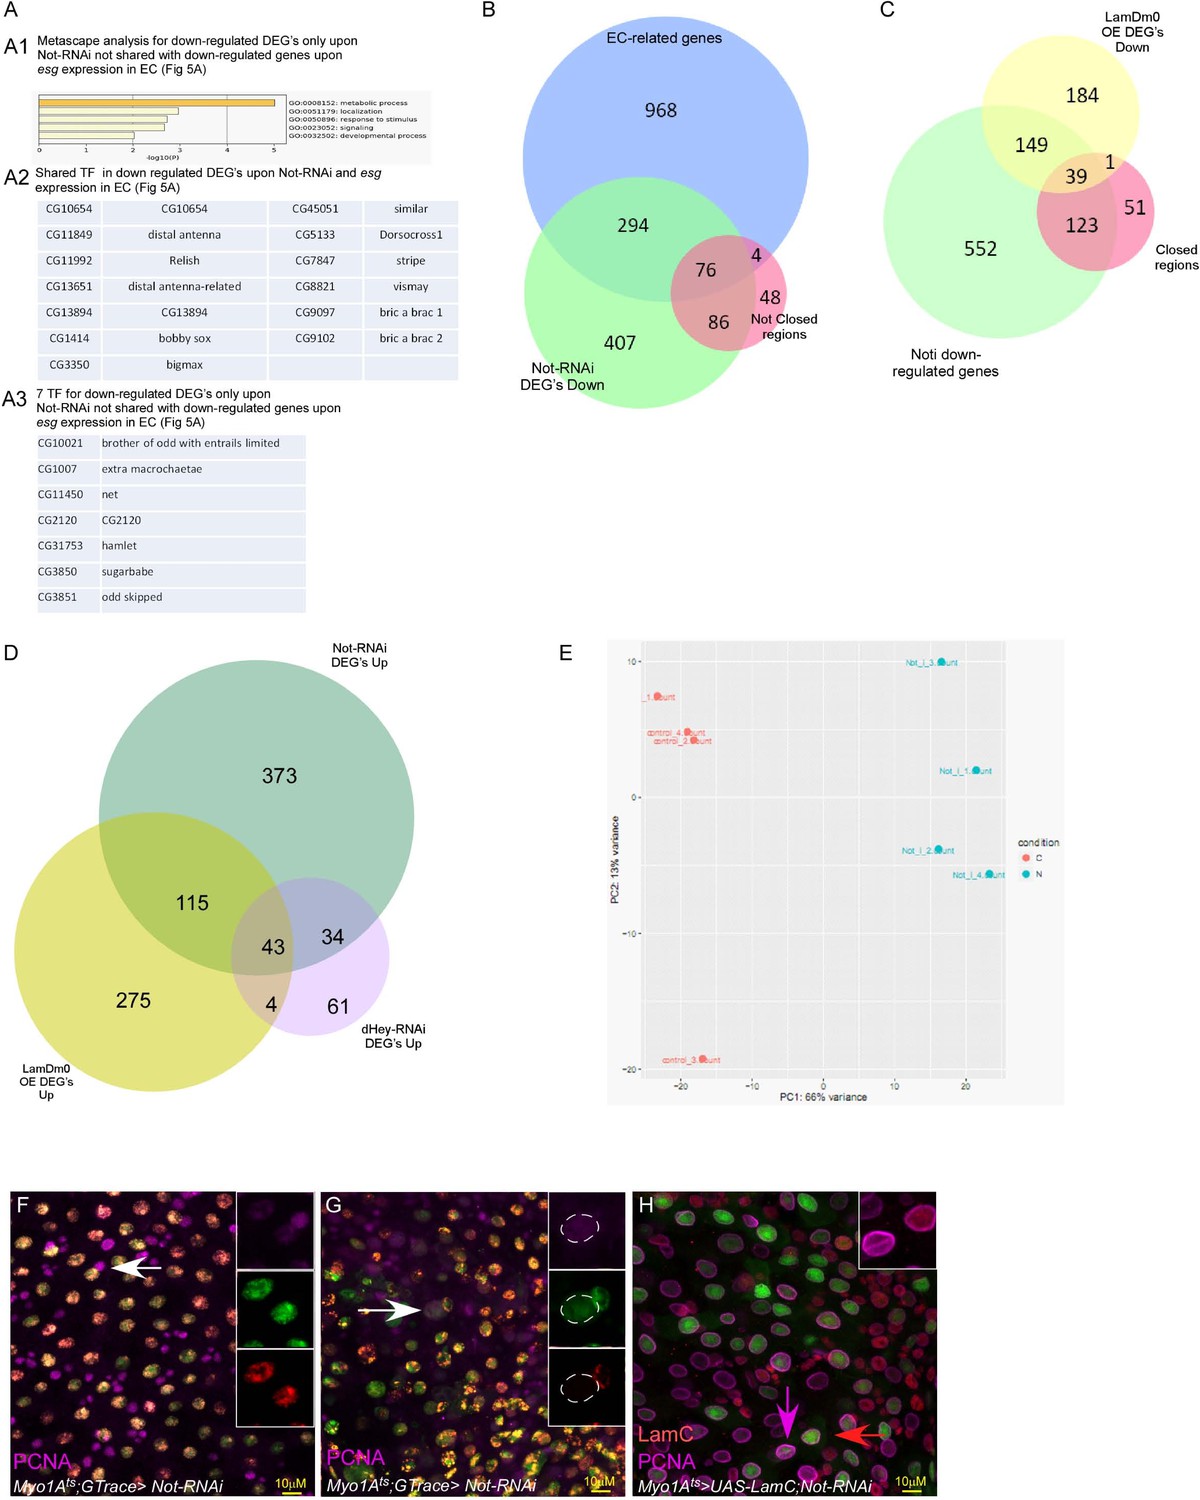
(A) (A1) Metascape analysis of biological process in genes exhibiting reduce expression upon loss of non-stop in ECs and not over expression of progenitor TF Escargot in ECs. (A2) List of shared transcription factors that exhibited reduced expression either upon loss of non-stop in ECs and expression of progenitor TF Escargot in ECs.(A3) List of transcription factors that exhibited reduced expression either upon loss of non-stop in ECs not affected by expression of the progenitor TF Escargot in ECs. (B) Venn diagram comparing genes exhibiting enriched expression in differentiated gut cells (Blue), genes exhibiting reduced expression upon loss of Not in ECs (Green), and chromatin regions with reduced accessibility upon loss of Not in ECs identified by ATAC-seq (Orange). Venn diagram comparison of genes that exhibit reduced expression upon loss of either Not or expression of LamDm0 ECs, and EC-expressed genes (C) Venn diagram comparison of genes that exhibit reduced expression or accessibility upon loss of Not, and genes with reduced expression upon over expression of LamDm0. (D) Venn diagram comparison of genes that exhibit upregulation in expression upon loss of either Not or Hey in ECs or over-expression of LamDm0 in ECs. (E). Three principle components analysis of RNA-seq.(F–H) Expression of LamC suppresses the ectopic expression of proliferating cell nuclear antigen (PNCA)) isopropyl β-d-1-thiogalactopyranoside (IPTG)) in EC that are no longer differentiated (PCC**). Confocal images of the midgut tissue using the indicated antibodies. (F–G) G-TRACE analysis; (F) Control ECs (expressing UAS-LacZ) do not express PCNA, and are both RFP(+) GFP(+). (G) PPC** are GFP(+) and RPF(-) (PPC **) and express PCNA (purple). Arrow points to cells shown in the insets (individual channels). (H) ECs where Non-stop was eliminated using the MyoIA-Gal4/Gal80ts system for forty-eight hours ectopically express PCNA (purple), but not in cells that co-express UAS-LamC. Example of two cells is shown; the purple and red arrows point to the cells shown in the inset; The left cell exhibits high level of LamC (red) and low level of PCNA (purple), and the right cell exhibit low level of LamC and high level of PCNA.
Figure 5—figure supplement 2
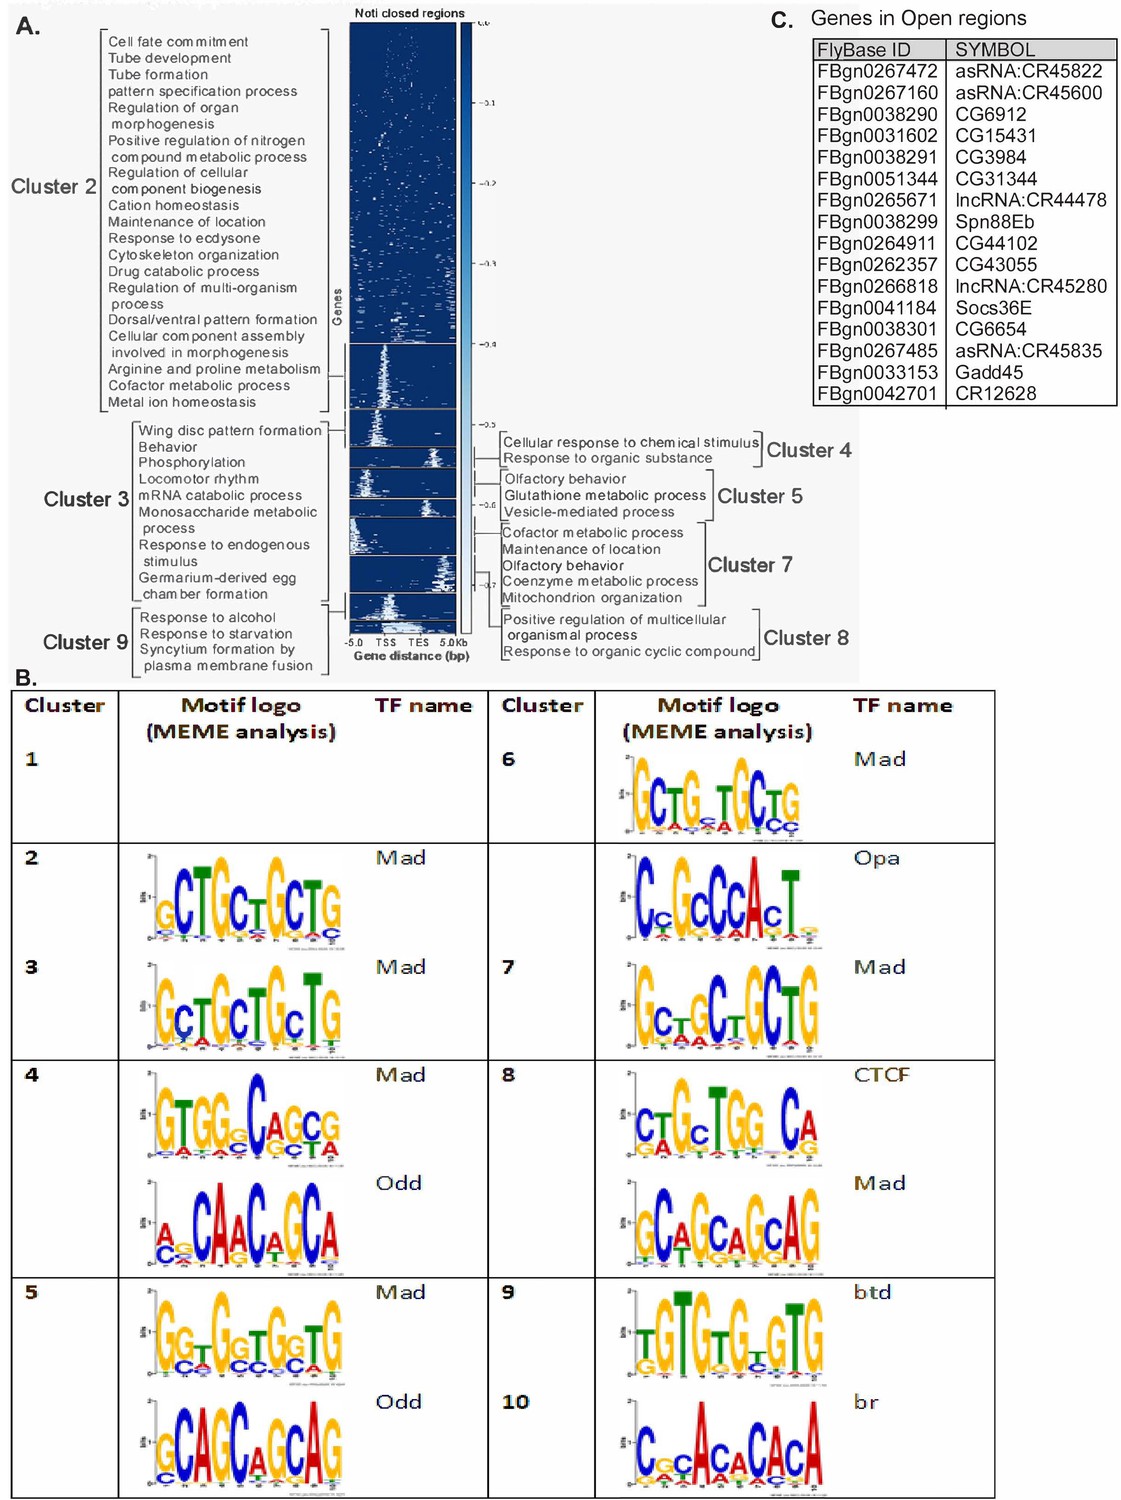
Analysis of changes in chromatin actability upon loss of Not.
(A) Whole genome changes in chromatin accessibility unveiled by ATAC seq divided to clusters by location along gene regions and GO ontology of each cluster. (B) MEME analysis of cluster -enrichment in DNA binding sequences associated with the indicated TFs. (C) List of all genes in the vicinity of regions that exhibit increased accessibility upon loss of Non -stop in ECs.
-
Figure 5—figure supplement 2—source data 1
Gene clustering of Non-stop closed regions (complement Figure 5—figure supplement 2).
- https://cdn.elifesciences.org/articles/62312/elife-62312-fig5-figsupp2-data1-v2.xlsx
Figure 6 with 1 supplement

Non-stop maintains the protein level and intranuclear localization the NIC subunits, (A–H).
(A–H) Representative confocal images of the midgut tissue using the indicated antibodies (red) and expressing the indicated transgenes in EC using the MyoIA-Gal4/Gal80ts system. UAS-LacZ (A, C, E, G), UAS-Non-stop RNAi (B, D, F, H). DAPI marks DNA (blue), and scale bar is 10 μM. White arrows points to cells shown in insets, and scale bar is 10 μM. (I–L) Quantification of 3 biological experiments is shown (M–T) Non-stop regulate large-scale organization of the nucleus. Representative confocal images of the midgut tissue using the indicated antibodies (red) and expressing the indicated transgenes in EC using the MyoIA-Gal4/Gal80ts system. UAS-LacZ (M–P), UAS-Not RNAi (Q–T).
-
Figure 6—source data 1
Quantification of cell populations described in 6I-L.
- https://cdn.elifesciences.org/articles/62312/elife-62312-fig6-data1-v2.xlsx
Figure 6—figure supplement 1
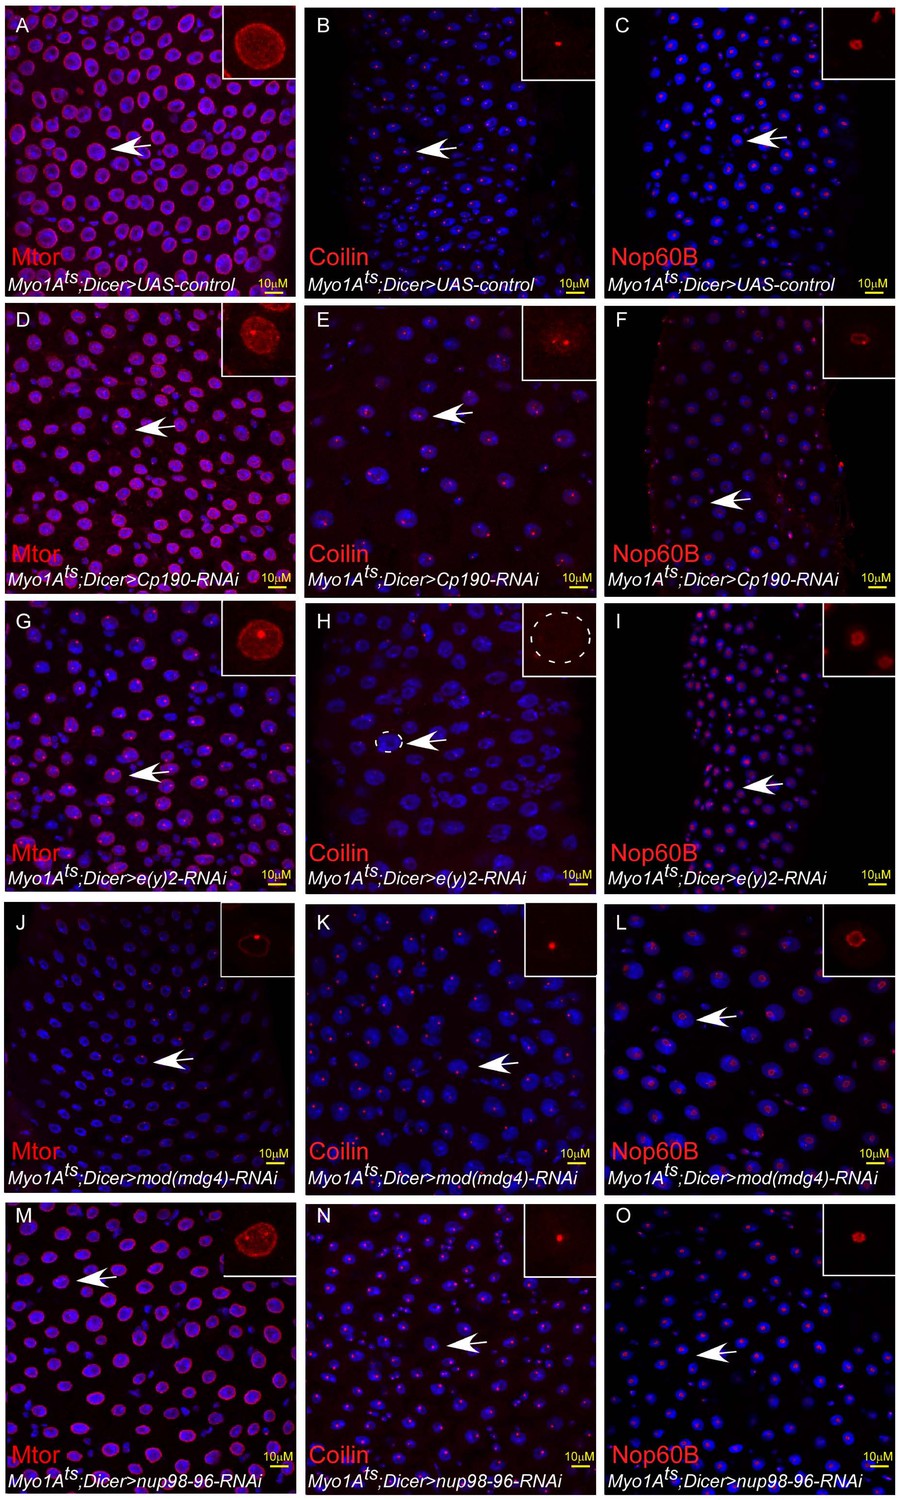
NIC subunits are required for maintaining large-scale organization of the EC nucleus.
(A–O) Confocal images of the midgut tissue using the indicated antibodies (red) and expressing the indicated transgenes in EC using the MyoIA-Gal4/Gal80ts system, DAPI marks DNA (blue) and scale bar is 10 μM M (A, D, G, J, M) Mtor; (B, E, H, K, N) Coilin (C, F, I, L, O) Nop60B; (A–C) Control, (D–F) UAS-Cp190 RNAi; (G–I) UAS-e(y)2 RNAi (J–L) Mod(Mdg4) RNAi (M–O) Nup98-96 RNAi.
Figure 7
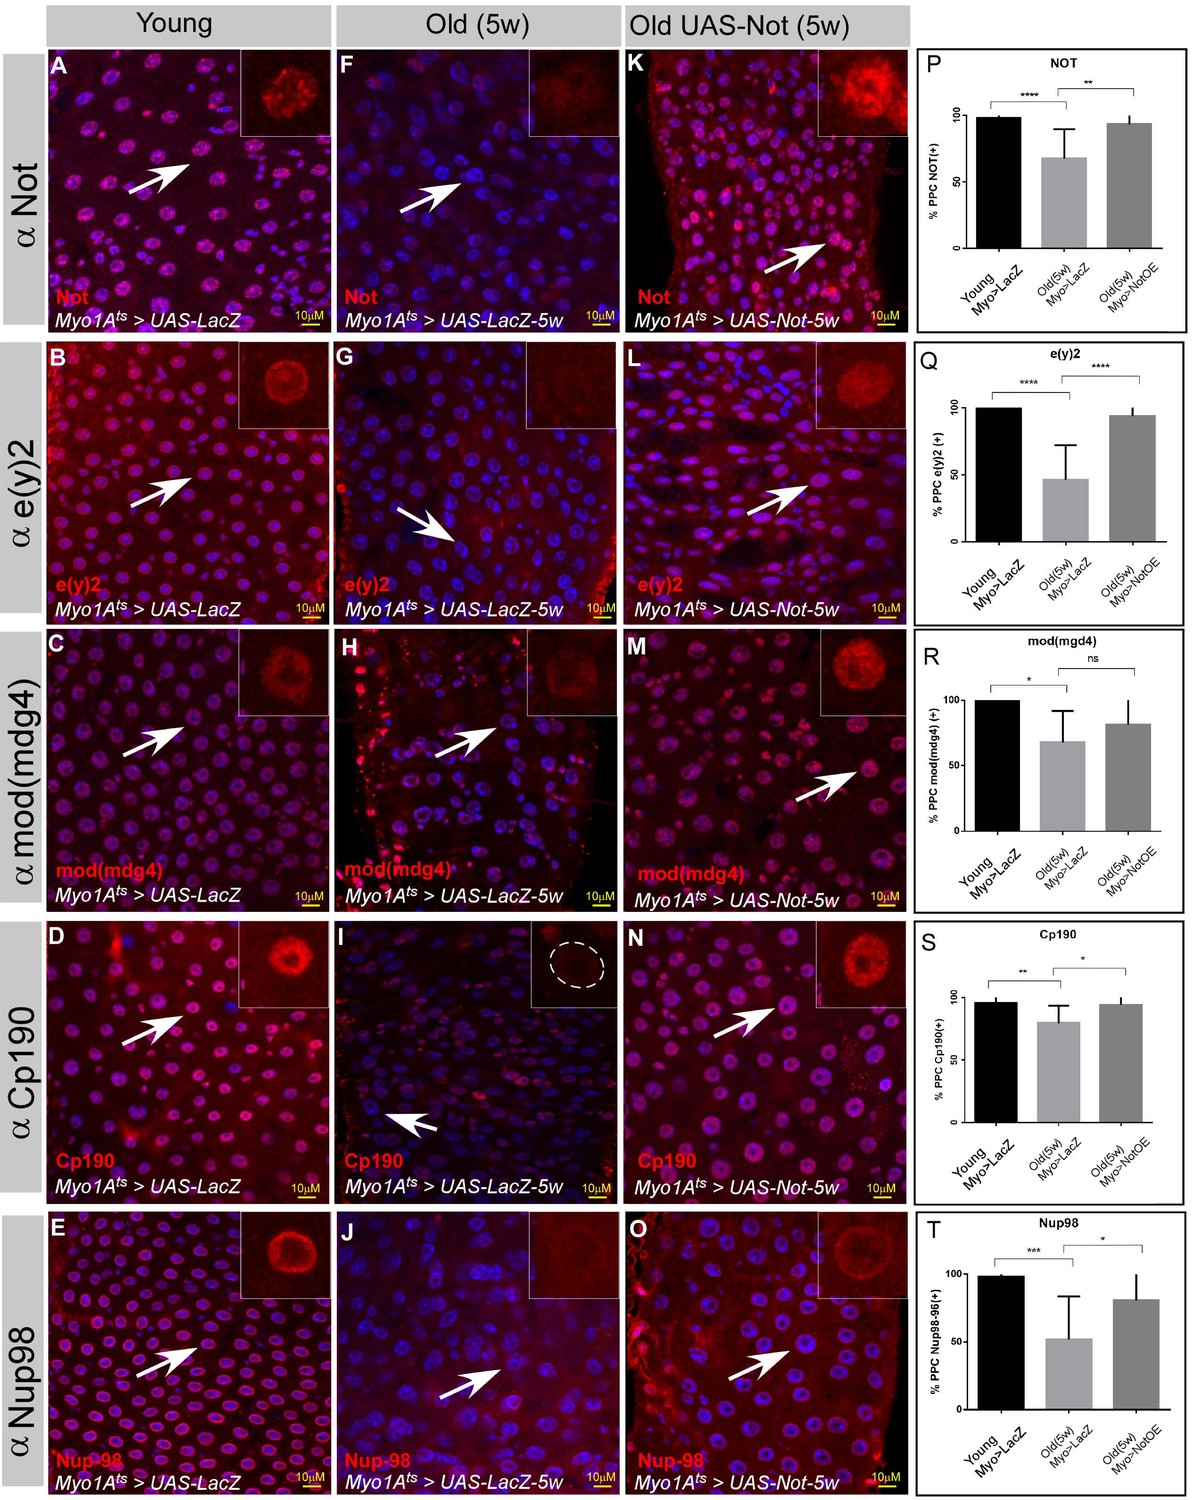
The protein levels of the Not-CP190 complex subunits decline upon aging and is restored upon continues expression of Non-stop in aged ECs.
(A–O) Representative confocal images of the midgut tissue using the indicated antibodies (red) and expressing the indicated transgenes in EC using the MyoIA-Gal4/Gal80ts system. (A–E) Young 4 days old guts, (F–J) Five weeks old guts expressing UAS-lacZ. (K–O) Five weeks old guts expressing UAS-Non-stop. DAPI marks DNA (blue), and scale bar is 10 μM. (P–T) Quantification of similar experiments presented in A-O. **** = P < 0.0001, ***P < 0.001; **P<0.01; *=P<0.1.
-
Figure 7—source data 1
Quantification of cell populations described in 7P-T.
- https://cdn.elifesciences.org/articles/62312/elife-62312-fig7-data1-v2.xlsx
Figure 8 with 1 supplement
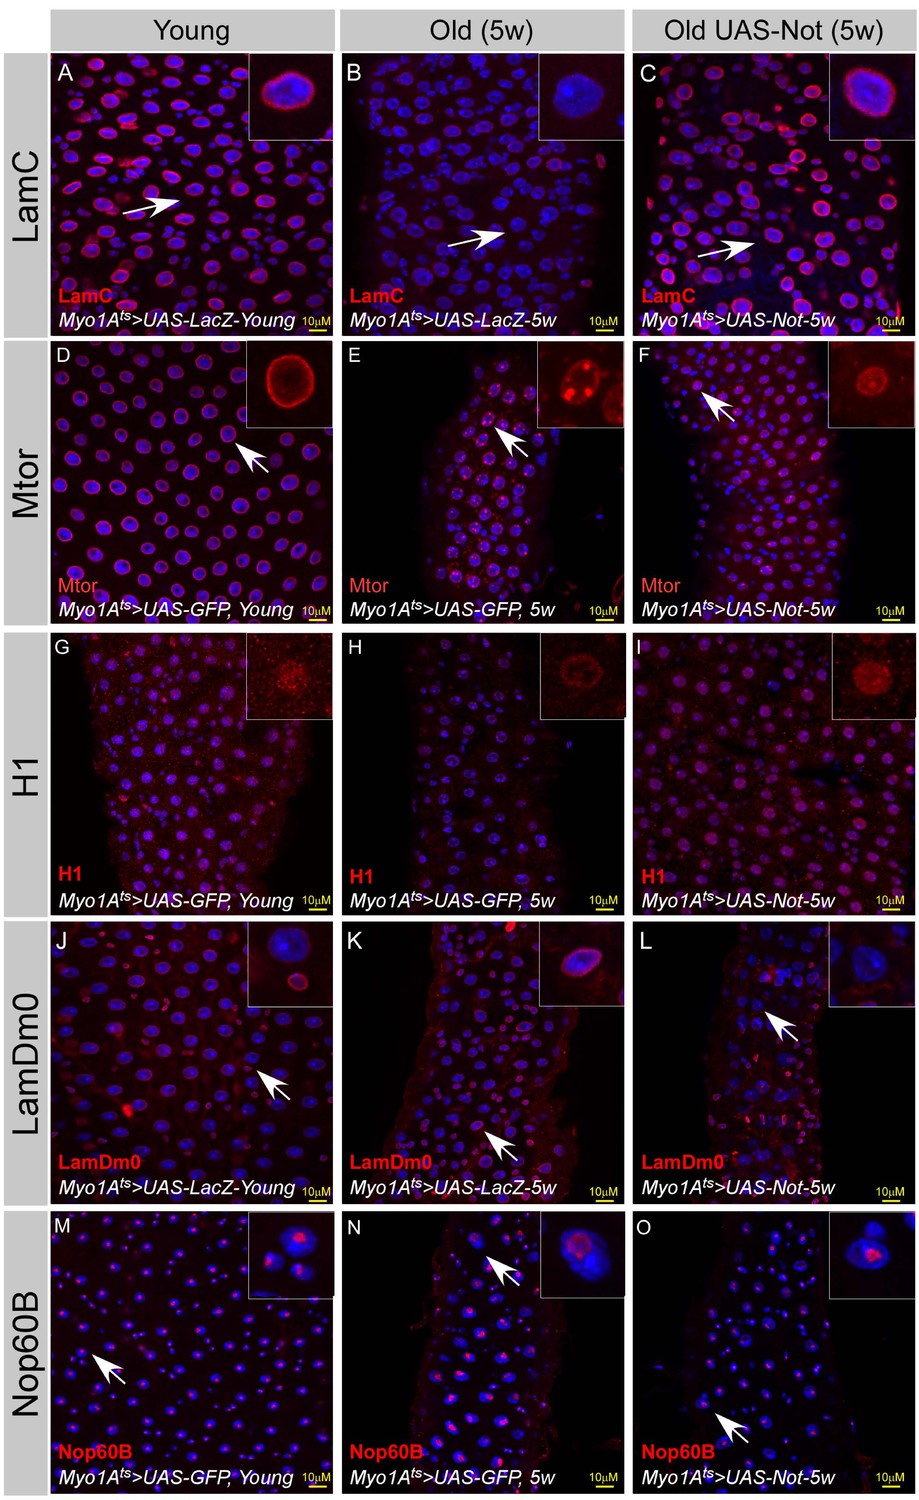
Expression of Non-stop restore large-scale organization of aged ECs.
(A–O) Confocal images of the midgut tissue using the indicated antibodies and expressing the indicated transgenes in EC using the MyoIA-Gal4/Gal80ts. DAPI marks DNA, and scale bar is 10 μM. (A, D, G, J, M) Young Guts expressing UAS-LacZ. (B, E, H, K, N) Five weeks old guts expressing control (UAS-GFP). (C, F, I, L, O) Five weeks old guts expressing UAS-Non-stop. (A–C) α-LamC; (D–F) Mtor; (G–I) α-Histone H1; (J–L) α-LamDm0; (M–O) α-Nop60B.
Figure 8—figure supplement 1
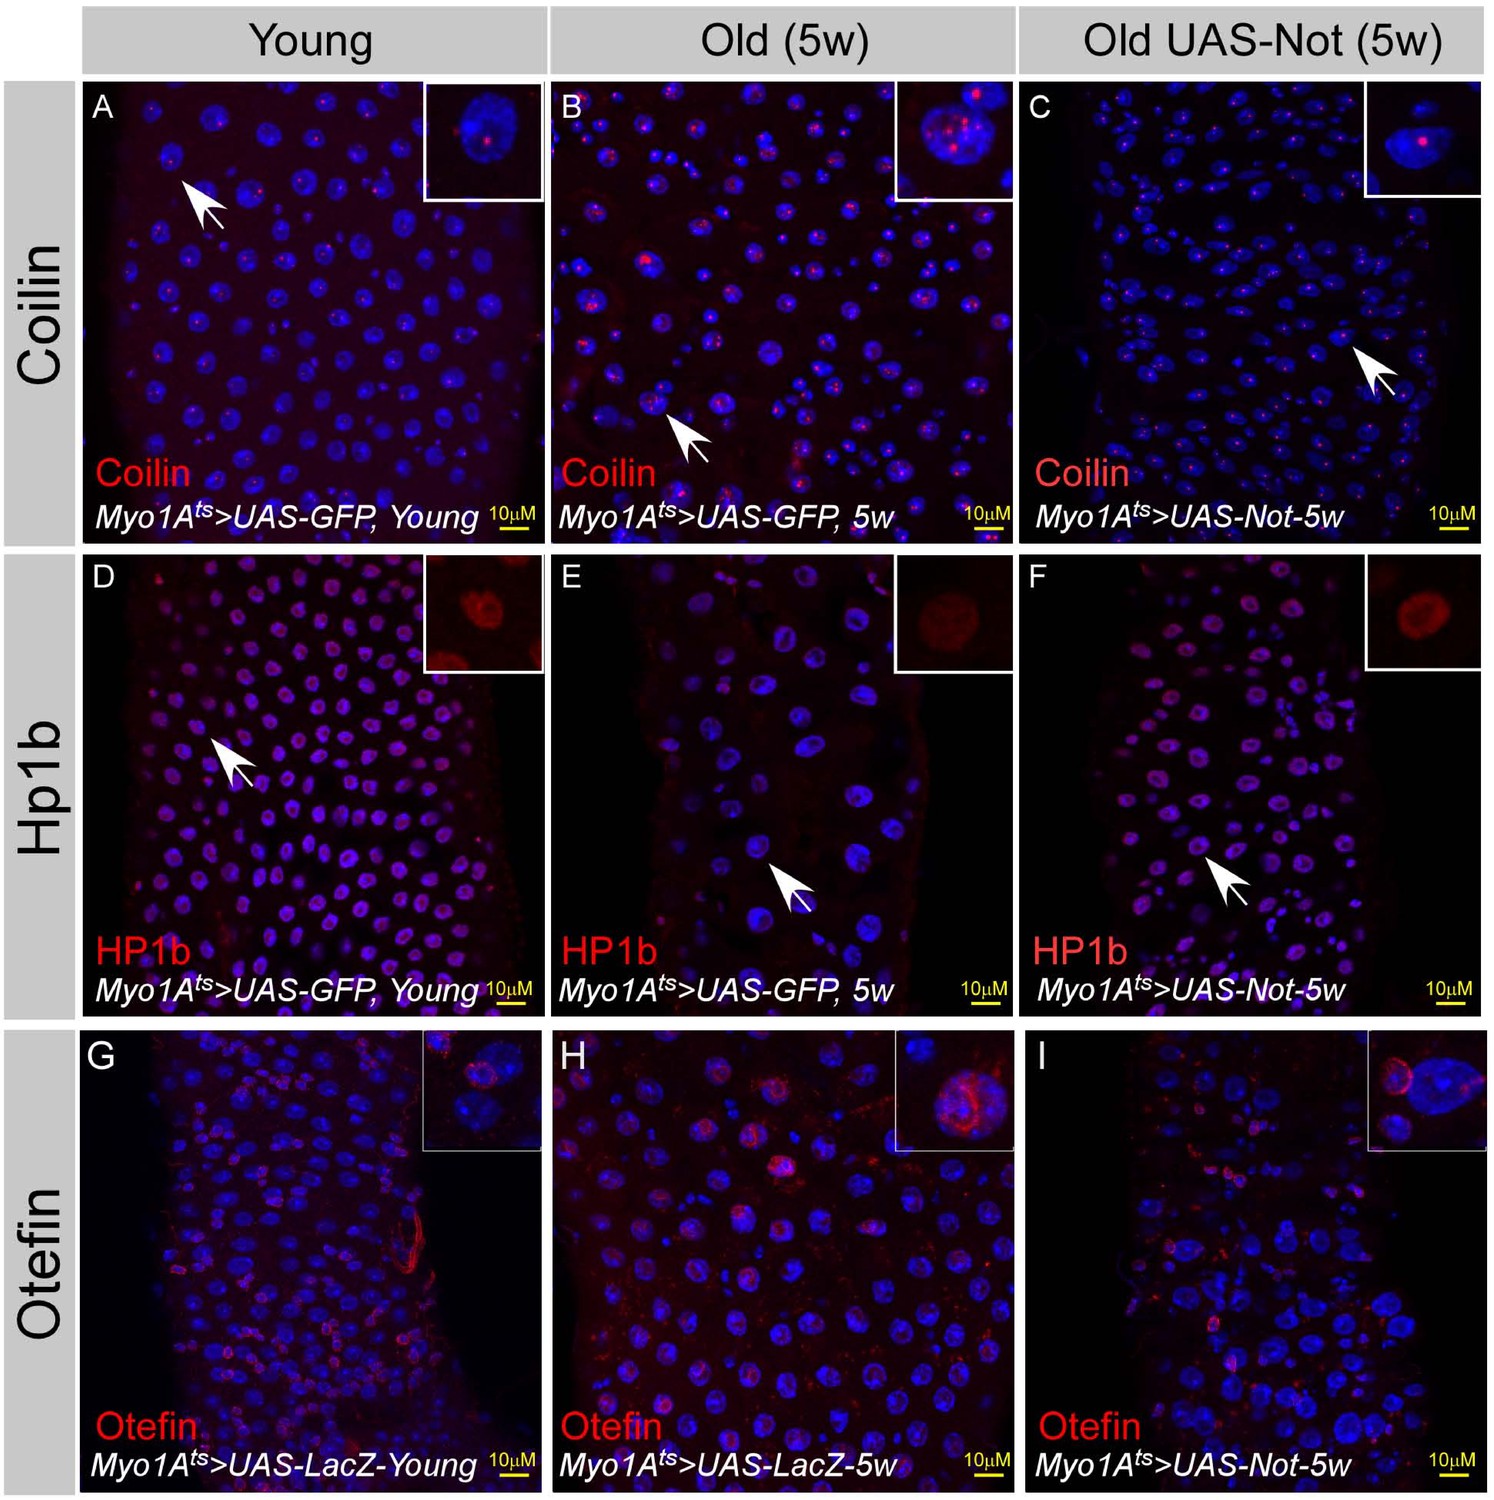
Expression of Non-stop restore large-scale organization of aged ECs.
(A–H) Confocal images of the midgut tissue using the indicated antibodies and expressing the indicated transgenes in EC using the MyoIA-Gal4/Gal80ts (A, D, G) Young Guts expressing the indicated UAS-LacZ. (B, E, H) Five weeks old guts expressing the indicated control. (C, F, I) Five weeks old guts expressing UAS-Non-stop. (A–C) α-Coilin; (D–F) α-HP1b; (G–I) α-Otefin.
Figure 9
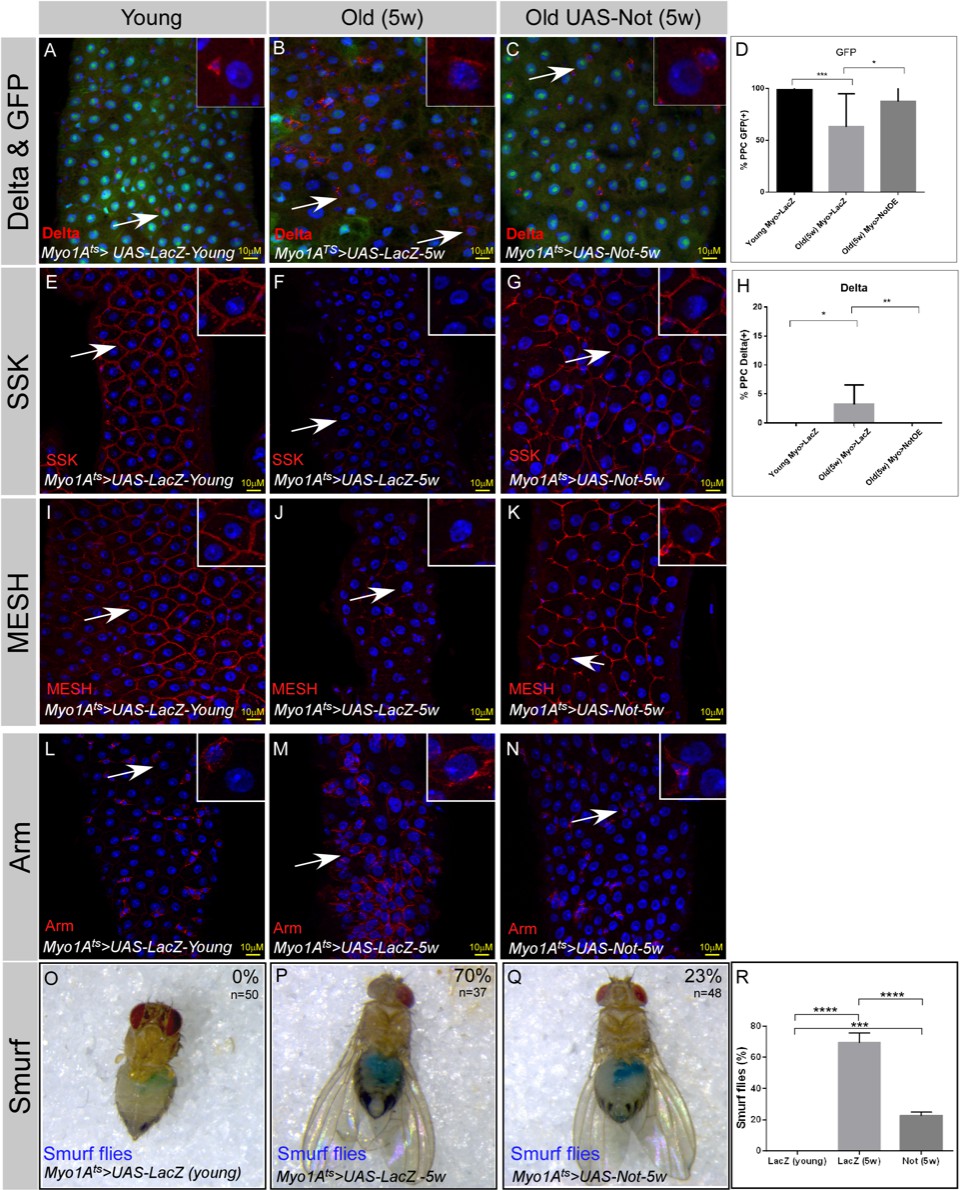
Continuous Expression of Non-stop in ECs suppresses aging phenotypes in the midgut.
(A–N) Confocal images of the midgut tissue using the indicated antibodies and expressing the indicated transgenes in EC using the MyoIA-Gal4/Gal80ts. DAPI marks DNA and scale bar is 10 μM. (A, E, I, L) midguts derived from 2 to 4 days old flies (young) (B, F, J, M) Midguts derived from 5 weeks old flies expressing control (UAS-LacZ). (C, G, K, N) Midguts derived from 5 weeks old flies expressing UAS-Non-stop. DAPI marks DNA (blue), and scale bar is 10 μM. Arm, Armadillo; SSK Snakeskin. (D, H) Quantification of similar experiments shown in (A–C). **** = P < 0.0001, ***P < 0.001; **P<0.01; *=P<0.1 (O-R) Aging impairs gut integrity as evident by the leakage of blue-colored food into the abdomen (smurf assay). Continuous expression of Non-stop but not control using the MyoIA-Gal4/Gal80ts for five weeks safeguards gut integrity, n = 48, 38 respectively; P < 0.001.
-
Figure 9—source data 1
Quantification of cell populations described in 9D,H and Smurf assay in Figure 99R.
- https://cdn.elifesciences.org/articles/62312/elife-62312-fig9-data1-v2.xlsx
Tables
Key resources table
| Reagent type (species) or resource | Designation | Source or reference | Identifiers | Additional information |
|---|---|---|---|---|
| Genetic reagent (D. melanogaster) | w; MyoIA-Gal4; tub-Gal80ts, UAS-GFP | Edgar Bruce lab | ||
| Genetic reagent (D. melanogaster) | w; esg-Gal4, tub-Gal80ts UAS-GFP | Edgar Bruce lab | ||
| Genetic reagent (D. melanogaster) | w; Prospero-Gal4 | Edgar Bruce lab | ||
| Genetic reagent (D. melanogaster) | w; Dl-Gal4/TM6, Tb | Edgar Bruce lab | ||
| Genetic reagent (D. melanogaster) | Su(H)-Gal4 | Sarah Bray lab | ||
| Genetic reagent (D. melanogaster) | Notch-reporter 3.37-gh-LacZ | Sarah Bray lab | ||
| Genetic reagent (D. melanogaster) | M5-4::LacZ | Erika Matunis | ||
| Genetic reagent (D. melanogaster) | UAS-LamC | Lori Walworth | ||
| Genetic reagent (D. melanogaster) | UAS-Non-stop RNAi | Bloomington | 28725 | |
| Genetic reagent (D. melanogaster) | UAS-Non-stop RNAi | VDRC | 45775/GD ; 45776/GD | |
| Genetic reagent (D. melanogaster) | UAS-GFP | Bloomington | # 1521 | |
| Genetic reagent (D. melanogaster) | UAS-GCN5-RNAi | Bloomington | # 33981 | |
| Genetic reagent (D. melanogaster) | UAS-SGF11-RNAi | VDRC | 17166/GD;100581/KK | |
| Genetic reagent (D. melanogaster) | UAS-Su(Hw)-RNAi | Bloomington | # 33906 | |
| Genetic reagent (D. melanogaster) | UAS-LacZ | Bloomington | #1776 | |
| Genetic reagent (D. melanogaster) | UAS-Atx7-RNA-i | VDRC | 102078/KK | |
| Genetic reagent (D. melanogaster) | UAS-e(y)2 RNAi | VDRC | 16751/GD ; 108212/KK | |
| Genetic reagent (D. melanogaster) | UAS-e(y)2 RNAi | Bloomington | 42524 | |
| Genetic reagent (D. melanogaster) | UAS-CP-190 RNAi | Bloomington | 42536 | |
| Genetic reagent (D. melanogaster) | UAS-Nup98-96 RNAi | Bloomington | #28562 | |
| Genetic reagent (D. melanogaster) | UAS-mod(mdg4) RNAi | Bloomington | # 32995 | |
| Genetic reagent (D. melanogaster) | “G-TRACE” (w*; P{UAS-RedStinger}6, P{UAS-FLP.Exel}3, P{Ubi-p63E(FRT.STOP)Stinger}15F2.) | Bloomington | #28281 | |
| Genetic reagent (Yeast) | pJ69-4A (MATa trp1-901 leu2-3,112 ura3-52 his3-200 gal4Δ gal80Δ GAL2-ADE2 LYS2::GAL1-HIS3 met2::GAL7-lacZ) | |||
| Antibody | anti-Prospero (Mouse monoclonal (IgG1)) | DHSB | Prospero (MR1A) | (1:100) |
| Antibody | anti-Armadillo (Mouse monoclonal) | DHSB | N2 7A1 Armadillo | (1:500) |
| Antibody | anti-Delta (Mouse monoclonal(IgG1)) | DHSB | C594.9B | (1:50) |
| Antibody | anti 4F3 anti-discs large (Dlg) (Mouse monoclonal) | DHSB | 4F3 anti-discs | (1:50) |
| Antibody | anti-HP1(Rabbit polyclonal) | Susan Purkhurst lab | (1:1000) | |
| Antibody | anti-mTor (Mouse monoclonal(IgG1)) | DHSB | 12F10-5F11 | (1:100) |
| Antibody | anti-βGal(Rabbit polyclonal) | MP Biomedicals | 55976 | (1:500) |
| Antibody | anti-Actin (Mouse monoclonal) | MP Biomedicals | 691001 | (WB) (1:4000) |
| Antibody | anti-MESH (Rabbit polyclonal) | Mikio Furuse lab | (1:100) | |
| Antibody | anti-SSK (Rabbit polyclonal) | Mikio Furuse lab | (1:100) | |
| Antibody | anti-caudal (Guinea Pig Polyclonal) | Jeff Reinitz lab | (1:200) | |
| Antibody | anti-odd-skipped (Guinea Pig Polyclonal) (Rat Polyclonal) | Jeff Reinitz lab | (1:100) | |
| Antibody | anti Lamin C (Mouse monoclonal) | Yossef Gruenbaum lab | (1:500) | |
| Antibody | anti Otefin (Mouse monoclonal) | Yossef Gruenbaum lab | (1:10) | |
| Antibody | anti-Lamin Dm0(Rabbit polyclonal) | Yossef Gruenbaum lab | (1:300) | |
| Antibody | anti-p-histone H3 (Rabbit polyclonal) | Abcam | ab5176 | (1:100) |
| Antibody | anti-Nop60B (Rabbit polyclonal) | Steven Pole lab | (1:100) | |
| Antibody | Guinee pig anti-Coilin | Joseph Gall lab | (1:2000) | |
| Antibody | anti-Non-stop(Rabbit polyclonal) | Cloud et al., 2019 | (1:100) | |
| Antibody | anti-PCNA (Rabbit polyclonal) | Bruce Edgar Lab | (1:100) | |
| Antibody | anti-Nup98 (Rabbit polyclonal) | Cordula Schlutz Lab | (1:100) | |
| Antibody | anti-e(y)2 (Rabbit polyclonal) | Cloud et al., 2019 | (1:1000 - WB, 1:100 - IHC) | |
| Antibody | anti-Cp190 (Rabbit polyclonal) | Golovnin et al., 2007 | (1:1000WB), (1:100 IHC) | |
| Antibody | anti-mod (MDG4) (Mouse monoclonal) | Golovnin et al., 2007 | ( 1:100 IHC) | |
| Antibody | anti-H1 (Rabbit polyclonal) | Bas Van-Steensel lab | (1:500) (1:1000WB) | |
| Antibody | anti-H2Bub (Mouse monoclonal) | Moshe Oren Lab | (1:500) | |
| Antibody | anti-H2B (Mouse monoclonal) | Moshe Oren Lab | (1:500) | |
| Antibody | anti-Pdm1 (Rabbit polyclonal) | Di´az-Benjumea lab | (1:50) | |
| Antibody | Alexa Fluor 568 goat anti-mouse IgG1(γ1) | invitrogen | A21124 | (1:1000) |
| Antibody | Alexa Fluor 568 goat anti-mouse IgG (H+L) | invitrogen | A11031 | (1:1000) |
| Antibody | Alexa Fluor 568 goat anti-rabbit IgG (H+L) | invitrogen | A11036 | (1:1000) |
| Antibody | Alexa Fluor 633 goat anti-rabbit IgG (H+L) | invitrogen | A-21070 | (1:1000) |
| Antibody | Alexa Fluor 633 goat anti-mouse IgG1 (γ1) | invitrogen | A-21126 | (1:1000) |
| Antibody | Alexa Fluor 568 goat anti-guinea pig | invitrogen | A11075 | (1:1000) |
| Antibody | Alexa Fluor 633 goat anti-guinea pig | invitrogen | A21105 | (1:1000) |
| Antibody | Alexa Fluor 633 goat anti-rat | invitrogen | A21094 | (1:1000) |
| Antibody | Alexa Fluor 568 goat anti-rat | invitrogen | A11077 | (1:1000) |
| sequence-based reagent | CP190 CT (aa, 468-1096) | pET32a(+) vector (merck) | 5’-tttggtaccgggccctggctgtgcctg-3’ | |
| Sequence-based reagent | CP190 CT (aa, 468-1096) | pET32a(+) vector (merck) | 5’-tttctcgagtgcggccgcagatcttag-3’ | |
| Sequence-based reagent | CP190 NT (aa, 1-524) | pET32a(+) vector (merck) | 5’- tttcatatgggtgaagtcaagtccgtg -3’ | |
| Sequence-based reagent | CP190 NT (aa, 1-524) | pET32a(+) vector (merck) | 5’- tttctcgagcatgtggaaatgcagttcccg -3’ | |
| Sequence-based reagent | e(y)2 | pET32a(+) vector (merck) | 5’- tttggatccccggaattcccgacgatgag-3’ | |
| Sequence-based reagent | e(y)2 | pET32a(+) vector (merck) | 5’- tttgcggccgcttaggattcgtcctctggc-3’ | |
| Sequence-based reagent | Non-Stop (aa 496) | pGBT9 vector (Clontech) | 5’-ttgaattcatgtccgagacgggttgtc-3’ | |
| Sequence-based reagent | Non-Stop (aa 496) | pGBT9 vector (Clontech) | 5’-ttgtcgacttactcgtattccagcacatt-3’ | |
| Sequence-based reagent | CP190 (aa 1096) | pGAD424 vector (Clontech) | 5’-ttcccgggcatgggtgaagtcaagtccg-3’ | |
| Sequence-based reagent | CP190 (aa 1096) | pGAD424 vector (Clontech) | 5’-tttggaggagctatatttactaagatct-3’ | |
| Sequence-based reagent | CP190 from first to fourth zinc fingers | pGAD424 vector (Clontech) | 5’-ttgaattcgagaatactactgggccct-3’ | |
| Sequence-based reagent | CP190 from first to fourth zinc fingers | pGAD424 vector (Clontech) | 5’-ttgtcgacgccatcctccaaagcctg-3’ | |
| Sequence-based reagent | CP190 from second to third | pGAD424 vector (Clontech) | 5’-ttgaattcgcgctttgtgagcattgc-3’ | |
| Sequence-based reagent | CP190 from second to third | pGAD424 vector (Clontech) | 5’-ttgtcgacgttgtcgtccgtgtgcac-3’ | |
| Sequence-based reagent | CP190Δ4 | pGAD424 vector (Clontech) | 5’-aaggtaccggagcaggctttgga-3’ | |
| Sequence-based reagent | CP190Δ4 | pGAD424 vector (Clontech) | 5’-aaggtacccactgctgcttgttgtcg-3’ | |
| Sequence-based reagent | CP190Δ3-4 | pGAD424 vector (Clontech) | 5’-aaggtaccggagcaggctttgga | |
| Sequence-based reagent | CP190Δ3-4 | pGAD424 vector (Clontech) | 5’-aaggtaccaacgtatacagcagcgac-3’ | |
| Sequence-based reagent | CP190Δ2-4 | pGAD424 vector (Clontech) | 5’-aaggtaccggagcaggctttgga | |
| Sequence-based reagent | CP190Δ2-4 | pGAD424 vector (Clontech) | 5’-aaggtacccgcgccggatcaattg-3’ | |
| Sequence-based reagent | CP190Δ1-4 | pGAD424 vector (Clontech) | 5’-gccctggctgaaggagcaggctttggagga | |
| Sequence-based reagent | CP190Δ1-4 | pGAD424 vector (Clontech) | 5’-cctgctccttcagccagggcccagtagtat-3’ | |
| Cell line (D. melanogaster) | S2 | |||
| recombinant DNA reagent | pY3H | |||
| recombinant DNA reagent | pRmha3 C-HAx2-FLx2-nonstop-735 | Cloud et al., 2019 | ||
| Transfected construct (Drosophila S2 Cells) | Non-Stop-RNAi forward | 5’-cggaattccgaattaatacgactcactatagggatttaatctggaaccatgcgaa-3’ | ||
| Transfected construct (Drosophila S2 Cells) | Non-Stop-RNAi reverse | 5’-cggaattccgaattaatacgactcactatagggaaatgtcccaaaacggatcgta-3’ | ||
| Chemical compound, Drug | Diamidino-2-phenylindole*dihydrochl [DAPI] 1mg | Sigma | D9542-1MG | 1:1000 |
| Chemical compound, Drug | Bromophenol Blue | Sigma | #B5525 | |
| Chemical compound, Drug | Guanidine hydrochloride | Sigma | #G4505 | |
| Chemical compound, Drug | NP40 (Igepal CA-630) | Sigma | #I3021 | |
| Chemical compound, Drug | Triton X-100 | Amresco | #0694 | |
| Chemical compound, Drug | Acrylamide (Bis-Acrylamide 29:1) | Biological Industries | #01-874-1A | |
| Chemical compound, Drug | Ammonium Persulfate | Sigma | #A-9164 | |
| Chemical compound, Drug | TEMED | Sigma | #T-7024 | |
| Chemical compound, Drug | L-Glutamine | Gibco | #25030024 | |
| Chemical compound, Drug | MG132 | Boston Biochemicals | ||
| Chemical compound, Drug | Blot Qualified BSA | Biological Industries | #PRW3841 | |
| Chemical compound, Drug | Agarose | SeaKem LE Agarose- Cambrex Bio Science | #CAM-50004 | |
| Chemical compound, Drug | Bradford Protein Assay | BioRad | #500-0006 | |
| Chemical compound, Drug | EZ-ECL | Biological Industries | #20-500-500 | |
| Chemical compound, Drug | FD&C blue dye #1 | |||
| Chemical compound, Drug | Cyclohexamide | Sigma | #01810 |
Additional files
Download links
A two-part list of links to download the article, or parts of the article, in various formats.
Downloads (link to download the article as PDF)
Open citations (links to open the citations from this article in various online reference manager services)
Cite this article (links to download the citations from this article in formats compatible with various reference manager tools)
A Non-stop identity complex (NIC) supervises enterocyte identity and protects from premature aging
eLife 10:e62312.
https://doi.org/10.7554/eLife.62312


