Negative feedback couples Hippo pathway activation with Kibra degradation independent of Yorkie-mediated transcription
- Department of Molecular Genetics and Cell Biology, The University of Chicago, United States
- Committee on Development, Regeneration and Stem Cell Biology, The University of Chicago, United States
Figures
Figure 1
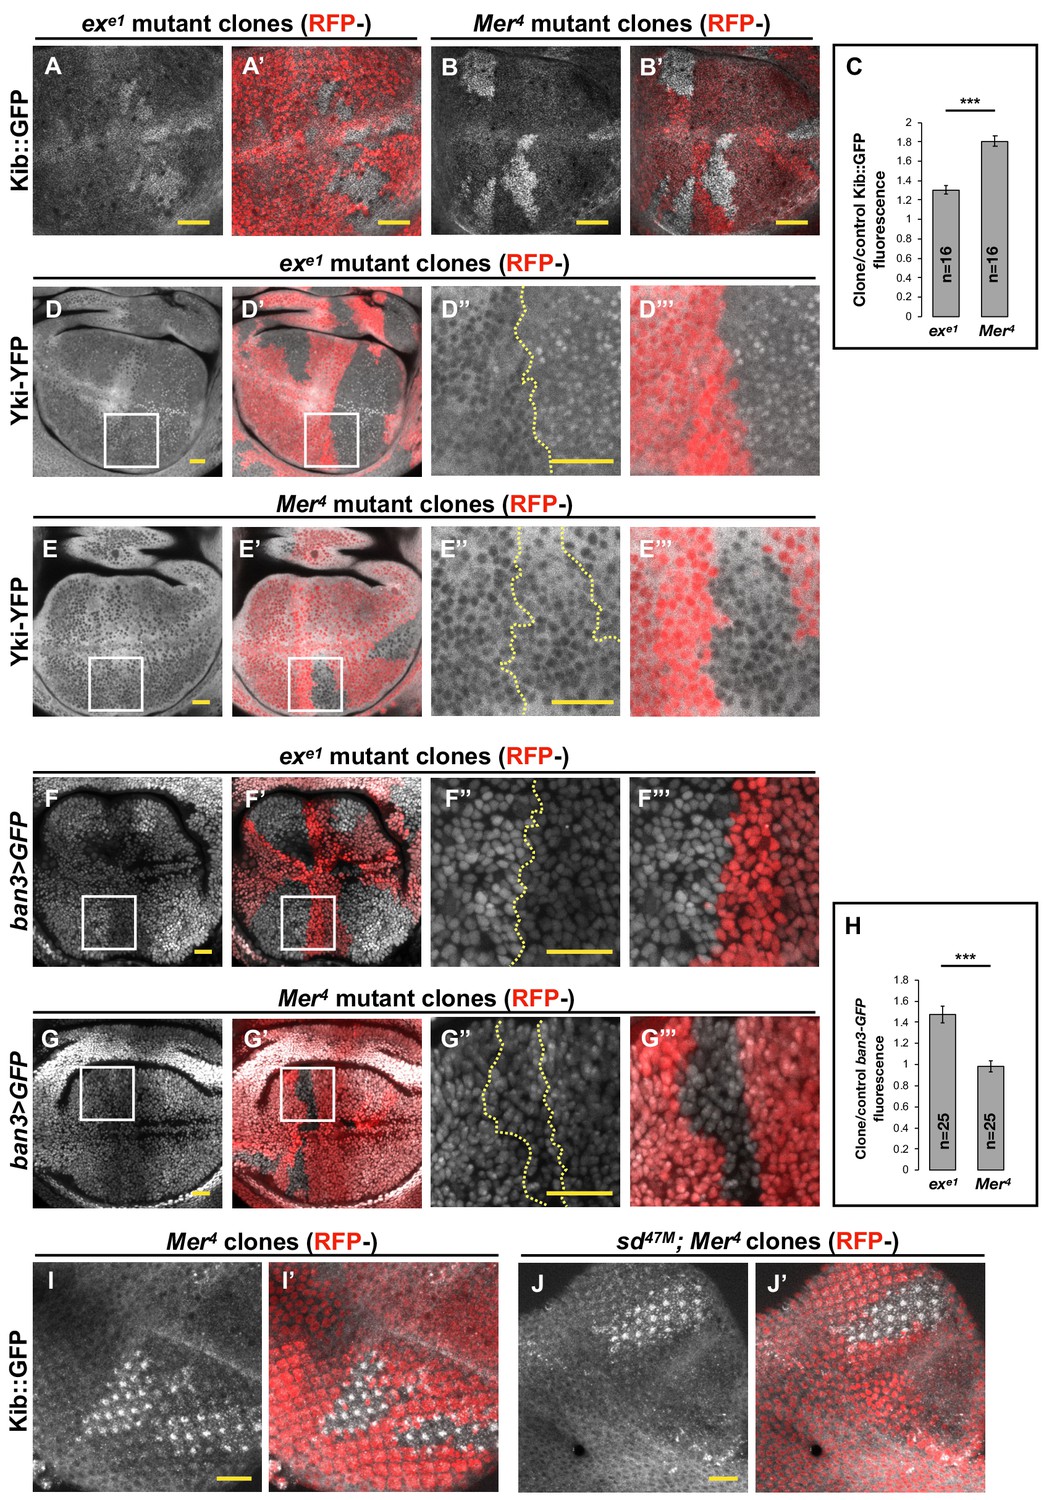
Transcriptional feedback alone does not explain Kibra (Kib) upregulation in Mer clones.
(A–G’’’) All tissues shown are living late third instar wing imaginal discs expressing the indicated fluorescent proteins. (A–C) Endogenous Kib::GFP in ex (A and A’) or Mer (B and B’) somatic mosaic clones (indicated by loss of RFP). Loss of Mer leads to a greater increase in Kib levels than loss of Ex. Quantification is shown in (C). (D–E’’’) Endogenously expressed Yorkie (Yki)-YFP is strongly nuclear in ex mutant clones (D–D’’’) but is mostly cytoplasmic in Mer mutant clones (E–E’’’). (F–H) Expression ban3>GFP, a reporter of Yki activity, is elevated in ex mutant clones (F–F’’’) but is not detectably affected in Mer mutant clones (G–G’’’). Quantification is shown in (H). (I–J’) Endogenous Kib:GFP levels are elevated in single Mer somatic mosaic clones (I and I’) and in double sd; Mer clones (J and J’). Yellow dashed lines indicate clone boundaries. All scale bars=20 μm. Quantification in (C) and (H) is represented as the mean ± standard error of the mean (SEM); n=number of clones (no more than two clones per wing disc were used for quantification). Statistical analysis was performed using nonparametric Mann–Whitney U-test. Throughout the paper, statistical significance is reported as follows: ***p≤0.001, **p≤0.01, *p≤0.05, ns (not significant, p>0.05).
Figure 2 with 2 supplements
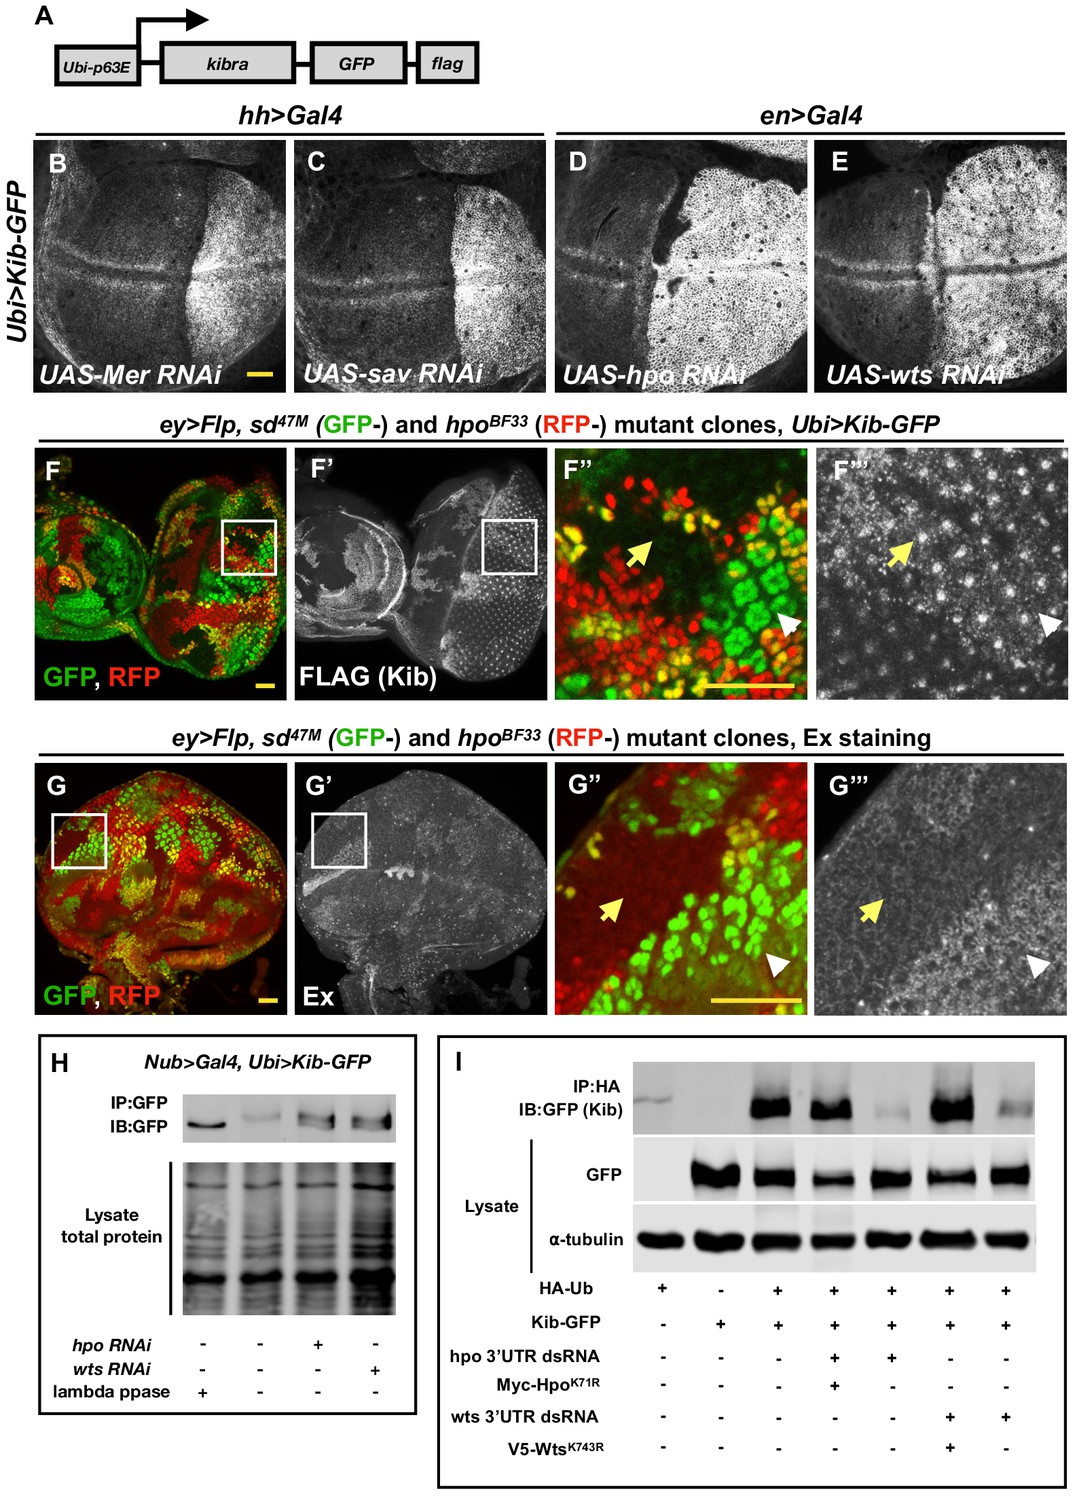
The Hippo (Hpo) pathway regulates Kibra (Kib) levels independently of Yorkie (Yki)-mediated transcription.
(A) A cartoon of the DNA construct used to generate the Ubi>Kib-GFP transgenic fly line. (B–E) Depletion of Hpo pathway components Mer, Sav, Hpo, and Wts by RNAi in the posterior compartment of the wing results in elevated Kib-GFP levels. All scale bars=20 μm. Throughout the paper, wing imaginal discs are oriented with posterior side to the right and dorsal side up. (F–F’’’) In the eye imaginal disc, Kib-GFP is upregulated both in hpo mutant clones and sd; hpo double-mutant clones, indicating that Hpo pathway activity controls Kib levels independently of Yki/Sd-mediated transcription. White arrowheads indicate hpo single-mutant clones; yellow arrows indicate sd; hpo double-mutant clones. Note: the clonal GFP marker (sd+), which is nuclear, is readily distinguishable from Kib-GFP, which is apical. (G–G’’’) Ex levels are also upregulated in hpo mutant clones; but in contrast to Kib, Ex upregulation is not observed in sd; hpo double-mutant clones. (H) Kib is phosphorylated in wing discs, and depletion of Hpo or Wts leads to decreased Kib phosphorylation. (I) Kib is ubiquitinated in S2 cells. Depletion of Hpo or Wts with dsRNA targeting 3′-untranslated region (UTR) of each kinase leads to decreased Kib ubiquitination; the effect of Hpo or Wts knockdown is rescued by addition of kinase-dead HpoK71R or WtsK743R. Throughout the paper, all immunoblot data are representative of at least three replicates.
Figure 2—figure supplement 1
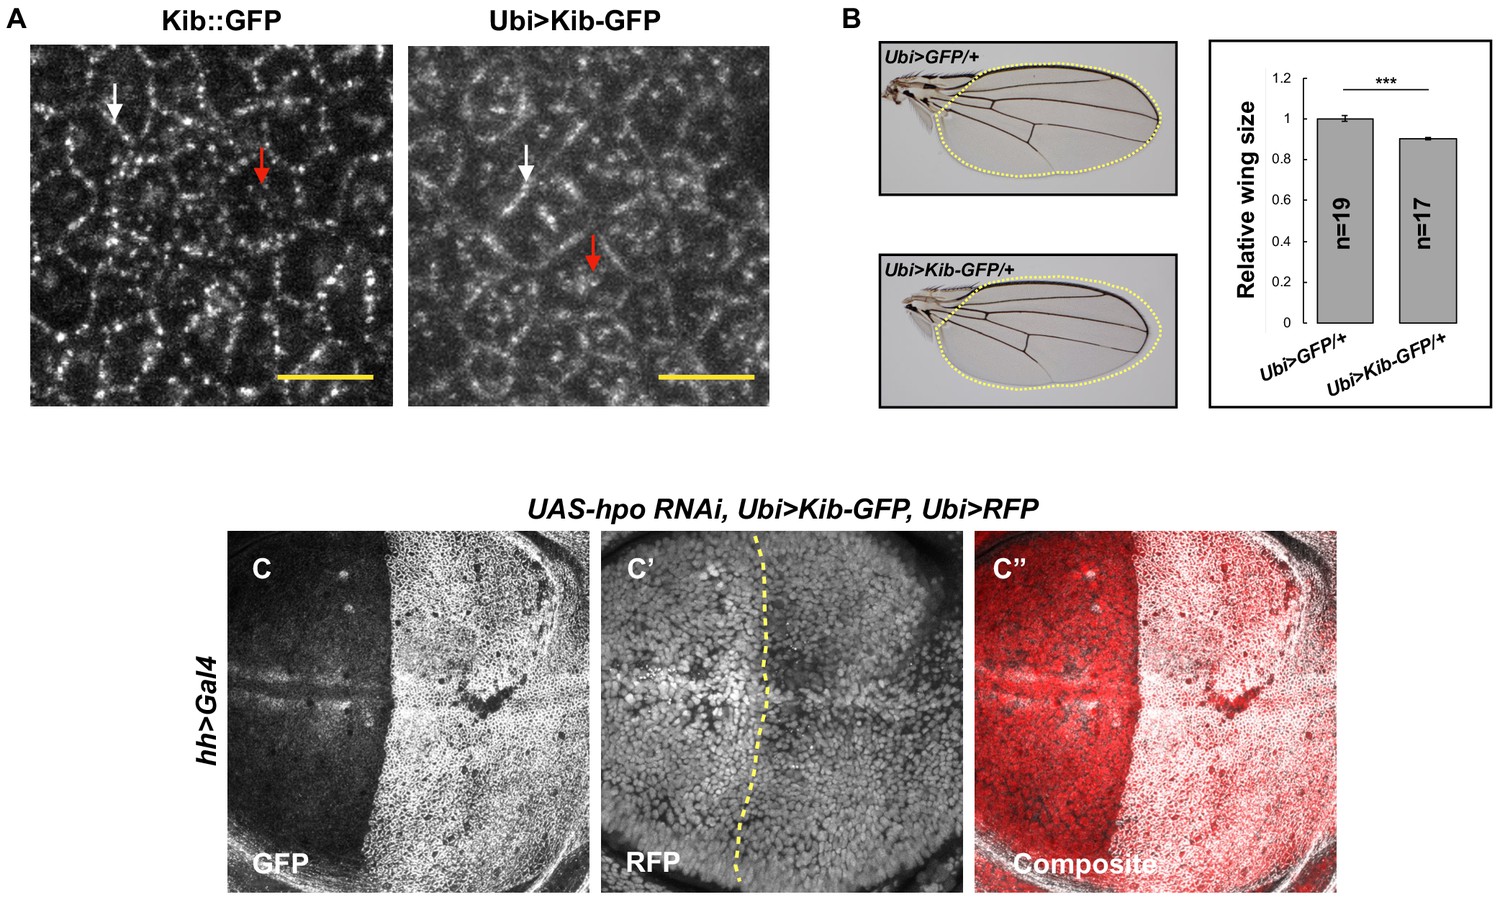
The Hippo pathway regulates Kibra (Kib) levels independently of Yorkie (Yki) transcriptional activity.
(A) Similar to endogenous Kib:GFP (left), Ubi>Kib-GFP (right) accumulates both at the junctional (white arrows) and apical medial cortex (red arrows). Scale bars=5 μm. (B) Size comparison of adult wings from flies expressing Ubi>GFP or Ubi>Kib-GFP; quantification is shown as the mean ± SEM relative to the control; n=number of wings. Statistical comparison was performed using Mann–Whitney U-test. (C–C’’) Depletion of Hpo in the posterior compartment of the wing does not cause increased Ubi>RFP expression. Yellow dashed line indicates the anterior–posterior (A–P) boundary.
Figure 2—figure supplement 2
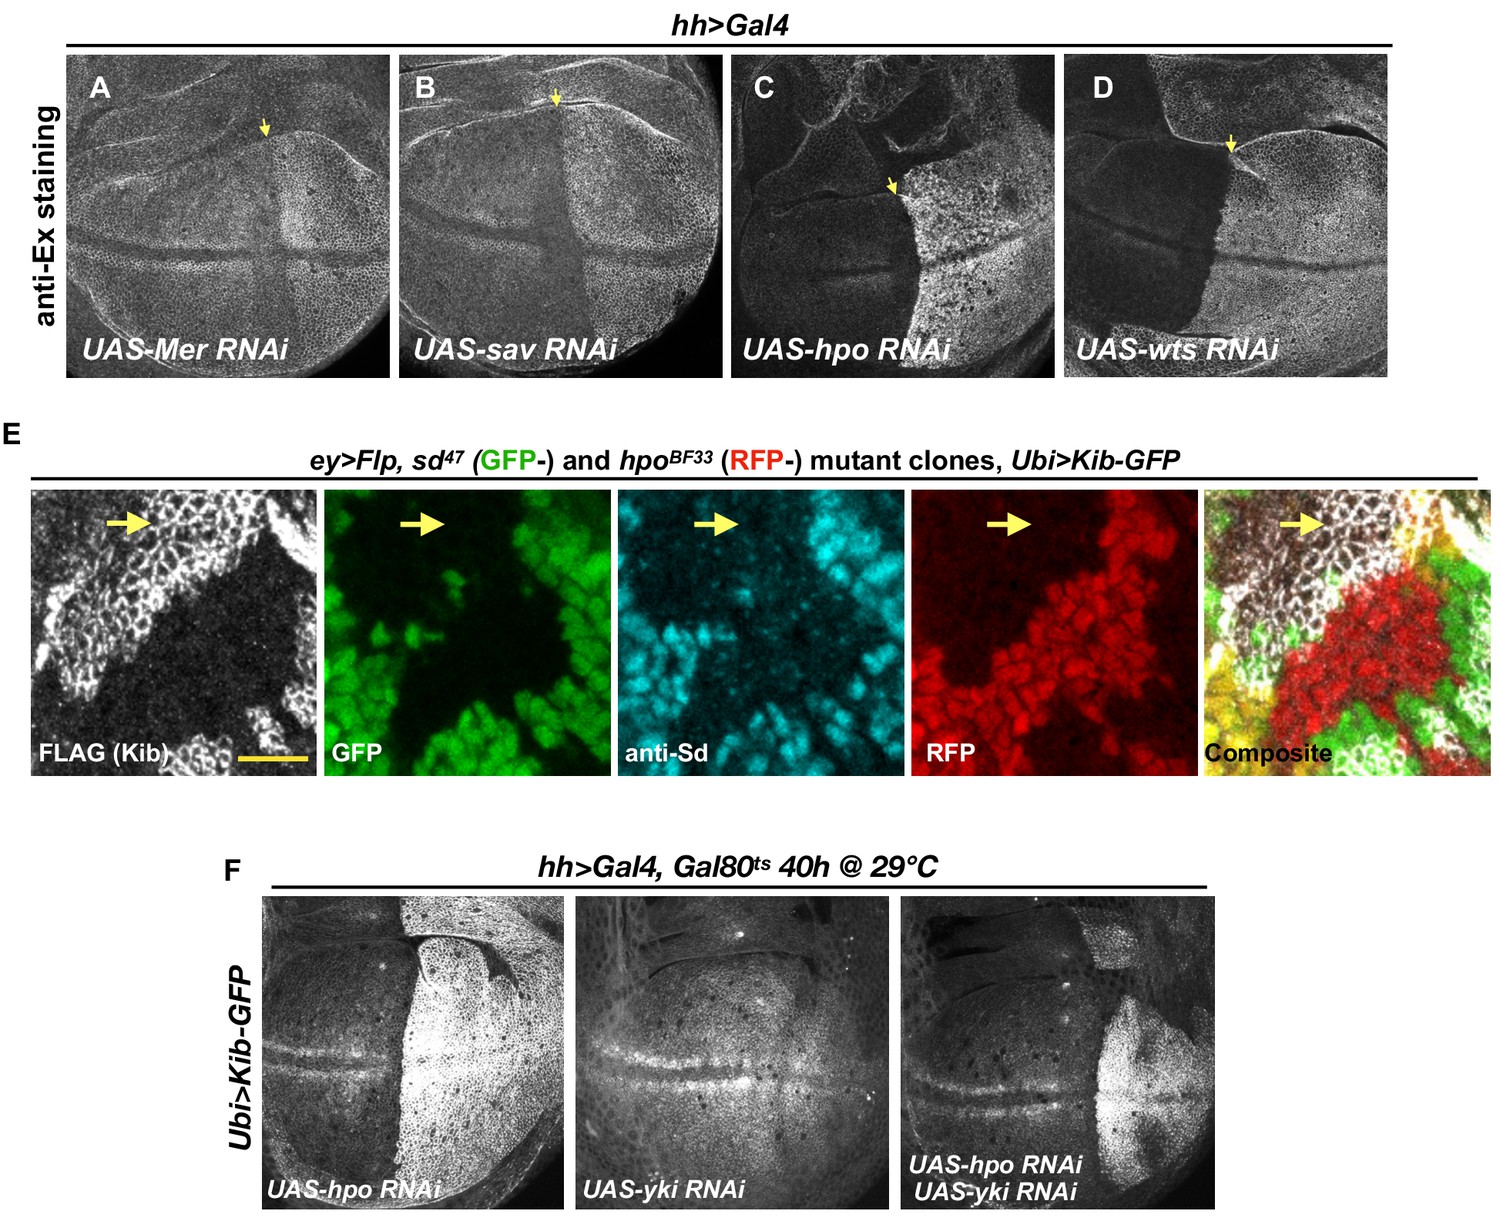
The Hippo (Hpo) pathway regulates Kibra (Kib) levels independently of Ex.
(A–D) Ex levels are elevated upon Hpo pathway inactivation, with a particularly strong increase upon Hpo or Wts depletion (C and D, respectively). (E) Single sd (GFP-) or hpo (RFP-) somatic mosaic clones or double sd; hpo clones (GFP- and RFP-, yellow arrow) induced in the eye imaginal disc using ey>Flp. Ubi>Kib-GFP (FLAG staining) is upregulated in sd; hpo double-mutant clones; loss of sd was confirmed by anti-Sd staining (cyan). Scale bars=10 μm. (F) Effect of transient depletion of Hpo (left), Yki(middle), or Hpo and Yki (right) on Ubi>Kib-GFP levels in the posterior compartment of the wing using Gal80ts.
Figure 3 with 1 supplement
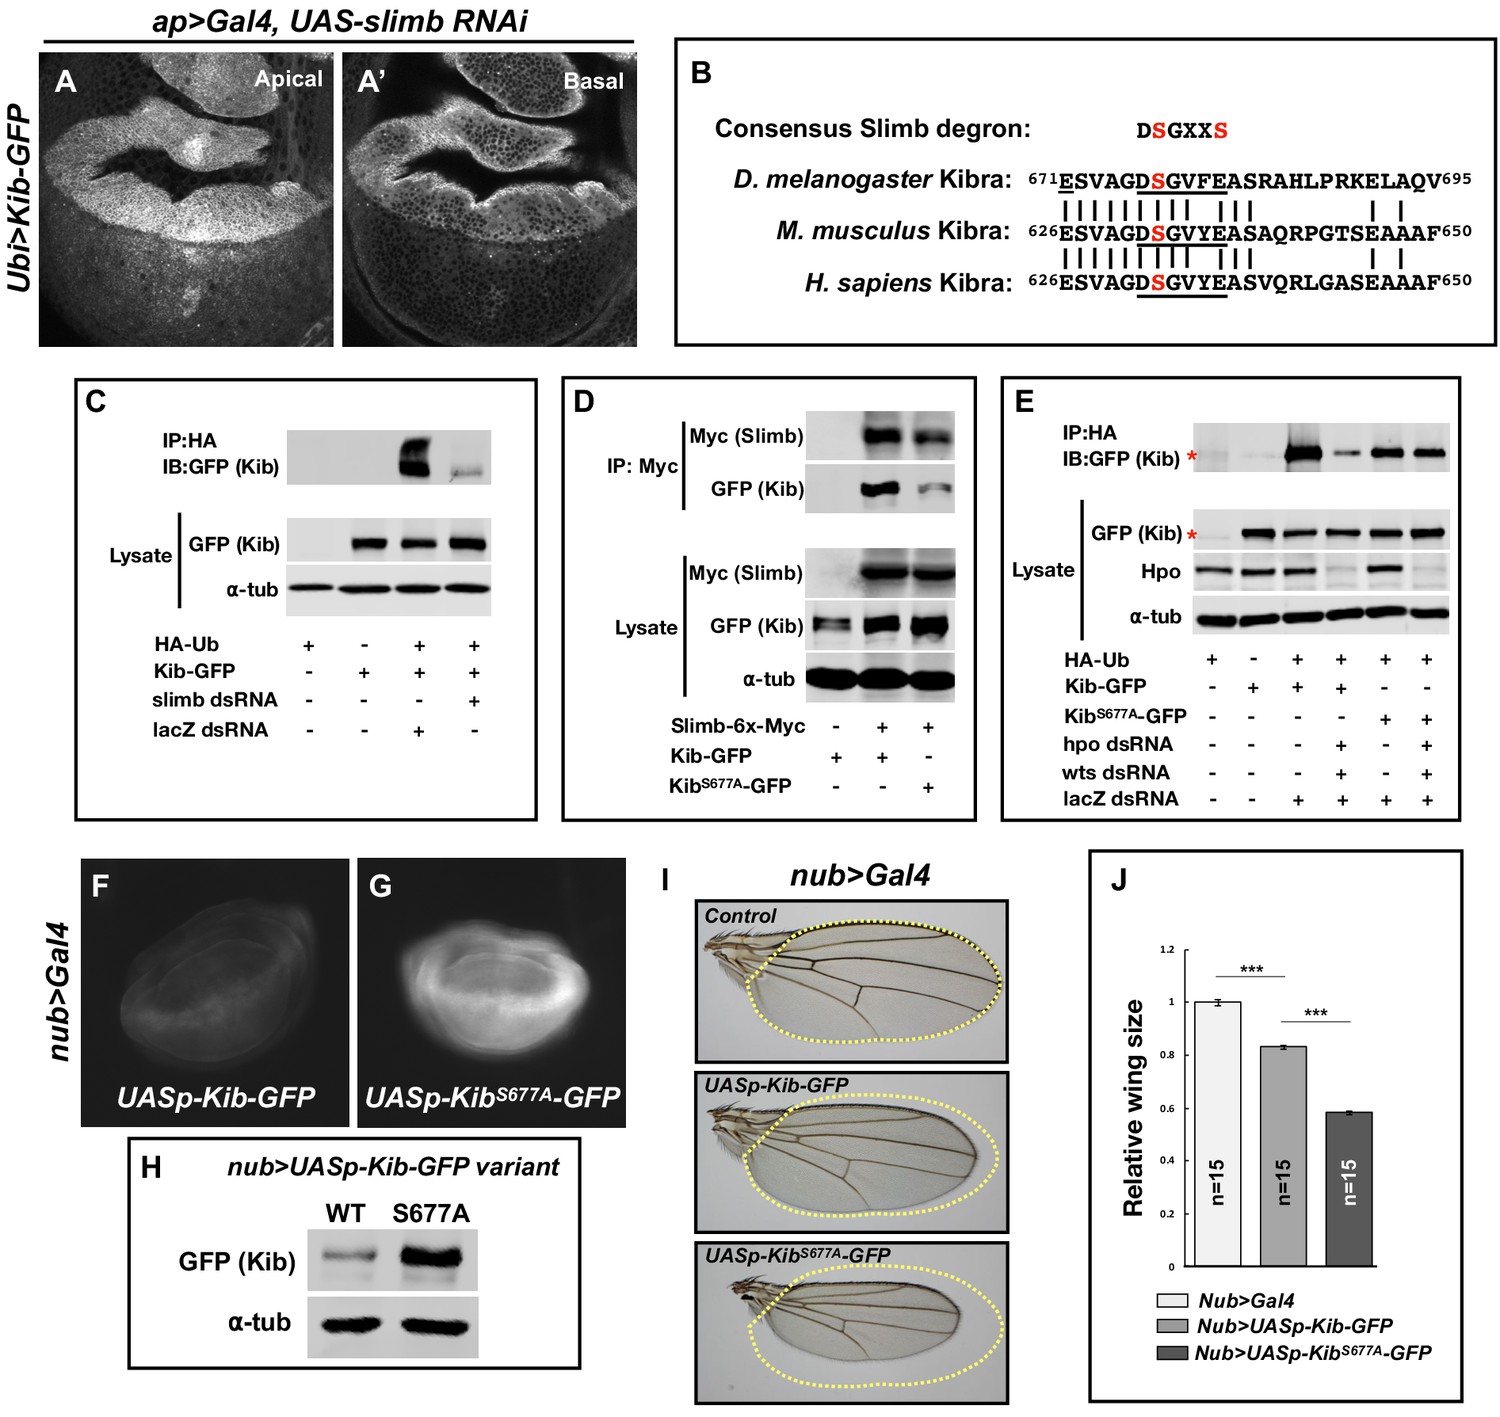
Slimb regulates Kibra (Kib) abundance via a consensus degron.
(A–A’) Depletion of Slimb in the dorsal compartment of the wing imaginal disc results in increased Kib-GFP levels both apically (A) and basally (A’). (B) Alignment of the fly, mouse, and human Kib protein sequences showing the conservation of the putative Slimb degron motif DSGXXS (underlined). The vertical lines indicate conserved residues. (C) Immunoblot showing that depletion of Slimb in S2 cells decreases Kib ubiquitination. (D) Co-IP experiments showing that Kib forms a complex with Slimb in S2 cell lysates in a degron-dependent manner. (E) Ubiquitination of the degron mutant, KibS677A, is diminished and is insensitive to Hippo pathway inactivation. Asterisks indicate non-specific bands. (F–G) Widefield fluorescence images of wing discs expressing either UASp-Kib-GFP (F) or UASp-KibS677A-GFP (G) with the nub>Gal4 driver; images were taken using identical settings. (H) Immunoblot of wing disc cell lysates (20 discs each) of UASp-Kib-GFP or UASp-KibS677A-GFP expressed with the nub>Gal4 driver. (I–J) Ectopic expression of KibS677A-GFP in the wing results in stronger growth suppression than expression of wild-type Kib-GFP. Quantification of wing sizes in (I) is represented as mean ± SEM relative to the control; n=number of wings (one wing per fly). Statistical comparison was performed using the one-way analysis of variance (ANOVA) test followed by Tukey’s Honestly Significant Difference (HSD) test.
Figure 3—figure supplement 1
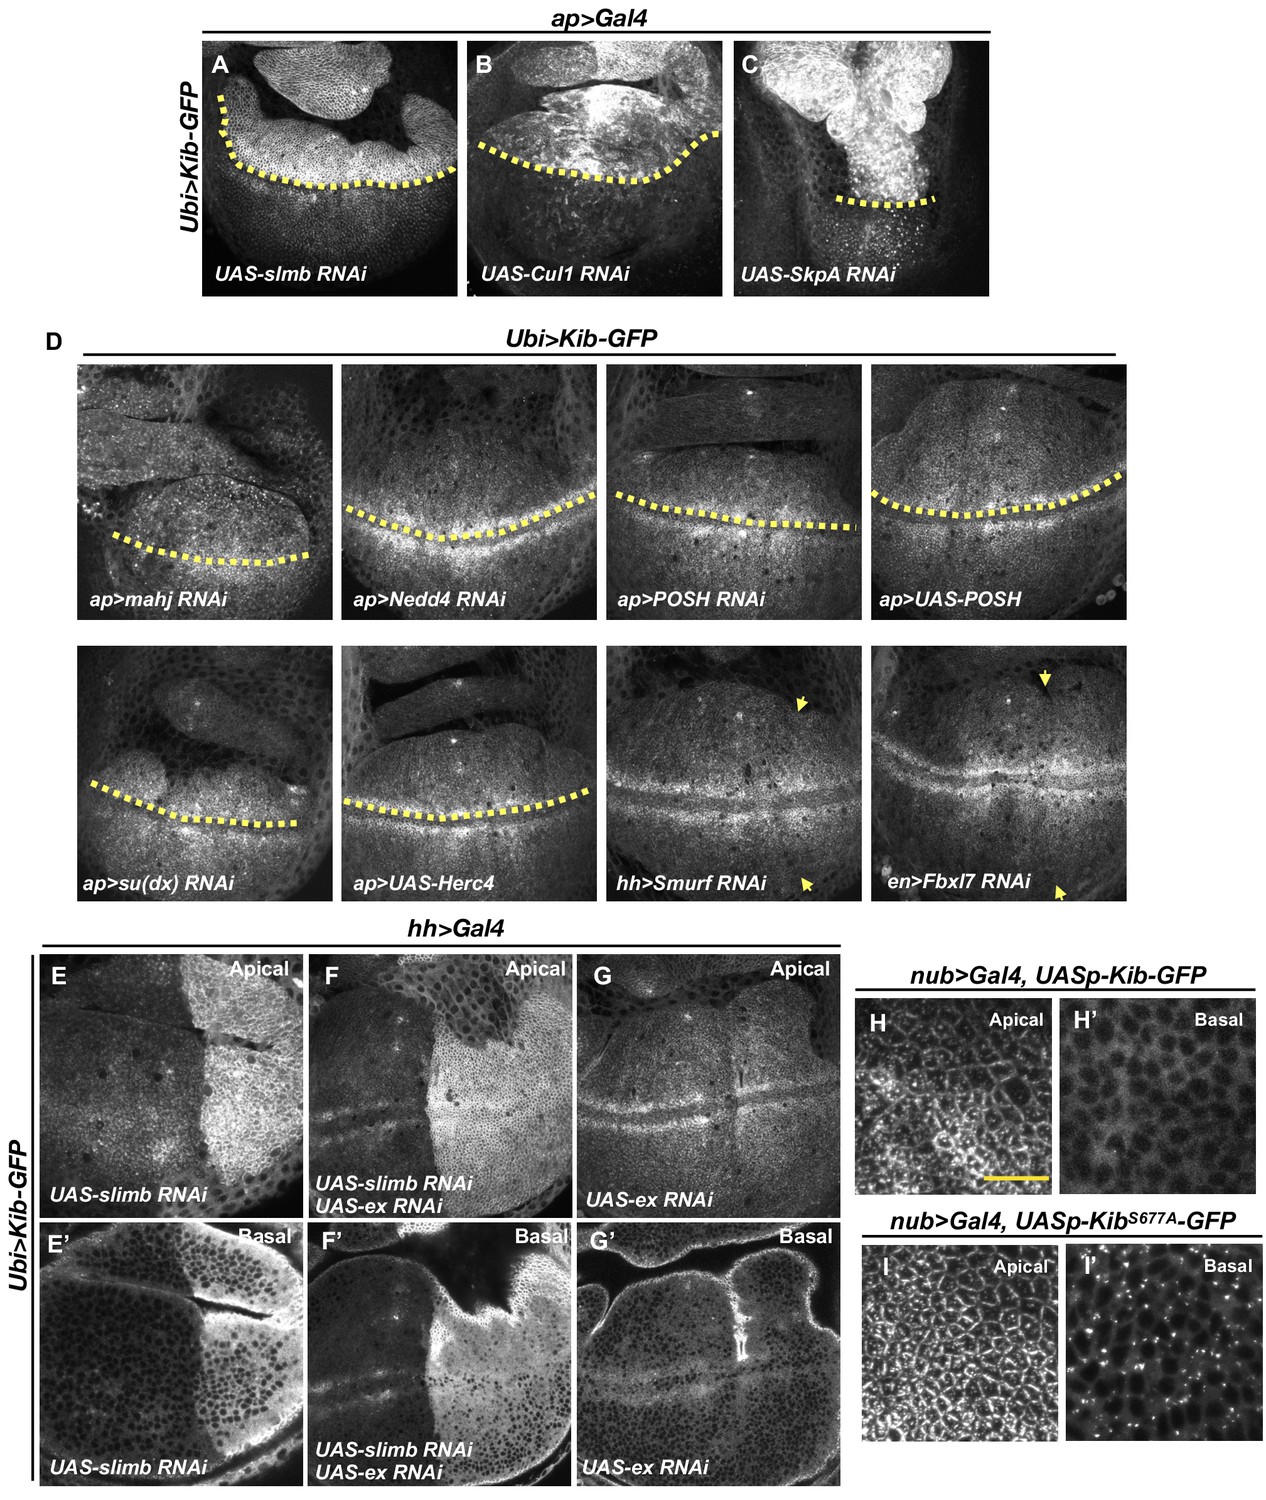
Effect of different E3 ubiquitin ligases involved in the Hippo (Hpo) pathway on Kibra (Kib) levels.
(A–C) Depletion of SCFSlimb E3 ubiquitin ligase components Slimb (A), Cul1 (B), or SkpA (C) in the dorsal compartment of the wing imaginal disc results in increased Ubi>Kib-GFP levels. (D) Depletion or overexpression of other E3 ubiquitin ligases known to regulate Hpo pathway components has no effect on Ubi>Kib-GFP levels. Yellow dashed line represents the dorsal–ventral boundary, with dorsal side up (for ap>Gal4); yellow arrows indicate the anterior–posterior boundary, with posterior to the right (for hh and en>Gal4). (E–G’) Ubi>Kib-GFP levels are elevated upon depletion of Slimb alone or co-depletion of Slimb and Expanded (Ex), but not when Ex alone is depleted in the posterior compartment of the wing imaginal disc. (H–I’) Confocal images of Kib-GFP or KibS677A-GFP expressed under UASp control with nub>Gal4. KibS677A-GFP shows similar localization to Kib-GFP apically but KibS677A-GFP forms foci basally. Note that images in (I) and (I’) were taken at lower gain than images in (H) and (H’) to avoid saturation. Scale bars=10 μm.
Figure 4
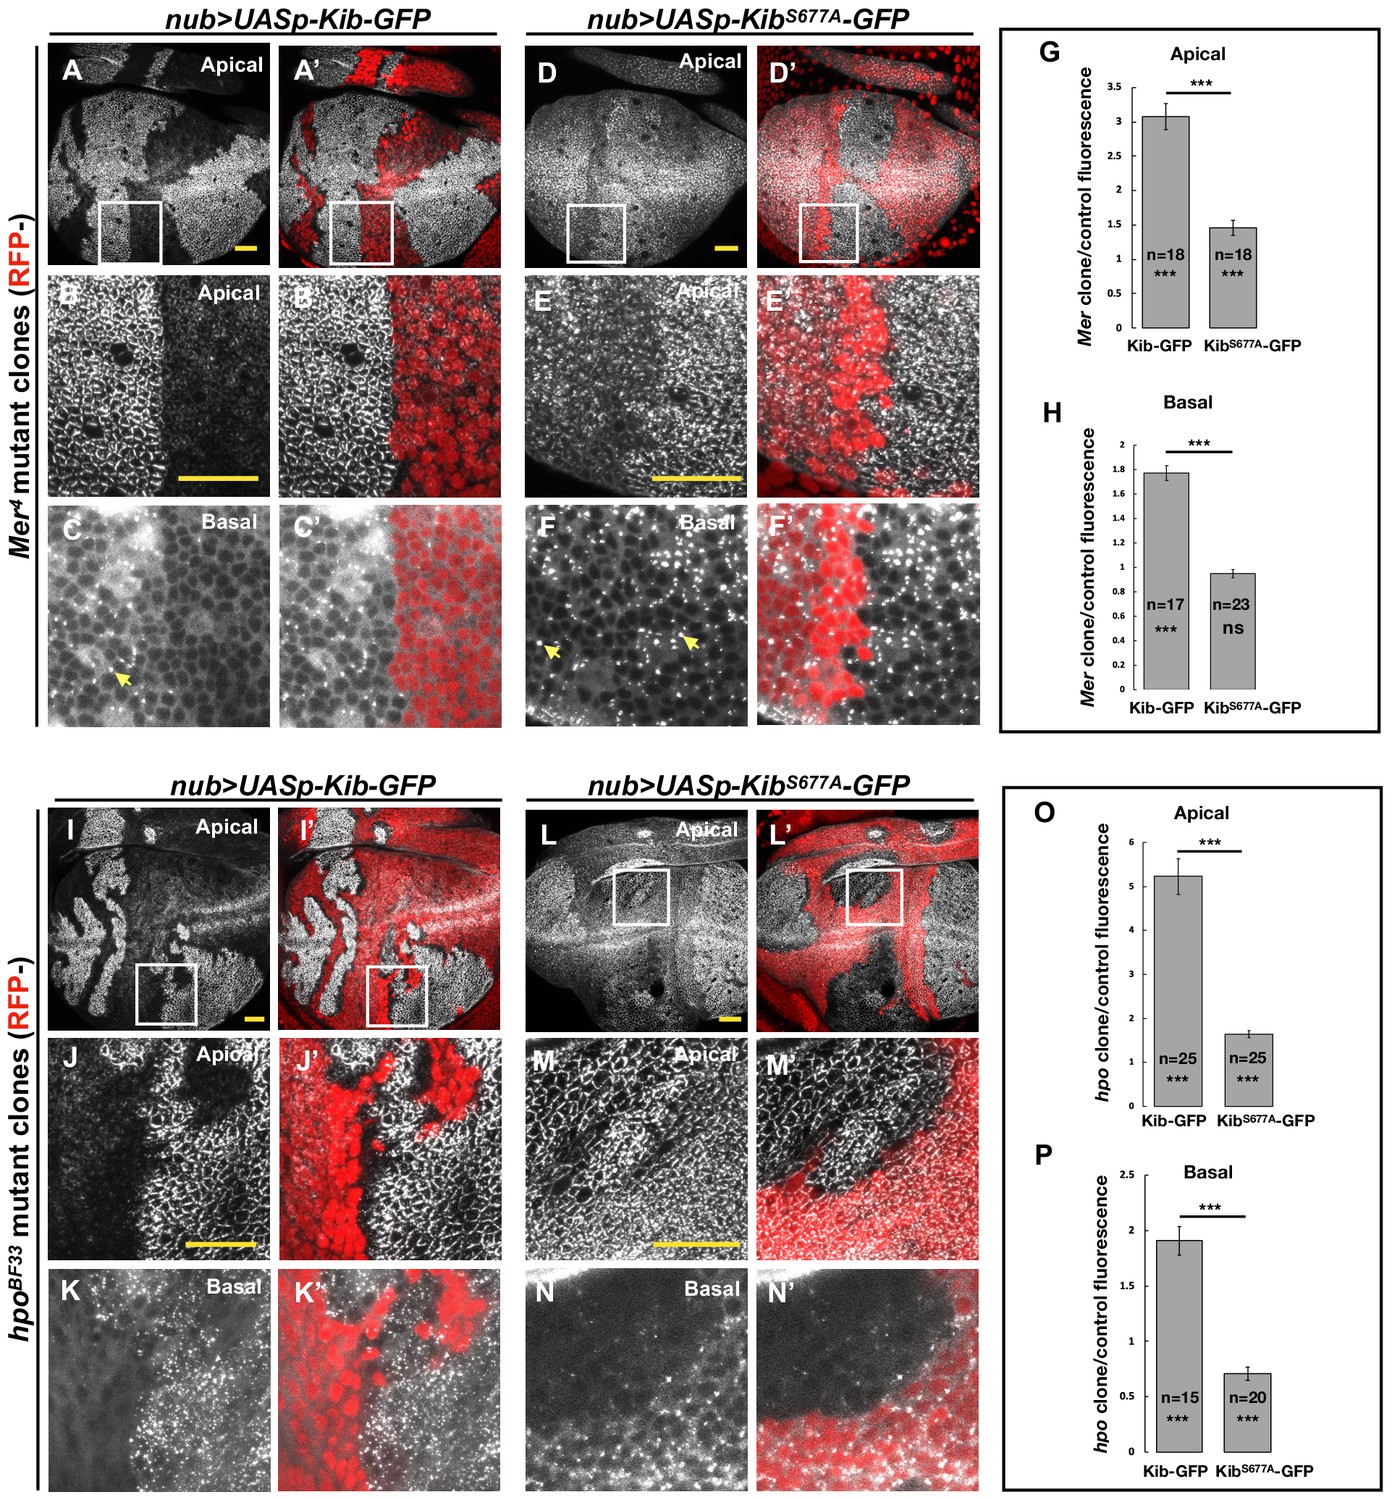
The Hippo pathway regulates Kibra (Kib) abundance via a putative degron motif.
(A–F’) Mer somatic mosaic clones in wing discs expressing either UASp-Kib-GFP (A-C') or UASp-KibS677A-GFP (D–F’) with the nub>Gal4 driver. Note that wild-type Kib-GFP is significantly elevated in Mer clones both apically and basally, while KibS677A-GFP is only slightly stabilized apically and is not affected basally. Yellow arrows in C and F point to presumed Kib aggregates due to increased abundance. All scale bars=20 μm. (G–H) Quantification of clone/control ratio of apical (G) and basal (H) Kib-GFP fluorescence. All quantification is represented as the mean ± SEM; asterisks above the plots show p-values between the transgenes; asterisks inside each bar show p-values for each transgene with respect to 1; n=number of clones (no more than two clones per wing disc were used for quantification). Statistical comparison was performed using Mann–Whitney U-test. (I–N’) hpo somatic mosaic clones in wing discs expressing either UASp-Kib-GFP (I–K’) or UASp-KibS677A-GFP (L–N’) with the nub>Gal4 driver. Note that wild-type Kib-GFP levels are significantly elevated in hpo clones both apically and basally, while KibS677A-GFP is stabilized apically but depleted basally in hpo clones. (O–P) Quantification of clone/control ratio of apical (O) and basal (P) Kib-GFP fluorescence.
Figure 5 with 1 supplement
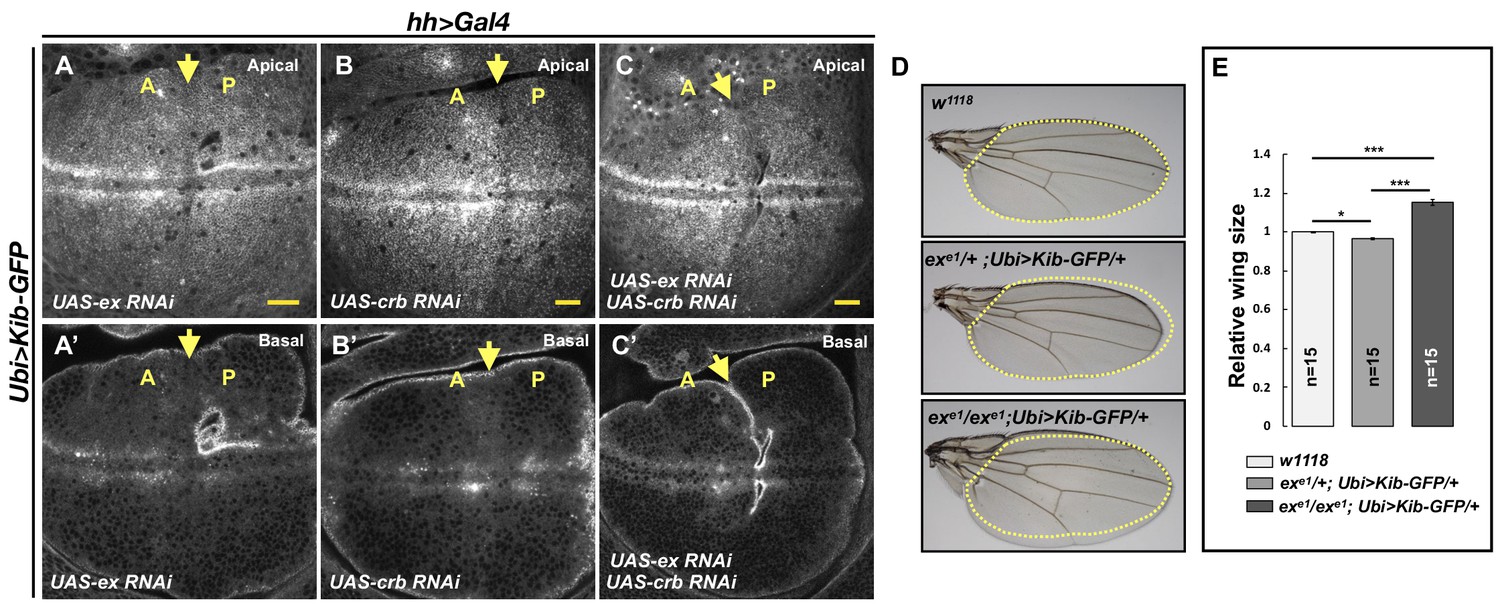
Kibra (Kib) abundance is regulated independently of Ex.
(A–C’) Depletion of Ex (A and A’), Crumbs (Crb; B and B’), or both Ex and Crb (C and C’) in the posterior wing imaginal disc does not affect Ubi>Kib-GFP abundance. Yellow arrows indicate the anterior–posterior (A–P) boundary. Scale bars=20 μm. (D–E) Adult wings of w1118, exe1/+; Ubi>Kib-GFP/+, or exe1/exe1; Ubi>Kib-GFP/+ flies. Quantification of wing sizes in (E) is represented as the mean ± SEM; n=number of wings (one wing per fly). Statistical comparison was performed using the one-way ANOVA test followed by Tukey’s HSD test.
Figure 5—figure supplement 1
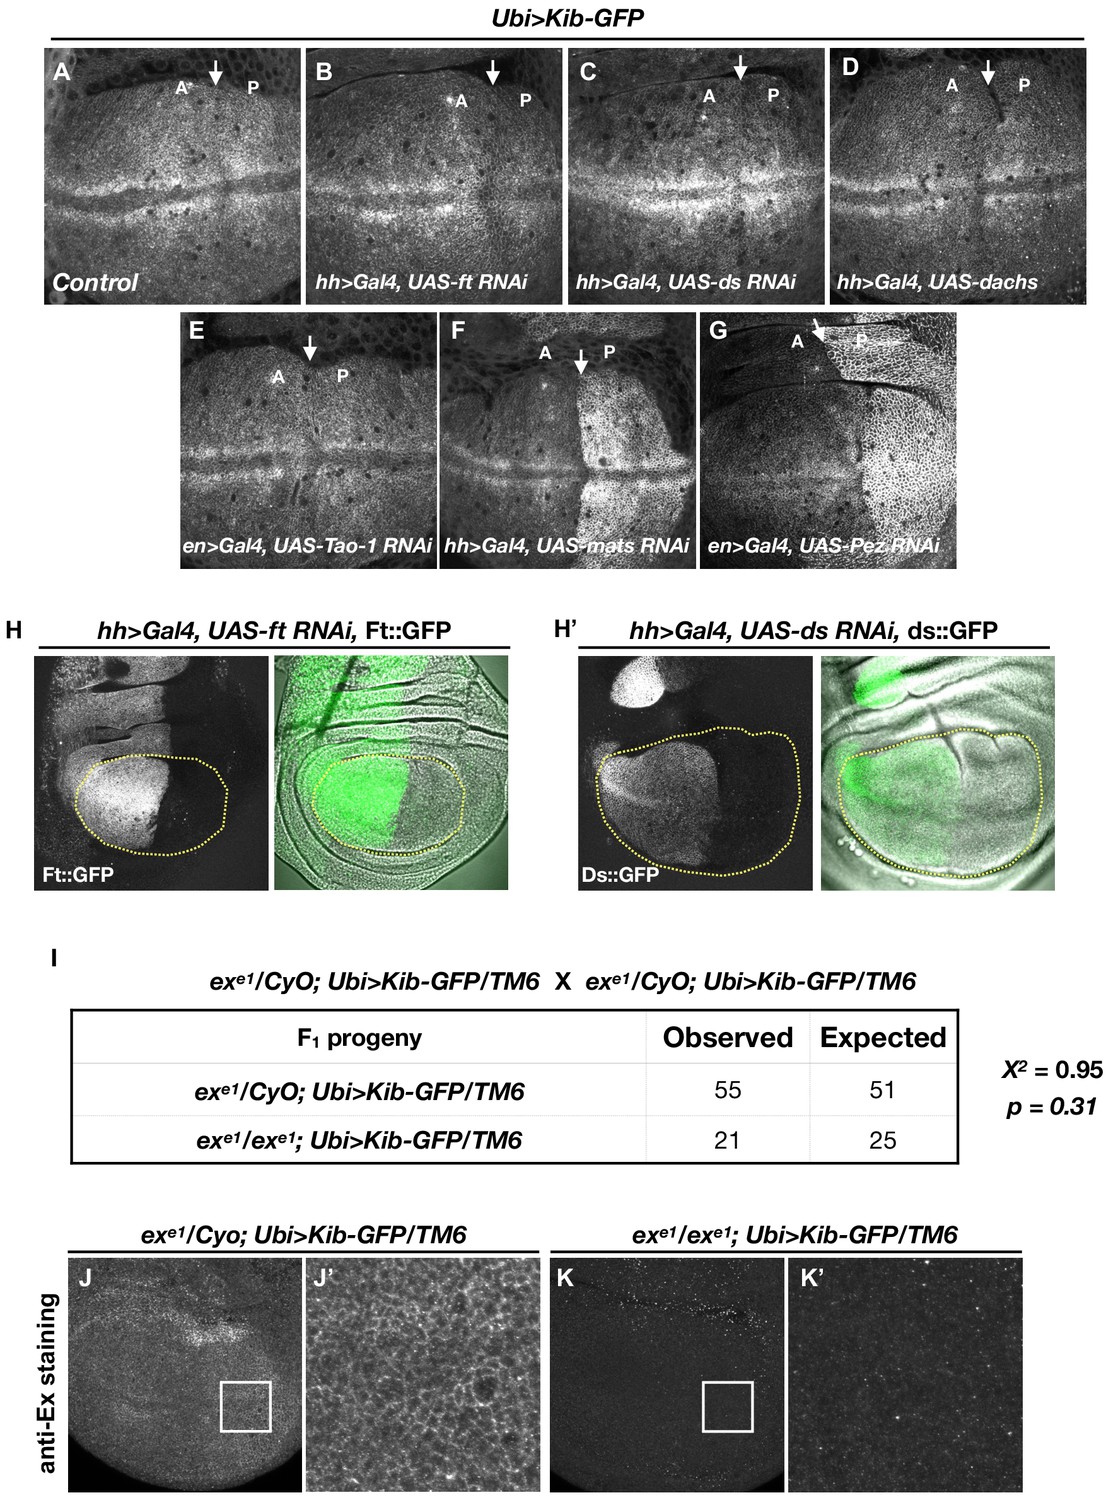
The Hippo (Hpo) pathway controls Kibra (Kib) abundance in a tightly compartmentalized manner.
(A–G) Kib abundance is regulated only by a subset of Hpo pathway components. (H–H’) Validation of RNAi lines against ft (H) and ds (H’) used to deplete these components in (B) and (C), respectively. (I) Chi-square analysis shows that exe1 homozygotes survive as expected if ectopic Kib completely suppresses ex lethality. (J–K’) Ectopic Kib suppresses exe1 lethality. Wing discs of exe1 heterozygous larvae (J and J’) or exe1 homozygous larvae (K and K’) carrying Ubi>Kib-GFP were stained for ExEx to confirm the presence of the exe1 allele.
Figure 6 with 2 supplements
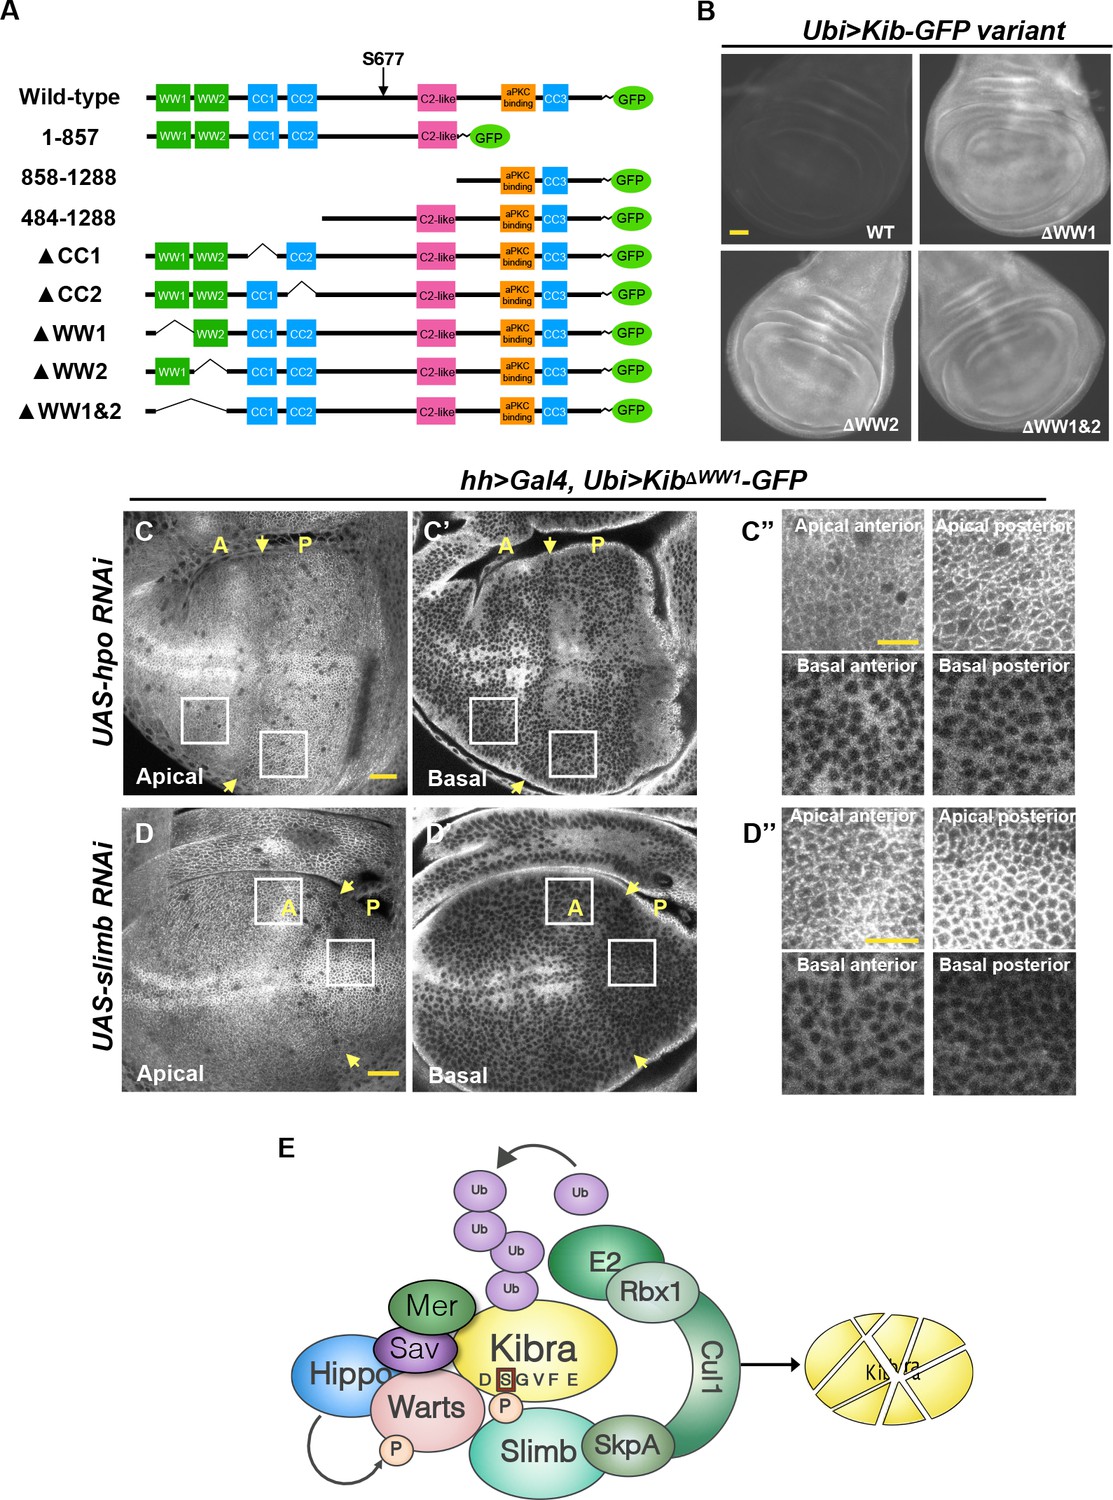
The WW domains of Kibra (Kib) are required for Hippo (Hpo) pathway- and Slimb-mediated degradation.
(A) Diagram of Kib truncations generated for this study. (B) Widefield fluorescence images of wing imaginal discs expressing wild-type and WW-domain truncations of Kib-GFP expressed under the ubiquitin promoter. All images were taken with identical settings. Scale bar=40 μm. (C–C’’) Depletion of Hpo does not affect expression of Ubi>KibΔWW1-GFP. Note that Hpo depletion leads to apical stabilization and basal depletion of KibΔWW1-GFP (C’’). (D–D’’) Depletion of Slimb does not affect expression of Ubi>KibΔWW1-GFP. Note that similar to Hpo depletion, loss of Slimb leads to slight apical stabilization and basal depletion of KibΔWW1-GFP (D’’). Yellow arrows indicate A–P boundary of the wing discs. Scale bars=20 μm (C and D) and 10 μm (C’’ and D’’). (E) A model of Kib degradation by the Hpo pathway and Slimb.
Figure 6—figure supplement 1
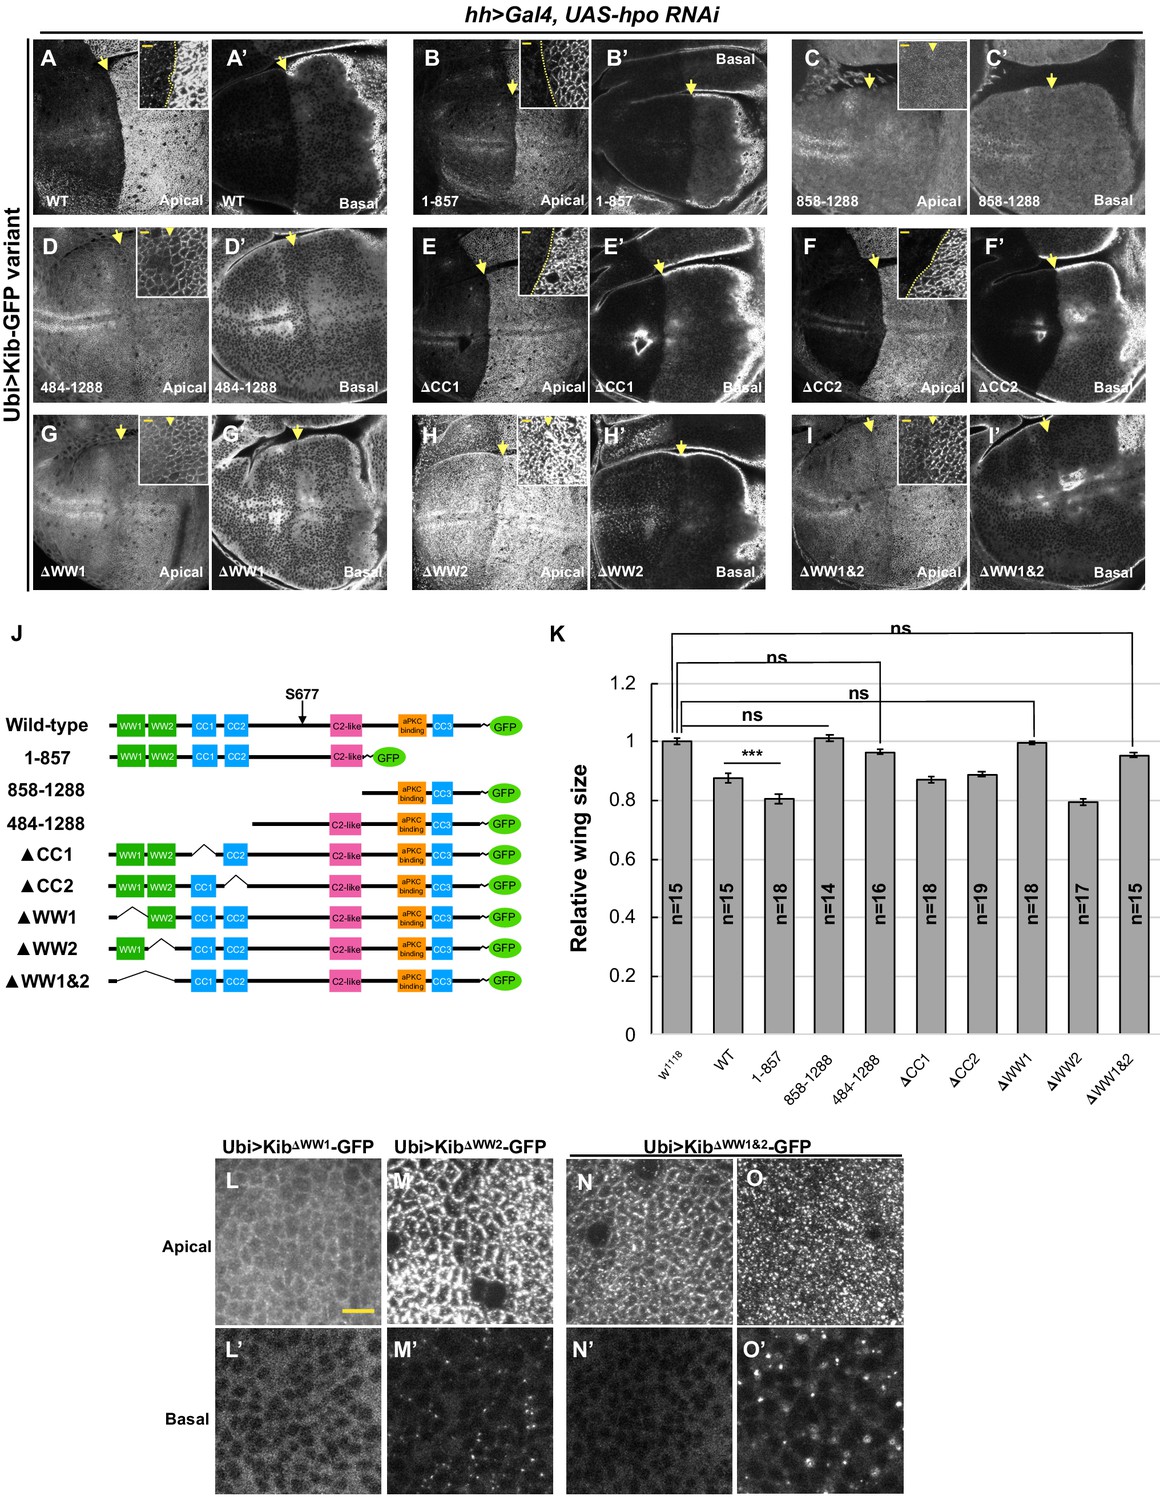
The role of WW domains in Hippo pathway-mediated Kibra (Kib) degradation.
(A–I’) Effect of Hpo depletion in the posterior compartment of the wing imaginal disc on different Kib truncations. Deletion of the WW domains, individually (G–H’) or together (I and I’) stabilizes Kib apically but does not lead to an increase in basal Kib levels. Note that tissue in (G) is the same as shown in Figure 6C. Scale bars in the insets represent 3 μm for the insets and 10 μm for the corresponding low magnification image. (J) Diagram of Kib truncations generated for this study (same as in Figure 6A). (K) Size comparison (relative to wild-type) of adult wings from flies ectopically expressing different Ubi>Kib-GFP truncations. Quantification is shown as the mean ± SEM; n=number of wings. Statistical comparison was performed using the one-way ANOVA test followed by Tukey’s HSD test. (L–O’) Localization of Kib lacking WW1 (L and L’), WW2 (M and M’), or both WW1 and WW2 (N–O’) in wing imaginal disc cells. Note that Ubi>KibΔWW1&2-GFP localization is variable; sometimes it localizes normally at the junctions (N) and is diffused basally (N’), but usually it accumulates in bright foci both apically and basally (O and O’). Scale bar=10 μm.
Figure 6—figure supplement 2

Complex formation and Kibra (Kib) degradation.
(A–D) Slimb forms a complex with wild-type Kib and KibΔWW1&2 (A), Mer1-600 (B), Hpo (C), and Wts (D). (E–F) Co-IP of wild-type Kib or KibΔWW1&2 with Mer (E) or Wts (F). All experiments were performed using lysates from transfected S2 cells.
Figure 7 with 1 supplement
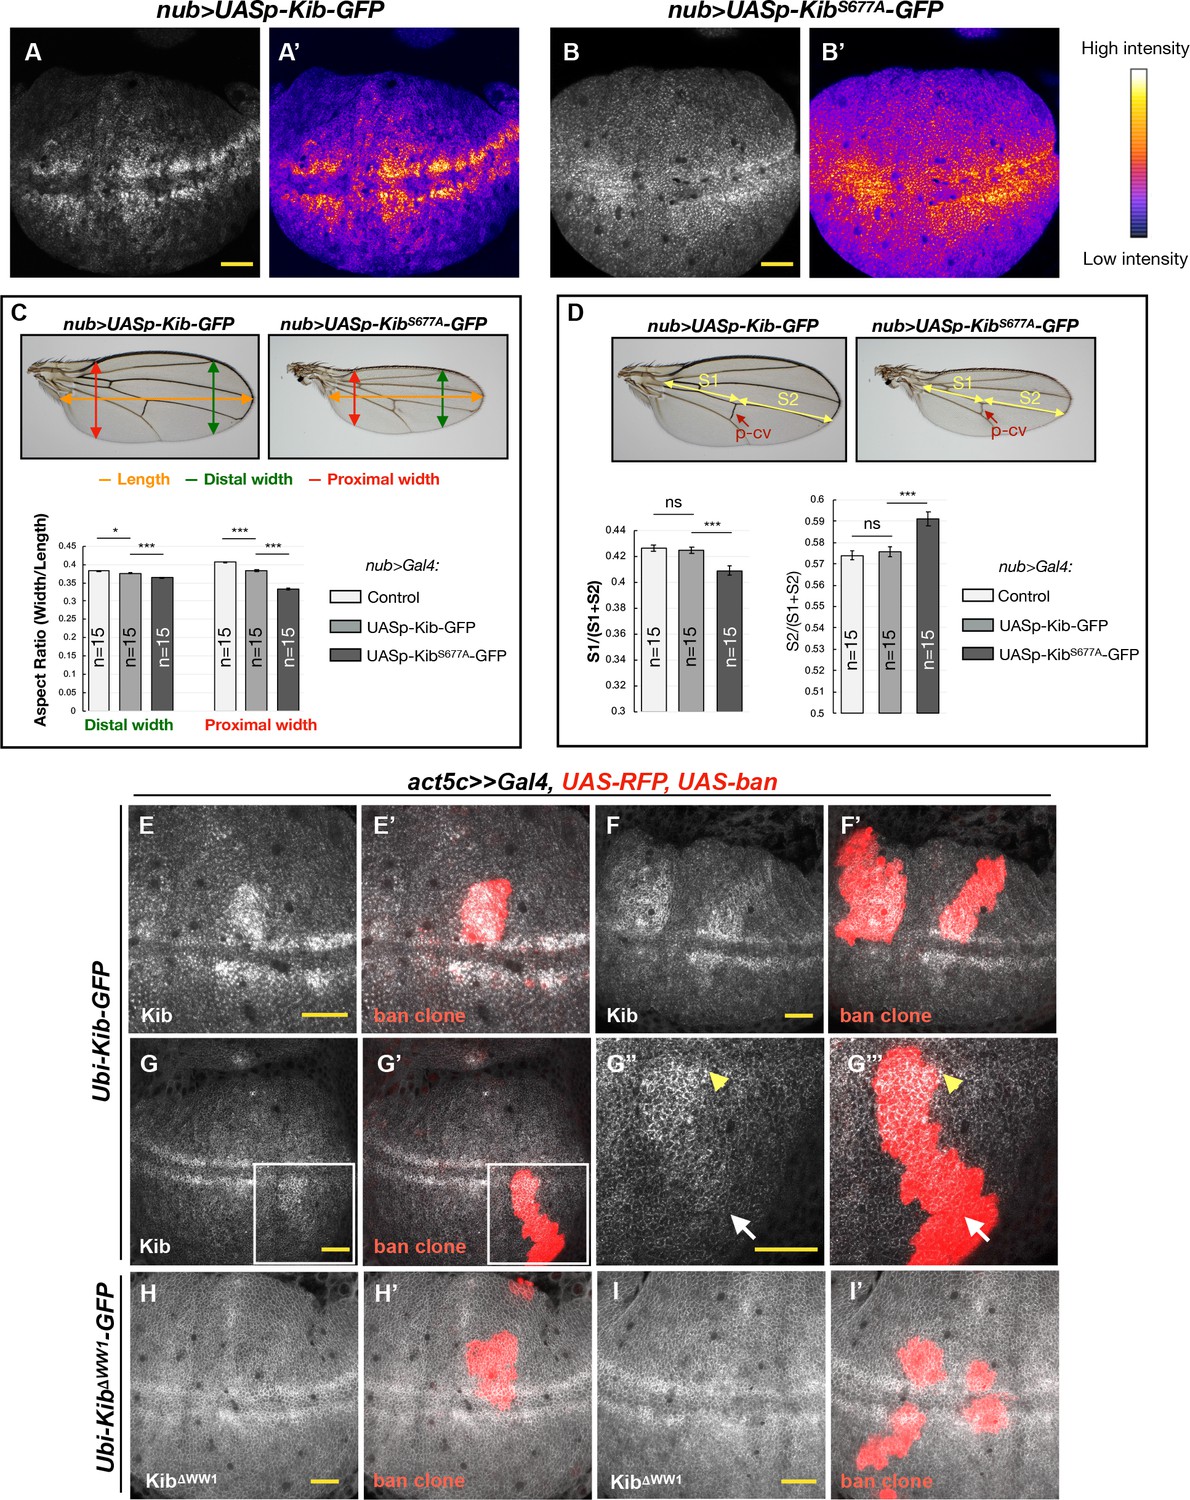
Kibra (Kib) degradation is patterned by mechanical tension in the wing pouch to control proportional growth.
(A–B’) Grayscale images of the wing pouch, which produces the adult wing blade, expressing UASp-Kib-GFP (A) or UASp-KibS677A-GFP (B) at identical genomic locations under the nub>Gal4 driver. Corresponding heatmap intensity images are shown in (A’) and (B’). Note that KibS677A-GFP displays a more uniform distribution across the pouch than wild-type Kib-GFP. (C) Quantification of aspect ratios of adult wings expressing nub>Gal4 alone or with UASp-Kib-GFP and UASp-KibS677A-GFP. The color-coded segments in the wing image represent the wing length (orange), distal width (green), and proximal width (red). (D) Quantification of the length of proximal (S1) or distal (S2) wing region with respect to total wing length in wings expressing nub>Gal4 alone or with UASp-Kib-GFP and UASp-KibS677A-GFP; p-cv=posterior crossvein. All quantification is represented as the mean ± SEM; n=number of wings (one wing per fly). Statistical comparison was performed using the one-way ANOVA test followed by Tukey’s HSD test. (E–F’) Kib-GFP levels are elevated in rapidly proliferating UAS-bantam clones. (G–G’’’) Increased Kib abundance is more pronounced at the center of the wing pouch (yellow arrowhead) than at its periphery (white arrow). (H–I’) KibΔWW1-GFP levels do not change in bantam-expressing clones. All scale bars=20 μm.
Figure 7—figure supplement 1
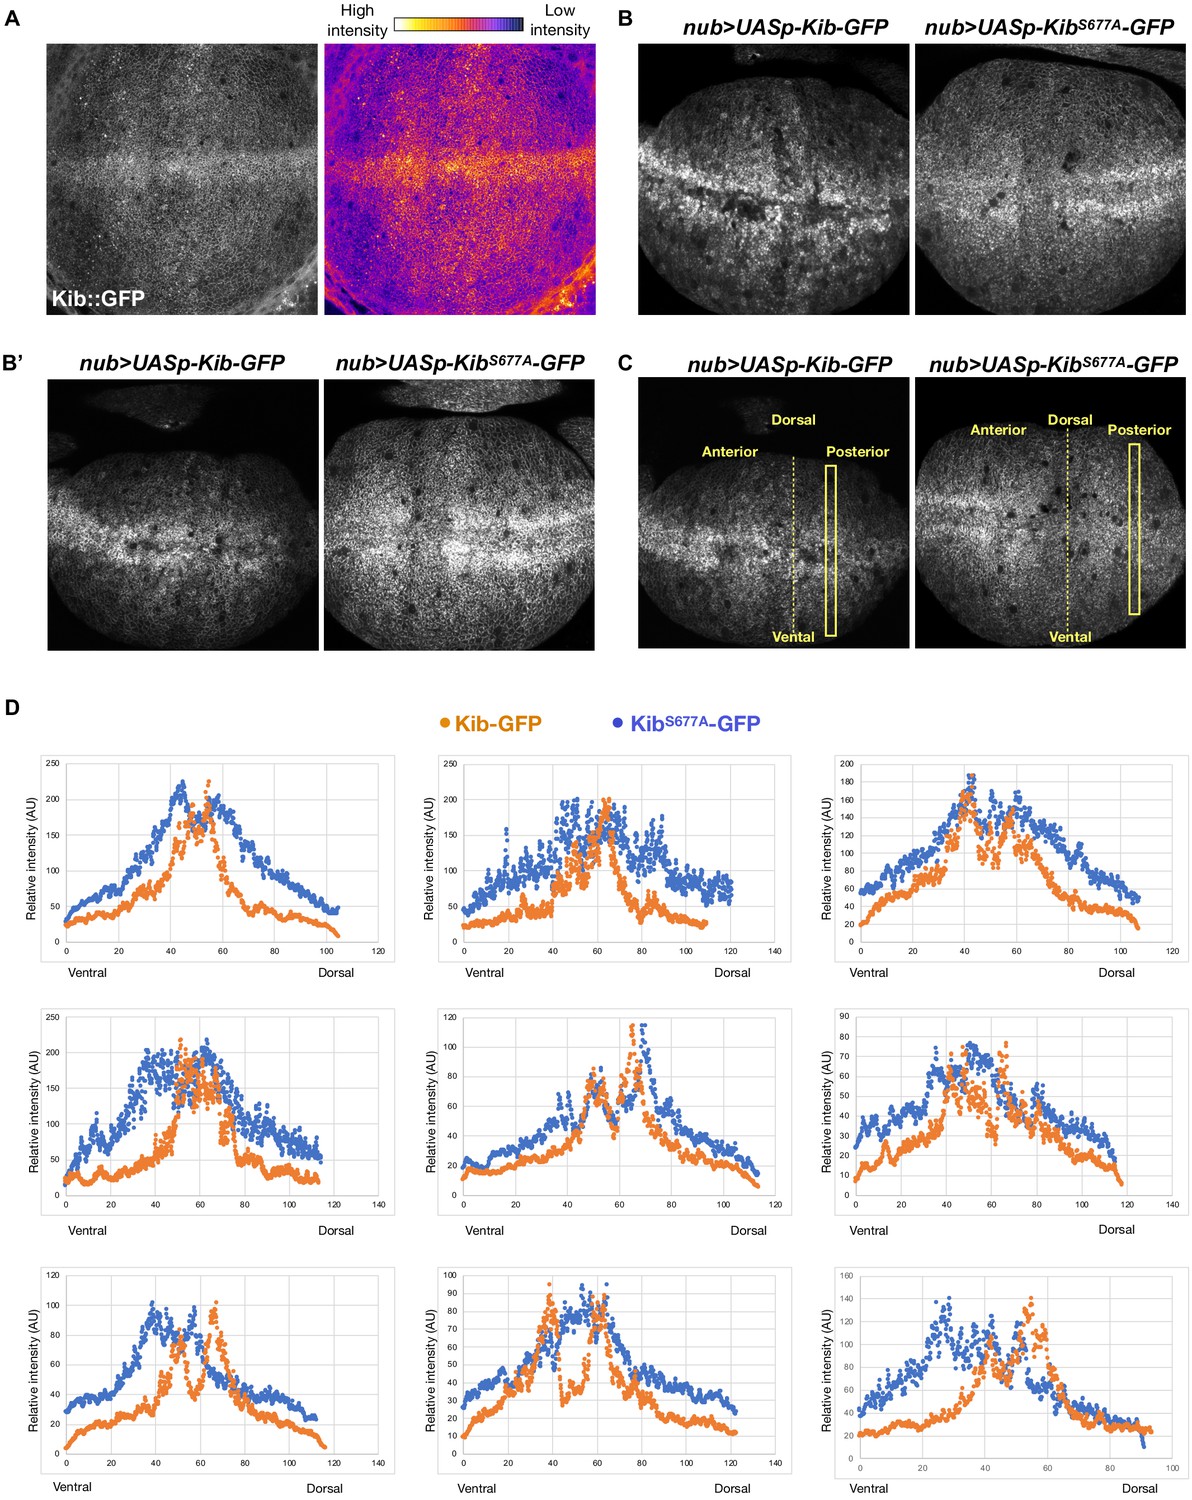
Kibra (Kib) degradation is not uniform across the pouch region of the wing imaginal disc.
(A) A grayscale and heatmap image of a wing imaginal disc expressing endogenous Kib::GFP. (B–B’) Additional examples of wing discs expressing Kib-GFP or KibS677A-GFP under UASp control using the nub>Gal4 driver focused on the wing pouch, which produces the adult wing blade. (C) To generate the intensity profiles in (C), rectangular selections of equal length were drawn on each disc either in the anterior or posterior region (same side was used for each pair). Intensity values from UASp-Kib-GFP discs were normalized to the maximum value of UASp-KibS677A-GFP discs. (D) Intensity profiles of nine pairs of wing imaginal discs expressing UASp-Kib-GFP or UASp-KibS677A-GFP under the nub>Gal4 driver. In each case, wild-type Kib intensity drops more severely from the distal (middle) to proximal (most dorsal or ventral) part of the wing pouch.
Tables
Key resources table
| Reagent type (species) or resource | Designation | Source or reference | Identifiers | Additional information |
|---|---|---|---|---|
| Gene (Drosophila melanogaster) | kibra | DOI: 10.1016/j.devcel.2009.12.012 DOI: 10.1016/j.devcel.2009.12.011 DOI: 10.1016/j.devcel.2009.12.013 | FLYB: FBgn0262127 | |
| Genetic reagent (D. melanogaster) | Kib::GFP | DOI: 10.1016/j.devcel.2017.02.004 | ||
| Genetic reagent (D. melanogaster) | Mer4 19AFRT | LaJeunesse et al., 1998 | ||
| Genetic reagent (D. melanogaster) | exe1 40AFRT | PMID: 8269855 | ||
| Genetic reagent (D. melanogaster) | 19AFRT sd47M | Wu et al., 2008 | ||
| Genetic reagent (D. melanogaster) | hpoBF33 42DFRT | Jia et al., 2003 | ||
| Genetic reagent (D. melanogaster) | ban3-GFP | DOI: 10.1242/dev.070367 | ||
| Genetic reagent (D. melanogaster) | UAS-Mer RNAi | DOI: 10.1016/j.devcel.2017.02.004 | ||
| Genetic reagent (D. melanogaster) | UAS-sav RNAi | Bloomington Drosophila Stock Center | BL 28006 | |
| Genetic reagent (D. melanogaster) | UAS-hpo RNAi | Vienna Drosophila Resource Center | VDRC 104169 | |
| Genetic reagent (D. melanogaster) | UAS-wts RNAi | Vienna Drosophila Resource Center | VDRC 106174 | |
| Genetic reagent (D. melanogaster) | UAS-ex RNAi | Vienna Drosophila Resource Center | VDRC 109281 | |
| Genetic reagent (D. melanogaster) | UAS-crb RNAi | Vienna Drosophila Resource Center | VDRC 39177 | |
| Genetic reagent (D. melanogaster) | UAS-yki RNAi (III) | Vienna Drosophila Resource Center | VDRC 40497 | |
| Genetic reagent (D. melanogaster) | UAS-slimb RNAi | Bloomington Drosophila Stock Center | BL 33898 | |
| Genetic reagent (D. melanogaster) | UAS-Cul1 RNAi | Bloomington Drosophila Stock Center | BL 29520 | |
| Genetic reagent (D. melanogaster) | UAS-SkpA RNAi | Bloomington Drosophila Stock Center | BL 32870 | |
| Genetic reagent (D. melanogaster) | UAS-mahj RNAi | Bloomington Drosophila Stock Center | BL 34912 | |
| Genetic reagent (D. melanogaster) | UAS-Nedd4 RNAi | Bloomington Drosophila Stock Center | BL 34741 | |
| Genetic reagent (D. melanogaster) | UAS-POSH RNAi | Bloomington Drosophila Stock Center | BL 64569 | |
| Genetic reagent (D. melanogaster) | UAS-POSH | Bloomington Drosophila Stock Center | BL 58990 | |
| Genetic reagent (D. melanogaster) | UAS-Su(dx) RNAi | Bloomington Drosophila Stock Center | BL 67012 | |
| Genetic reagent (D. melanogaster) | UAS-Herc4 | DOI: 10.1371/journal.pone.0131113 | ||
| Genetic reagent (D. melanogaster) | UAS-Smurf RNAi | Bloomington Drosophila Stock Center | BL 40905 | |
| Genetic reagent (D. melanogaster) | UAS-Fbxl7 RNAi | Vienna Drosophila Resource Center | VDRC 108628 | |
| Genetic reagent (D. melanogaster) | UAS-ft RNAi | Bloomington Drosophila Stock Center | BL 34970 | |
| Genetic reagent (D. melanogaster) | UAS-ds RNAi | Vienna Drosophila Resource Center | VDRC 36219 | |
| Genetic reagent (D. melanogaster) | UAS-dachs-V5 | DOI: 10.1242/dev.02427 | ||
| Genetic reagent (D. melanogaster) | UAS-Tao1 RNAi | Vienna Drosophila Resource Center | VDRC 17432 | Previously used in DOI: 10.1016/j.devcel.2011.08.028 |
| Genetic reagent (D. melanogaster) | UAS-mats RNAi | Bloomington Drosophila Stock Center | BL 34959 | |
| Genetic reagent (D. melanogaster) | UAS-Pez RNAi | Bloomington Drosophila Stock Center | BL 33918 | |
| Genetic reagent (D. melanogaster) | Ey>Flp 19AFRT Ubi-GFP; Ubi-RFP 42DFRT | DOI: 10.1016/j.devcel.2013.04.021 | ||
| Genetic reagent (D. melanogaster) | Ft-GFP | VDRC 318477 | ||
| Genetic reagent (D. melanogaster) | Ds:GFP | Brittle et al., 2012 | ||
| Genetic reagent (D. melanogaster) | Ubi-Kib-GFP-FLAG 86Fb | This paper | See Materials and methods section | |
| Genetic reagent (D. melanogaster) | UASp-Kib-GFP-FLAG 86Fb | This paper | See Materials and methods section | |
| Genetic reagent (D. melanogaster) | UASp-KibS677A-GFP-FLAG 86Fb (this study) | This paper | See Materials and methods section | |
| Genetic reagent (D. melanogaster) | Ubi-Kib-GFP-FLAG VK37 | This paper | See Materials and methods section | |
| Genetic reagent (D. melanogaster) | Ubi-KibΔWW1-GFP-FLAG VK37 | This paper | See Materials and methods section | |
| Genetic reagent (D. melanogaster) | Ubi-KibΔWW2-GFP-FLAG VK37 | This paper | See Materials and methods section | |
| Genetic reagent (D. melanogaster) | Ubi-KibΔWW1 and 2-GFP-FLAG VK37 | This paper | See Materials and methods section | |
| Genetic reagent (D. melanogaster) | Ubi-Kib1-857-GFP-FLAG VK37 | This paper | See Materials and methods section | |
| Genetic reagent (D. melanogaster) | Ubi-Kib484-1288-GFP-FLAG VK37 | This paper | See Materials and methods section | |
| Genetic reagent (D. melanogaster) | Ubi-Kib858-1288-GFP-FLAG VK37 | This paper | See Materials and methods section | |
| Genetic reagent (D. melanogaster) | Ubi-KibΔCC1-GFP-FLAG VK37 | This paper | See Materials and methods section | |
| Genetic reagent (D. melanogaster) | Ubi-KibΔCC2-GFP-FLAG VK37 | This paper | See Materials and methods section | |
| Antibody | anti-Ex (Guinea pig polyclonal) | DOI: 10.1016/j.cub.2006.02.063 | RRID:AB_2568722 | Tissue staining (1:5000) |
| Antibody | anti-FLAG (Mouse monoclonal) | Sigma Aldrich | Cat#F1804; RRID:AB_262044 | IB (1:20,000) |
| Antibody | anti-Sd (Guinea pig polyclonal) | Guss et al., 2013 | RRID:AB2567874 | Tissue staining (1:1000) |
| Antibody | anti-GFP (Guinea pig polyclonal) | DOI: 10.1091/mbc.E19-07-0387 | NA | IP (1:1250) |
| Antibody | anti-GFP (Rabbit polyclonal) | Michael Glotzer (University of Chicago) | NA | IB (1:5000) |
| Antibody | anti-Hpo (mouse polyclonal) | DOI: 10.1016/j.devcel.2017.02.004 | NA | IB (1:5000) |
| Antibody | anti-HA (Rabbit polyclonal) | Santa Cruz | Cat#sc-805; RRID:AB_631618 | IB (1:5000) |
| Antibody | anti-Myc 9B11 (Mouse monoclonal) | Cell Signaling | Product #2276 | IP (1:1000) IB (1:40,000) |
| Antibody | anti-V5 (Mouse monoclonal) | GenScript | Cat# A01724-100 | IB (1:2500) |
| Antibody | anti-alpha tubulin (Mouse monoclonal) | Sigma Aldrich | Cat# T 9026 | IB (1:2500) |
| Cell line (D. melanogaster) | S2-DGRC | Cherbas Lab, Indiana University | RRID:CVCL_TZ72 | https://dgrc.bio.indiana.edu/product/View?product=6 |
Additional files
-
Supplementary file 1
Primers used in this study with the corresponding sequences.
Note the highlighted G residue in KibS677A For primer corresponds to the substitution that will result in the mutation of serine-677 to alanine.
- https://cdn.elifesciences.org/articles/62326/elife-62326-supp1-v2.docx
-
Transparent reporting form
- https://cdn.elifesciences.org/articles/62326/elife-62326-transrepform-v2.docx
Download links
A two-part list of links to download the article, or parts of the article, in various formats.
Downloads (link to download the article as PDF)
Open citations (links to open the citations from this article in various online reference manager services)
Cite this article (links to download the citations from this article in formats compatible with various reference manager tools)
Negative feedback couples Hippo pathway activation with Kibra degradation independent of Yorkie-mediated transcription
eLife 10:e62326.
https://doi.org/10.7554/eLife.62326


