Protective effect of Mediterranean-type glucose-6-phosphate dehydrogenase deficiency against Plasmodium vivax malaria
- Mahidol Oxford Tropical Medicine Research Unit (MORU), Faculty of Tropical Medicine, Mahidol University, Thailand
- Nangarhar Medical Faculty, Afghanistan
- Kabul Medical University, Afghanistan
- Department of Molecular Tropical Medicine and Genetics, Faculty of Tropical Medicine, Mahidol University, Thailand
- Centre for Tropical Medicine and Global Health, Nuffield Department of Medicine, University of Oxford, United Kingdom
Figures
Figure 1
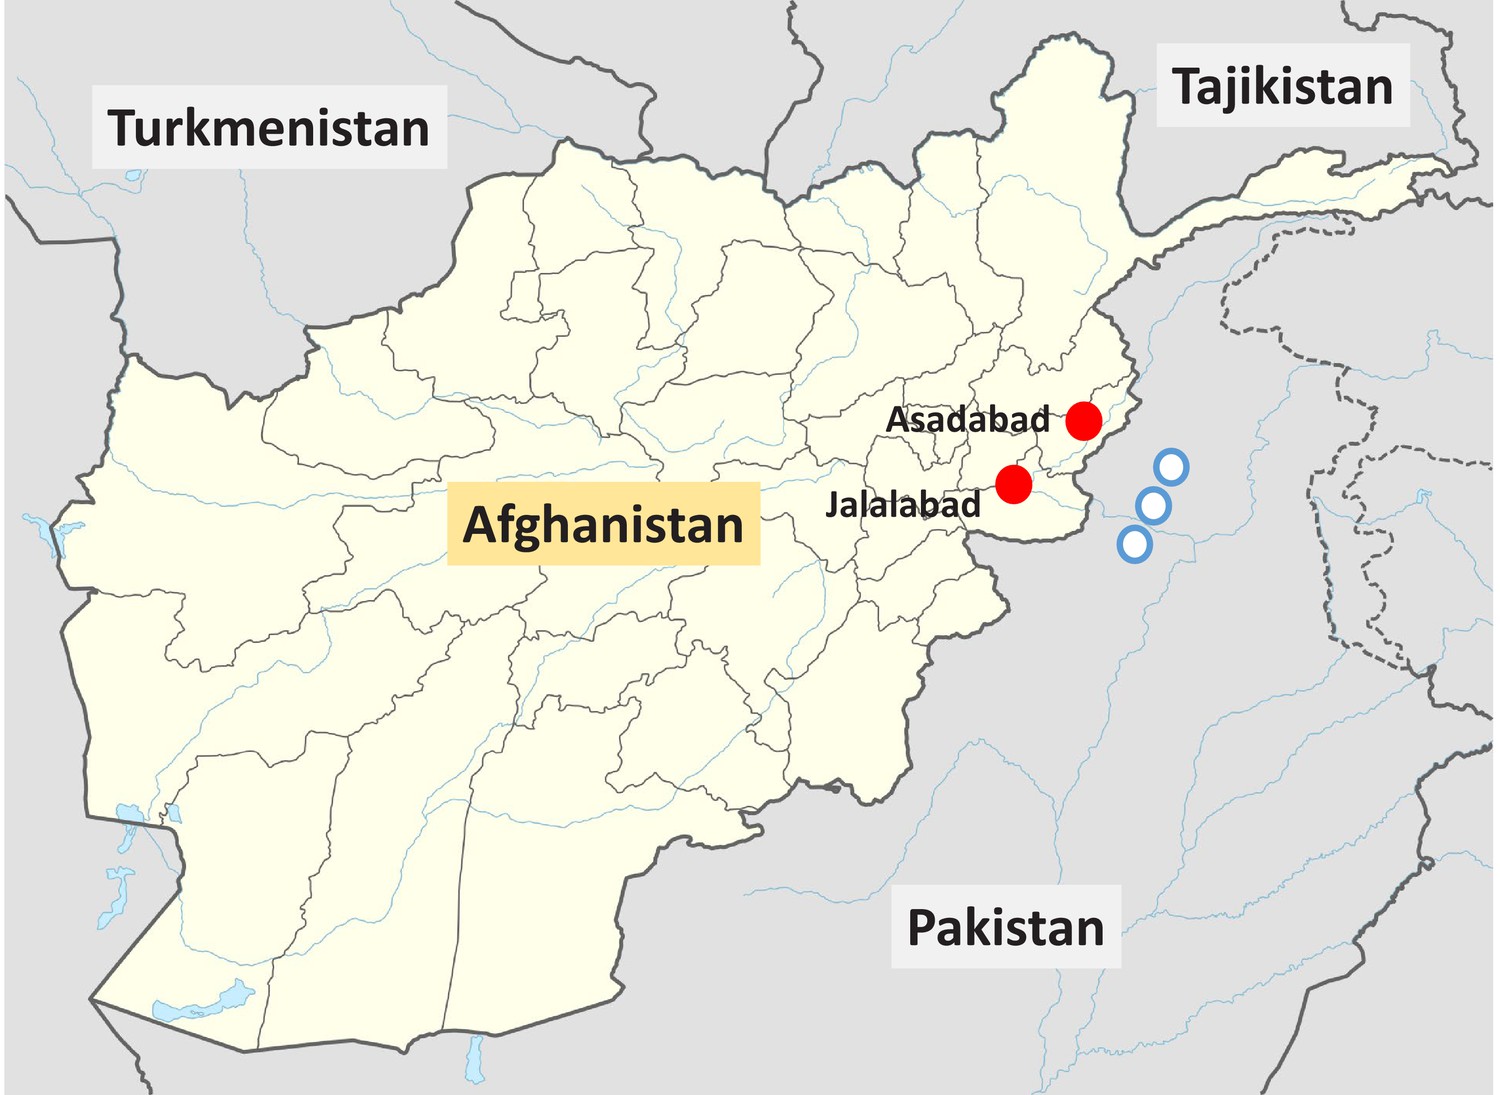
Locations of the two vivax malaria clinical study sites in Eastern Afghanistan from the present study (red circles), and the approximate locations of the villages in the North-West frontier province of Pakistan where Afghan Pashtun refugees were enrolled in vivax malaria clinical trials and later included in case–control studies (Leslie et al., 2010) (blue circles).
Figure 2
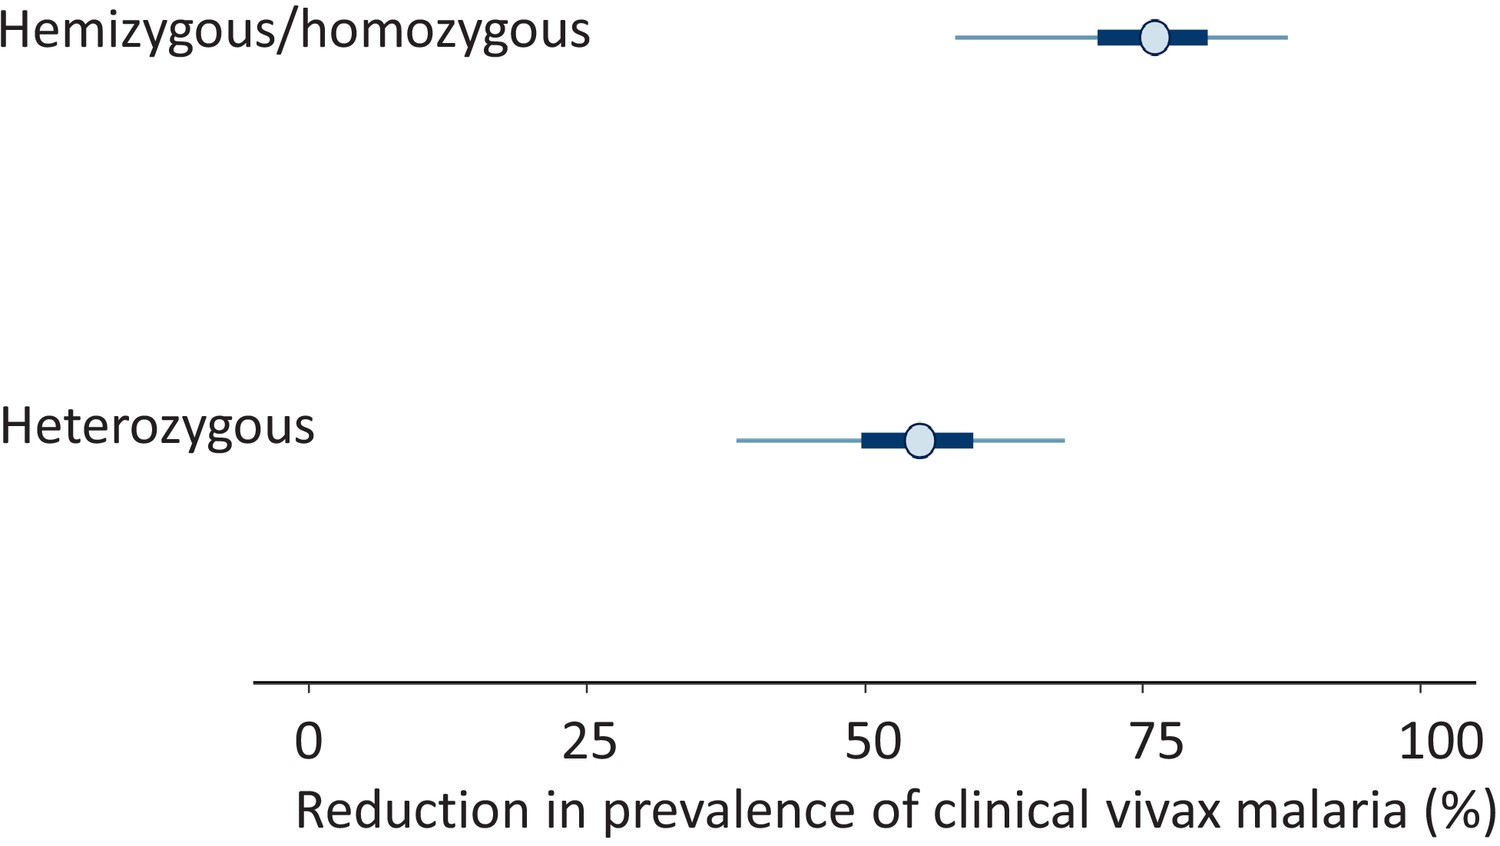
Results from the meta-analysis assessing the protective effect of the Mediterranean variant of G6PD deficiency against Plasmodium vivax malaria.
The posterior distributions of 1-α (top: hemi/homozygotes) and 1-β (bottom: heterozygotes) are shown as percentages. These values represent the reduction in prevalence of clinical vivax malaria relative to G6PD normal individuals. The circles show the median estimates, with the 50% credible intervals shown by the thick blue lines and the 95% credible intervals shown by the thin blue lines.
Figure 3
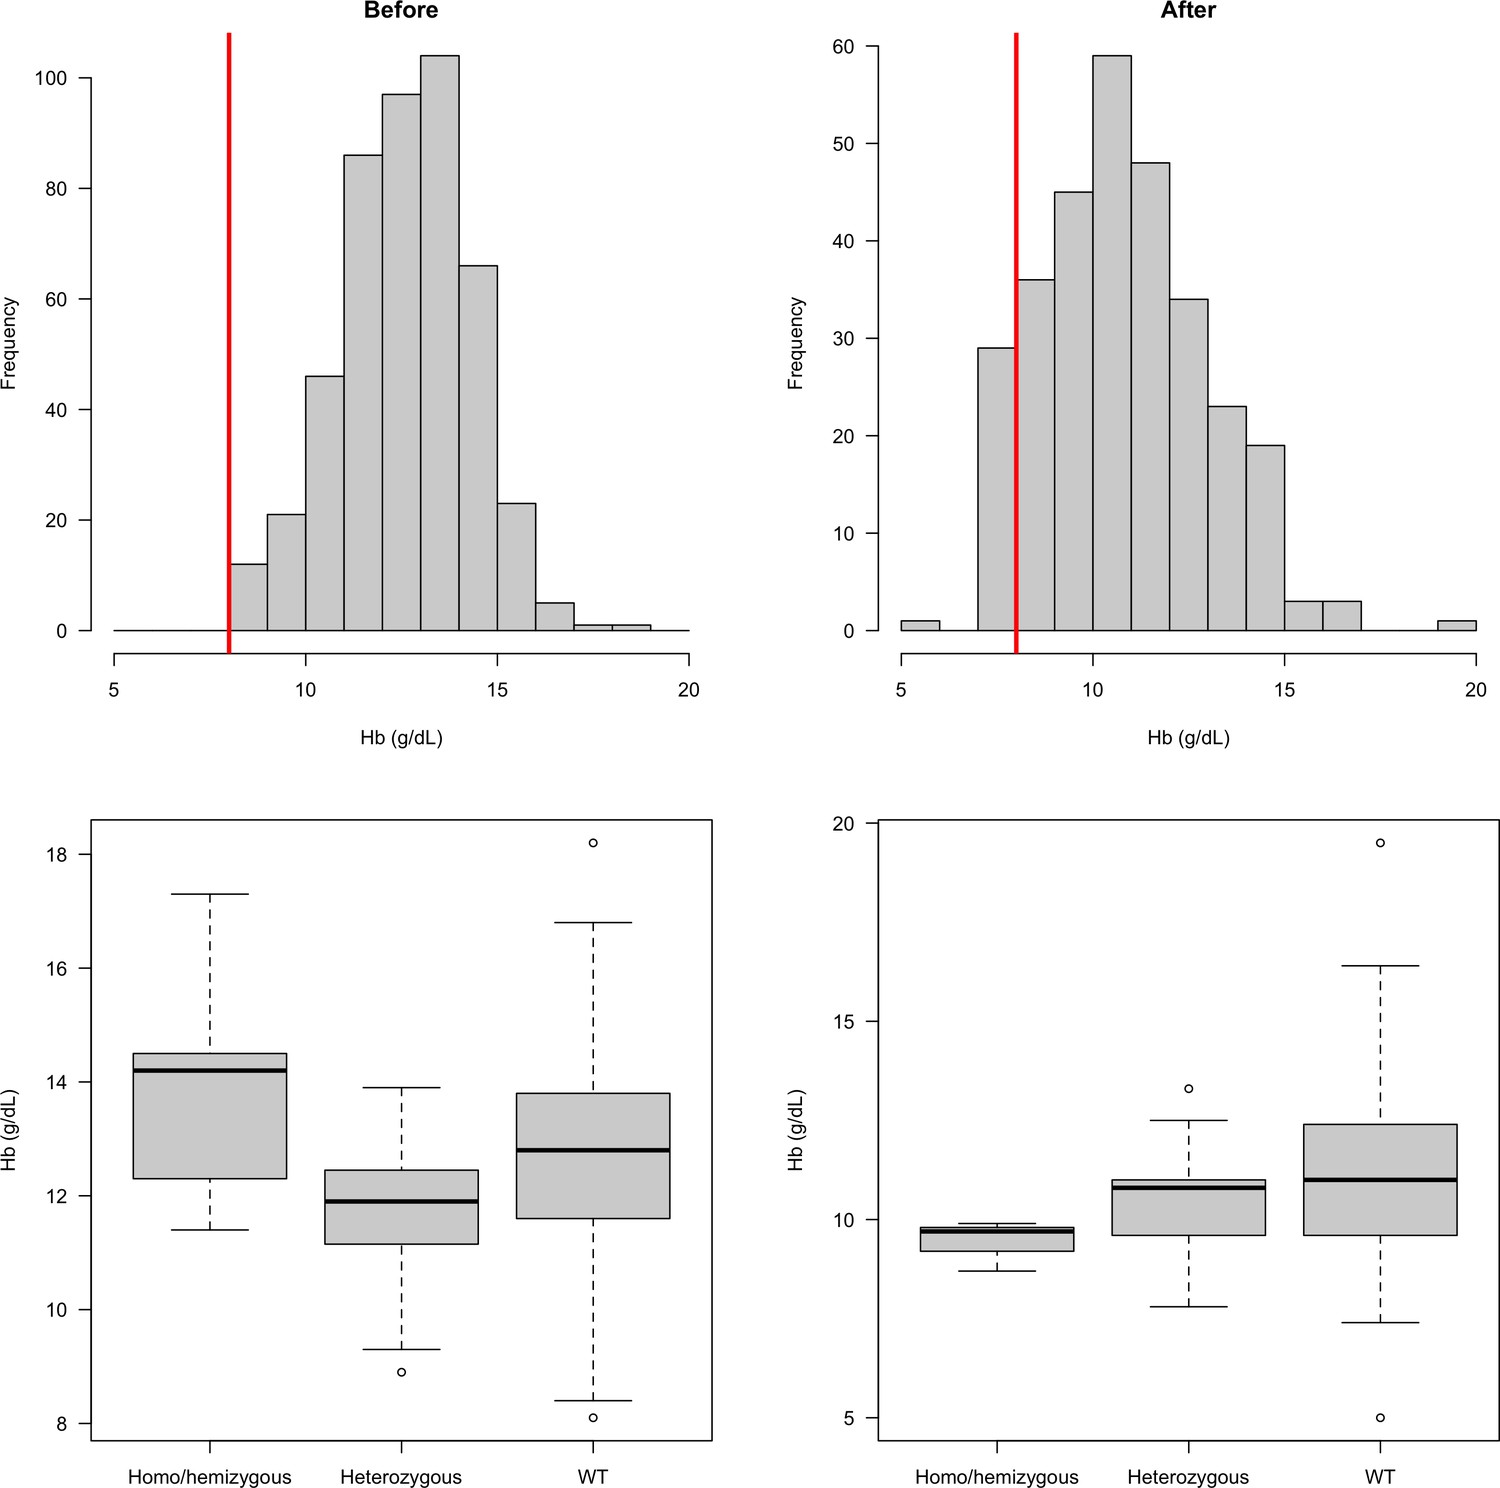
Distribution of admission haemoglobin concentrations in P. vivax malaria cases (overall: top row; stratified by G6PD genotype: bottom row).
The top row shows the distribution of haemoglobin concentrations in the first part of the study (left panel, when there was a cut-off at 8 g/dL for inclusion) and in the second part of the study (right panel: after this inclusion criteria was relaxed). The bottom row shows these two distributions stratified by the patients’ G6PD genotypes.
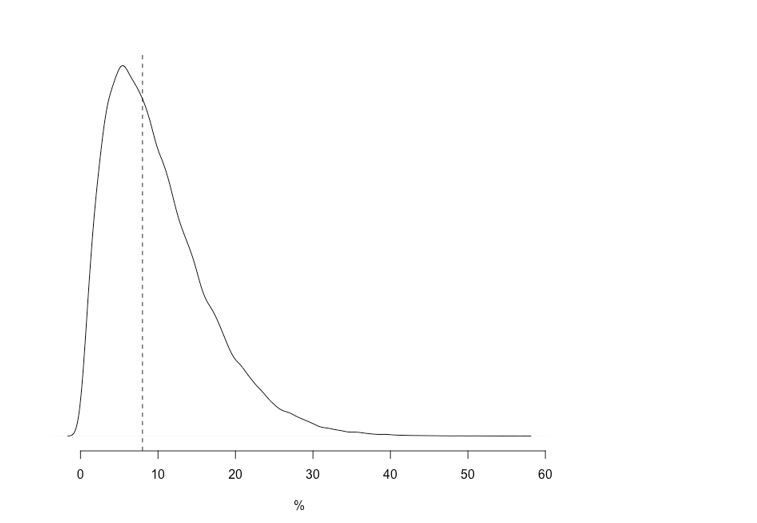
Author response image 1
Tables
Table 1
Summary of all case–control data included in the meta-analysis.
*Data from this report; 23 of 236 male controls from the earlier epidemiological study (Jamornthanyawat et al., 2014) and 5 of 106 male controls from the later studies were hemizygotes.
| General population (controls) | P. vivax malaria (cases) | ||||||||
|---|---|---|---|---|---|---|---|---|---|
| Awab et al* | Leslie et al., 2010 | Bouma et al., 1995 | Total | Awab et al* | Leslie et al., 2010 | Bouma et al., 1995 | Total | ||
| Males | Hemizygous | 28 | 31 | 25 | 84 | 5 | 2 | 0 | 7 |
| Normal | 314 | 285 | 214 | 813 | 299 | 155 | 0 | 454 | |
| Females | Homozygous | 2 | 2 | 0 | 4 | 3 | 0 | 0 | 3 |
| Heterozygous | 50 | 26 | 0 | 76 | 32 | 6 | 0 | 38 | |
| Normal | 305 | 126 | 0 | 431 | 425 | 72 | 0 | 497 | |
Additional files
-
Source code 1
Contains source code and data.
- https://cdn.elifesciences.org/articles/62448/elife-62448-code1-v2.zip
-
Transparent reporting form
- https://cdn.elifesciences.org/articles/62448/elife-62448-transrepform-v2.docx
Download links
A two-part list of links to download the article, or parts of the article, in various formats.
Downloads (link to download the article as PDF)
Open citations (links to open the citations from this article in various online reference manager services)
Cite this article (links to download the citations from this article in formats compatible with various reference manager tools)
Protective effect of Mediterranean-type glucose-6-phosphate dehydrogenase deficiency against Plasmodium vivax malaria
eLife 10:e62448.
https://doi.org/10.7554/eLife.62448


