Nanoscopic anatomy of dynamic multi-protein complexes at membranes resolved by graphene-induced energy transfer
- Department of Biology/Chemistry, University of Osnabrück, Germany
- Center of Cellular Nanoanalytics (CellNanOs), University of Osnabrück, Germany
- College of Life Sciences, Beijing University of Chemical Technology, China
- Department of Physics, University of Osnabrück, Germany
- 3rd Institute of Physics - Biophysics, Georg August University, Germany
- Cluster of Excellence “Multiscale Bioimaging: from Molecular Machines to Networks of Excitable Cells” (MBExC), Georg August University, Germany
Figures
Figure 1 with 1 supplement
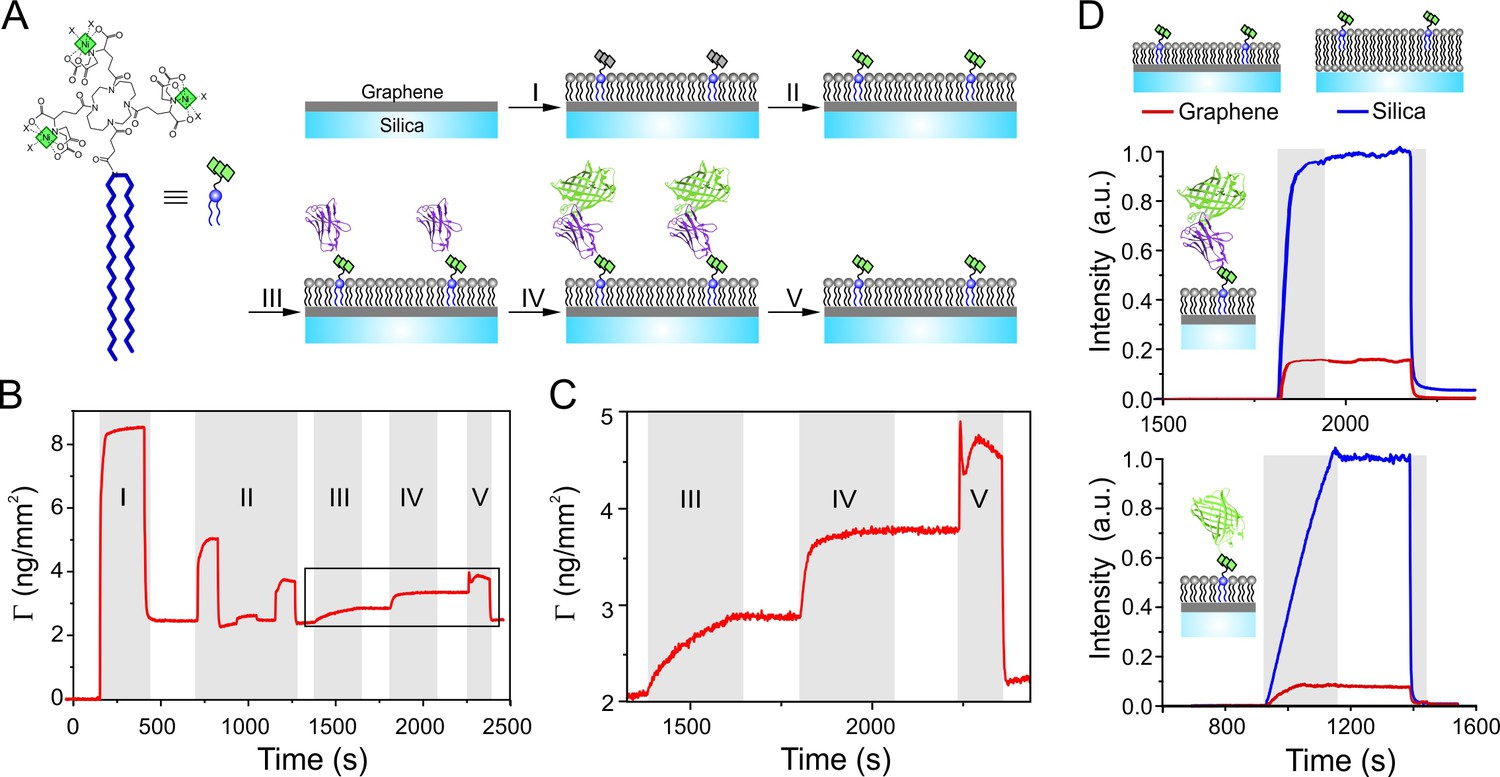
Functional protein reconstitution onto graphene-supported lipid monolayers.
(A) Scheme of the graphene-supported lipid monolayer doped with trisNTA-DODA for site-specific capturing of His-tagged proteins. (B, C) Label-free detection of protein binding on graphene monitored by reflectance interference (RIF): (I) lipid coating; (II) conditioning of tris-NTA chelator by EDTA, Ni2+, imidazole; (III) binding of anti-GFP nanobody fused with H6 tag (NB-H6); (IV) binding of tagless mEGFP; (V) imidazole wash. (C) Zoom-up showing immobilization of NB-H6 and interaction with tagless mEGFP. (D) Fluorescence quenching by GIET quantified in real-time by simultaneous TIRFS-RIF detection for mEGFP using trisNTA-functionalized lipid monolayer on graphene (red) or lipid bilayer on silica (blue), respectively. Upper panel: normalized fluorescence intensities for tagless mEGFP binding to immobilized NB-H6 (as in panels A–C). Lower panel: Fluorescence intensities of H6-mEGFP directly bound to trisNTA-DODA. Normalized fluorescence intensities were calculated according to Equation (1) taking the mass signals into account.
Figure 1—figure supplement 1
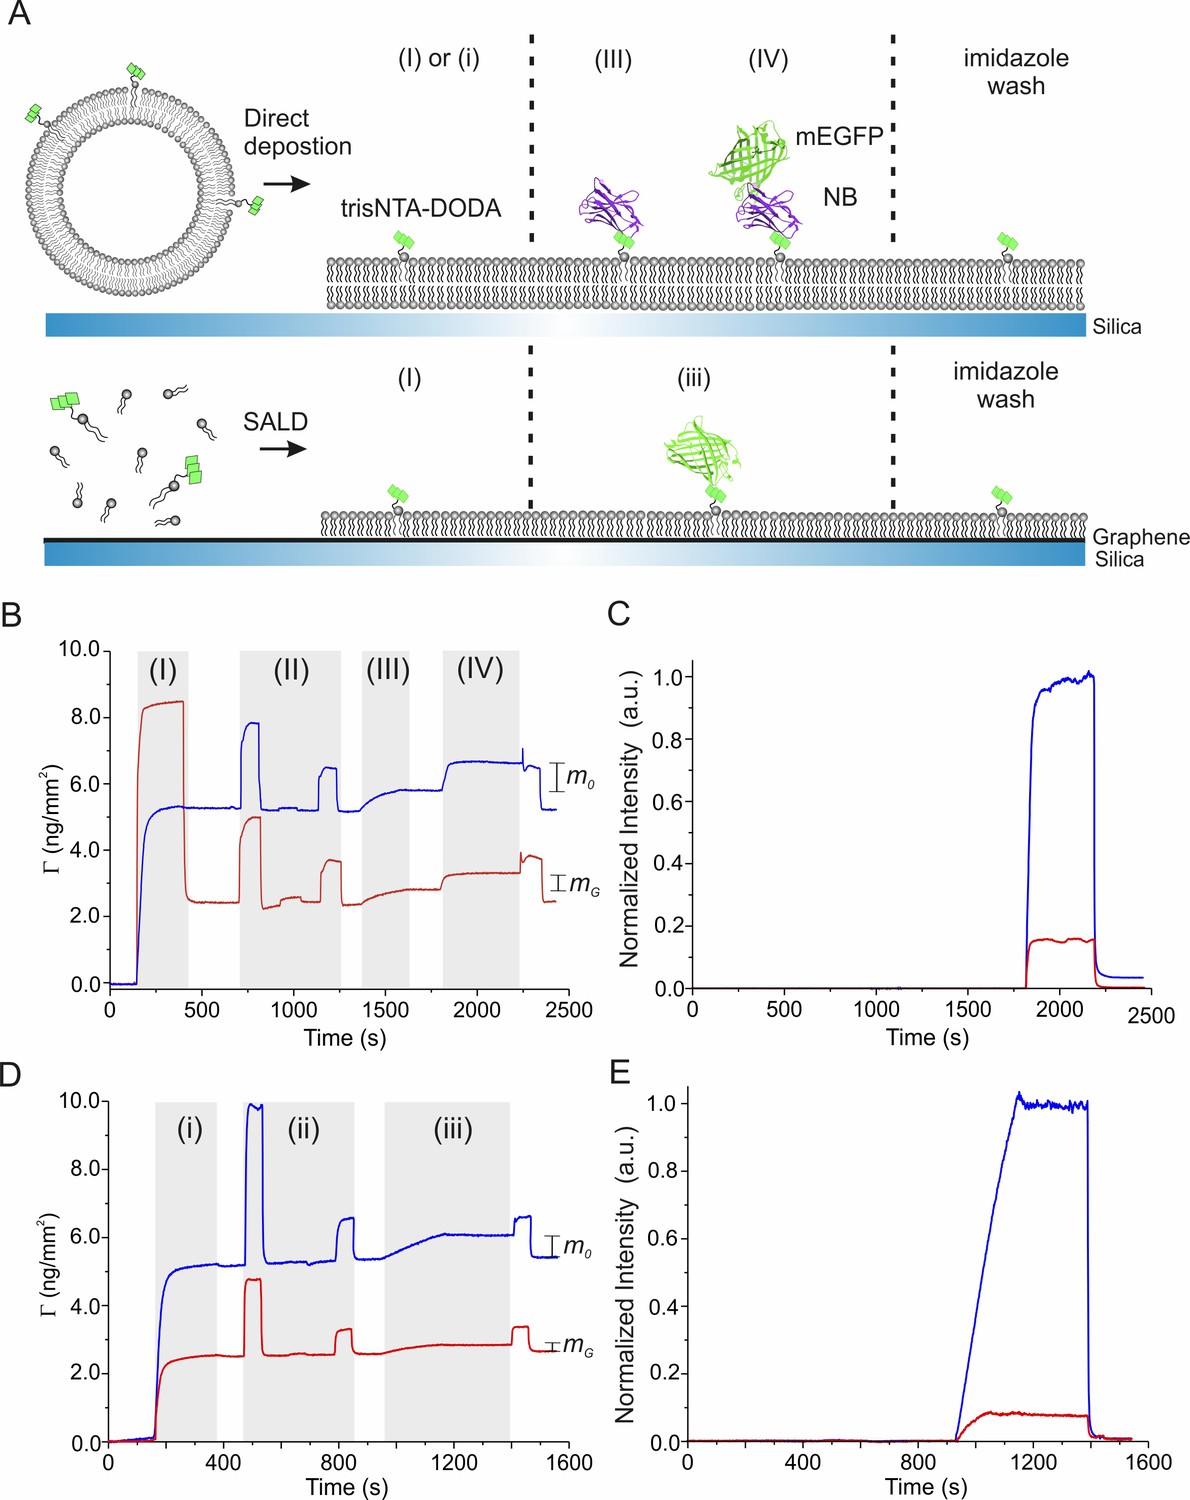
Surface sensitive TIRFS-RIF detection of protein binding on graphene.
(A) Schemes of lipid layer formation, trisNTA-DODA conditioning and protein binding on silica (top) and graphene (bottom), respectively. SALD: solution-assisted lipid deposition. (B) Mass signal detected by reflectance interference (RIF) for lipid coating (I), Ni2+ conditioning (II), His-tagged NB immobilization (III), and tagless mEGFP binding (IV). and mark the mass signals of tagless mEGFP immobilized on silica (blue) and graphene (red), respectively. Normalized fluorescence intensities according to Equation (1) are shown in (C). (D) Mass signal of lipid coating (i), Ni2+ conditioning (ii), and His-tagged mEGFP immobilization (iii). and mark the mass signals of H6-mEGFP immobilized on silica (blue) and graphene (red), respectively. Normalized fluorescence intensities according to Equation (1) are shown in (E).
Figure 2 with 5 supplements
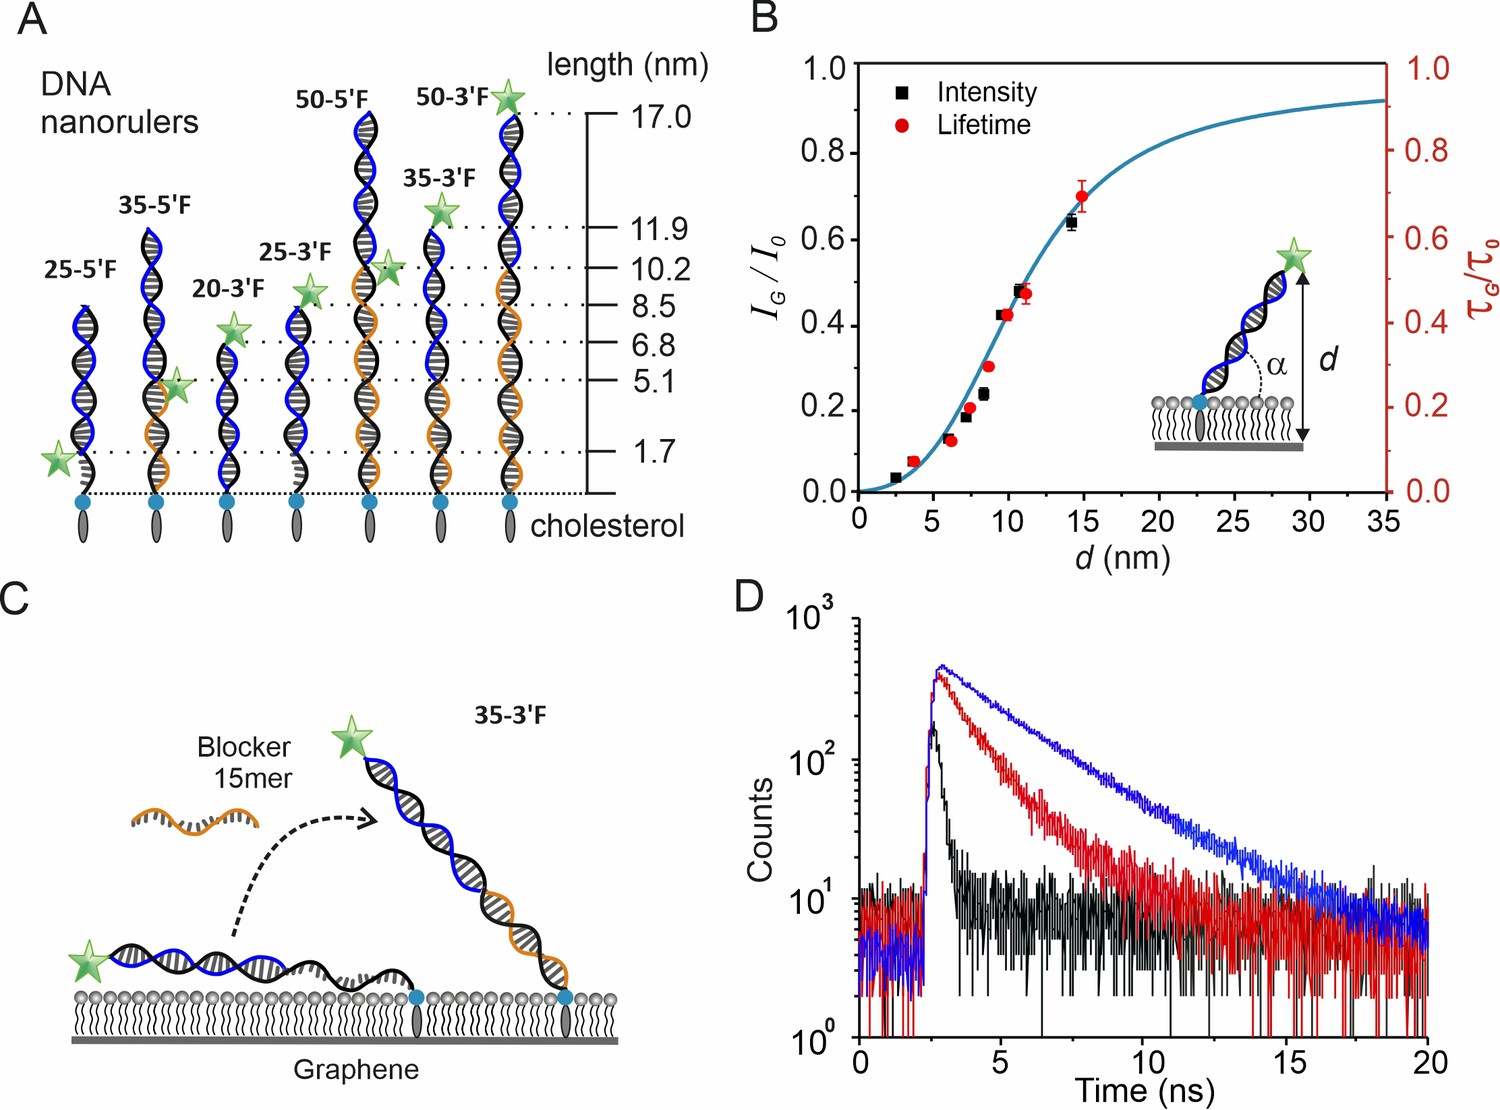
Calibration of distance-dependent GIET using DNA nanorulers.
(A) Architecture and theoretical distances of membrane-anchored DNA nanorulers. Anchor strands (black) are modified with a 3´-end cholesterol. Probe strands (blue) are conjugated with fluorescein at either 3´- or 5´- end. Blocker strand (orange) for complementing the unpaired regions. Nomenclature is based on combinations of anchor and probe strands. (B) Calibration obtained from intensity ratios (black squares, black axis) and from lifetime ratios (red dots, red axis) as a function of distance from the fluorophore to graphene. Calibration at 2.5 nm by lifetime is not available due to detection limitation. The inset illustrates the model used for calculating the vertical distance d with a globally fitted tilting angle α = (43 ± 1)°. Values are mean ±s.d. from three independent measurements. The simulated distance-dependent relation for FAM dye is shown in cyan. (C) Schematic illustration of the 35mer ssDNA anchor strand’s conformational changes on graphene. (D) Fluorescence lifetime histogram of the probe strand bound to the 35mer anchor DNA strand in the absence (black) and presence (red) of the 15mer blocker strand. For comparison, the experiment on a glass-supported lipid bilayer is shown (blue).
Figure 2—figure supplement 1

Surface sensitive TIRFS-RIF detection for GIET calibration.
Left row: Schemes of rulers used for calibrating distance-dependent GIET efficiency. For OG488-DHPE, gray bars mark injection of the lipids. For DNA rulers, the ‘anchor strands’ modified with a 3´-end cholesterol (black) were hybridized with a ‘probe strand’ (blue) conjugated with fluorescein at 3´end (3´F) or 5´end (5´F), respectively. Blocker strands (orange) were used for complementing the unpaired region. Middle row: Mass signal of the RIF channel. Gray bars mark lipid coating (i), docking of anchor strands (ii), and binding of probe strands (iii), respectively. Right row: Fluorescence intensities detected simultaneously. and are raw intensities detected on silica (blue) and graphene (red), respectively. They were used for calculating the normalized fluorescence intensity ratio IG/I0 according to Equation (1).
Figure 2—figure supplement 2
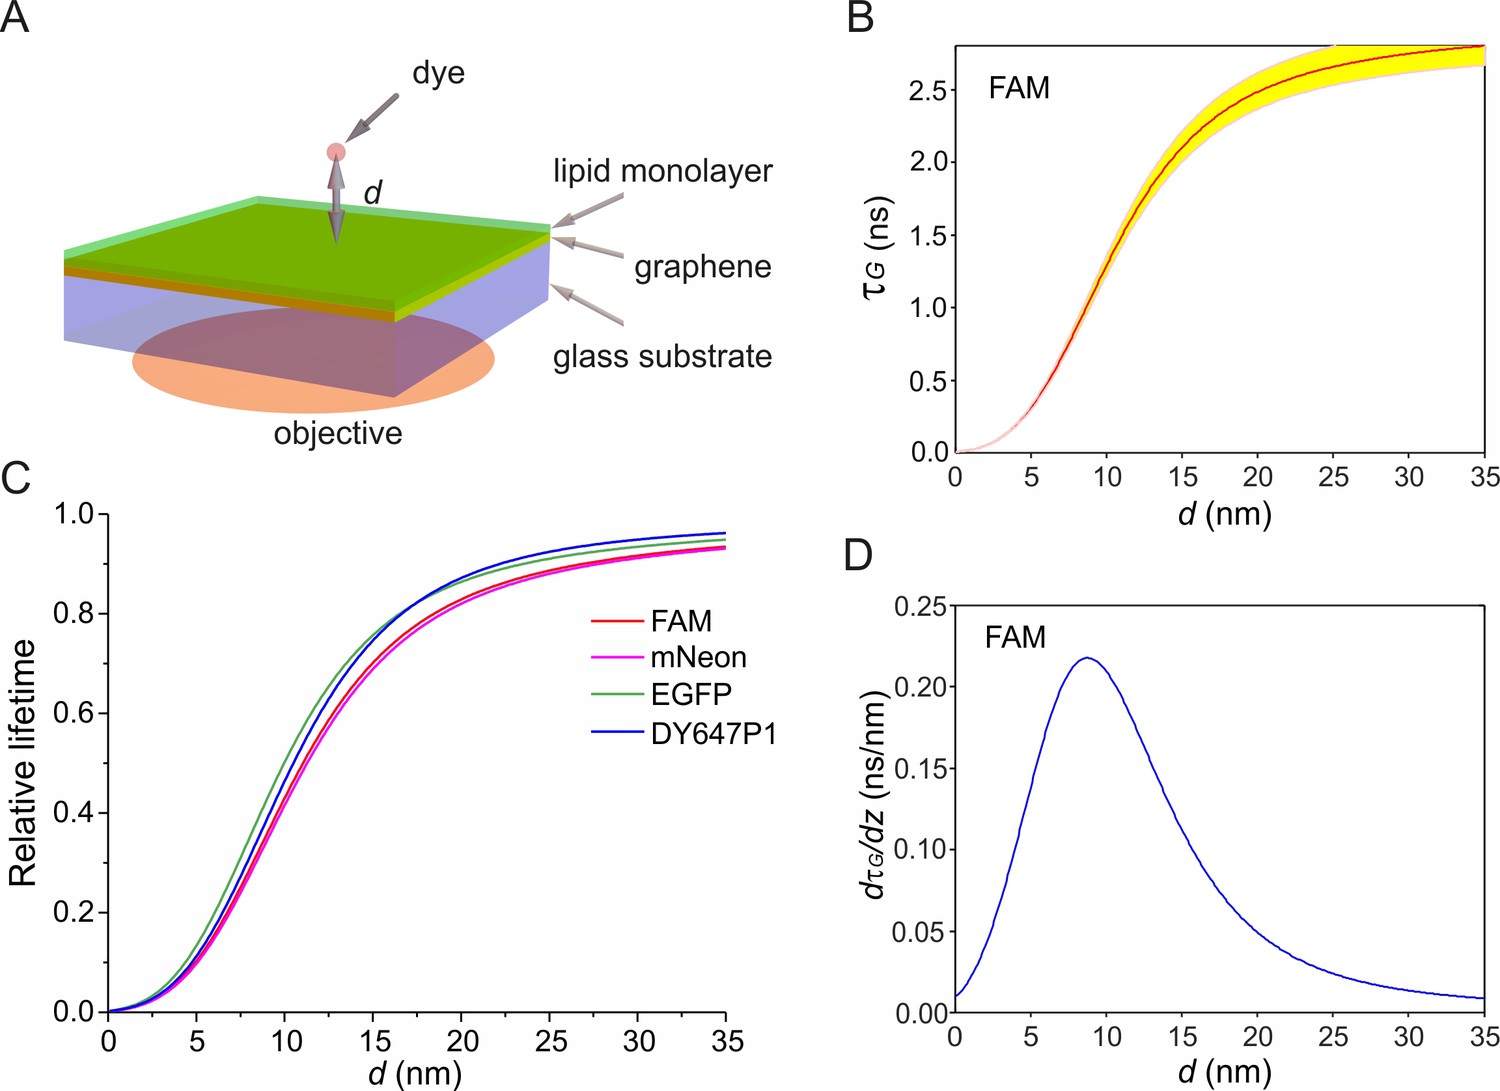
Simulation of electrodynamic coupling of an excited fluorophore to graphene.
(A) Scheme of the geometry used in the simulations. Random orientation of dyes was assumed. (B) Calculated fluorescence lifetime (τG) of FAM as function of the vertical distance d on graphene. Yellow region marks the variations of d within ±0.05·τG. (C) Dependence of relative fluorescence lifetime (τG/τ0) on d for different fluorophores. (D) Derivative of FAM’s lifetime on graphene as a function of d.
Figure 2—figure supplement 3
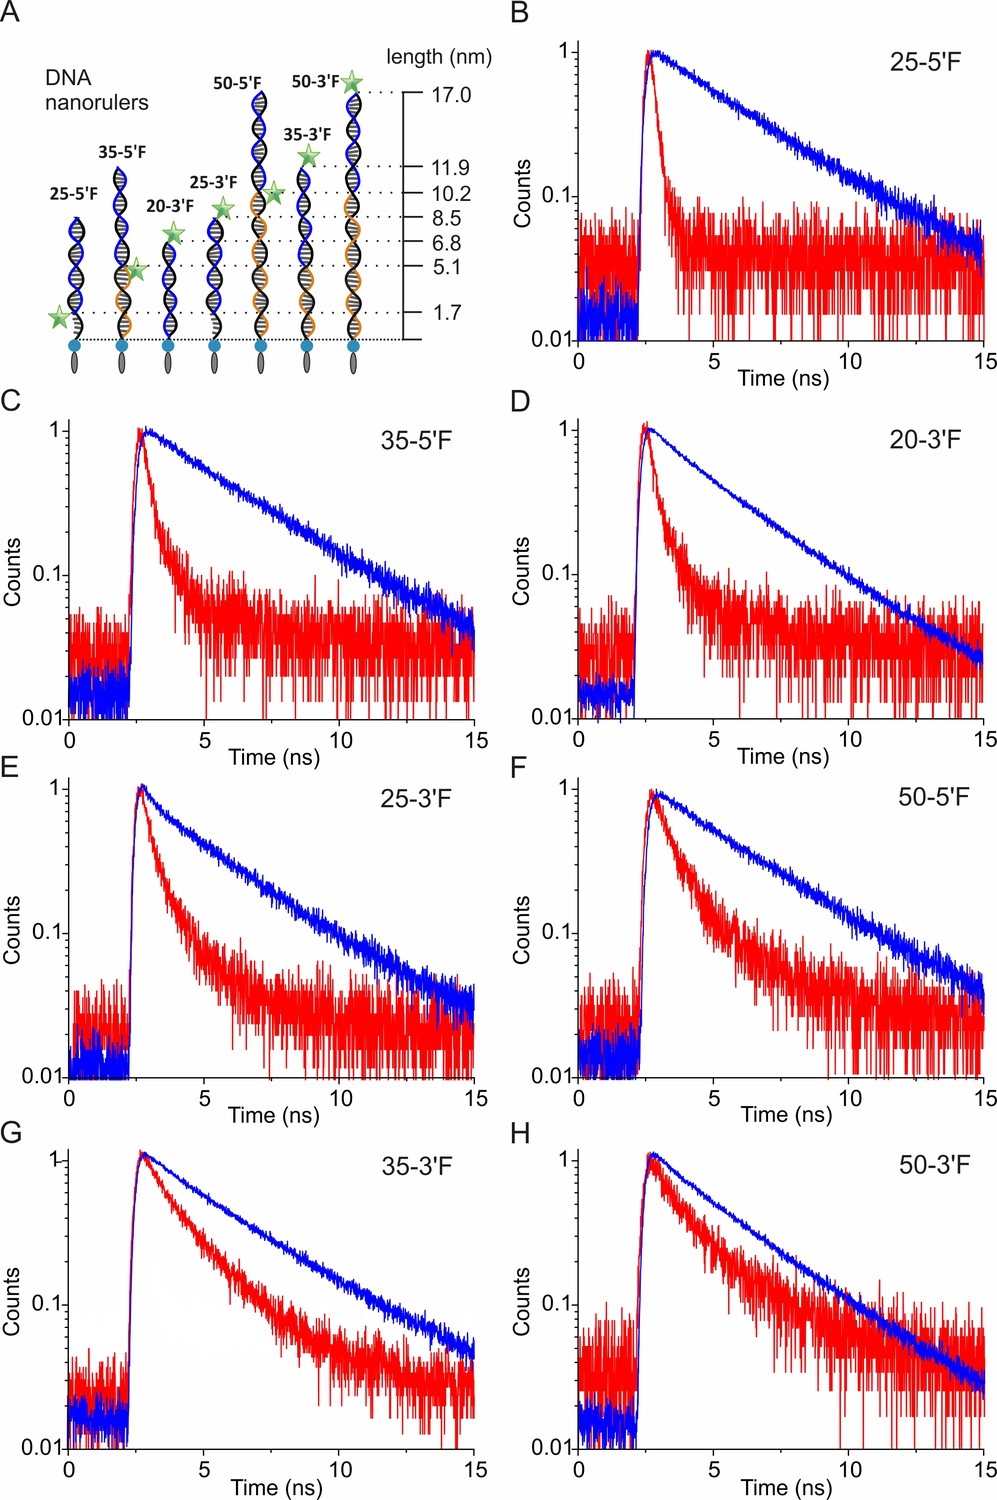
Time-correlated single photon counting (TCSPC) for determining the fluorescence lifetime of DNA nanorulers.
(A) Schemes of DNA rulers used for calibrating distance-dependent GIET efficiency. The ‘anchor strands’ (black) were hybridized with the ‘probe strand’ (blue). Blocker strands (orange) were used for complementing the unpaired region. (B–H) Normalized counts of TCSPC for DNA rulers on glass (blue) or graphene (red), respectively. DNA rulers were denoted as ‘anchor strand −3´F or 5´F’.
Figure 2—figure supplement 4
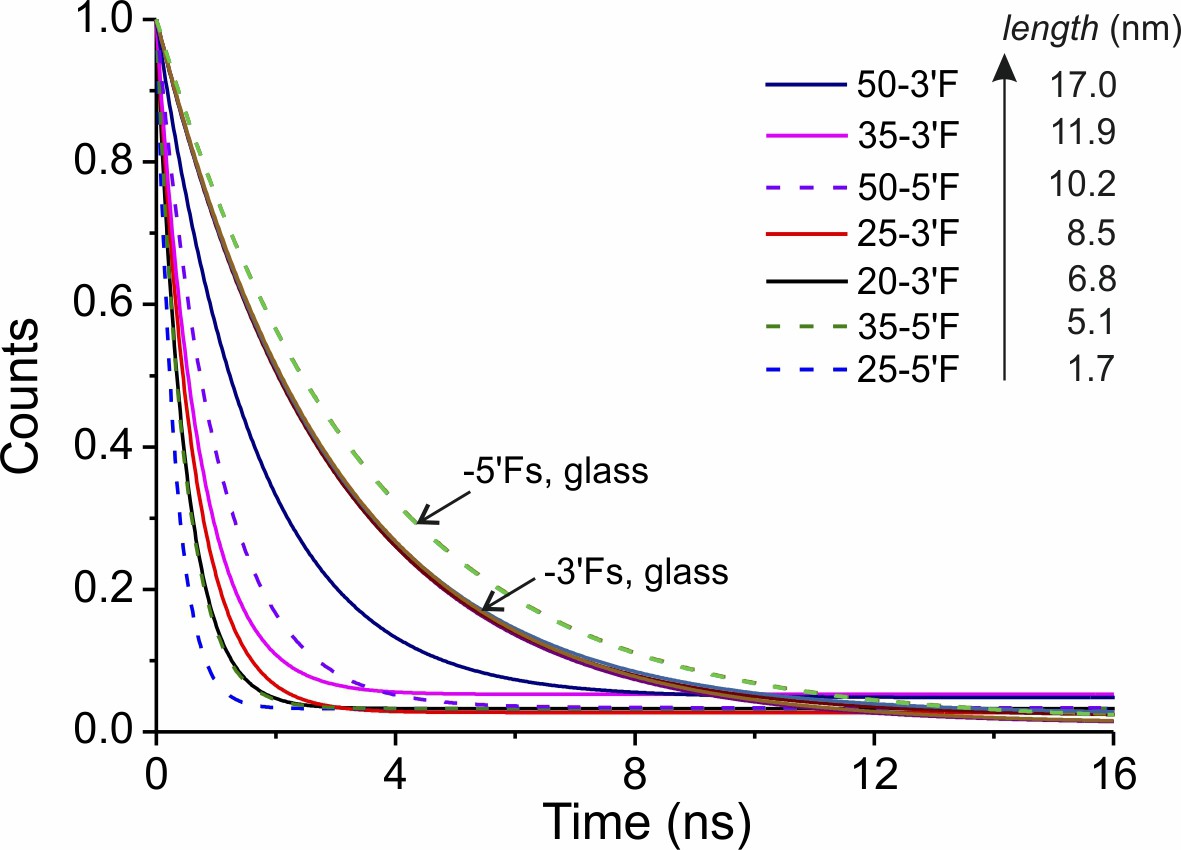
Mono-exponential fitting of the TCSPC data of DNA rulers.
DNA rulers labeled by the probe strand with 5´-end or 3´-end modification are shown in dashed and solid lines, respectively.
Figure 2—figure supplement 5
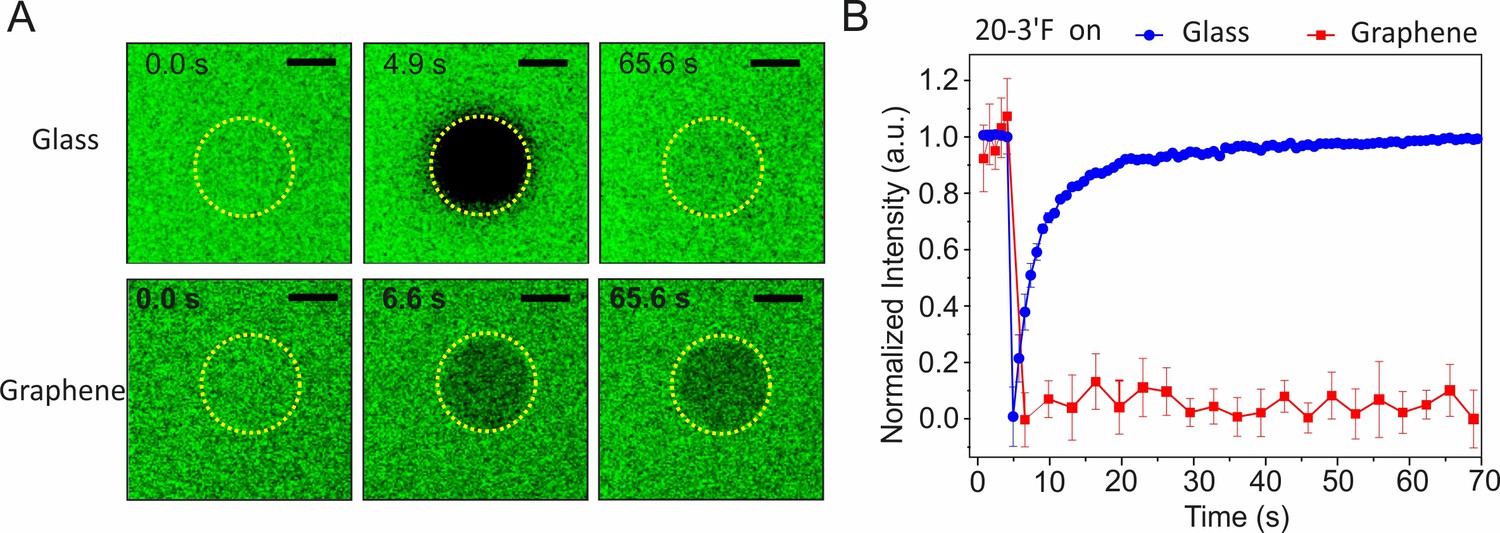
Characterization of membrane mobilities on glass and graphene by fluorescence recovery after photobleaching (FRAP).
(A) Time-lapse fluorescence images of ‘20–3´F’ on the lipid bilayer on glass (upper row) or lipid monolayer on graphene (lower row), respectively, before and after photobleaching at different times. Scale bars: 10 µm. (B) Time-lapse FRAP curves on glass or graphene substrates, respectively. Data are mean ±s.d. of intensities from three sub-regions inside the ROI.
Figure 3 with 5 supplements
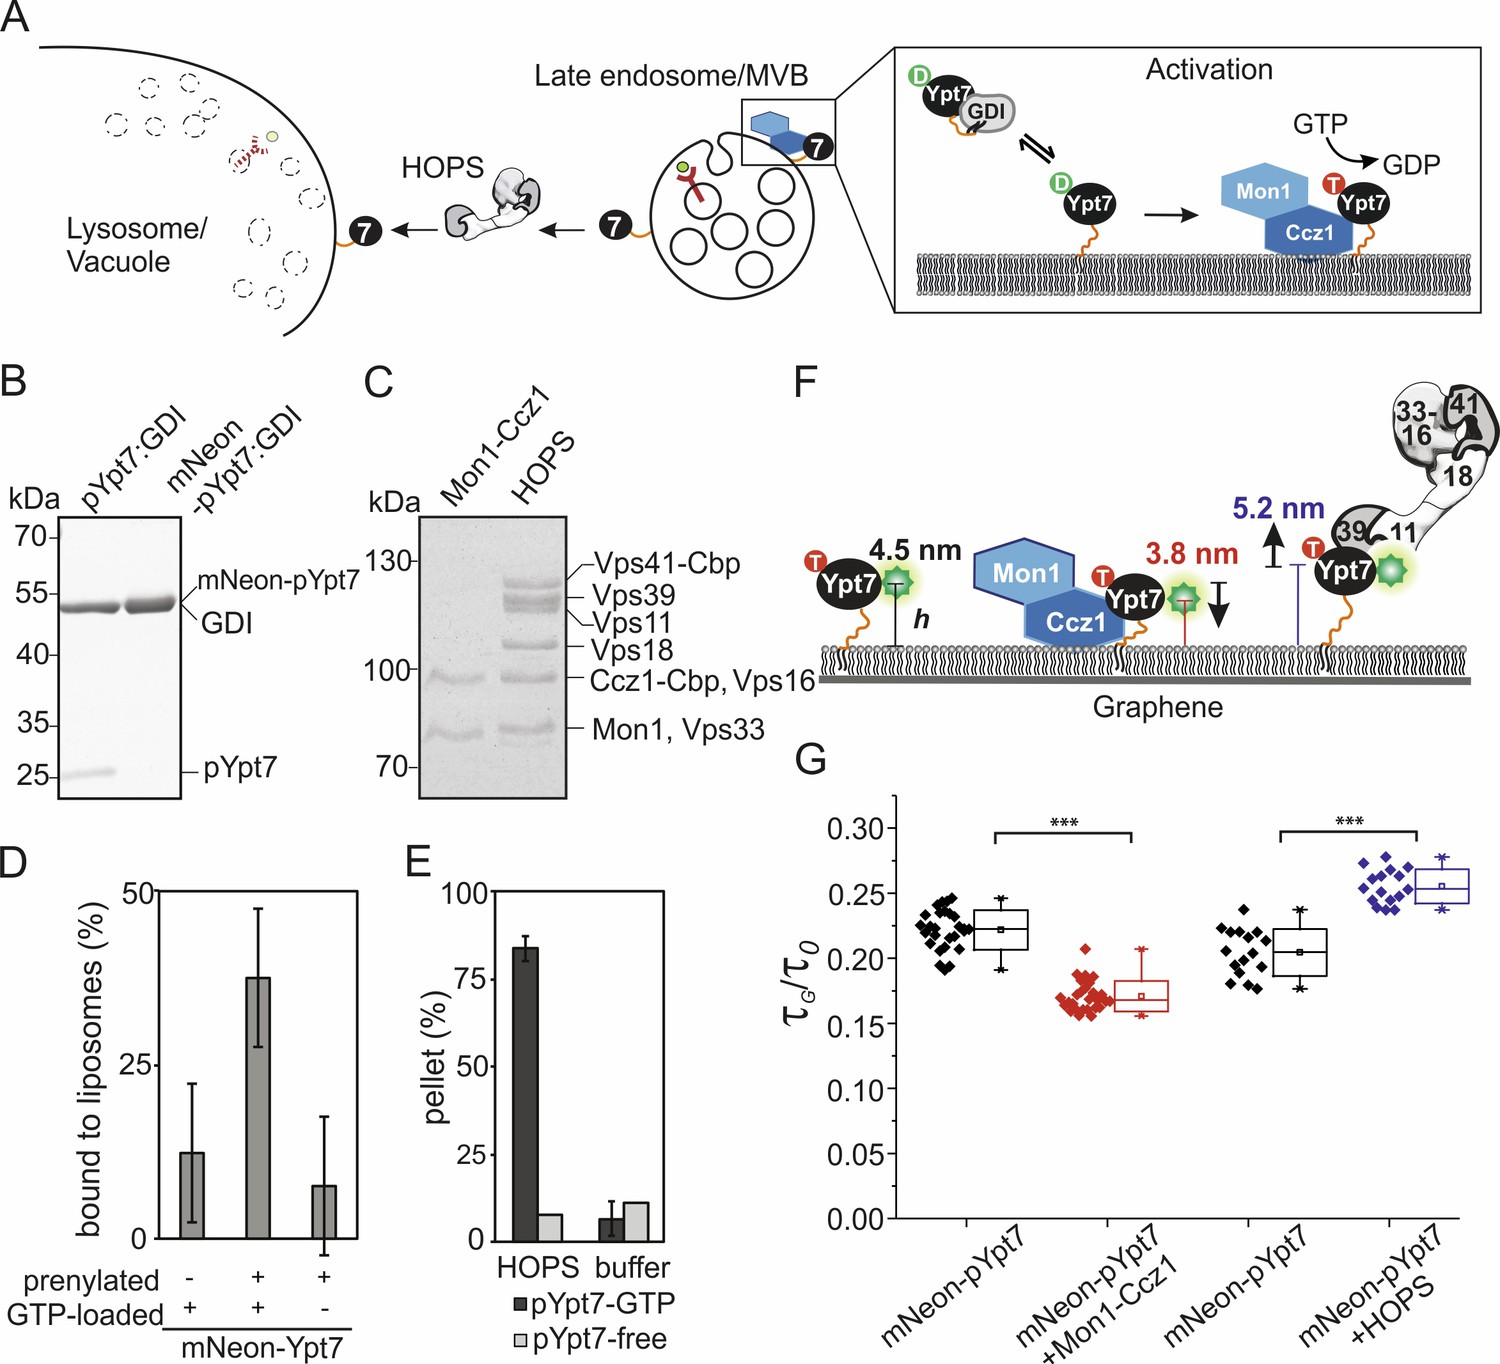
Conformational dynamics of membrane-associated mNeon-Ypt7 upon interaction with Mon1-Ccz1 and HOPS.
(A) Schematic overview of delivery, activation, and function of Ypt7. GDI delivers prenylated GDP-bound Ypt7 to membranes of the late endosome/multivesicular body (MVB). Once Ypt7 is activated by its specific GEF Mon1-Ccz1 through GDP to GTP exchange, it stably associates with membranes. Activated Ypt7 recruits effector proteins, for example the HOPS tethering complex at the vacuolar membrane. (B) In vitro prenylation of Ypt7 (pYpt7) and mNeon-fused Ypt7 (mNeon-pYpt7) analyzed by SDS-PAGE and Coomassie staining (5 µg). (C) Tandem affinity purification of Mon1-Ccz1 and HOPS analyzed by SDS-PAGE and Coomassie staining (5 µg). (D) Membrane association of prenylated mNeon-Ypt7 with (middle bar) and without (left bar) GTP-loading. Fraction of membrane-bound mNeon-pYpt7 based on the fluorescent signal in the supernatant before and after sedimentation (n = 3). As a negative control, liposomes were incubated with unprenylated mNeon-Ypt7 in the presence of GTP (left bar). (E) Interaction of HOPS (350 nM) with pYpt7-GTP-loaded liposomes (dark gray bars) or pYpt7-free liposomes (light gray bars), respectively. The fraction of clustered liposomes in the pellet was calculated on the basis of fluorescent signal in the supernatant before and after sedimentation (n = 3). (F) Putative architecture of membrane-associated mNeon-pYpt7-GTP, and its complexes with Mon1-Ccz1 and HOPS, respectively. The flexible HVD domain is highlighted by an orange strand. (G) Box chart of fluorescence lifetime ratios of mNeon-pYpt7-GTP (black) on graphene-coated glass coverslip to glass (τG/τ0), and its complexes with Mon1-Ccz1 (red) and HOPS (blue), respectively. Significance: ***p<0.001 (two t-test, n > 17).
Figure 3—figure supplement 1
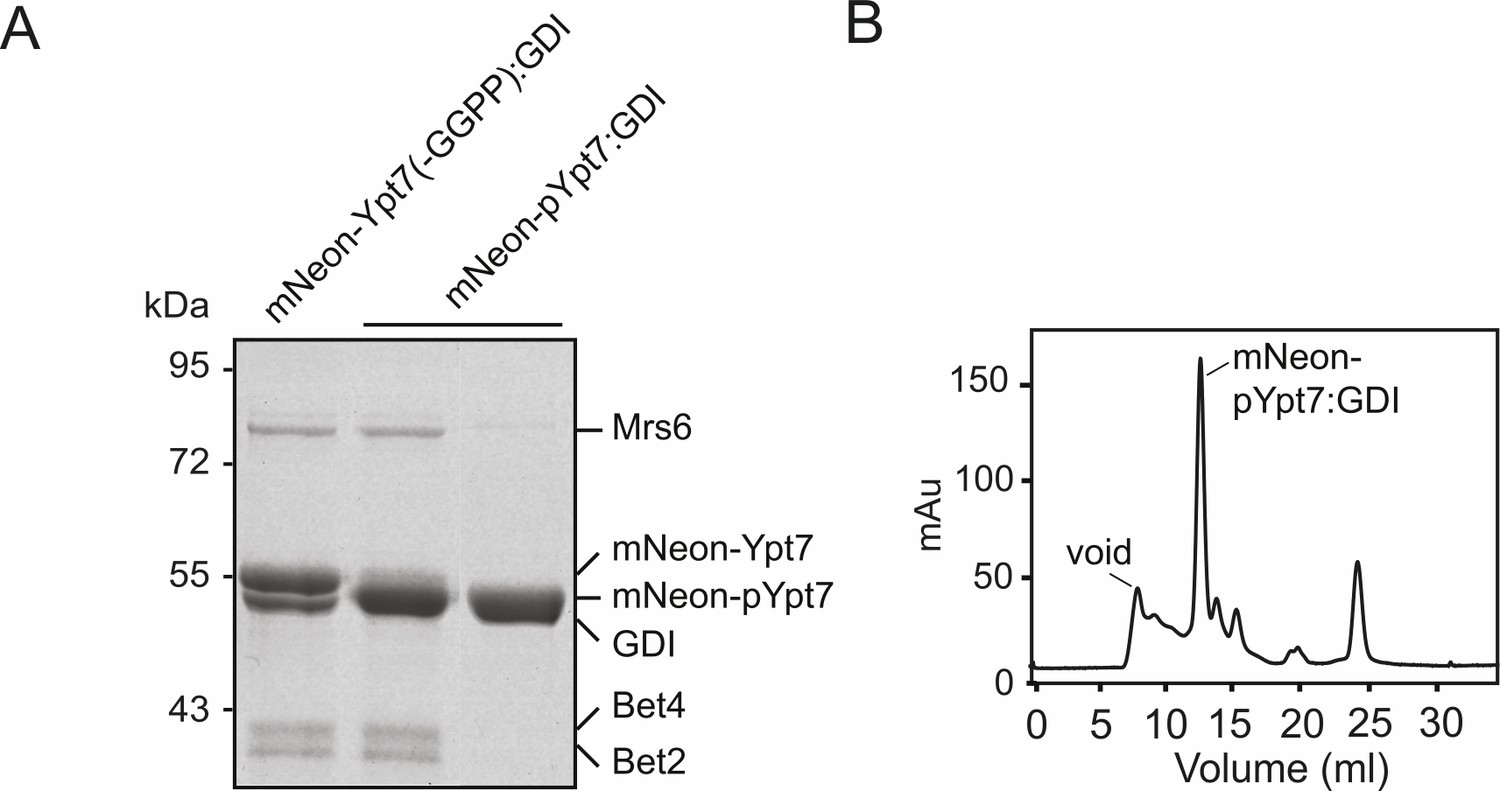
Generation of mNeon-pYpt7-GDI complex.
(A) SDS-PAGE and Coomassie staining of the mNeon-pYpt7-GDI complex. 10 µM mNeon-Ypt7 was incubated with 9 µM Gdi1, 1 µM REP (Mrs6), 1 µM geranylgeranyltransferase (Bet2-Bet4) and geranylgeranyl pyrophosphate (GGPP) at 37°C for 1 hr. An unprenylated sample (left) and prenylated samples before (middle) and after size exclusion chromatography (right) were loaded on the SDS-PAGE gel. (B) Size exclusion chromatogram of the reaction mixture in (A).
Figure 3—figure supplement 2
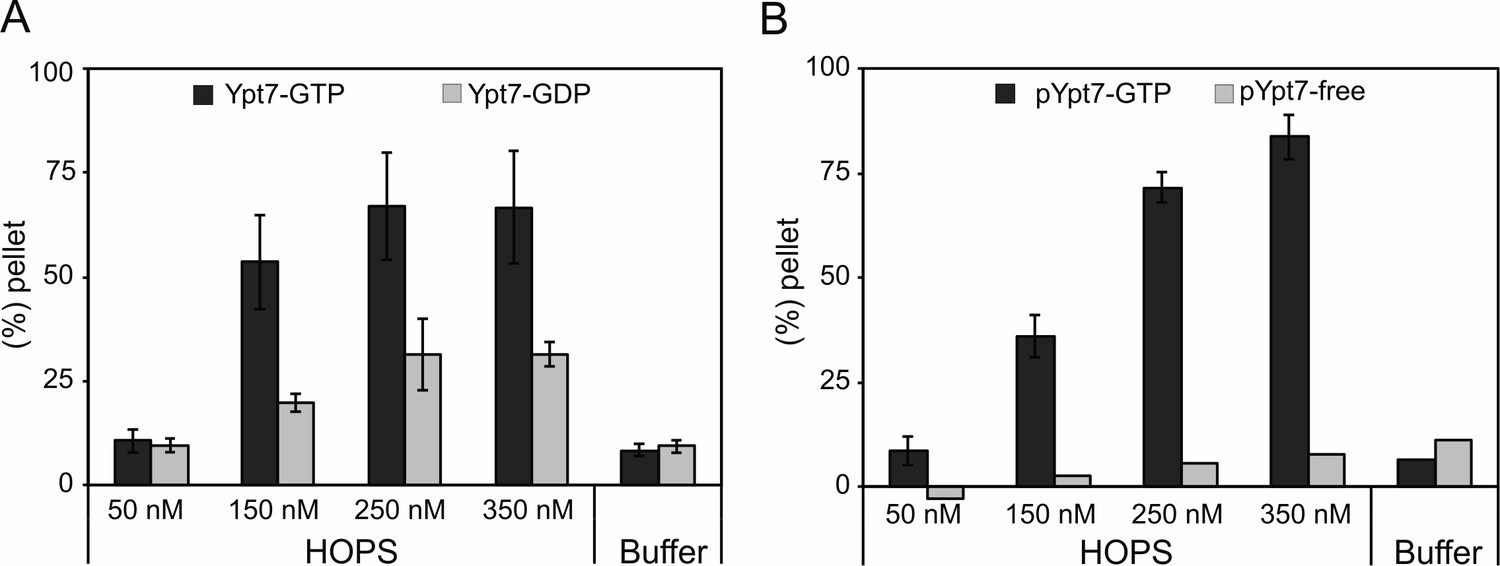
HOPS-mediated concentration-dependent tethering of liposomes loaded with His-fused Ypt7-GTP or prenylated Ypt7-GTP.
(A) Pellet fraction of liposomes loaded with His-fused Ypt7-GDP (light gray bars) or Ypt7-GTP (dark gray bars). 170 µM liposomes were incubated with increasing amounts of HOPS complex or HOPS purification buffer for 10 min at 27°C. Liposomal clusters were sedimented at 1000 g for 5 min, and the pellet fraction was determined by the fluorescent signal of liposomes in the supernatant before and after sedimentation. (B) Pellet fraction of liposomes incubated with (dark gray bars) or without (light gray bars) pYpt7-GDI in the presence of GTP for 30 min at 27°C. HOPS-mediated tethering was analyzed as described in (A). Error bars indicate three independent experiments (n = 3).
Figure 3—figure supplement 3
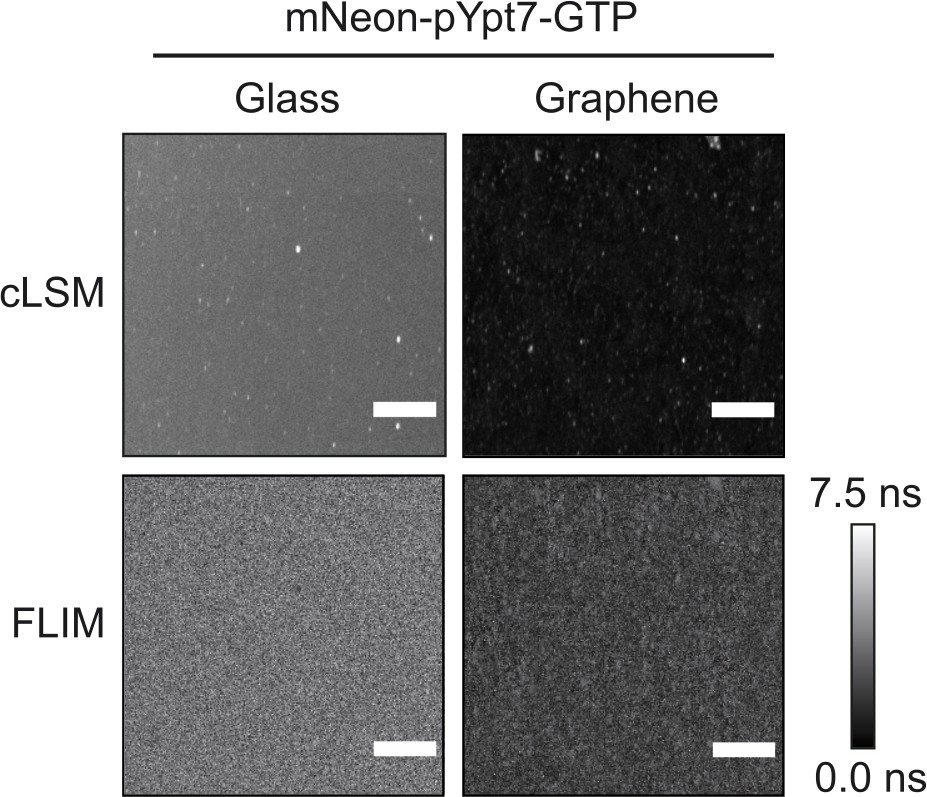
Homogenous distribution of prenylated mNeon-Ypt7 in lipid mono- and bilayers.
200 nM mNeon-pYpt7 complexed with GDI was incubated with glass-supported lipid bilayers and graphene-supported lipid monolayers in the presence of GTP at 30°C for 30 min. After extensive washing, mNeon-pYpt7 was imaged by cLSM under the same conditions (top). Fluorescence lifetime images were acquired for 90 s (FLIM, bottom). Scale bars: 50 µm.
Figure 3—figure supplement 4
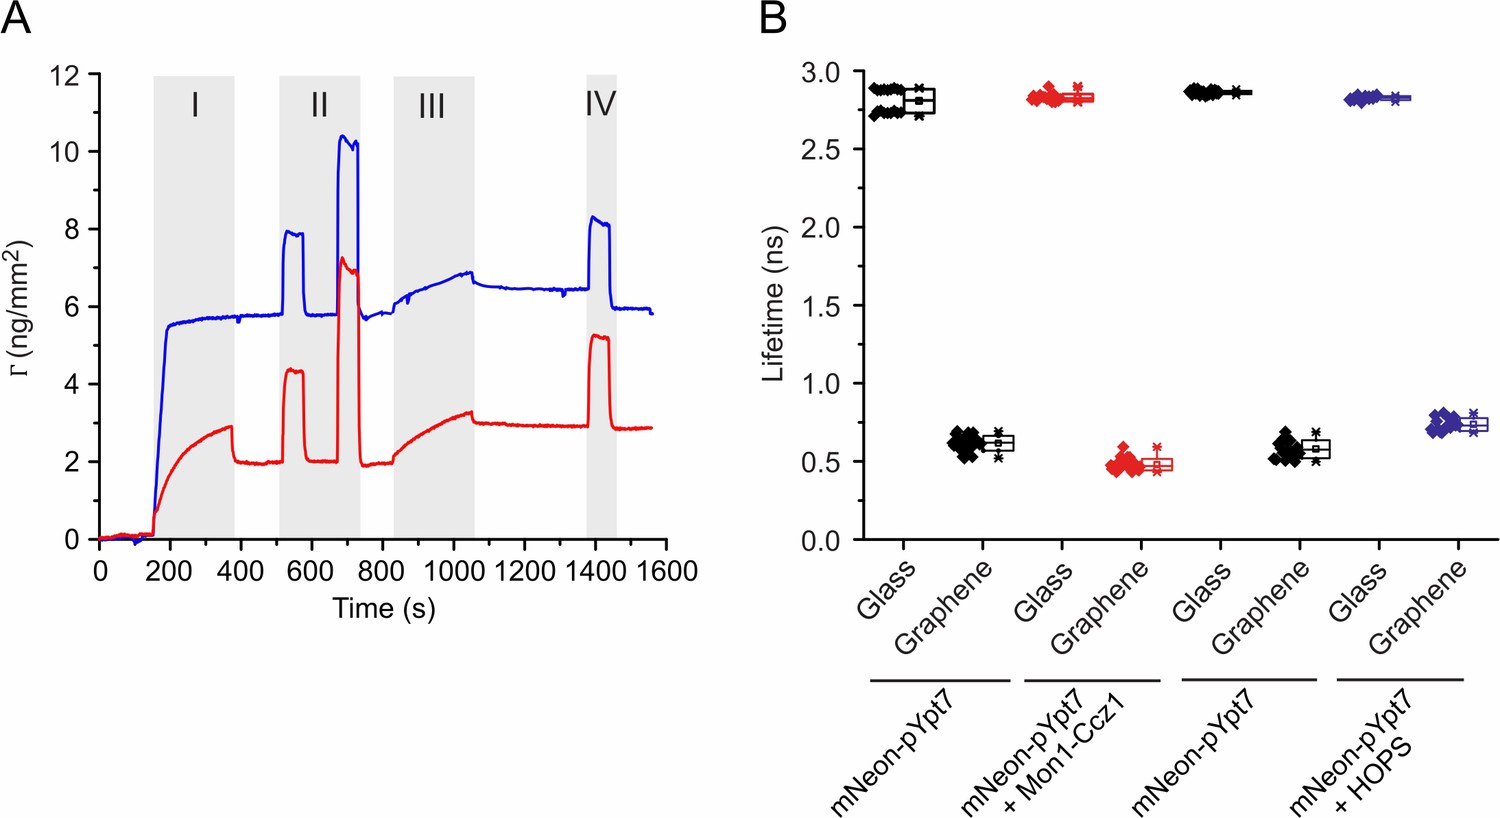
Characterization of Mon1-Ccz1 binding to membranes and fluorescence lifetime changes of mNeon-pYpt7.
(A) Surface sensitive TIRFS-RIF detection of Mon1-Ccz1 binding to lipid mono- and bilayers. Mass signal for lipid coating (I), conditioning of the membrane (II), binding of Mon1-Ccz1 (III) and washing with imidazole (IV). Blue: silica. Red: graphene. (B) Fluorescence lifetimes of mNeon-pYpt7-GTP, and its complex with Mon1-Ccz1 or HOPS on glass and graphene, respectively. 200 nM mNeon-pYpt7 complexed with GDI was incubated with the supported lipid monolayer/bilayer in the presence of GTP for 30 min at 30°C. Where indicated, 100 nM Mon1-Ccz1 or HOPS complex was added followed by incubation for 5 min. Fluorescence lifetimes of mNeon-pYpt7 on glass and graphene were determined by FLIM. The mean values of fluorescence lifetimes were used for calculating the ratios.
Figure 3—figure supplement 5

FRAP experiments of membrane-anchored mNeon-pYpt7 upon interaction with effectors.
(A) Time-lapse cLSM images of mNeon-pYpt7-GTP alone and in the presence of Mon1-Ccz1 or HOPS complex on glass-supported lipid bilayers or graphene-supported lipid monolayers (mNeon-pYpt7-GTP + HOPS). 200 nM mNeon-pYpt7-GTP, 100 nM Mon1-Ccz1, and 100 nM HOPS were used. Time stamp in s. Scale bars: 10 µm. (B) Time-dependent fluorescence recovery of mNeon-pYpt7-GTP and in interaction with effectors on glass-supported lipid bilayers. mNeon-pYpt7-GTP (black), mNeon-pYpt7-GTP with Mon1-Ccz1 (red) or HOPS complex (blue). mNeon-pYpt7-GTP with HOPS complex on graphene-supported lipid monolayer (magenta) did not show recovery after photobleaching. Error bars indicate s.d. of the average intensity from three experiments.
Figure 4 with 2 supplements
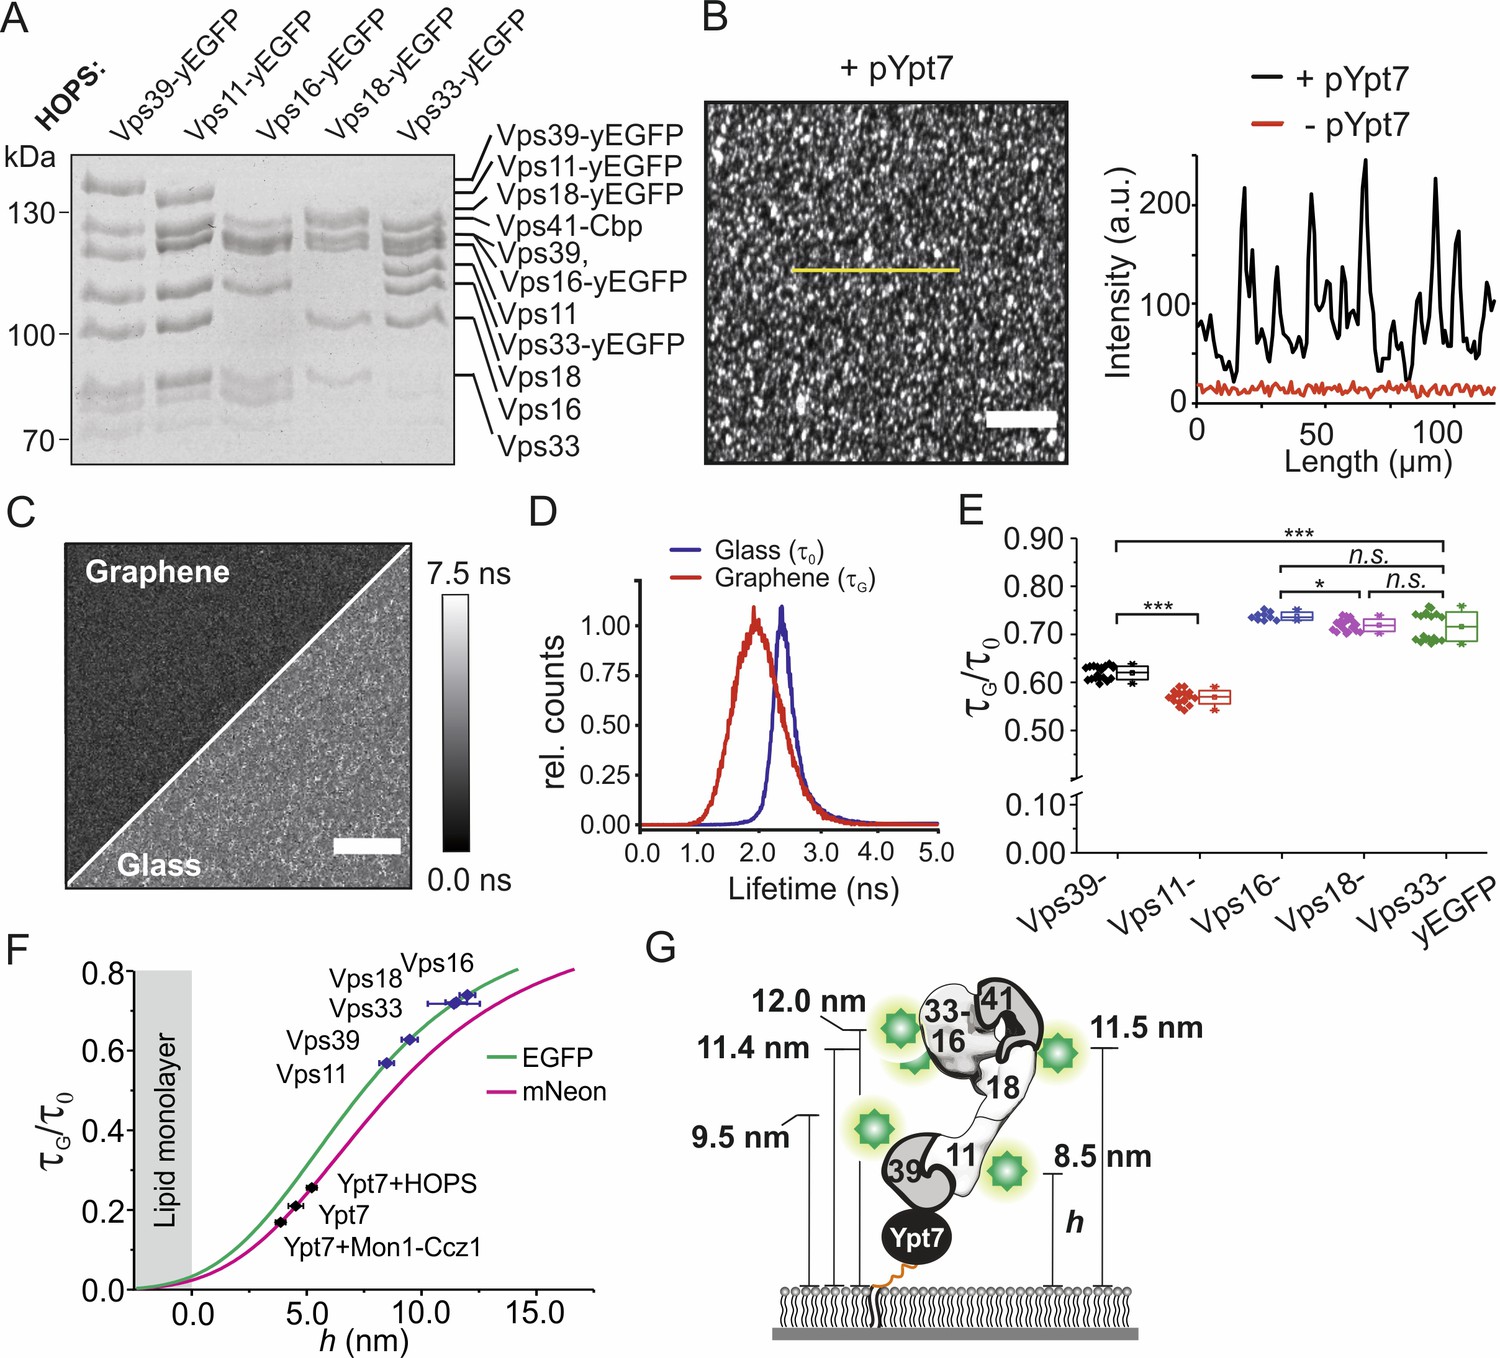
Axial architecture of pYpt7-bound HOPS on membranes explored by GIET.
(A) Integrity of HOPS complexes containing different yEGFP-fused subunits analyzed by SDS-PAGE and Coomassie staining. (B) Confocal laser-scanning microscopy image of HOPS Vps16-yEGFP bound to pYpt7-GTP-loaded membrane on glass. Scale bar: 50 µm. Fluorescence intensity profile along the yellow line in the image is shown aside (black). As a negative control, fluorescence intensity profile of HOPS (Vps16-yEGFP) in the absence of pYpt7-GTP is shown (red). (C) Fluorescence lifetime imaging of HOPS (Vps16-yEGFP) bound to pYpt7-GTP-loaded membranes on glass and graphene, respectively. Scale bar: 50 µm. (D) Normalized fluorescence lifetime histograms of FLIM images shown in panel C. (E) Fluorescence lifetime ratios of different yEGFP-fused subunits in HOPS complex. The HOPS complexes were bound to pYpt7-GTP-loaded membranes on glass and graphene, respectively. Significance: ***p<0.001 (two t-test, n > 9), *p<0.05 (two t-test, n > 9). (F) Axial distances of yEGFP-fused HOPS subunits above membrane determined according to the GIET-distance correlation for EGFP (green). The range of distance is shown by mean ±s.d of the lifetime ratio. Axial distances of Ypt7 and Ypt7 bound to complexes are shown for reference (magenta, correlation curve of mNeon). (G) Putative orientation of pYpt7-GTP bound HOPS complex on membranes.
Figure 4—figure supplement 1
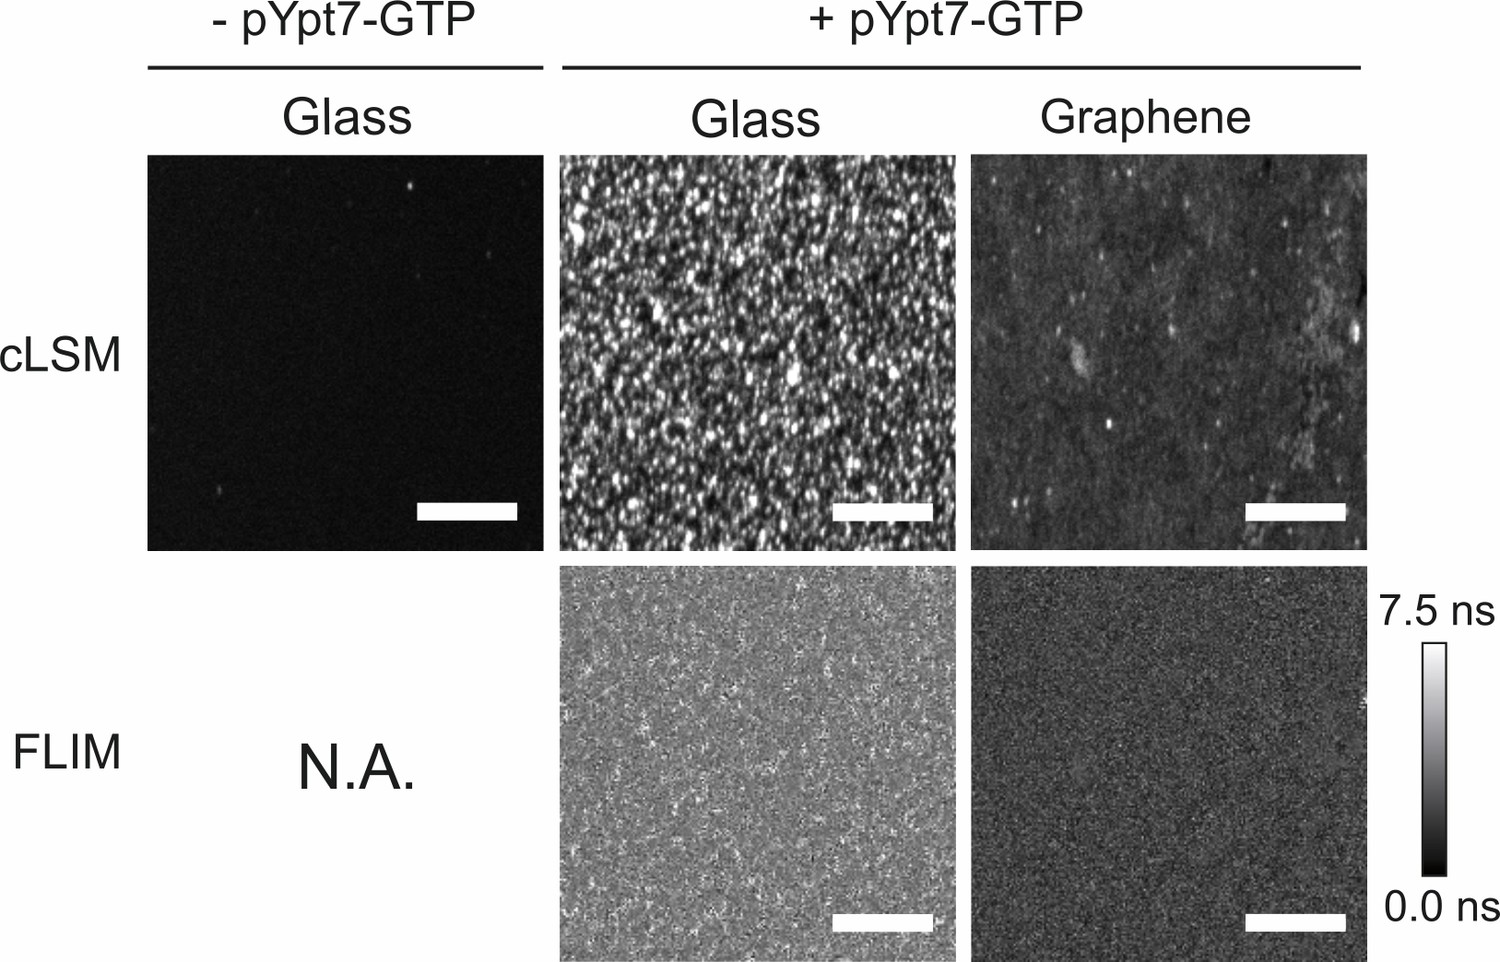
Fluorescence intensity imaging by cLSM and lifetime imaging by FLIM of the recruited HOPS complex.
50 nM HOPS Vps16-yEGFP complex was added to glass-supported lipid bilayers (middle row) and graphene-supported lipid monolayers (right row) loaded with 150 nM pYpt7-GTP, respectively. As a control, HOPS was incubated with the glass-supported lipid bilayer in the absence of pYpt7-GTP (left row). cLSM images were acquired under the same conditions. FLIM was not applicable to the negative control due to negligible binding of HOPS complex in this condition. Scale bars: 50 µm.
Figure 4—figure supplement 2
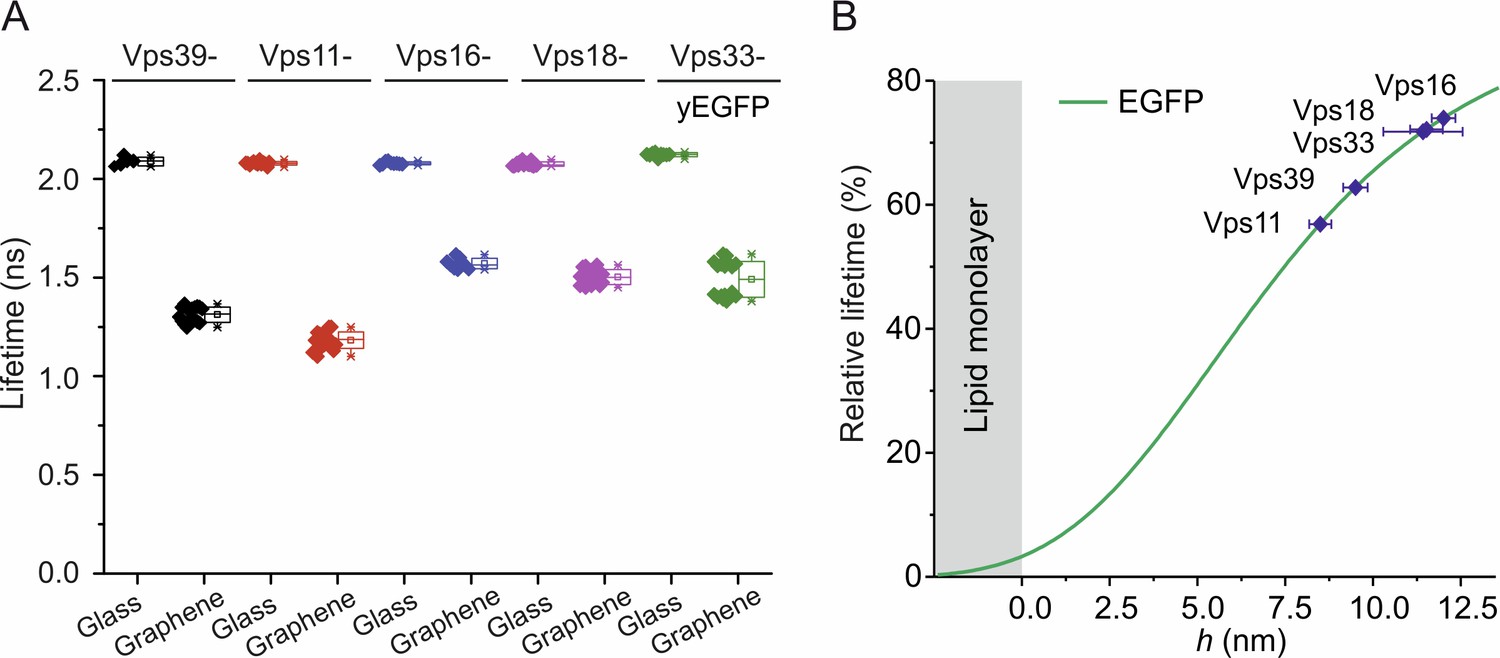
Fluorescence lifetimes of yEGFP-fused HOPS complex bound to membrane-anchored pYpt7-GTP on glass and graphene.
(A) 50 nM HOPS complex with Vps39, Vps11, Vps16, Vps18, or Vps33 C-terminally fused to yEGFP was added to solid-supported lipid layers preloaded with 150 nM mNeon-pYpt7-GTP, respectively. (B) Identification of the height of protein component in the complexes according to the calibration curve.
Figure 5 with 3 supplements
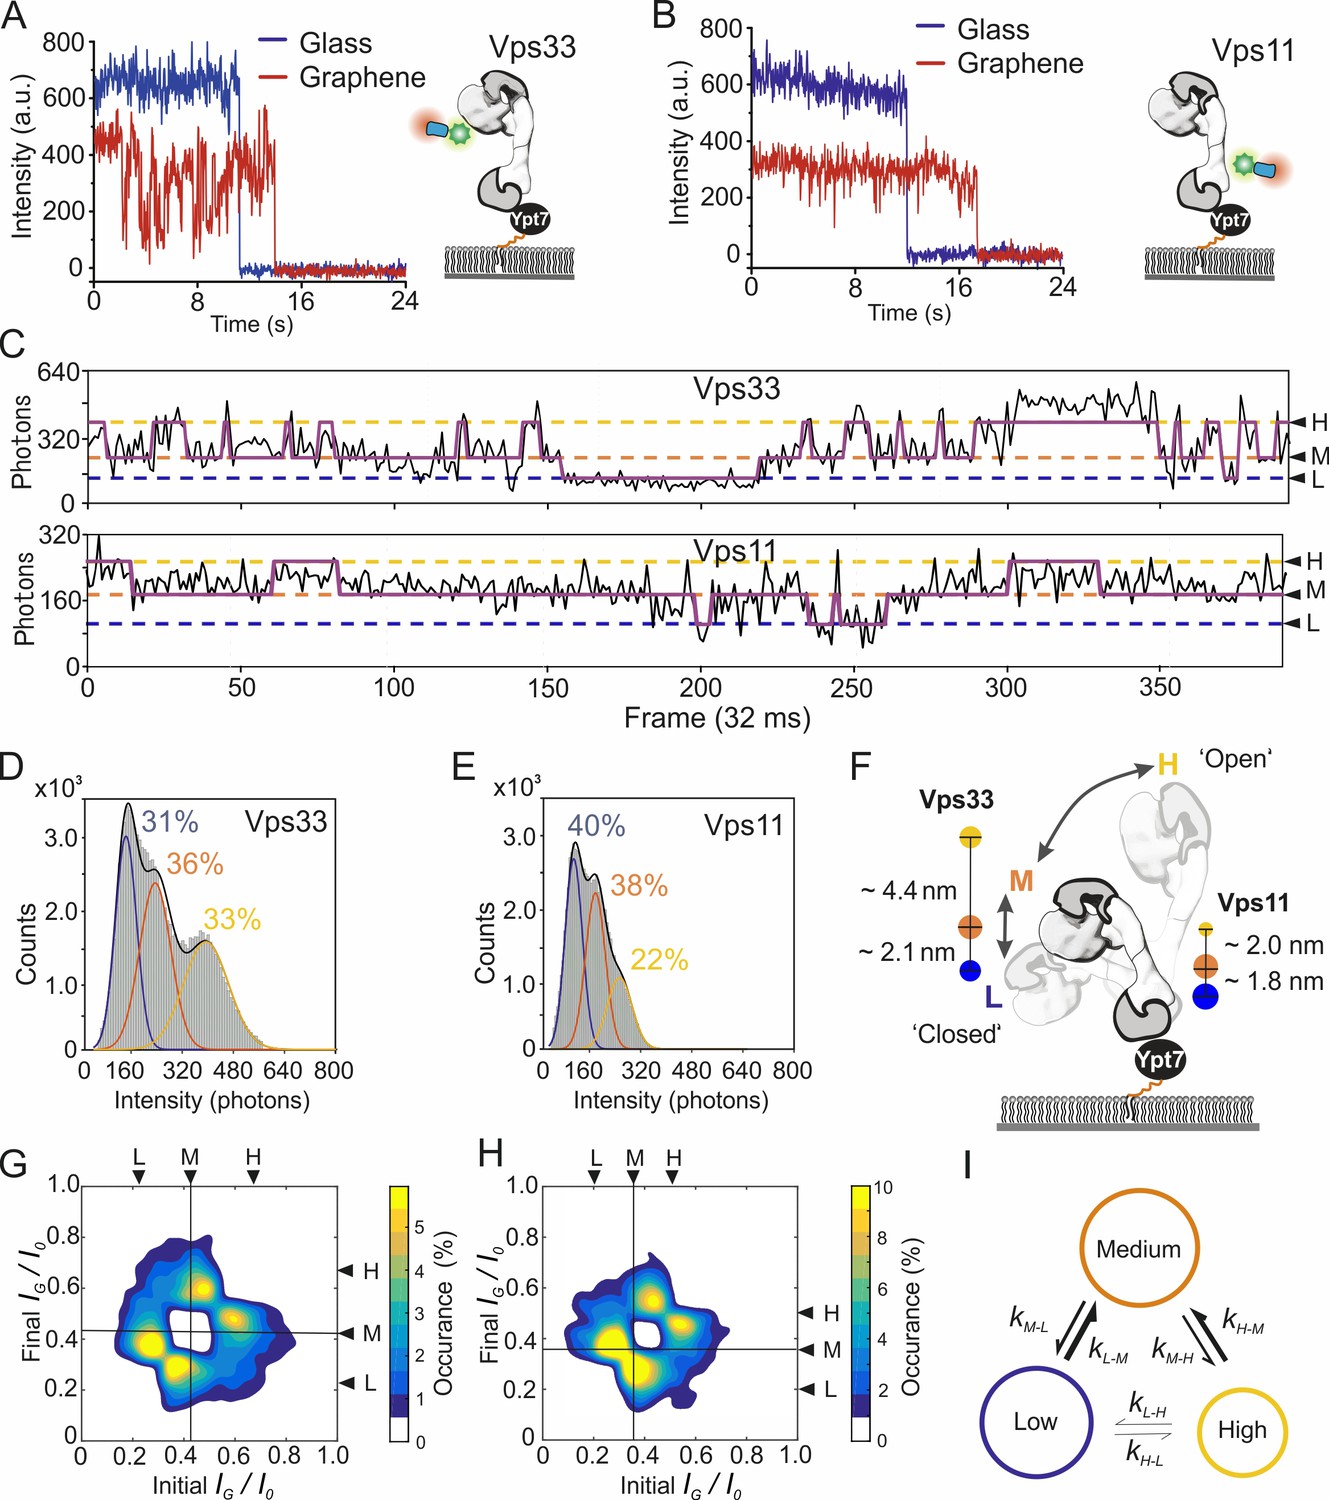
Dynamics of the pYpt7-bound HOPS complex on a lipid layer explored by single-molecule GIET.
(A, B) Representative time-lapse single-molecule intensity traces of Dy647NB-labeled HOPS Vps33-yEGFP (A) and HOPS Vps11-yEGFP (B) on glass (blue) and graphene (red). (C) Enlarged representation of the smGIET intensity fluctuations and fit by an HMM using a three-state segmentation. (D, E) Pooled single-molecule intensity distribution of Dy647NB-labeled HOPS Vps33-yEGFP (D, n = 101615) and HOPS Vps33-yEGFP (E, n = 84218) immobilized on graphene-supported monolayers via Ypt7-GTP. Intensities were classified by Gaussian fits as states of low (L, blue), medium (M, orange), and high (H, yellow), respectively. (F) Model schematically depicting possible conformational changes of HOPS in the L, M, and H state. State occupancies and distance changes of Vps11 and Vps33 are indicated. (G, H) Transition density plots of HOPS Vps33-yEGFP (G) and Vps11-yEGFP (H). The crosslines on M state are guide for the eye. (I) Conformational transition kinetics obtained from HMM. Diameters of the circles and sizes of the arrows are proportional to the averaged state occupancy and transition rates from results of HOPS Vps33 and Vps11, respectively.
Figure 5—figure supplement 1
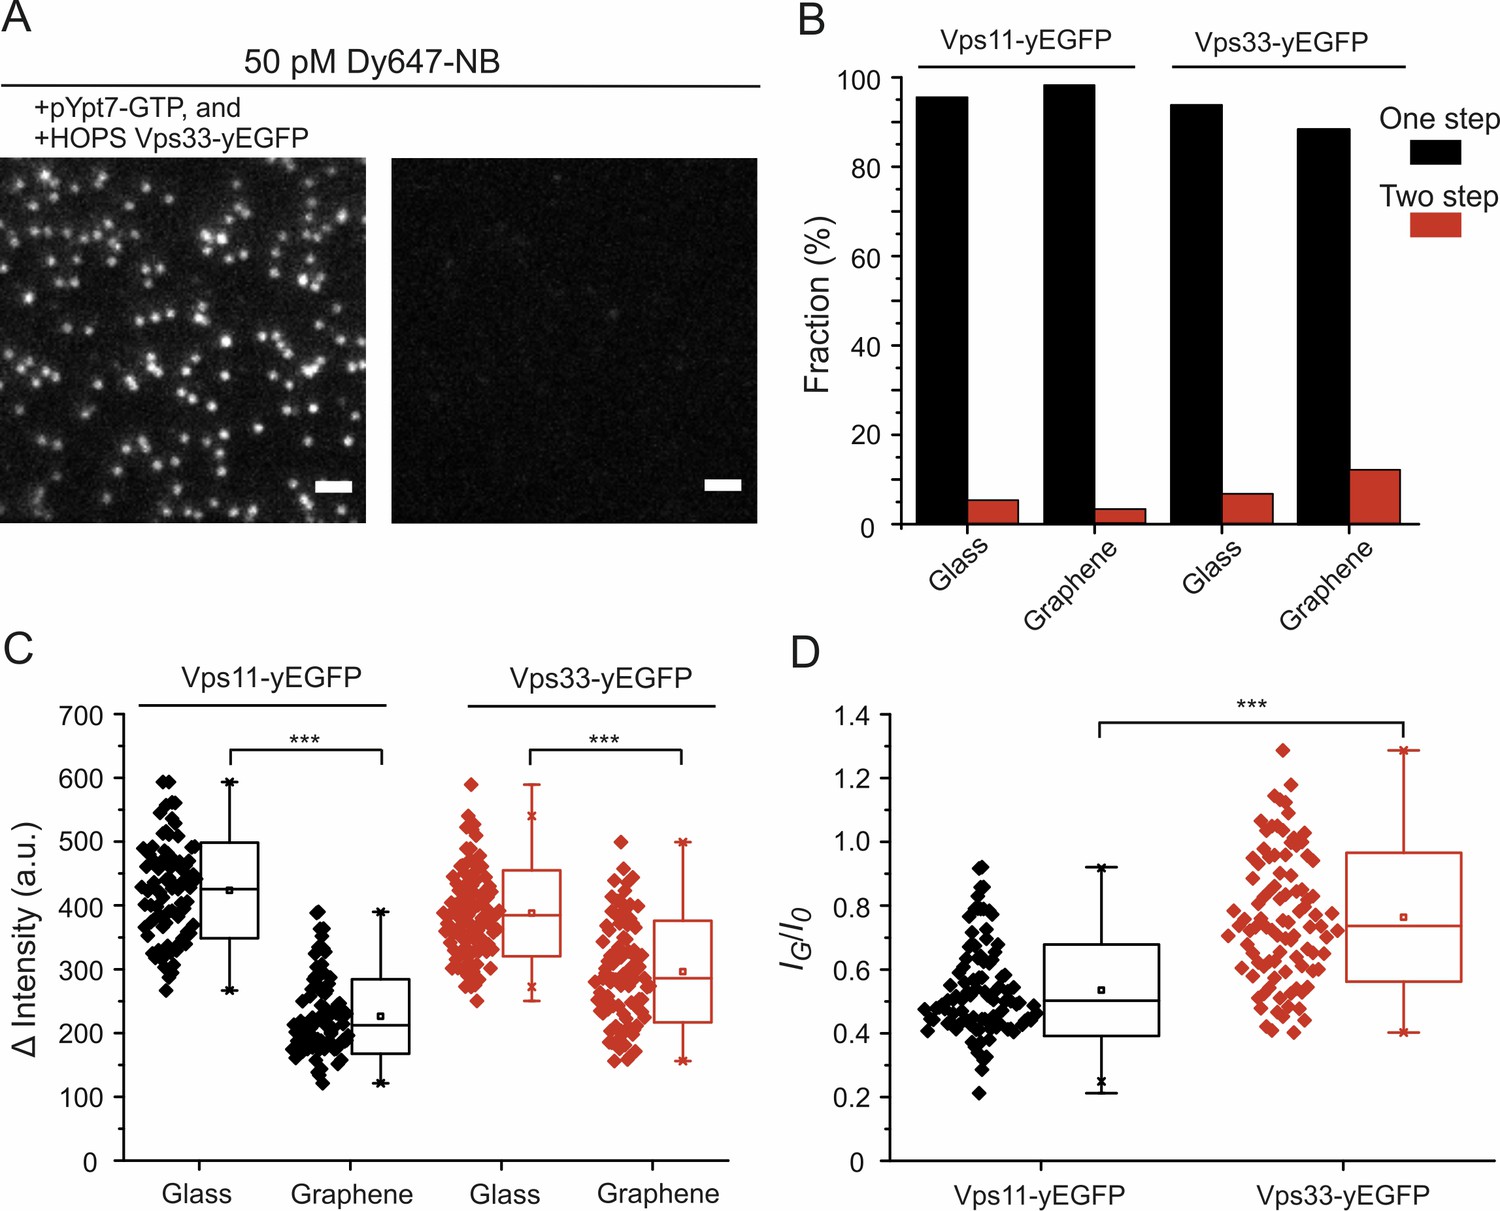
Single-molecule detection of NB-labeled HOPS complexes bound to lipid-anchored pYpt7-GTP.
(A) Single-molecule images of NB-labeled HOPS Vps33-yEGFP. White dots are individual HOPS complexes bound to the lipid bilayer on glass via prenylated Ypt7-GTP. In the absence of Ypt7 and HOPS, negligible single-molecule events were detected. Scale bars: 2 µm. (B) Percentage of photobleaching steps obtained by analyzing the intensity traces of ~100 individual molecules per sample conditions. (C) Intensity differences before and after photobleaching determined from single-molecule intensity traces. Each symbol represents the intensity of an individual molecule. In total, ~100 molecules were analyzed for each sample species. (D) Single-molecule intensity ratios of HOPS Vps11- and Vps33-yEGFP. Significance: ***p<0.001 (two t-test, n = 101).
Figure 5—figure supplement 2
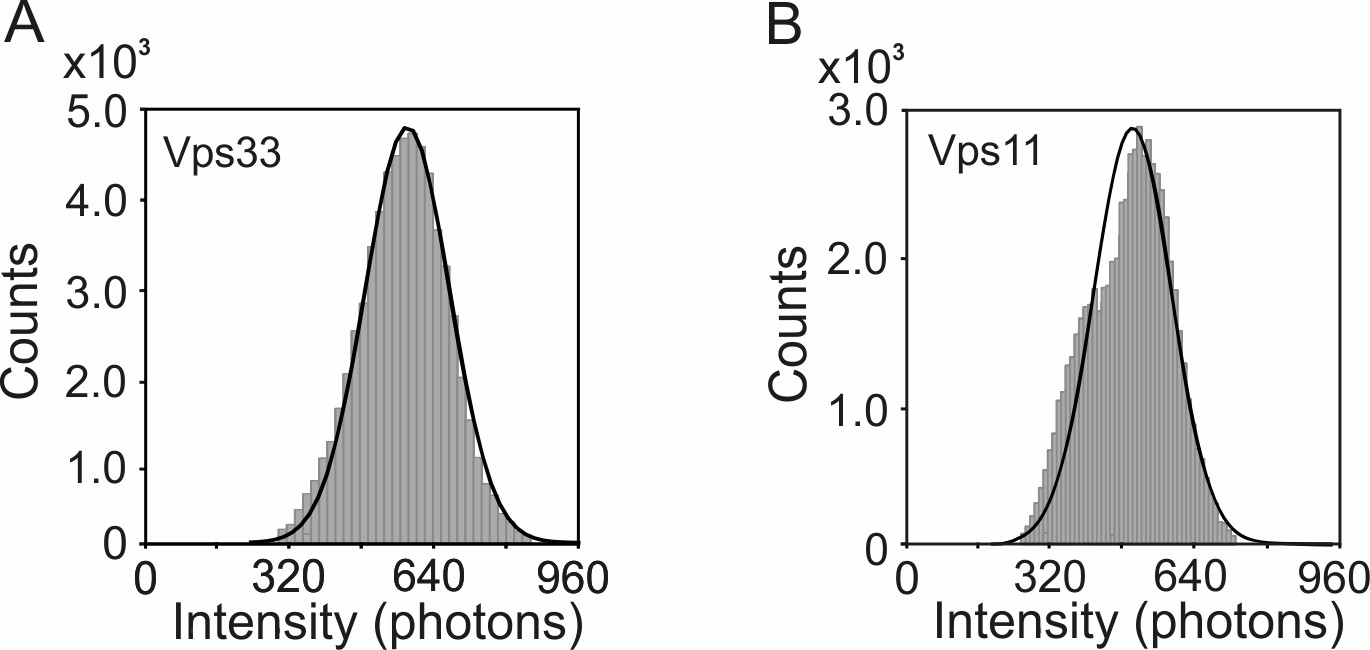
Pooled single-molecule intensity histograms for (A) HOPS Vps33-yEGFP (n = 60498) and (B) HOPS Vps11-yEGFP (n = 33317) on glass, respectively.
The means ± s.d. of histograms in A and B are 576 ± 96 photons, and 495 ± 90 photons, respectively.
Figure 5—figure supplement 3
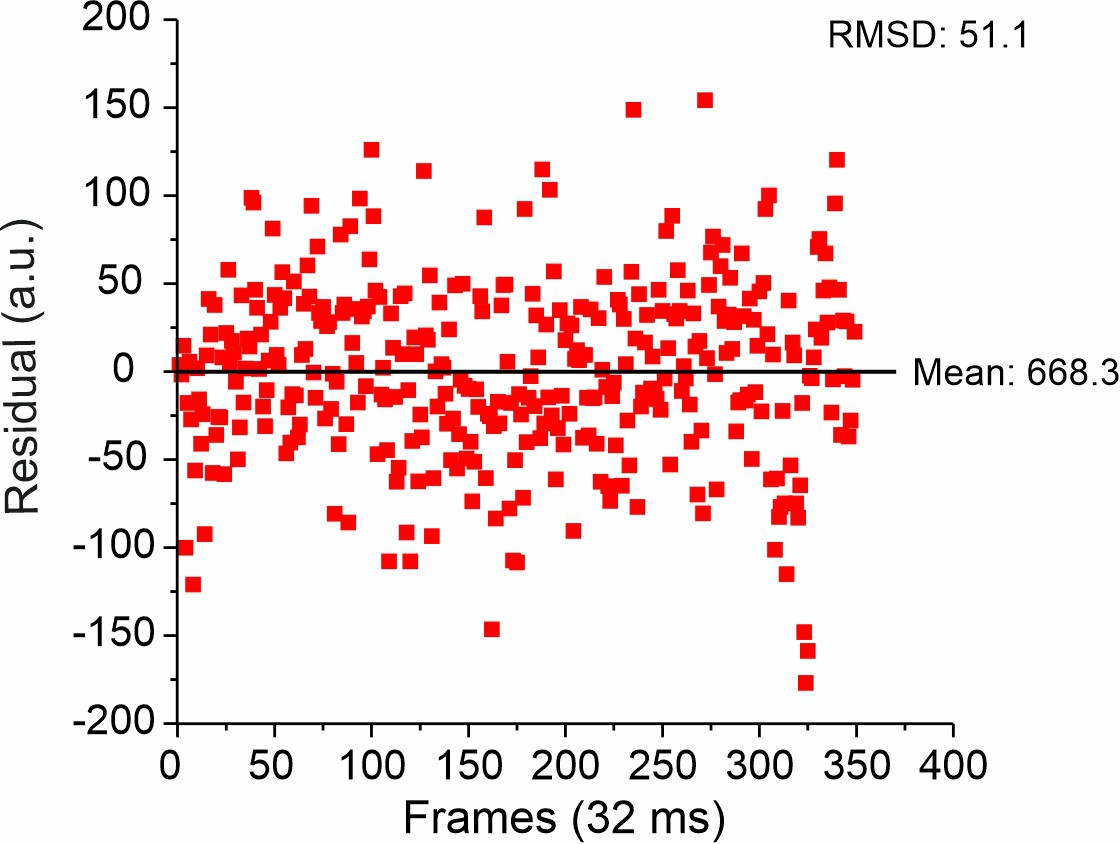
Representative root mean square deviation (RMSD) of single-molecule intensity traces on glass.
From the RMSD and mean intensity, a relative error of 7.6% for single-molecule detection was obtained. Of note, the relative error at single-molecule level was ~2 times smaller than s.d. of the pooled single-molecule intensity analysis on glass (Figure 5—figure supplement 2), which can be explained by signal inhomogeneity due to the not fully uniform TIRF illumination profile.
Author response image 1
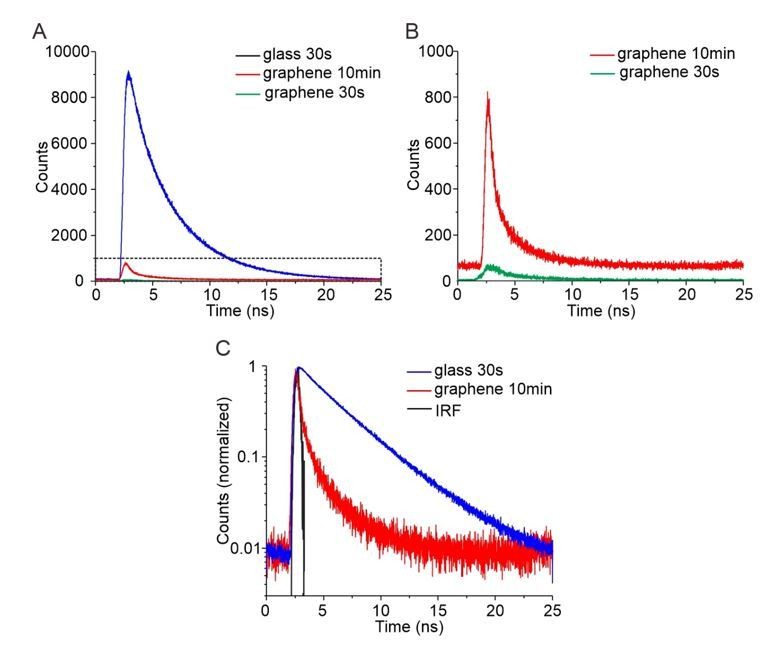
Time-correlated single photon counting (TCSPC) for quantification of GIET efficiency on lipid monolayer.
(A) TCSPC curves of OG488-DHPE recorded on glass with 30s (blue), on graphene with 30 s (green) and on graphene with 10 min (red). (B) Zoom up of TCSPC curves obtained on graphene with 30 s (green) and with 10 min (red). (C) Logarithmic diagram of the normalized time-correlated counts obtained on glass 30 s (blue) and graphene 10 min (red), in comparison with the instrument response function (IRF, black).
Videos
Video 1
Mobility of mNeon-Ypt7-GTP anchored into a glass-supported lipid bilayer probed by FRAP.
Scale bar: 10 µm.
Video 2
FRAP of mNeon-Ypt7-GTP in interaction with HOPS on glass-supported lipid bilayer.
Scale bar: 10 µm.
Video 3
Single-molecule fluorescence images of NB labeled HOPS Vps33-yEGFP on glass and graphene, respectively, imaged under the same conditions.
Scale bar: 2 µm.
Tables
Table 1
Conformational states characterized by HMM analysis of smGIET.
| Protein | HOPS Vps33-yEGFP | HOPS Vps11-yEGFP | ||||
|---|---|---|---|---|---|---|
| State | L | M | H | L | M | H |
| IG/I0a | 0.25 ± 0.06 | 0.41 ± 0.08 | 0.69 ± 0.13 | 0.22 ± 0.05 | 0.36 ± 0.06 | 0.51 ± 0.08 |
| h (nm) b | 4.7 (3.9–5.5) | 6.8 (5.7–7.9) | 11.2 (8.9–14.9) | 4.3 (3.6–5.0) | 6.1 (5.3–6.9) | 8.1 (7.0–9.3) |
| Occup. (%)c | 30.9 ± 0.1 | 35.7 ± 0.2 | 33.5 ± 0.1 | 40.4 ± 0.2 | 38.0 ± 0.2 | 21.6 ± 0.1 |
-
*: mean ±s.d. based on IG of the Gaussian fits in single-molecule intensity distribution on graphene. I0 is the mean value of Gaussian fit on glass. b: h is the average height of NB-labeled HOPS on the membrane. Values in brackets are the range of h determined by mean ±s.d of IG/I0. c: mean ± s.e.m. of state occupancy.
Key resources table
| Reagent type (species) or resource | Designation | Source or reference | Identifiers | Additional information |
|---|---|---|---|---|
| Gene (Saccharomyces cerevisiae) | mNeon-Ypt7 | Thermo Fisher Scientific | ||
| Strain, strain background (S. cerevisiae) | BY4732 | Euroscarf library | MATa his3∆200 leu2∆0 met15∆0 trp1∆63 ura3∆0 | |
| Strain, strain background (S. cerevisiae) | BY4727 | Euroscarf library | MATalpha his3∆200 leu2∆0 lys2∆0 met15∆0 trp1∆63 ura3∆0 | |
| Strain, strain background (S. cerevisiae) | CUY2470 | doi: 10.1016/j.cub.2010.08.002 | BY4732; CCZ1::TRP1-GAL1pr MON1::HIS3M × 6-GAL1pr CCZ1::TAP-URA3 | |
| Strain, strain background (S. cerevisiae) | CUY2675 | doi:10.1111/j.1600-0854.2010.01097.x | BY4732xBY4727 VPS41::TRP1-GAL1pr VPS41::TAP-URA3 VPS39::KanMX-GAL1pr VPS33::HIS3-GAL1pr VPS11::HIS3-GAL1pr VPS16::natNT2-GAL1pr VPS18::kanMX-GAL1pr-3HA | |
| Strain, strain background (S. cerevisiae) | CUY4391 | doi: 10.1073/pnas.1117797109 | BY4732xBY4727 VPS41::TRP1-GAL1pr VPS41::TAP-URA3 VPS39::KanMX-GAL1pr VPS39::yEGFP-hphNT1 VPS33::HIS3-GAL1pr VPS11::HIS3-GAL1pr VPS16::natNT2-GAL1pr VPS18::kanMX-GAL1pr-3HA | |
| Strain, strain background (S. cerevisiae) | CUY4392 | doi: 10.1073/pnas.1117797109 | BY4732xBY4727 VPS41::TRP1-GAL1pr VPS41::TAP-URA3 VPS39::KanMX-GAL1pr VPS33::HIS3-GAL1pr VPS11::HIS3-GAL1pr VPS11::yEGFP-hphNT1 VPS16::natNT2-GAL1pr VPS18::kanMX-GAL1pr-3HA | |
| Strain, strain background (S. cerevisiae) | CUY4393 | doi: 10.1073/pnas.1117797109 | BY4732xBY4727 VPS41::TRP1-GAL1pr VPS41::TAP-URA3 VPS39::KanMX-GAL1pr VPS33::HIS3-GAL1pr VPS11::HIS3-GAL1pr VPS16::natNT2-GAL1pr VPS16::yEGFP-hphNT1 VPS18::kanMX-GAL1pr-3HA | |
| Strain, strain background (S. cerevisiae) | CUY4394 | doi: 10.1073/pnas.1117797109 | BY4732xBY4727 VPS41::TRP1-GAL1pr VPS41::TAP-URA3 VPS39::KanMX-GAL1pr VPS33::HIS3-GAL1pr VPS11::HIS3-GAL1pr VPS16::natNT2-GAL1pr VPS18::kanMX-GAL1pr-3HA VPS18::yEGFP-hphNT1 | |
| Strain, strain background (S. cerevisiae) | CUY4395 | doi: 10.1073/pnas.1117797109 | BY4732xBY4727 VPS41::TRP1-GAL1pr VPS41::TAP-URA3 VPS39::KanMX-GAL1pr VPS33::HIS3-GAL1pr VPS33::yEGFP-hphNT1 VPS11::HIS3-GAL1pr VPS16::natNT2-GAL1pr VPS18::kanMX-GAL1pr-3HA | |
| Recombinant DNA reagent | pET21a-EGFP | Novagen | ||
| Recombinant DNA reagent | pET21a-NB-H6 | Novagen | ||
| Recombinant DNA reagent | pET24b-Ypt7 | doi: 10.1242/jcs.140921 | ||
| Recombinant DNA reagent | pET24d-GST-TEV-Ypt7 | doi: 10.1091/mbc.e11-12-1030 | ||
| Recombinant DNA reagent | pET24d-GST-TEV-mNeon-Ypt7 | this paper | mNeon-Ypt7 gene was synthesized by Thermo Fisher Scientific, provided in a pMA-T backbone and subcloned into a pET24d vector. | |
| Recombinant DNA reagent | pGEX-6P-Gdi1 | doi: 10.1083/jcb.201608123 | ||
| Recombinant DNA reagent | pCDF-DUET-1-Bet2-Bet4 | doi: 10.1083/jcb.201608123 | ||
| Recombinant DNA reagent | pET30-Mrs6 | other | Gift from K. Alexandrov laboratory, Institute for Molecular Bioscience, The University of Queensland, Australia | |
| Sequenced-based reagent | 20mer anchor DNA oligonucleotide | IDT | 5’- GATGAATGGTGGGTGAGAGG-3´-TEG-Cholesterol | |
| Sequenced-based reagent | 25mer anchor DNA oligonucleotide | IDT | 5’- GATGAATGGTGGGTGAGAGGTGAGG-3´-TEG-Cholesterol | |
| Sequenced-based reagent | 35mer anchor DNA oligonucleotide | IDT | 5’- GATGAATGGTGGGTGAGAGGTGAGGAGTAAGAGGA-3´-TEG-Cholesterol | |
| Sequenced-based reagent | 50mer anchor DNA oligonucleotide | IDT | 5’- GATGAATGGTGGGTGAGAGGTGAGGAGTAAGA GGATGTGTTAGAGGGATG-3´-TEG-Cholesterol | |
| Sequenced-based reagent | 3´-FAM probe DNA oligonucleotide | IDT | 5’-CCTCTCACCCACCATTCATC-3´-FAM | |
| Sequenced-based reagent | 5´-FAM probe DNA oligonucleotide | IDT | 5’- FAM-CCTCTCACCCACCATTCATC-3´ | |
| Sequenced-based reagent | 15mer blocker DNA oligonucleotide | IDT | 5’-TCCTCTTACTCCTCA-3´ | |
| Sequenced-based reagent | 30mer blocker DNA oligonucleotide | IDT | 5’-CATCCCTCTAACACATCCTCTTACTCCTCA-3´ | |
| Peptide, recombinant protein | H6-mEGFP | doi: 10.1021/acs.nanolett.5b01153 | purified from E. coli BL21- DE3 cells | |
| Peptide, recombinant protein | GPF NB ‘enhancer’ | doi: 10.1002/smll.201502132 | purified from E. coli BL21- DE3 cells | |
| Software, algorithm | Origin8 | OriginLab | ||
| Software, algorithm | ImageJ | NIH | 1.53e | Time Series Analyzer plugin for extracting single-molecule intensity traces, Author: Balaji J http://rsb.info.nih.gov/ij/plugins/time-series.html |
| Software, algorithm | MATLAB | Mathworks | R2019b | Code availability for calculating the GIET efficiency was documented in Nature Photonics 2019, 13: 860–865. doi: 10.1038/s41566-019-0510-7. |
| Software, algorithm | HMM | other | Hidden Markov Model (HMM) Toolbox for Matlab written by Kevin Murphy https://www.cs.ubc.ca/~murphyk/Software/HMM/hmm.html | |
| Software, algorithm | STaSI | doi: 10.1021/jz501435p | Algorithm of step transition and state identification for single-molecule data analysis. |
Additional files
-
Supplementary file 1
GIET calibration by DNA nanorulers.
- https://cdn.elifesciences.org/articles/62501/elife-62501-supp1-v1.docx
-
Supplementary file 2
Fluorescence lifetime ratios of endocytic proteins and protein complexes.
- https://cdn.elifesciences.org/articles/62501/elife-62501-supp2-v1.docx
-
Supplementary file 3
Plasmids and yeast strains used in this study.
- https://cdn.elifesciences.org/articles/62501/elife-62501-supp3-v1.docx
-
Supplementary file 4
Conformational states and transition kinetics obtained from smGIET.
- https://cdn.elifesciences.org/articles/62501/elife-62501-supp4-v1.docx
-
Supplementary file 5
RMSD and mean intensities of single-molecule detections.
- https://cdn.elifesciences.org/articles/62501/elife-62501-supp5-v1.docx
-
Transparent reporting form
- https://cdn.elifesciences.org/articles/62501/elife-62501-transrepform-v1.docx
Download links
A two-part list of links to download the article, or parts of the article, in various formats.
Downloads (link to download the article as PDF)
Open citations (links to open the citations from this article in various online reference manager services)
Cite this article (links to download the citations from this article in formats compatible with various reference manager tools)
Nanoscopic anatomy of dynamic multi-protein complexes at membranes resolved by graphene-induced energy transfer
eLife 10:e62501.
https://doi.org/10.7554/eLife.62501


