Divergence in alternative polyadenylation contributes to gene regulatory differences between humans and chimpanzees
- Genetics, Genomics and Systems Biology, University of Chicago, United States
- Department of Human Genetics, University of Chicago, United States
- Section of Genetic Medicine, Department of Medicine, University of Chicago, United States
Figures
Figure 1 with 12 supplements
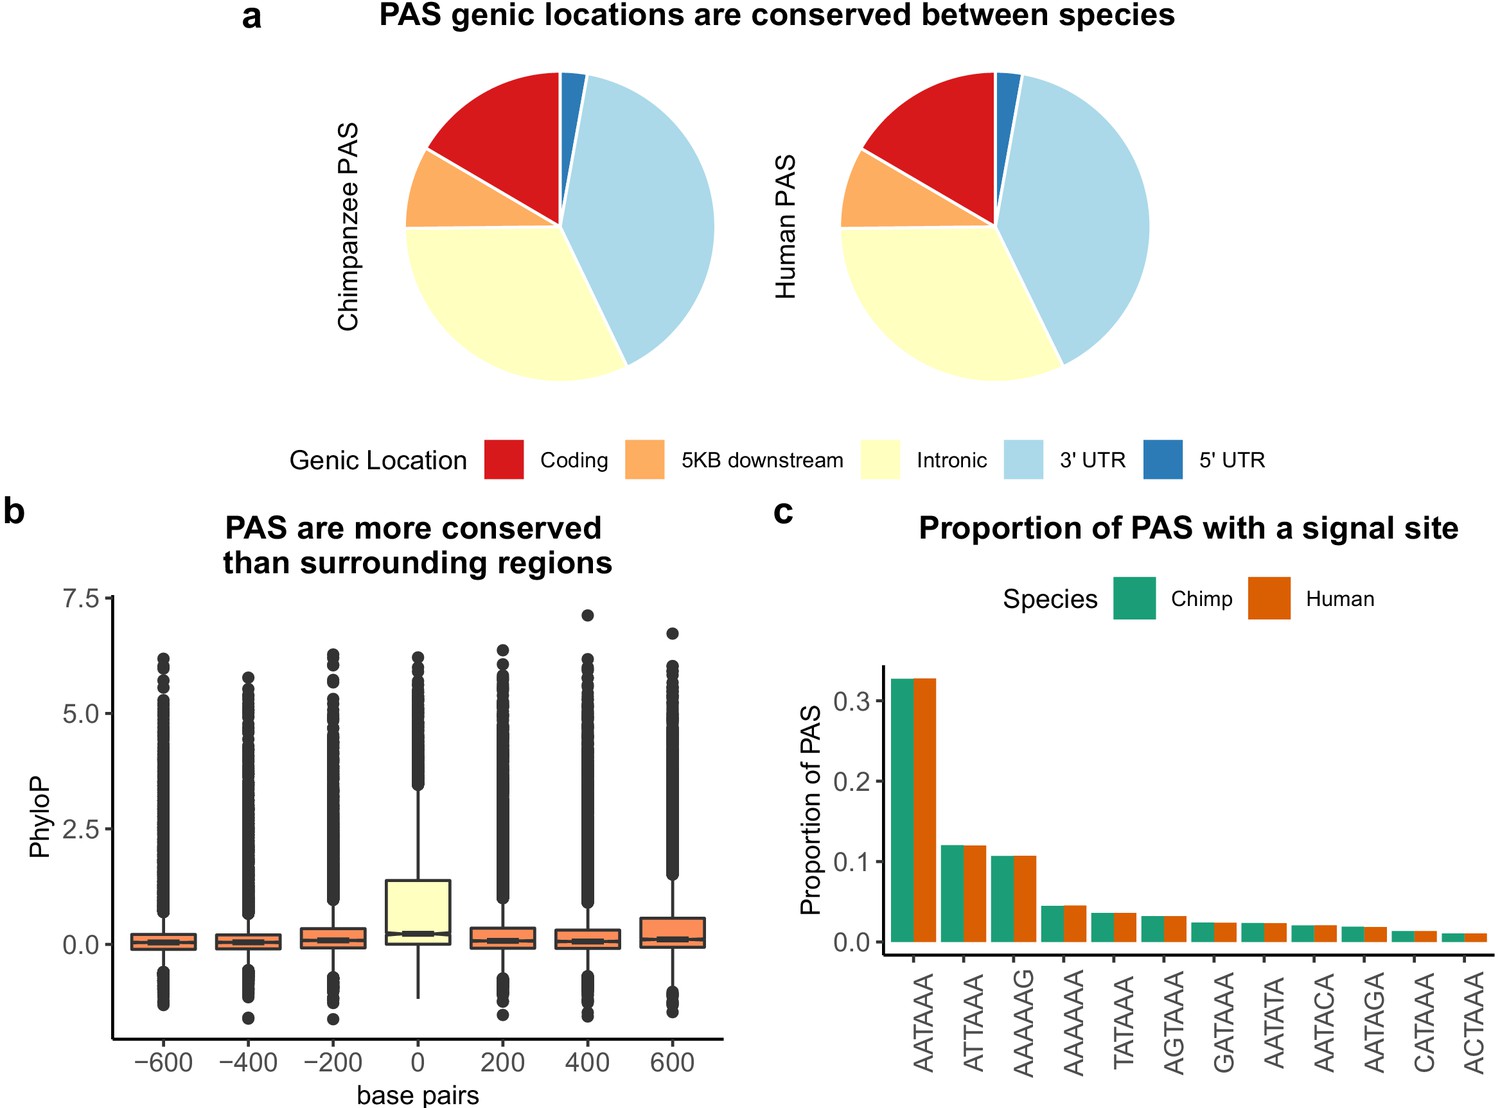
Sequence conservation of polyadenylation sites (PAS) between humans and chimpanzees.
(a) Genic locations for 44,074 PAS identified in chimpanzee (left) and 44,130 PAS identified in human (right). (b) Mean PhyloP scores for PAS regions (yellow) as well as three 200 bp regions upstream and downstream (orange). (c) Proportion of human and chimpanzee PAS regions with each of the 12 annotated signal site motifs from Beaudoing et al., 2000.
Figure 1—figure supplement 1
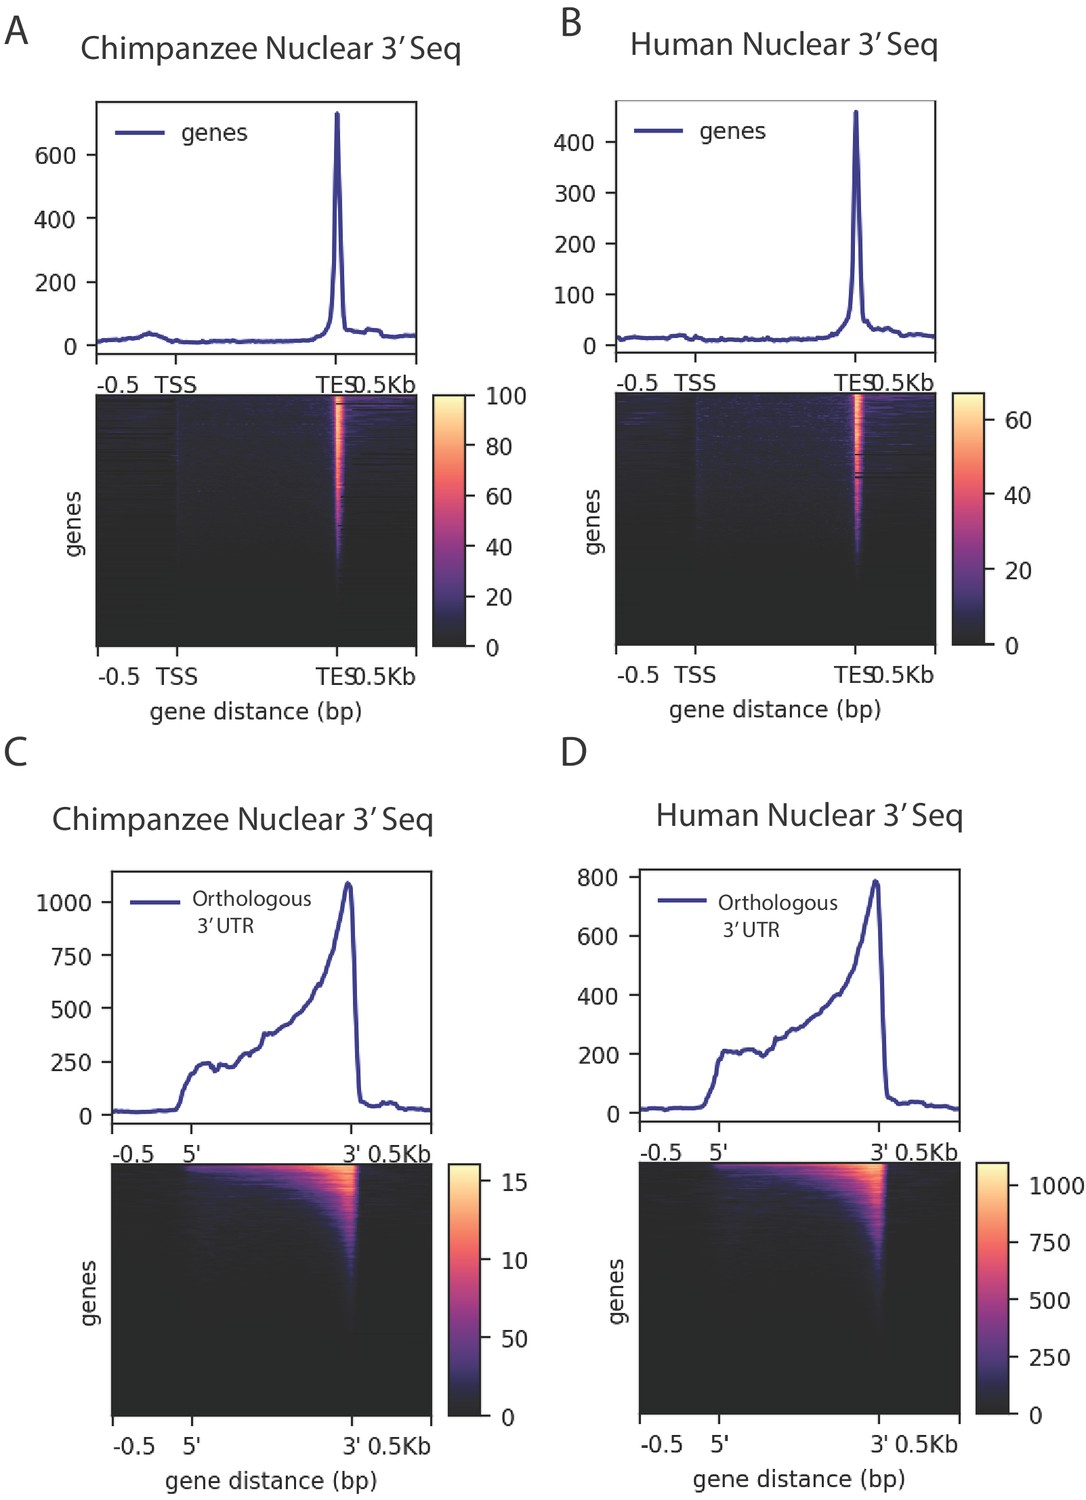
Density of merged human and chimpanzee 3' sequencing (3' Seq).
(A) Coverage of six chimpanzee, nuclear 3' Seq reads along Refseq transcripts. (B) Coverage of five human, nuclear 3' Seq reads along Refseq transcripts. (C) Coverage of six chimpanzee, nuclear 3' Seq reads orthologous 3' UTRs. (D) Coverage of five human, nuclear 3' Seq reads orthologous 3' UTRs.
Figure 1—figure supplement 2

Model representation of usage calculation.
Representation of polyadenylation sites (PAS) usage calculation. Usage is a ratio of reads at each PAS to the number of reads mapping to any PAS in the same gene. Reproduced from Mittleman et al., 2020.
Figure 1—figure supplement 3
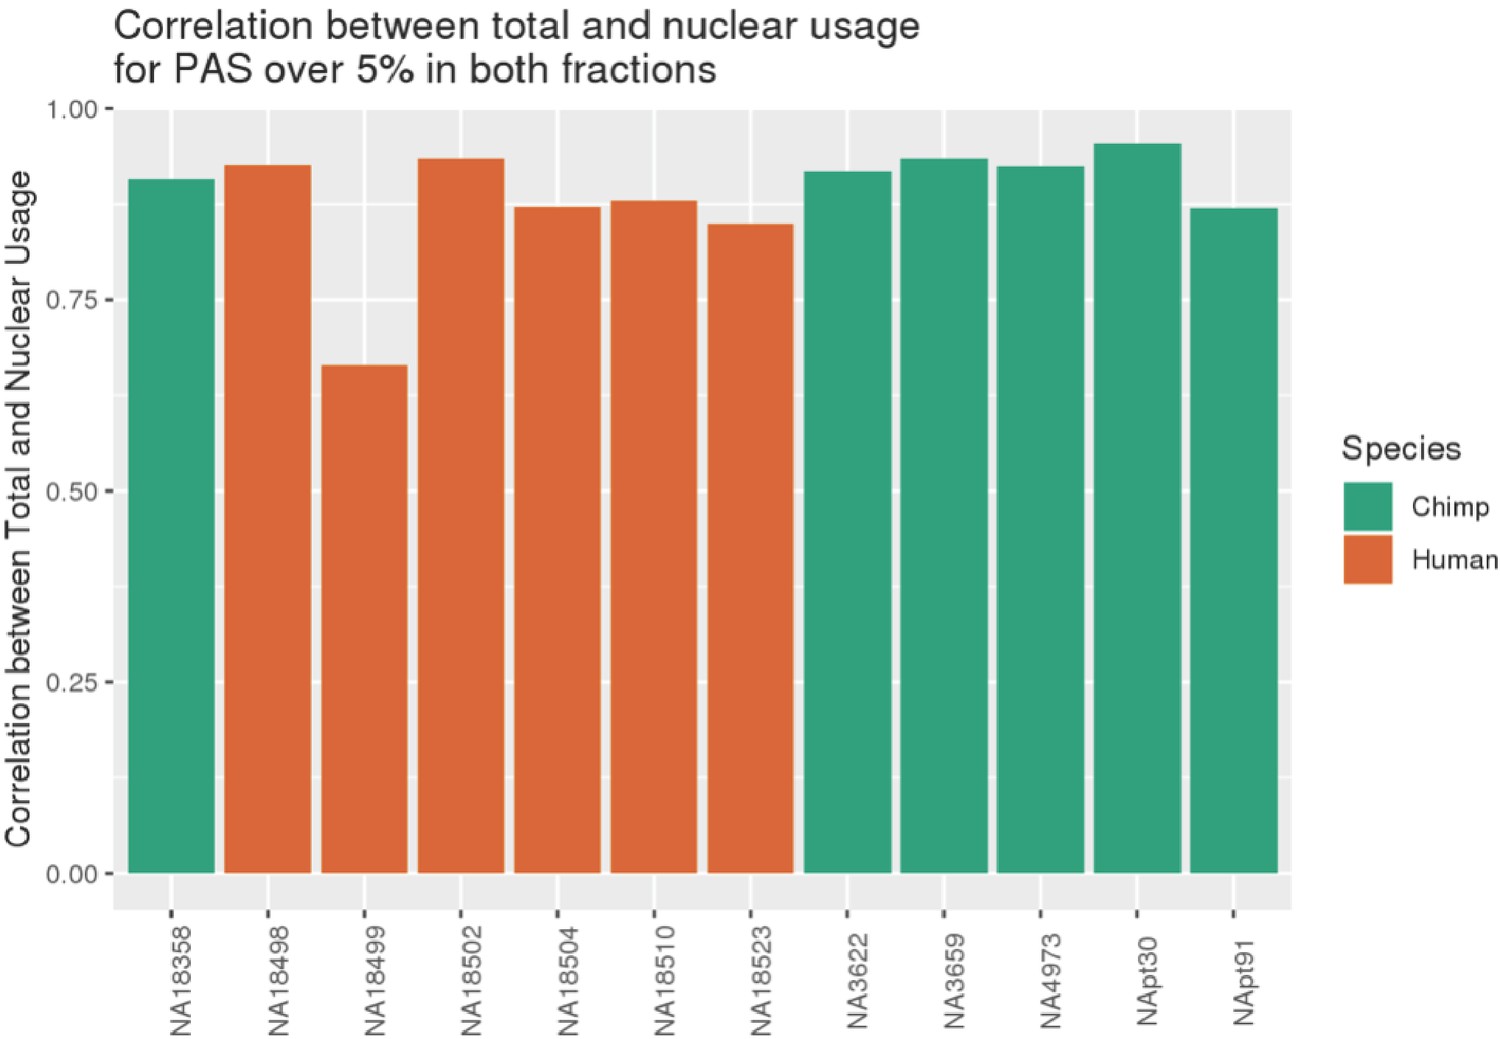
NA18499 removed from analysis due to low correlation between fractions.
Pearson's correlation between PAS usage calculated using nuclear 3' sequencing (3' Seq) libraries and total mRNA 3' Seq libraries, calculated using sites reaching 5% in one species in both fractions. (Plot from previous git commit 30ff122 on April 9, 2020, https://github.com/brimittleman/Comparative_APA; Mittleman, 2021a).
Figure 1—figure supplement 4
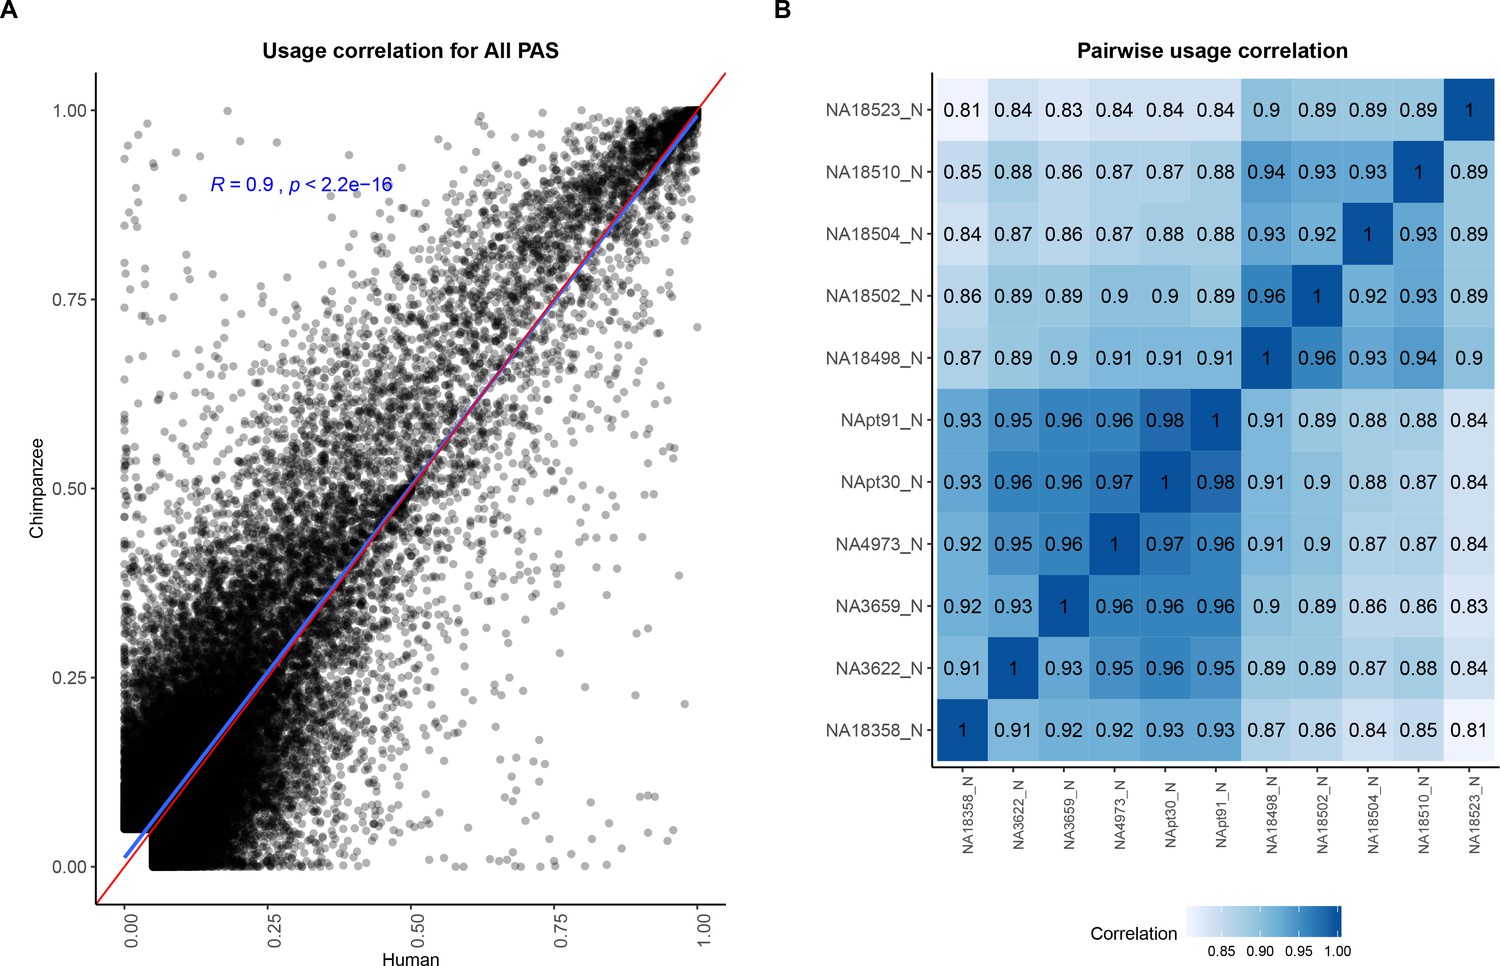
Polyadenylation sites (PAS) usage is highly correlated across species.
(A) Correlation between human and chimpanzee PAS usage for 44,432 PAS. Red line is a 1:1 line. Linear regression line and Pearson's correlation plotted in blue. (B) Pairwise correlation for human and chimpanzee PAS usage.
Figure 1—figure supplement 5
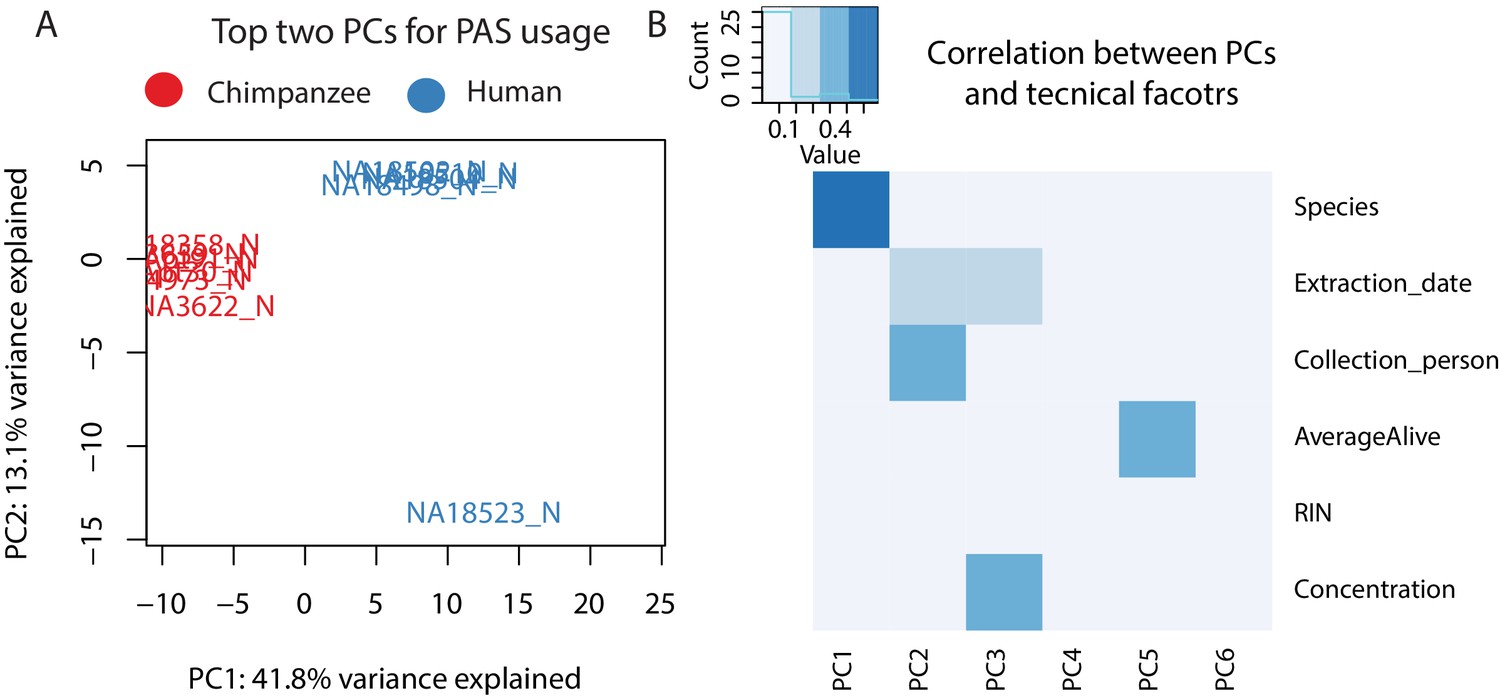
Variation in polyadenylation sites (PAS) usage.
(A) Plot of first two principal components (PCs) calculated by a PC analysis (PAC) on PAS usage (44,432 PAS). Chimpanzee samples are shown in red and human samples are shown in blue. (B) Heatmap representing correlation between technical factors and PCs. Y axis factors include: Species, Extraction date, Collection person, AverageAlive (average of two live dead calculations at time of collection), RIN score, RNA concentration. Explanation of factors and values in Supplementary file 4.
Figure 1—figure supplement 6
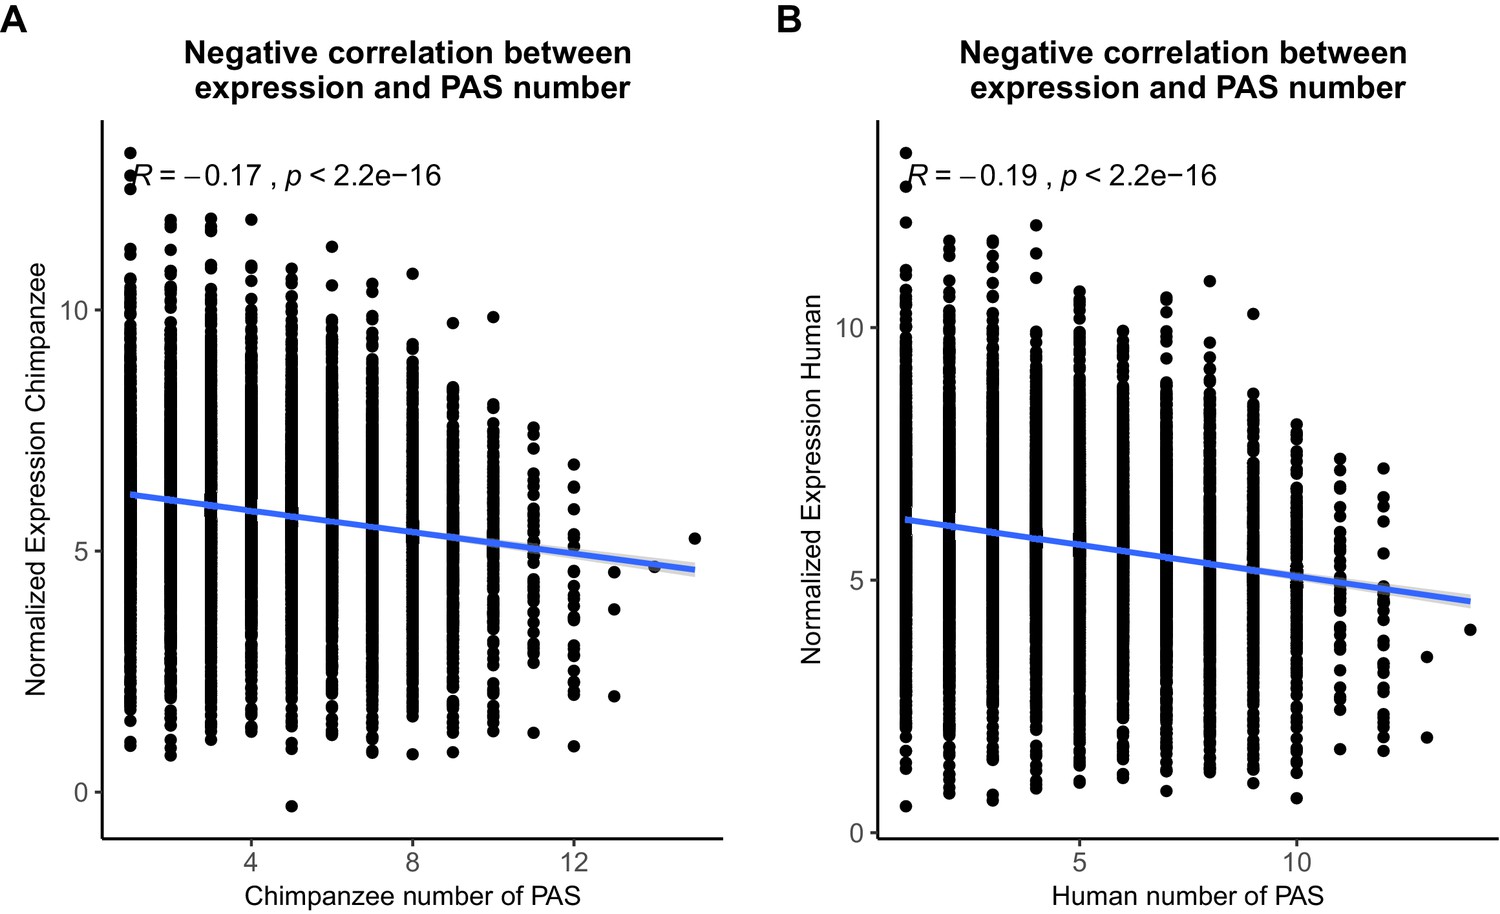
Polyadenylation sites (PAS) detection likely not biased by expression level.
(A) Normalized gene expression plotted against the number of PAS detected at 5% usage in chimpanzee. (B) Normalized gene expression plotted against the number of PAS detected at 5% usage in human. The R package ggpubr was used to plot linear regression lines and calculate Pearson's correlations.
Figure 1—figure supplement 7

Polyadenylation sites (PAS) detection likely not biased by species.
Histogram of the number of PAS detected at 5% usage in human minus the number of 5% usage in chimpanzees. Red vertical line represents mean difference (0.39).
Figure 1—figure supplement 8
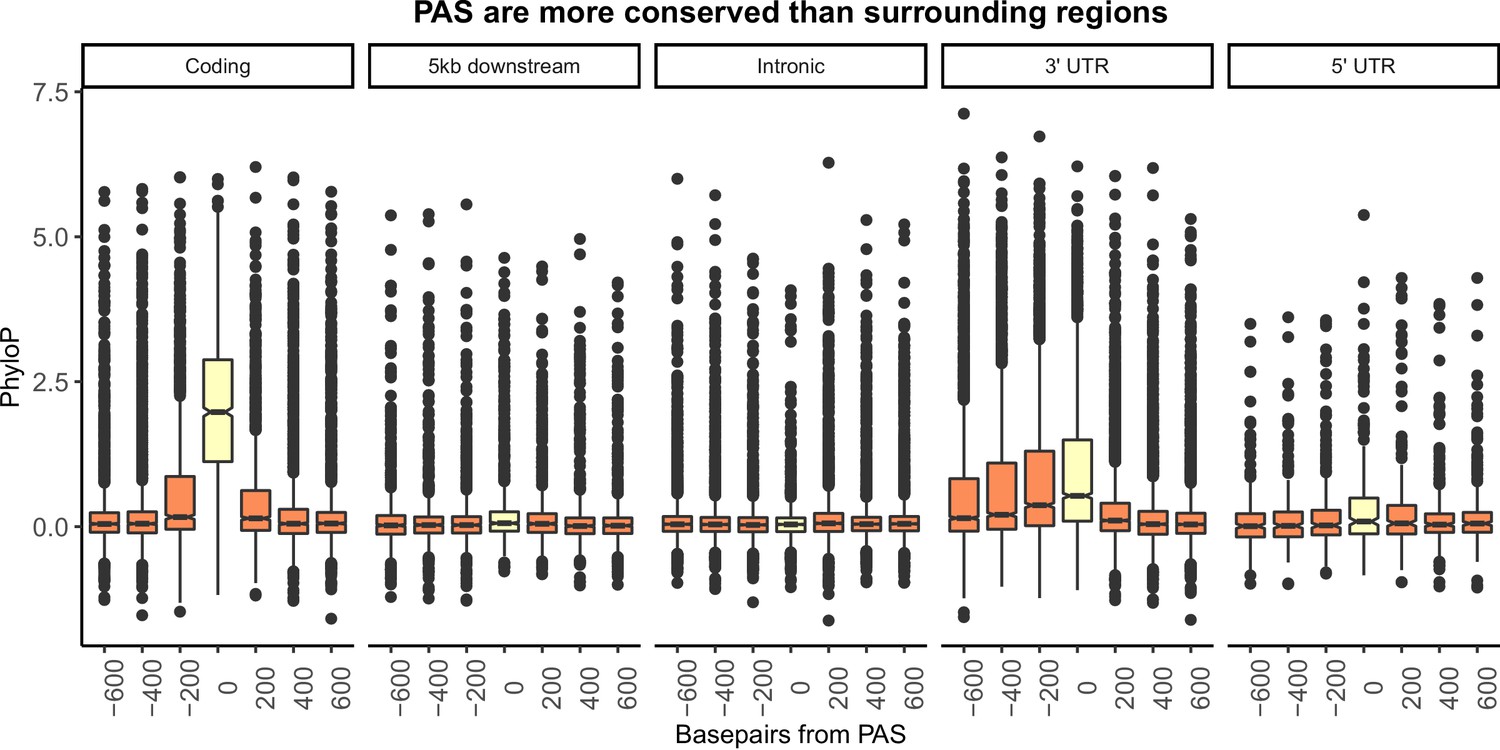
Figure 1B separated by genic location.
Mean PhyloP scores for polyadenylation sites (PAS) regions (yellow) and 200 base pair bins upstream and downstream of PAS (orange). A one-sided Wilcoxon test was used to test for increased PhyloP in PAS regions (coding region: p<2.2×10⁻¹⁶; 5 kb downstream of genes: p=7.02×10⁻⁶; intron: p=0.99; 3' UTR: p<2.2×10⁻¹⁶; 5' UTR: p=0.011).
Figure 1—figure supplement 9
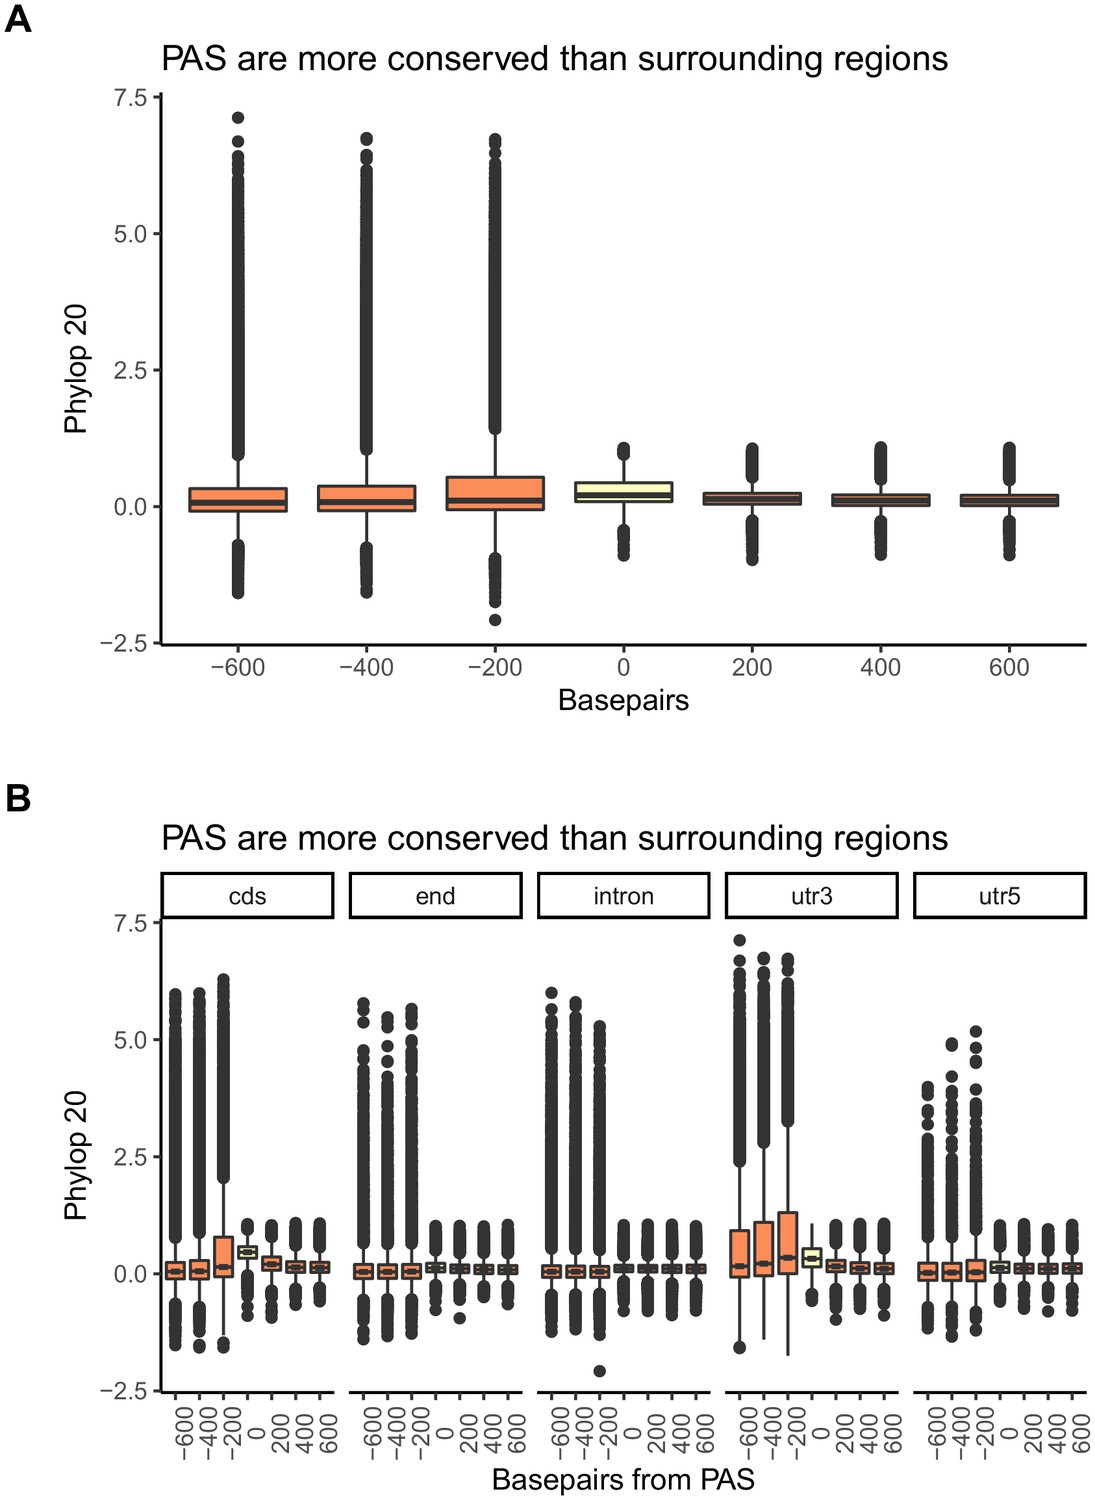
Polyadenylation sites (PAS) regions are conserved in the mammalian lineage.
Mean PhyloP scores for PAS regions (yellow) and 200 base pair bins upstream and downstream of PAS (orange) (A) Figure 1B recapitulated with PhyloP scores calculated over 20 vertebrate species. (B) Figure 1—figure supplement 8 recapitulated with PhyloP scores calculated over 20 vertebrate species. One-sided Wilcoxon test was used to test for increased PhyloP in PAS regions (cds-coding region: p<2.2×10⁻¹⁶; end-5 kb downstream of genes: p<2.2×10⁻¹⁶; intron: p<2.2×10⁻¹⁶; utr3-3' UTR: p<2.2×10⁻¹⁶; utr5-5' UTR: p<2.2×10⁻¹⁶).
Figure 1—figure supplement 10
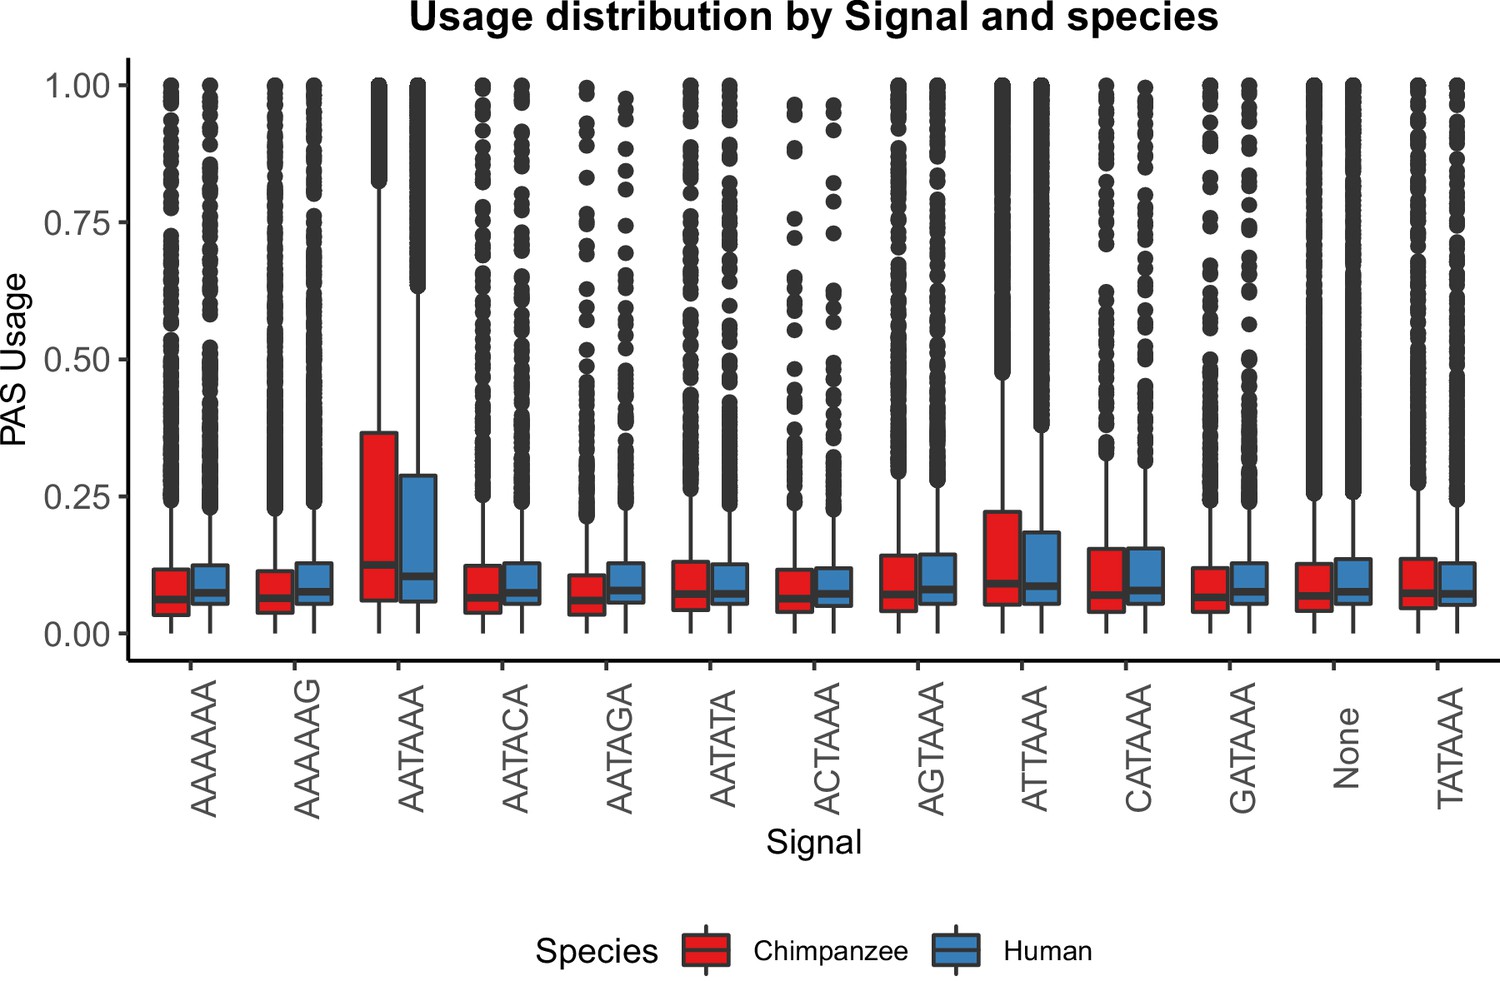
PAS with AATAAA and ATTAAA are used more often.
Mean PAS usage of the top two signal site motifs in human and chimpanzee plotted by annotated signal site.
Figure 1—figure supplement 11
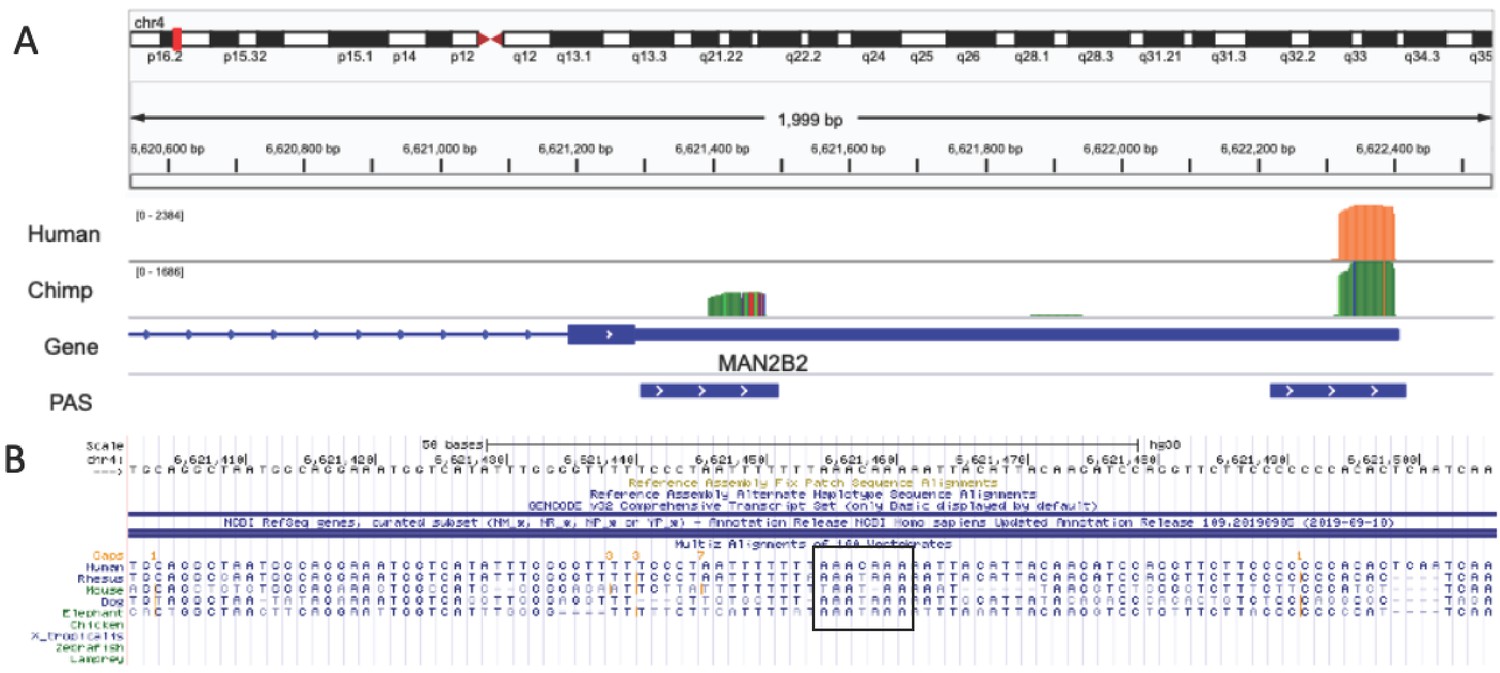
Chimp-specific polyadenylation sites (PAS) likely due to loss of signal site in human lineage.
(A) Integrative Genomics Viewer (IGV) track for example of a chimpanzee-specific PAS in MAN2B2 gene. Top track is merged coverage from five human nuclear 3' sequencing (3' Seq) libraries. Chimp track is merged coverage from six chimpanzee nuclear 3' Seq libraries lifted to human genome with CrossMap. (B) Sequence alignment for region upstream of proximal PAS from UCSC Genome Browser black box indicates the signal site location. Canonical signal site is the ancestral state and was lost in the human lineage.
Figure 1—figure supplement 12

Reciprocal liftover pipeline.
Reciprocal liftover pipeline for unfiltered polyadenylation sites (PAS) including the number of sites remaining at each step. Liftover using UCSC liftover tool and chain files downloaded from UCSC Genome Browser.
Figure 2 with 8 supplements
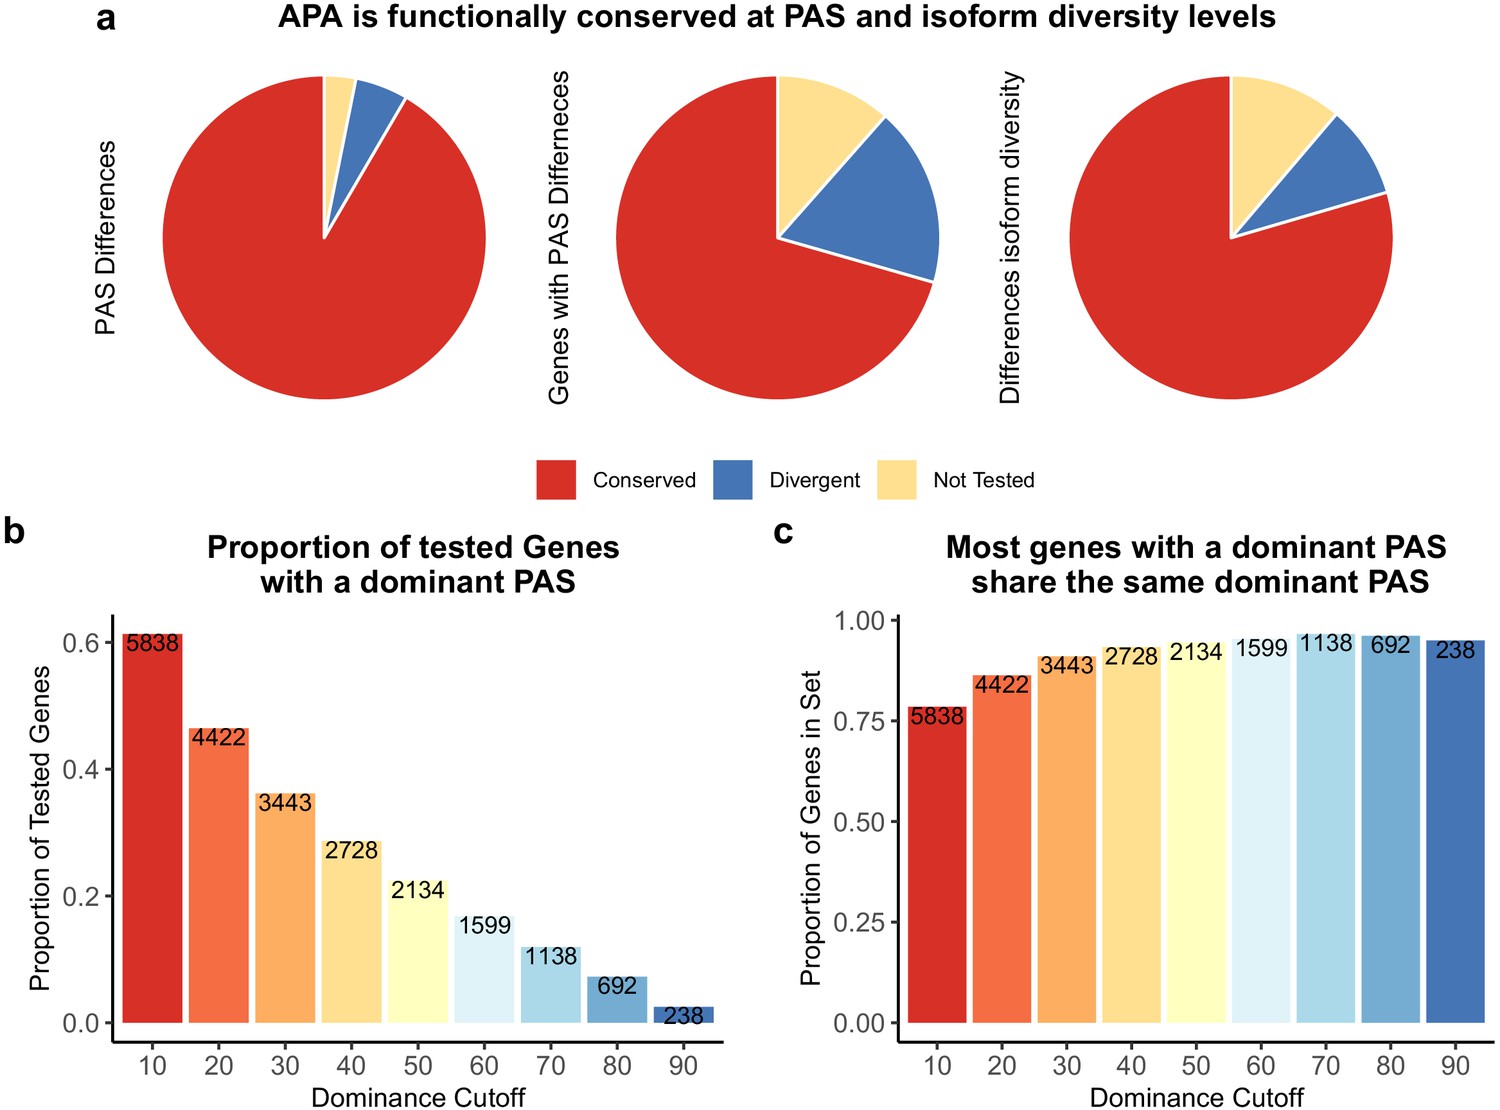
Alternative polyadenylation (APA) is functionally conserved in both species.
(a) Proportion of polyadenylation sites (PAS) and genes differentially used at PAS and isoform diversity level. (Left) Divergent PAS are the 2342 PAS differentially used at 5% FDR. Conserved are the PAS not differentially used at 5% FDR. Not tested PAS were removed from analysis by leafcutter tool. (Middle) PAS level differentially used PAS reported at the gene level. Divergent genes are the 1705 genes with PAS differentially used at 5% FDR. Conserved genes are the genes with no PAS differentially used at 5% FDR. (Right) Divergent genes are the 881 genes with differences in isoform diversity between species at a 5% FDR. Conserved genes are genes without differences in isoform diversity. Genes with one PAS were not tested. (b) Proportion of tested genes with a dominant PAS in either species according to a range of cutoffs. Number of genes are reported in bars. The bars are colored by the dominance cutoff on the X axis. (c) Proportion of the number of genes with a dominant in either species that share the top used PAS according to each dominance cutoff. Number of genes with a dominant PAS in either species are reported in bars. The bars are colored by the dominance cutoff on the X axis.
Figure 2—figure supplement 1

Genic location of polyadenylation sites (PAS) differentially used between human and chimpanzee.
Differentially used PAS (5% FDR) between human chimpanzee by genic annotation.
Figure 2—figure supplement 2
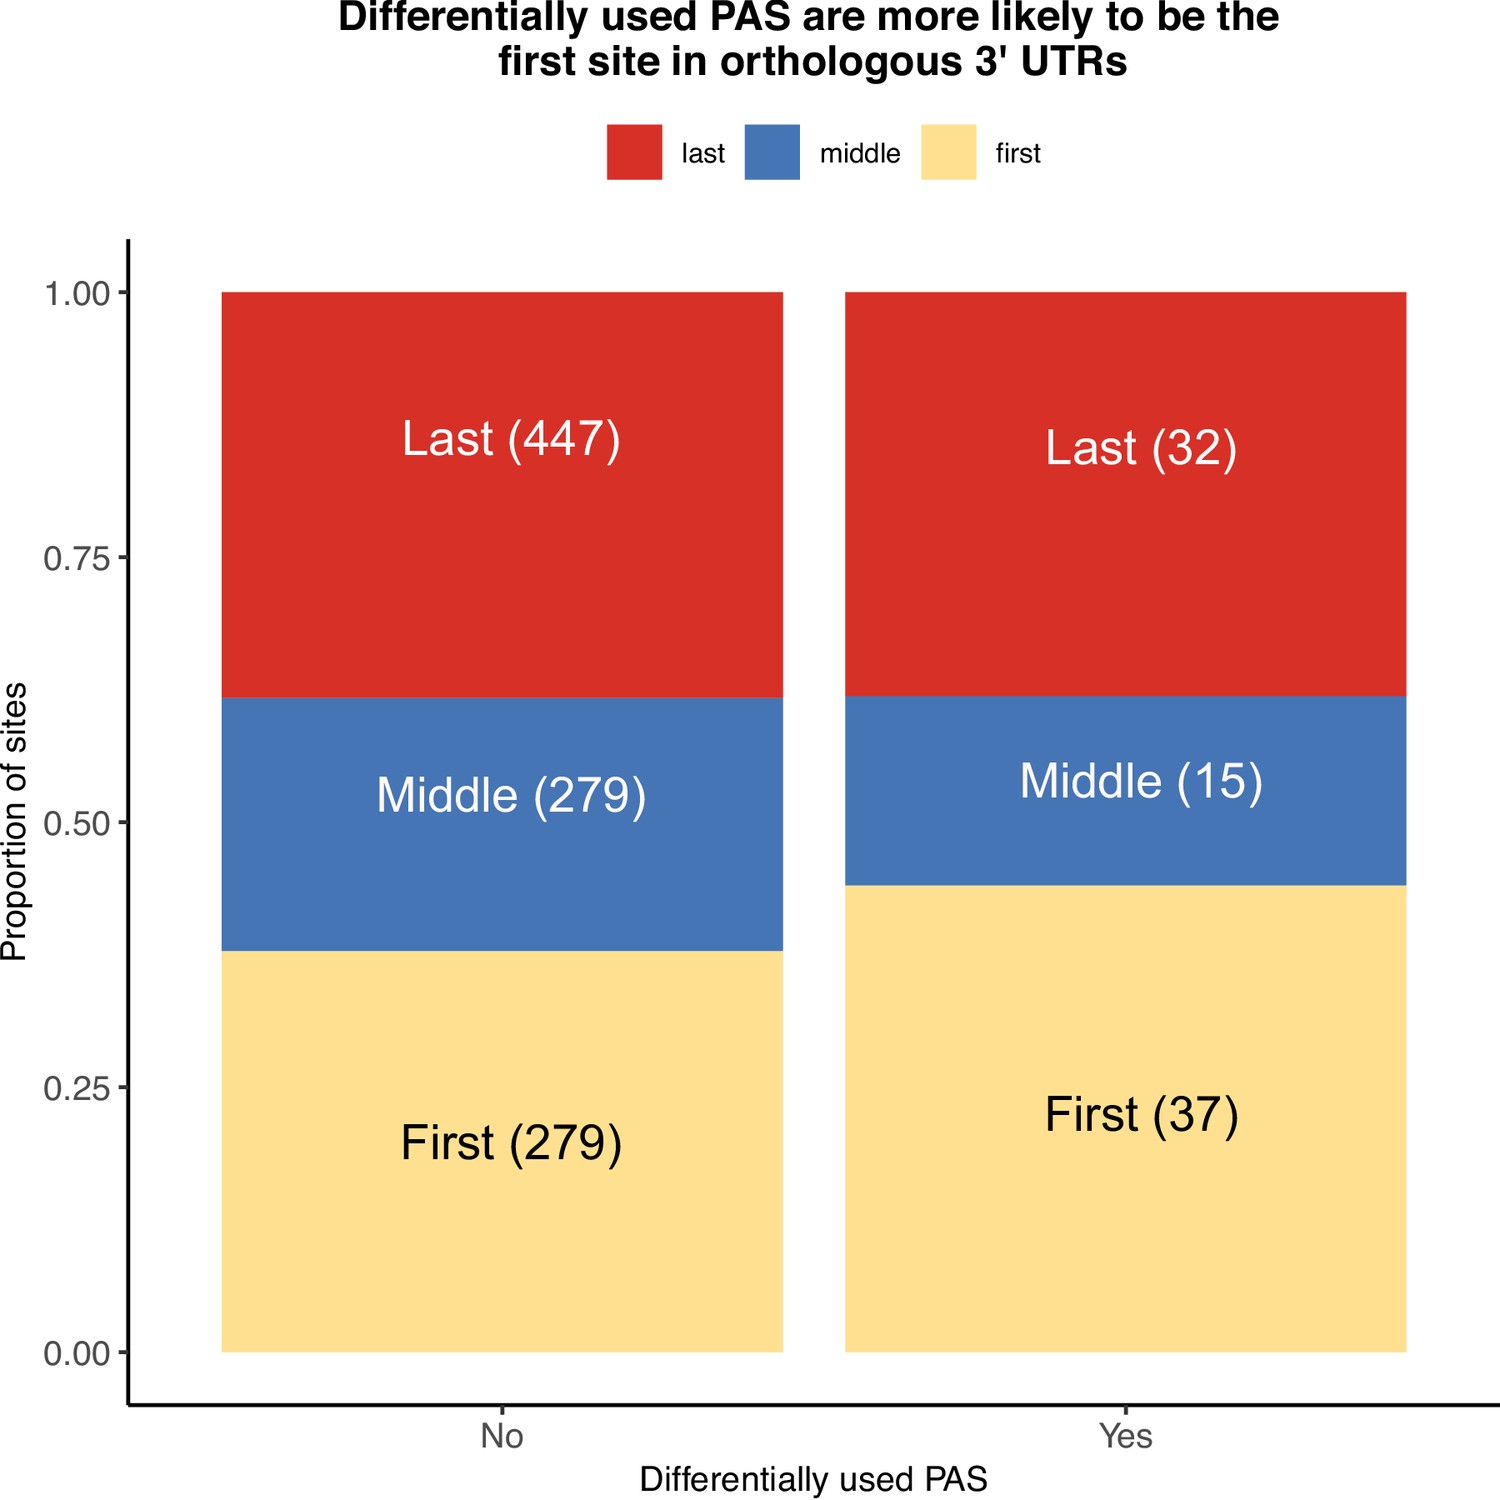
Location of polyadenylation sites (PAS) within orthologous 3' UTRs.
Proportion of sites differentially used or conserved by whether they are the first (yellow), middle (blue), or last PAS (red) in orthologous exons.
Figure 2—figure supplement 3
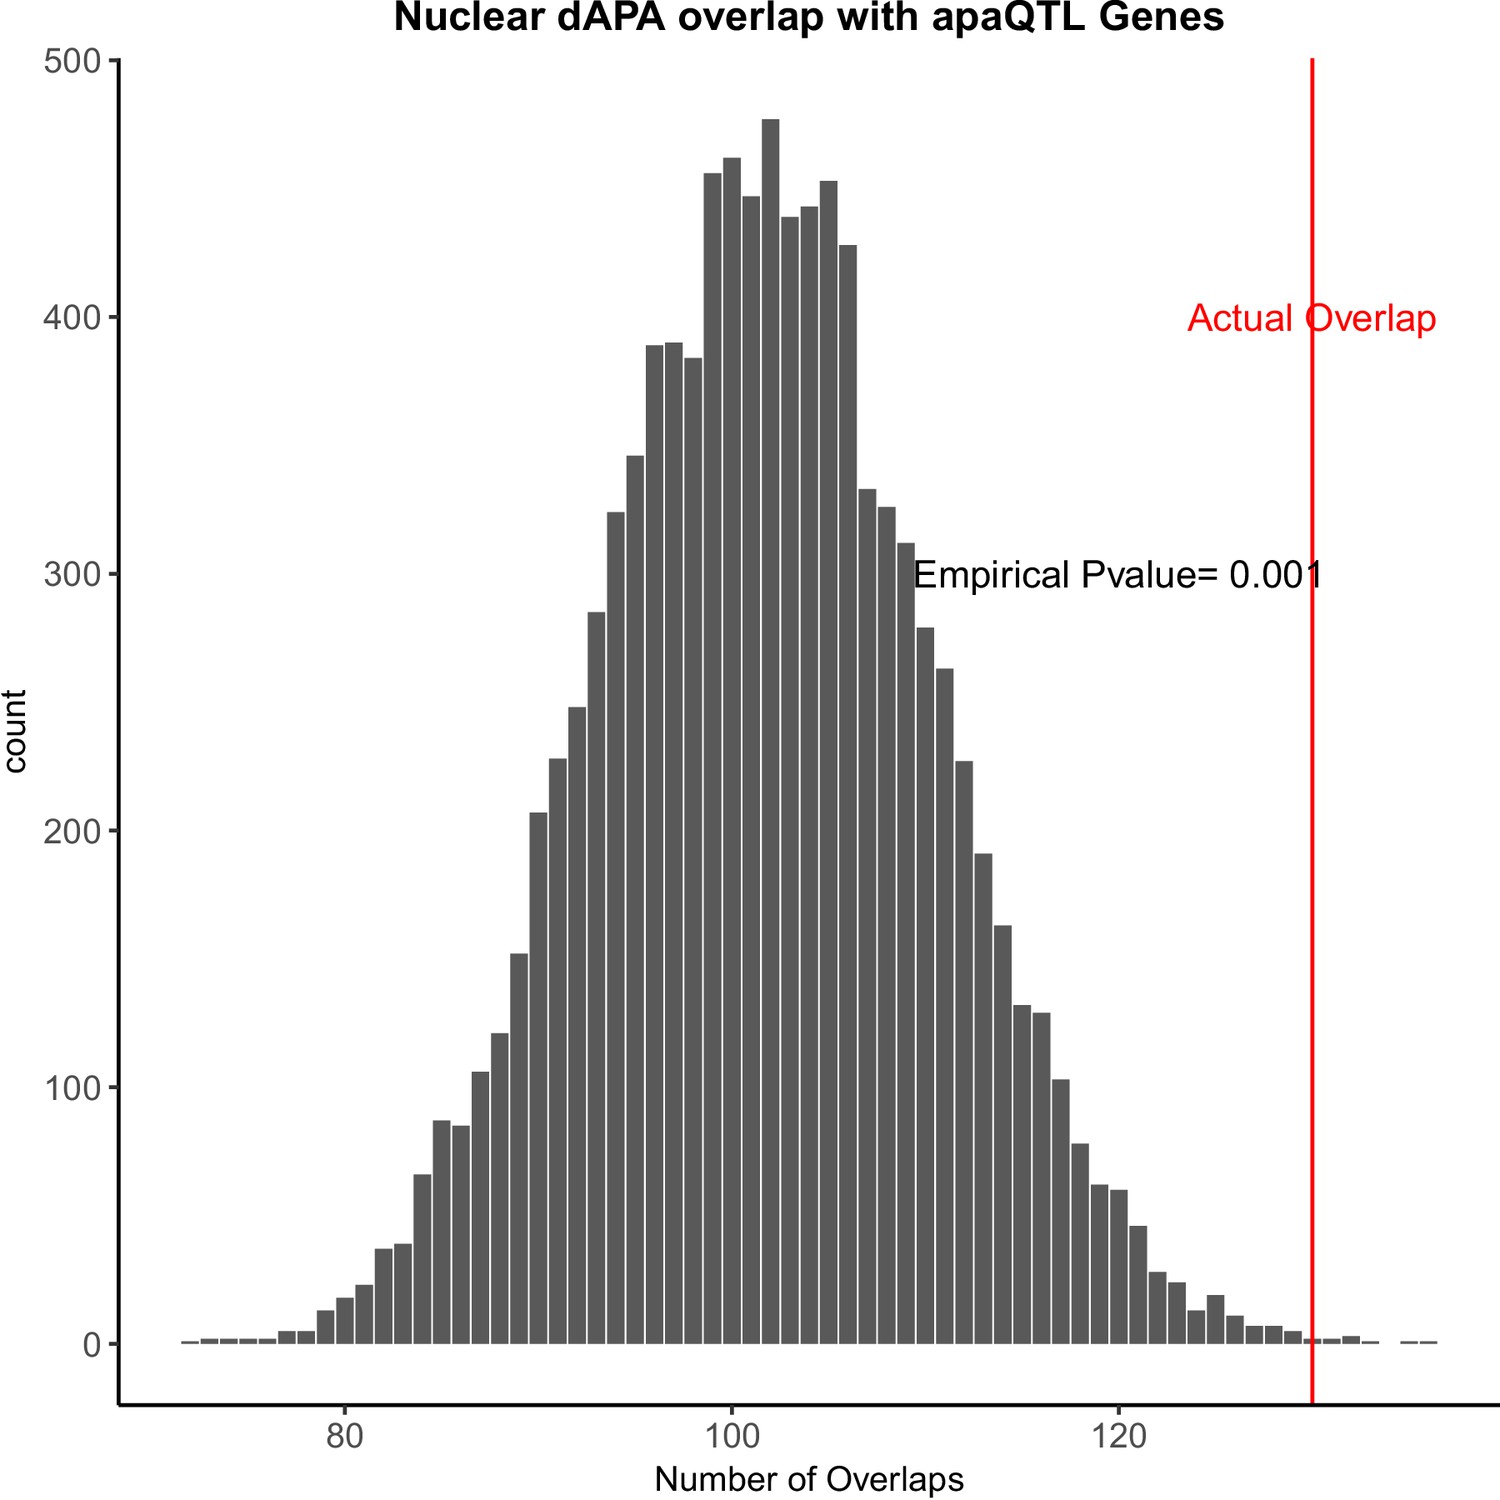
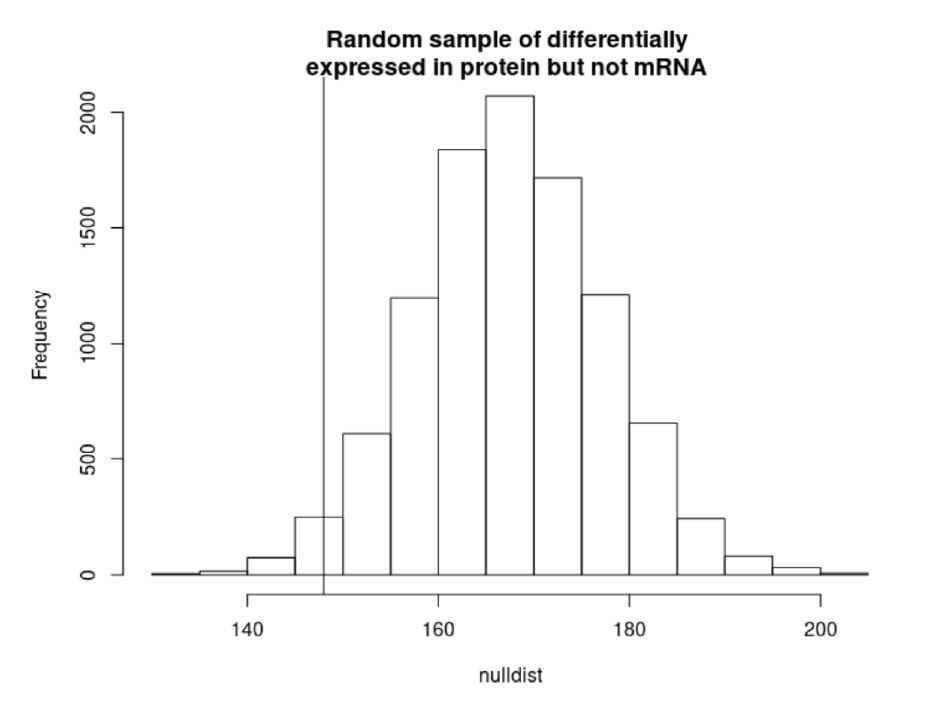
Genes with differentially used polyadenylation sites (PAS) are enriched for genes with apaQTL.
Ten thousand random subsamples of genes tested for differential alternative polyadenylation (APA) and overlap with genes with apaQTLs (APA quantitative trait loci) (Mittleman et al., 2020). Red line represents the actual overlap between genes with differential usage of at least one PAS and apaQTL genes.
Figure 2—figure supplement 4
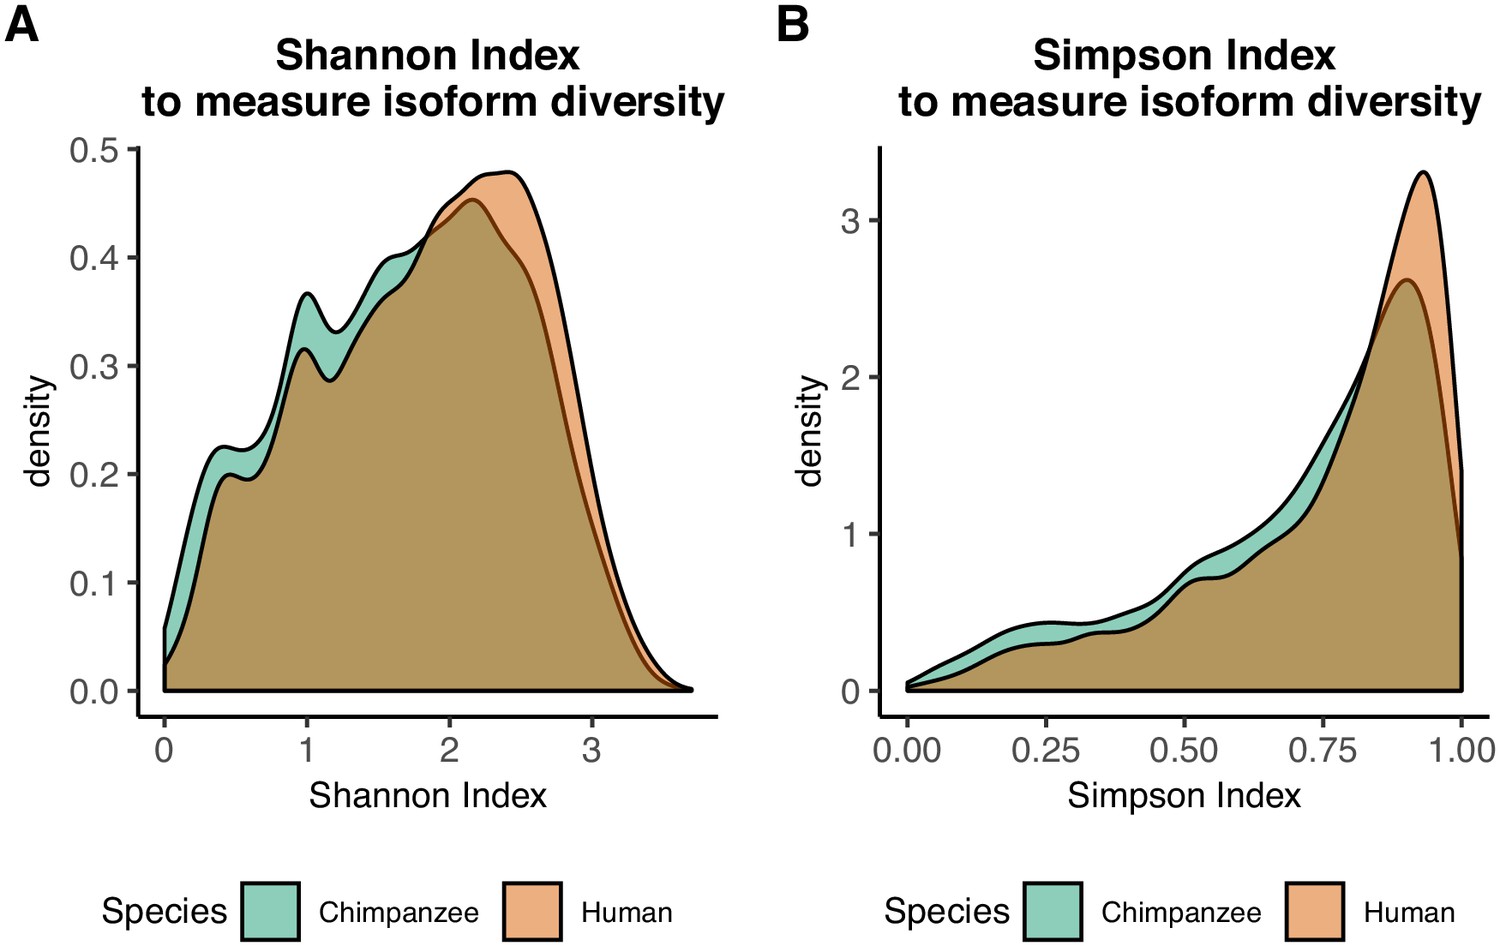
Information content measurement densities.
(A) Density of Shannon indices for all tested genes in human and chimpanzee . (B) Density of Simpson indices for all tested genes in human and chimpanzee .
Figure 2—figure supplement 5
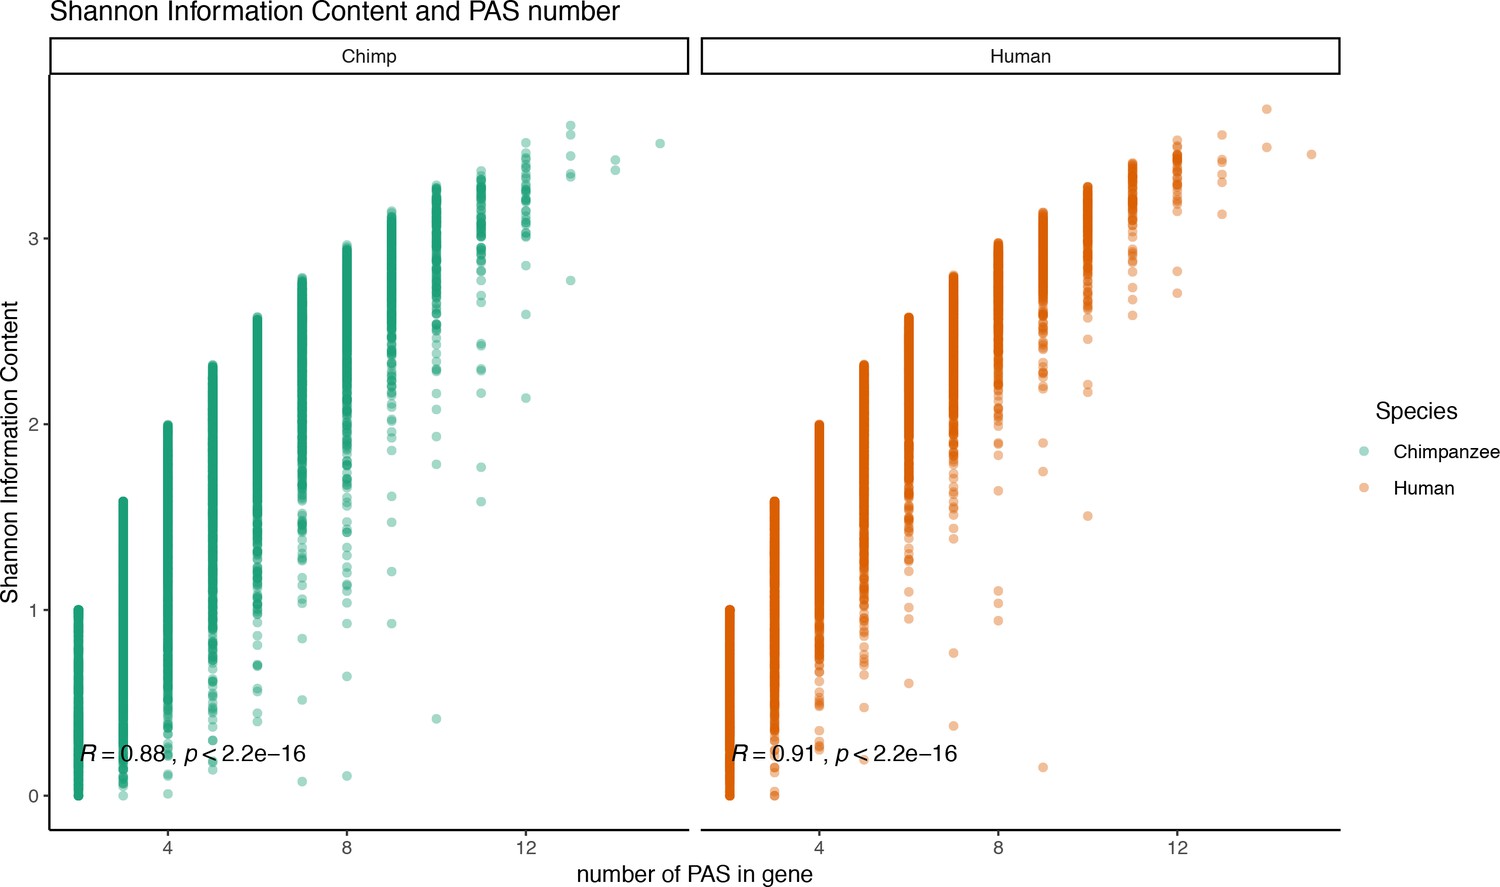
Relationship between Shannon index and polyadenylation sites (PAS) number.
Shannon information index plotted against the number of PAS detect for each gene. Pearson’s correlation and significance in black.
Figure 2—figure supplement 6
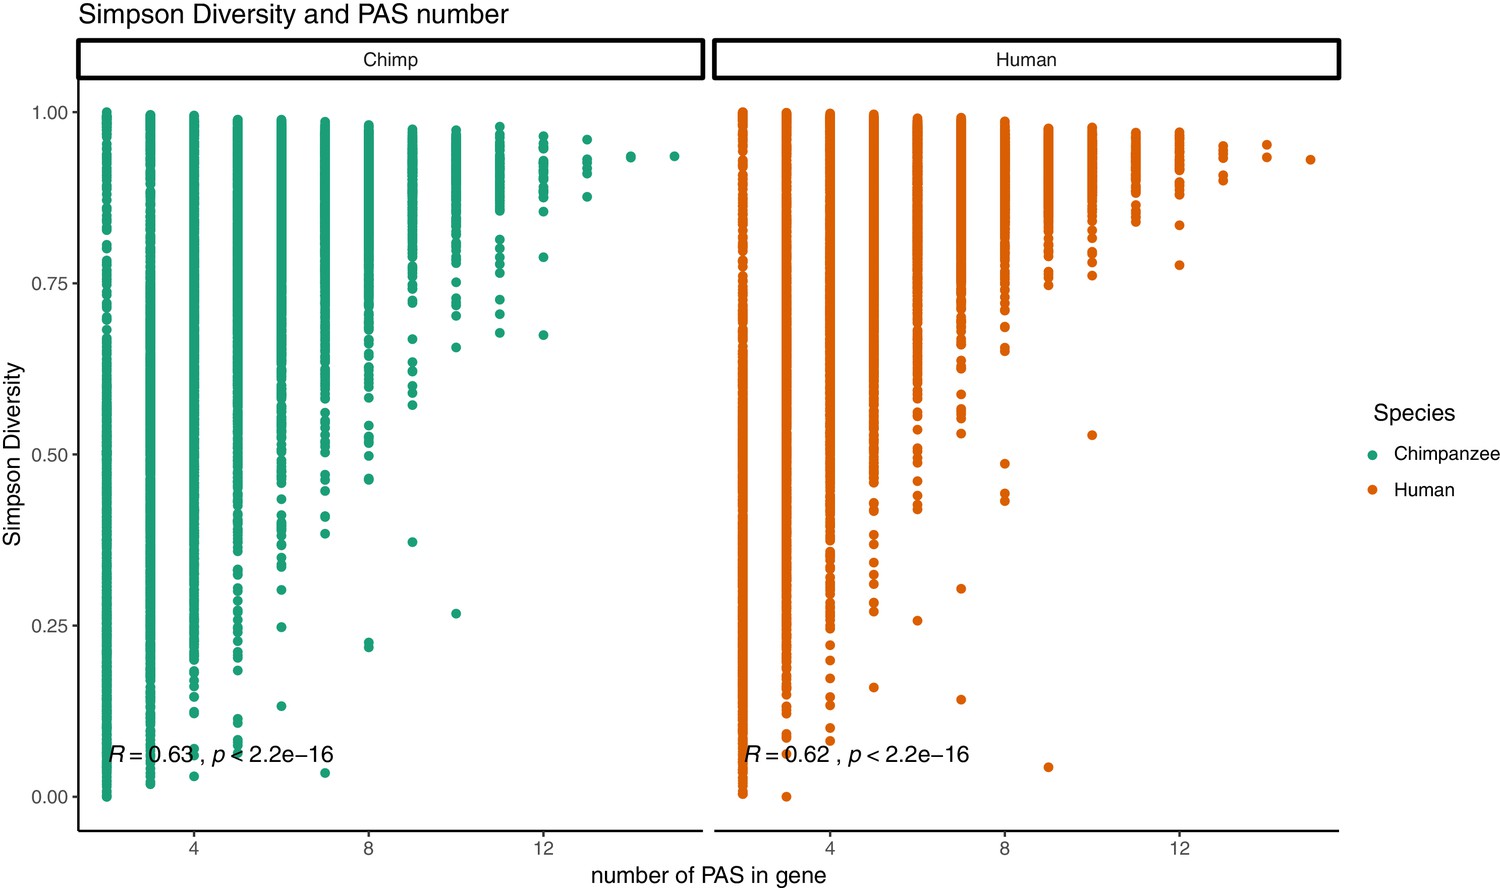
Relationship between Simpson diversity index and polyadenylation sites (PAS) number.
Simpson diversity index plotted against the number of PAS detect for each gene. Pearson’s correlation and significance in black.
Figure 2—figure supplement 7
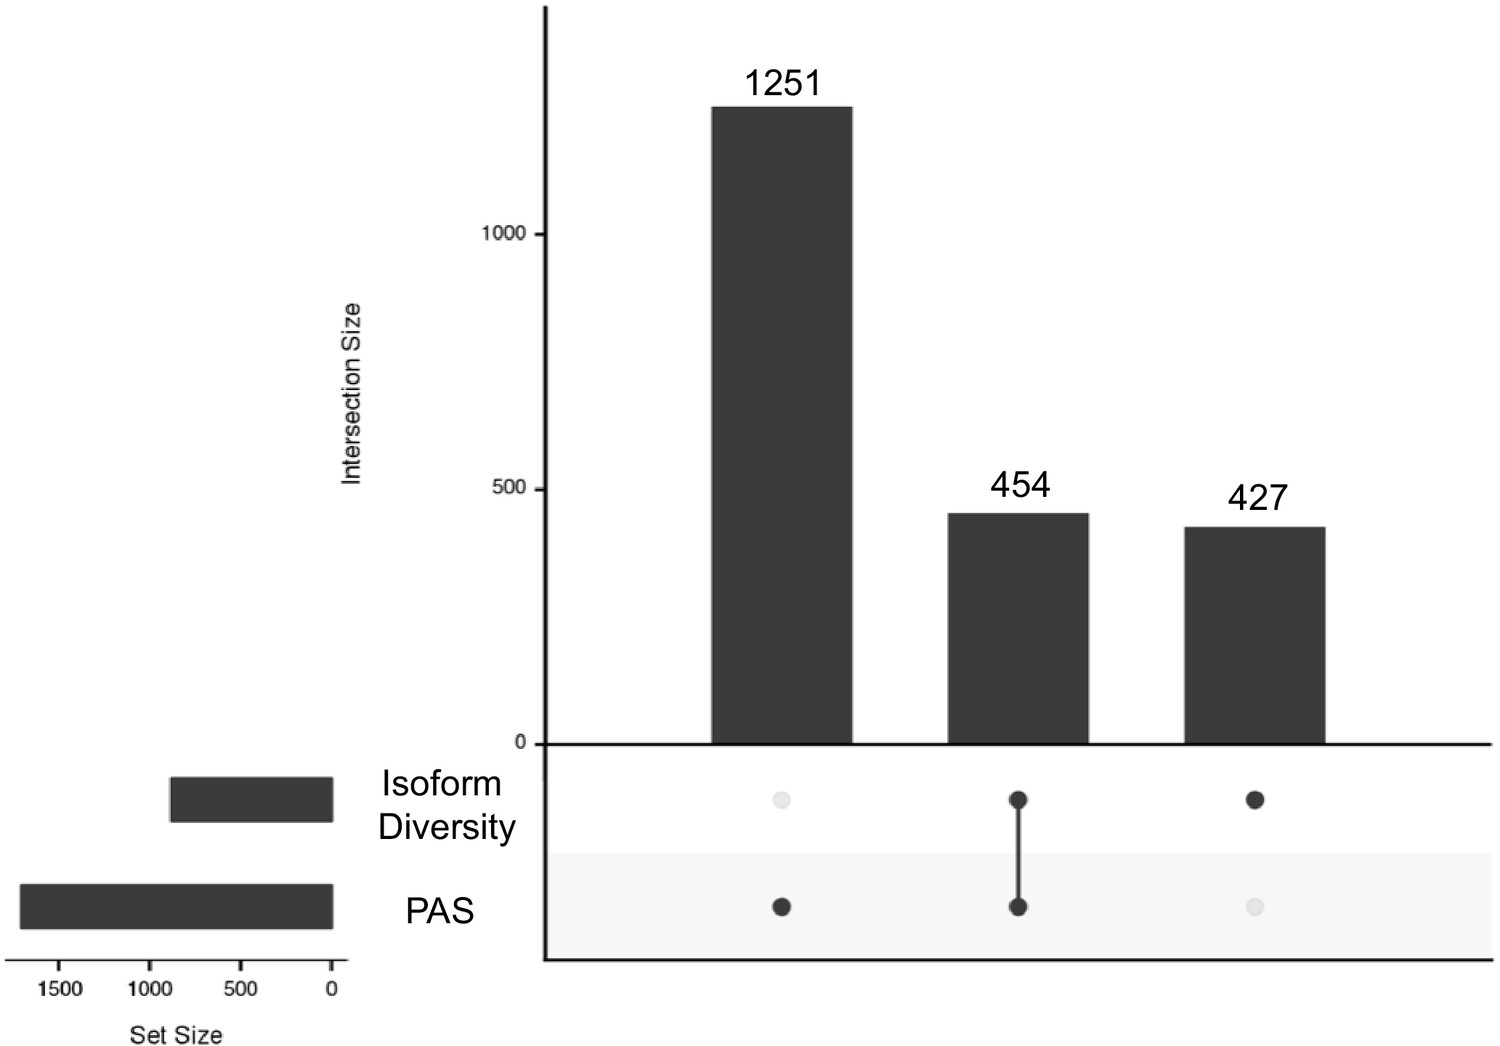
Intersection between genes with polyadenylation sites (PAS) and isoform diversity differences.
One thousand two hundred and fifty-one genes have significant differences in PAS usage between human and chimpanzee (left): 454 genes have significant differences in APA between humans and chimpanzee in PAS usage and in isoform diversity (middle) and 427 genes with differences in isoform diversity level only (right).
Figure 2—figure supplement 8
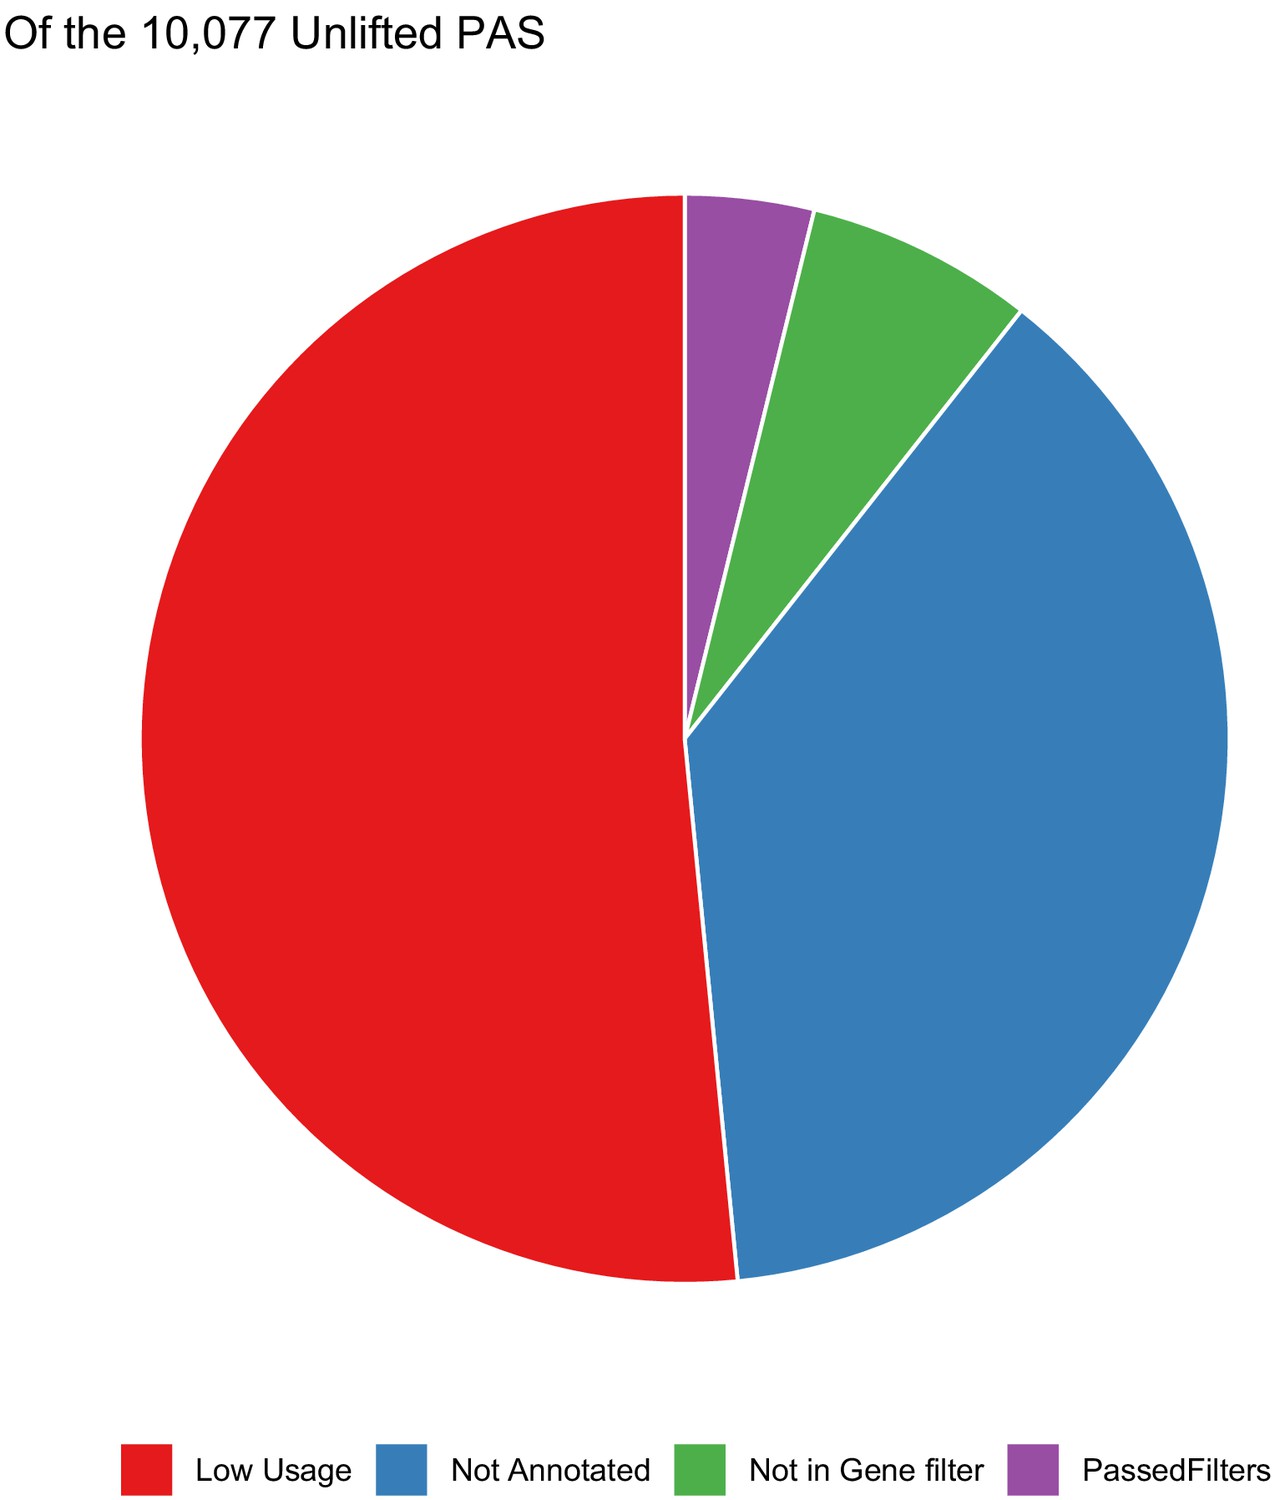
Polyadenylation sites (PAS) that do not lift from human to chimp.
Of the 10,077 PAS that do not reciprocally lift from human to chimp, distribution of the analysis step in which sites are filtered out. Most are lost due to not mapping to genes or due to low usage (likely noise).
Figure 3 with 4 supplements
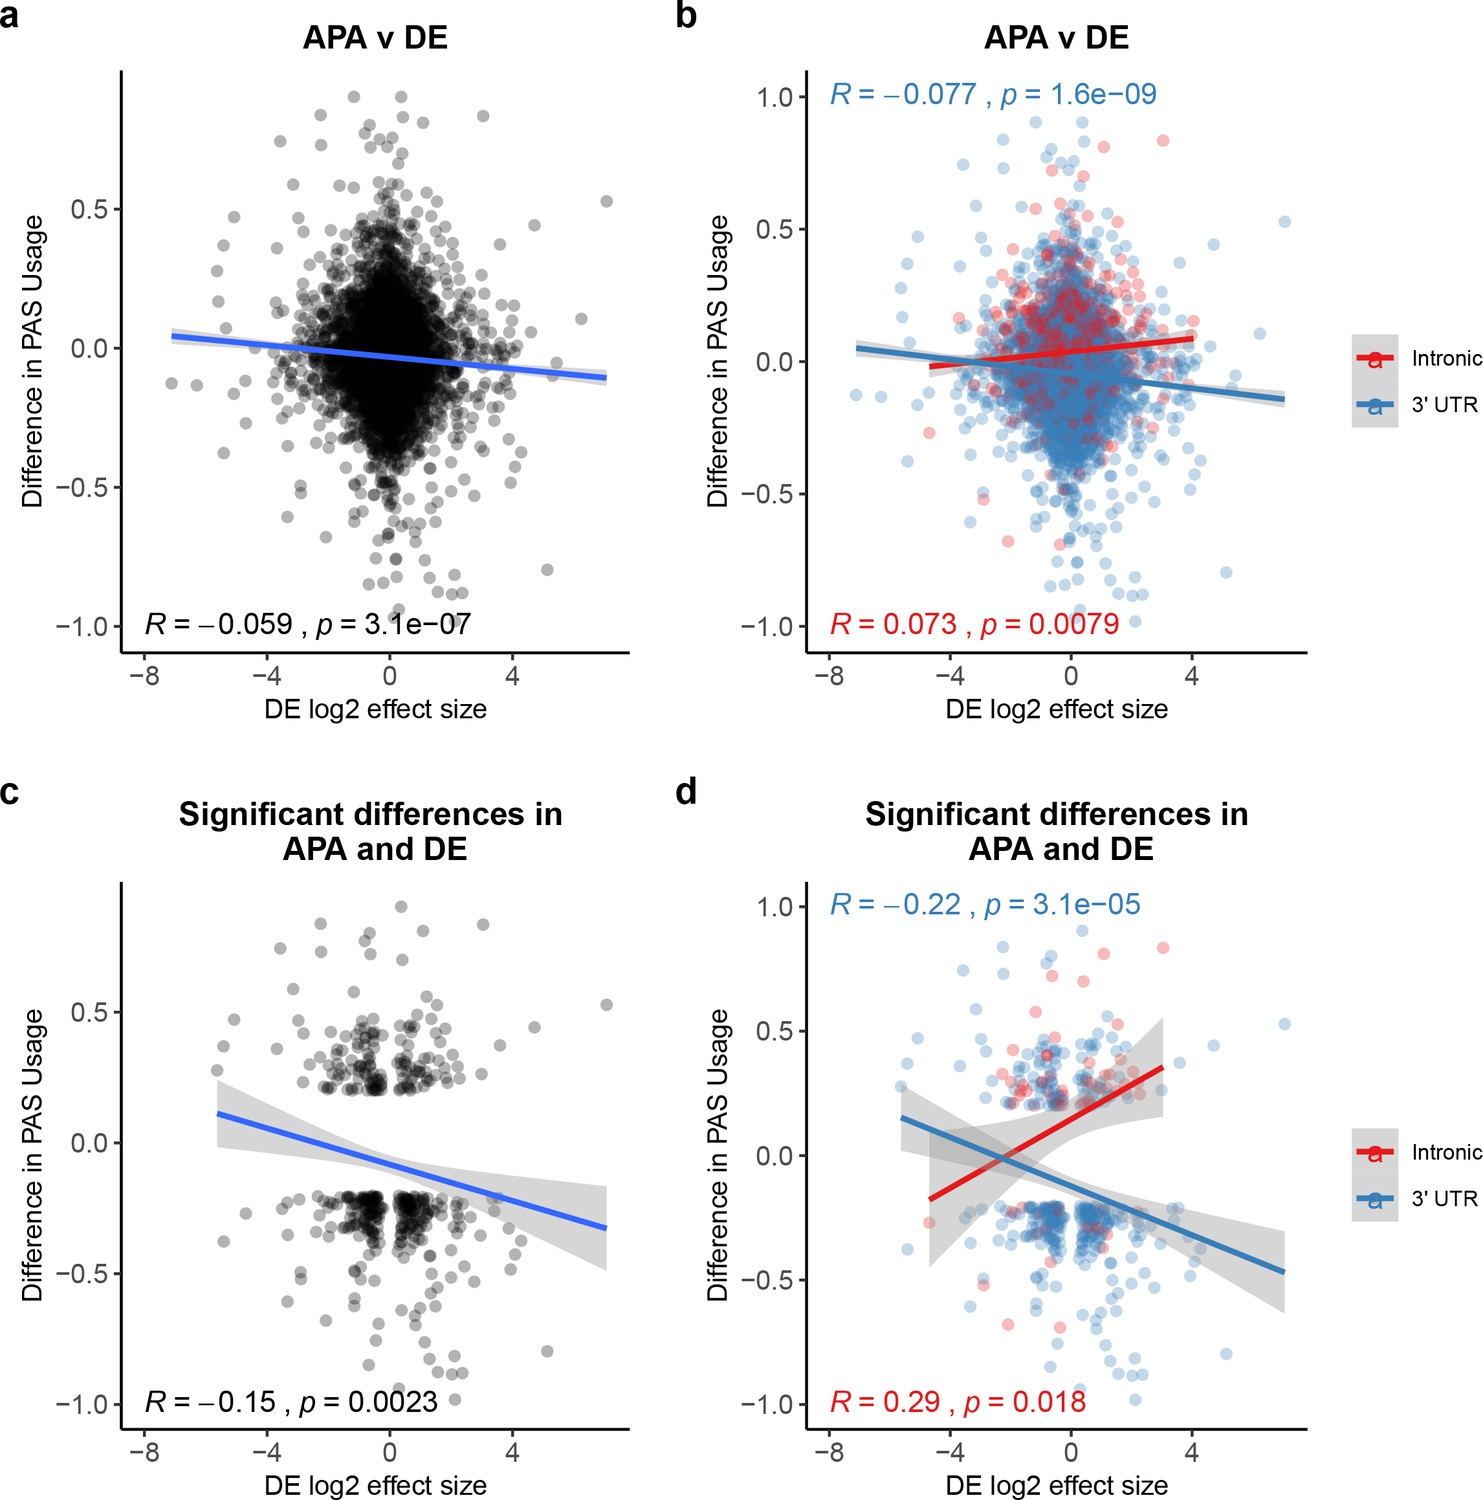
Polyadenylation sites (PAS) usage differences for intronic and 3' UTR PAS correlate with differential (DE) effect sizes at similar magnitudes but in opposite directions.
(a) Changes in polyadenylation site usage (ΔPAU) for top intronic or 3' UTR PAS per gene (see 'Materials and methods') plotted against DE effect size from differential expression analysis. Pearson’s correlation plotted, Spearman’s correlation R = −0.053. (b) ΔPAU for top intronic or 3' UTR PAS per gene (see 'Materials and methods') plotted against DE effect size from differential expression analysis for genes with significant differences in each phenotype at 5% FDR. Pearson’s correlation plotted, Spearman’s correlation intronic R = 0.046, Spearman’s correlation 3' UTR R = −0.054. (c) ΔPAU for top intronic or 3' UTR PAS per gene (see 'Materials and methods') plotted against DE effect size from differential expression analysis. Pearson’s correlation plotted, Spearman’s correlation R = −0.16. (d) ΔPAU for top intronic or 3' UTR PAS per gene (see 'Materials and methods') plotted against DE effect size from differential expression analysis for genes with significant differences in each phenotype at 5% FDR. Pearson’s correlation plotted, Spearman’s correlation intronic R = 0.22, Spearman’s correlation 3' UTR R = −0.22. In all panels, we calculated the linear regression. In all panels, negative ΔPAU and DE effect sizes represent upregulation in chimpanzees. In panels b and d, we colored the points and regressions by genic location.
Figure 3—figure supplement 1
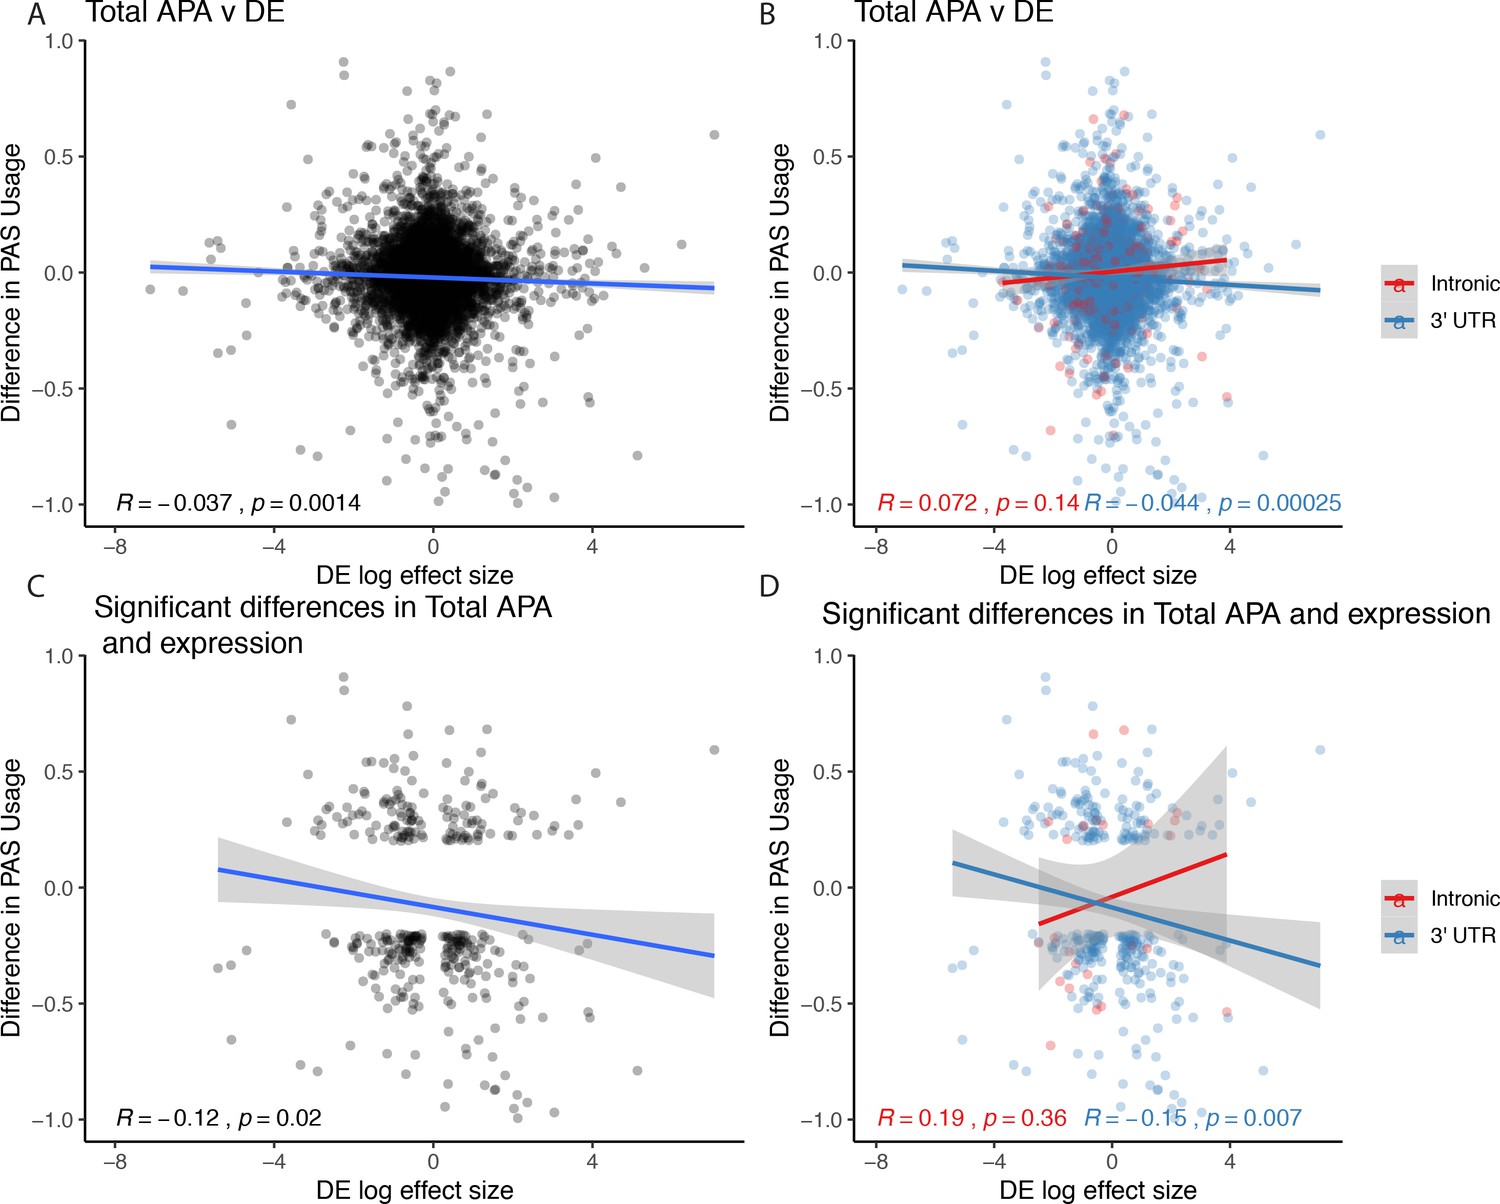
Figure 3 relationships expanded to total usage.
(A) Total mRNA changes in polyadenylation site usage (ΔPAU) for top intronic or 3' UTR polyadenylation sites (PAS) per gene plotted against differential effect size from differential expression analysis. (B) Total mRNA ΔPAU for top intronic or 3' UTR PAS per gene plotted against differential effect size from differential expression analysis for genes with significant differences in each phenotype at 5% FDR. (C) Total mRNA ΔPAU for top intronic or 3' UTR PAS per gene plotted against differential effect size from differential expression analysis. (D) Total mRNA ΔPAU for top intronic or 3' UTR PAS per gene plotted against differential effect size from differential expression analysis for genes with significant differences in each phenotype at 5% FDR. In all panels, we calculated the linear regression and Pearson's correlation with the r package ggpubr. In B and D, we colored the points and regression line by genic location. In all panels, negative ΔPAU and DE effect sizes represent upregulation in chimpanzees.
Figure 3—figure supplement 2
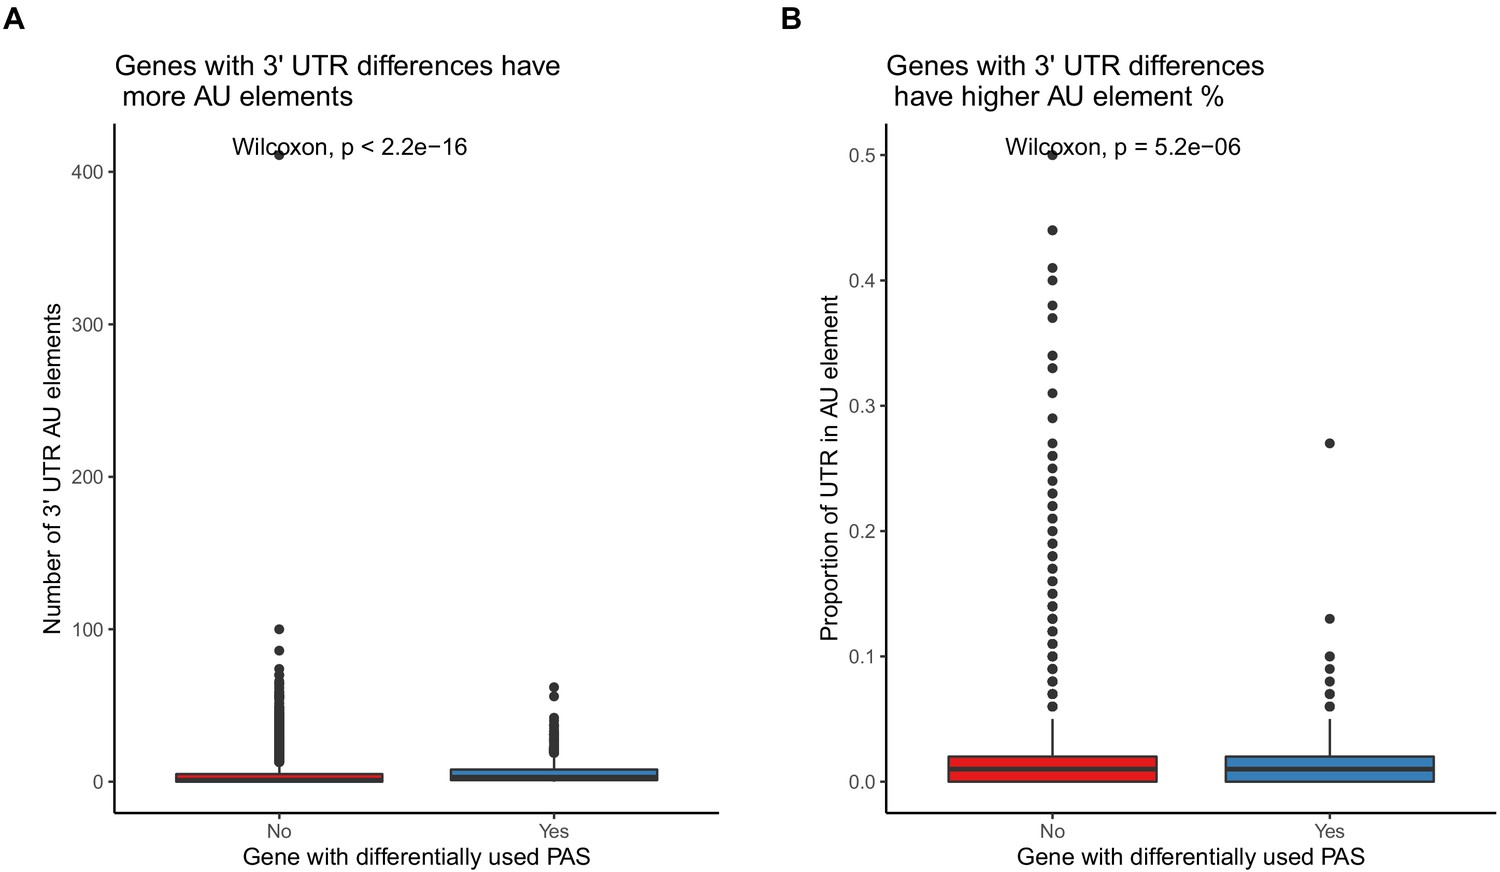
Differentially used 3' UTR polyadenylation sites (PAS) have higher AU element content.
(A) Genes with at least one differentially used 3' UTR PAS have more AU elements in their 3' UTRs. (B). Genes with at least one differentially used 3' UTR PAS have a higher proportion of their 3' UTRs covered by AU elements.
Figure 3—figure supplement 3
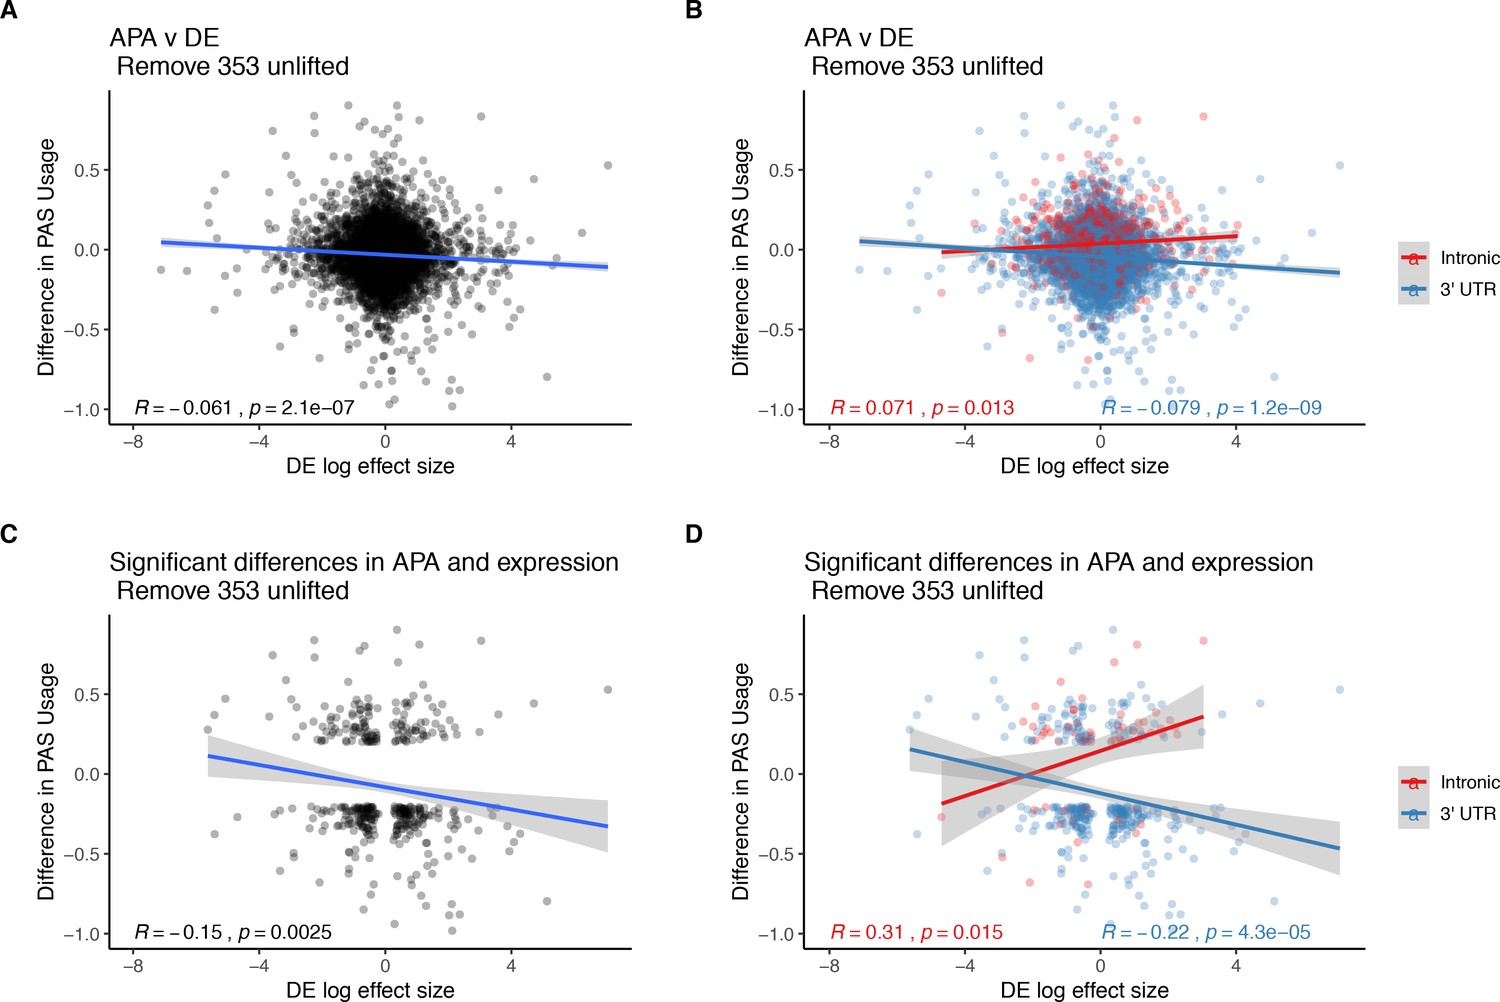
Figure 3 without genes affected by liftover.
(A) Changes in polyadenylation site usage (∆PAU) for top intronic or 3' UTR polyadenylation sites (PAS) per gene plotted against differential effect size from differential expression analysis. (B) ∆PAU for top intronic or 3' UTR PAS per gene plotted against differential effect size from differential expression analysis for genes with significant differences in each phenotype at 5% FDR. (C) ∆PAU for top intronic or 3' UTR PAS per gene plotted against differential effect size from differential expression analysis. (D) ∆PAU for top intronic or 3' UTR PAS per gene plotted against differential effect size from differential expression analysis for genes with significant differences in each phenotype at 5% FDR. In all panels, we calculated the linear regression and Pearson's correlation with the r package ggpubr. In B and D, we colored the points and regression line by genic location. In all panels, negative ∆PAU and DE effect sizes represent upregulation in chimpanzees.
Figure 3—figure supplement 4
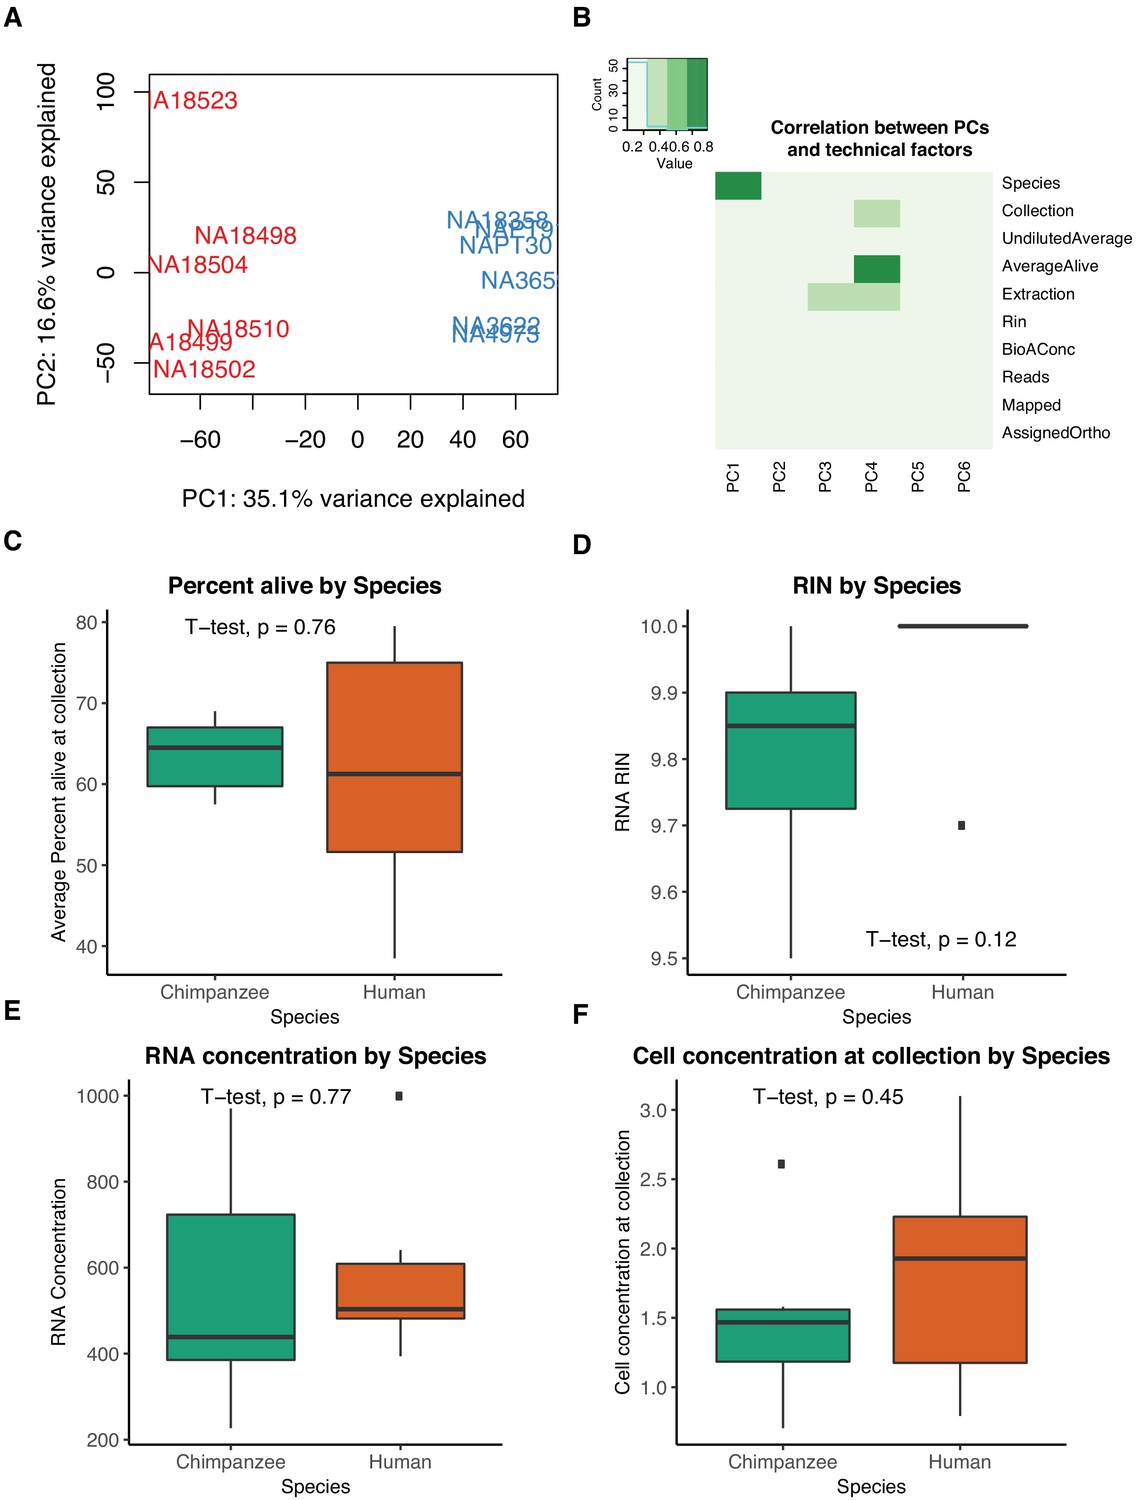
Differential expression quality control plots.
(A) First two principal components (PCs) in gene expression variation. (B) Heatmap representing correlation between technical factors and PCs. Explanation of Y axis factors and values available in Supplementary file 5. (C) Percent of live cells as calculated by trypan blue staining at collection is not confounded by species. (D) RIN scores reported by bioanalyzer at RNA-seq library generation are not confounded by species. (E) RNA concentrations reported by bioanalyzer at RNA-seq library generation are not confounded by species. (F) Cell concentrations at time of collection are not confounded by species.
Figure 4 with 1 supplement
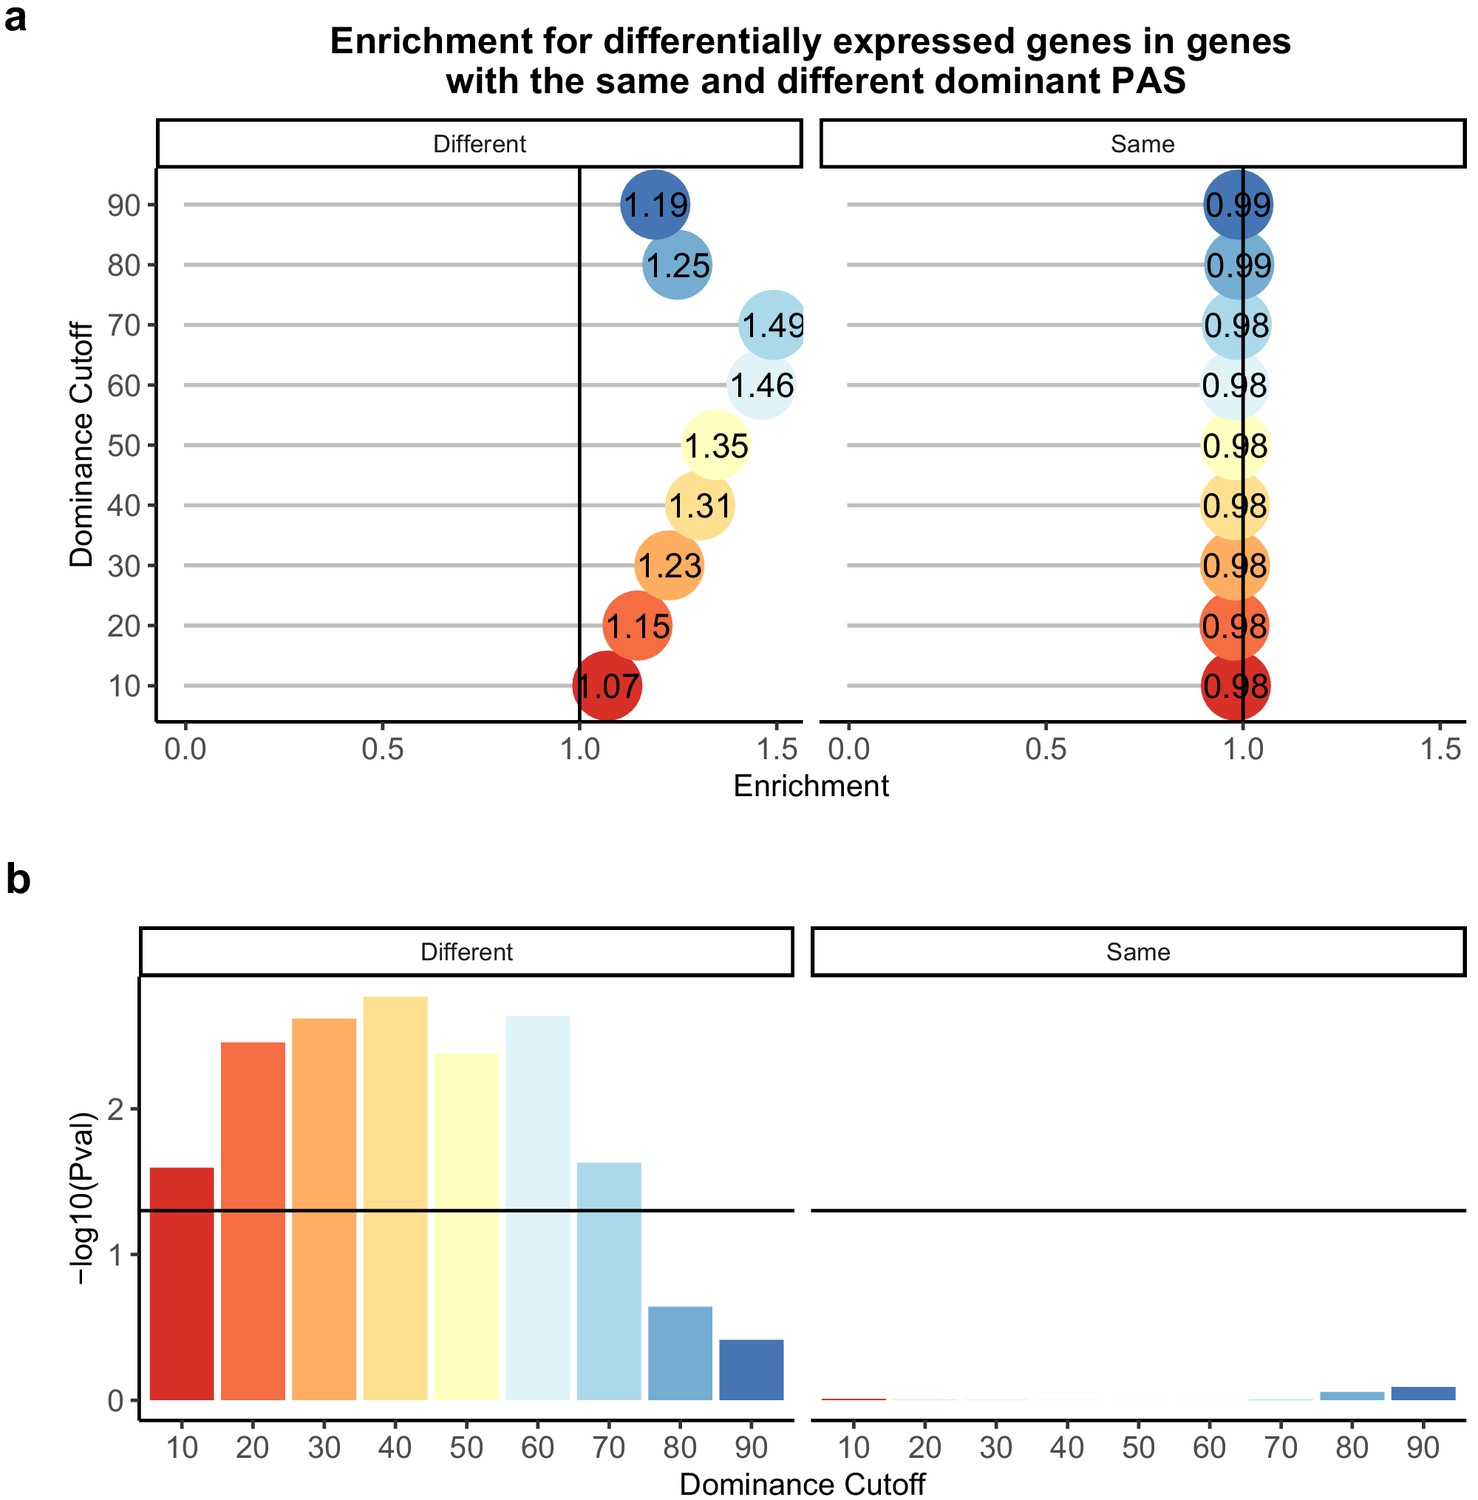
Difference in dominant polyadenylation sites (PAS) between species likely drives differences in expression.
(a) Enrichment of genes with the different (left) of same (right) dominant PAS by dominant cutoff in differentially expressed genes. (b) −log10 (p-values) for enrichments in (a) calculated with hypergeometric tests. Horizontal line represents a p-value of 0.05. The bars are colored by the dominance cutoff on the X axis.
Figure 4—figure supplement 1
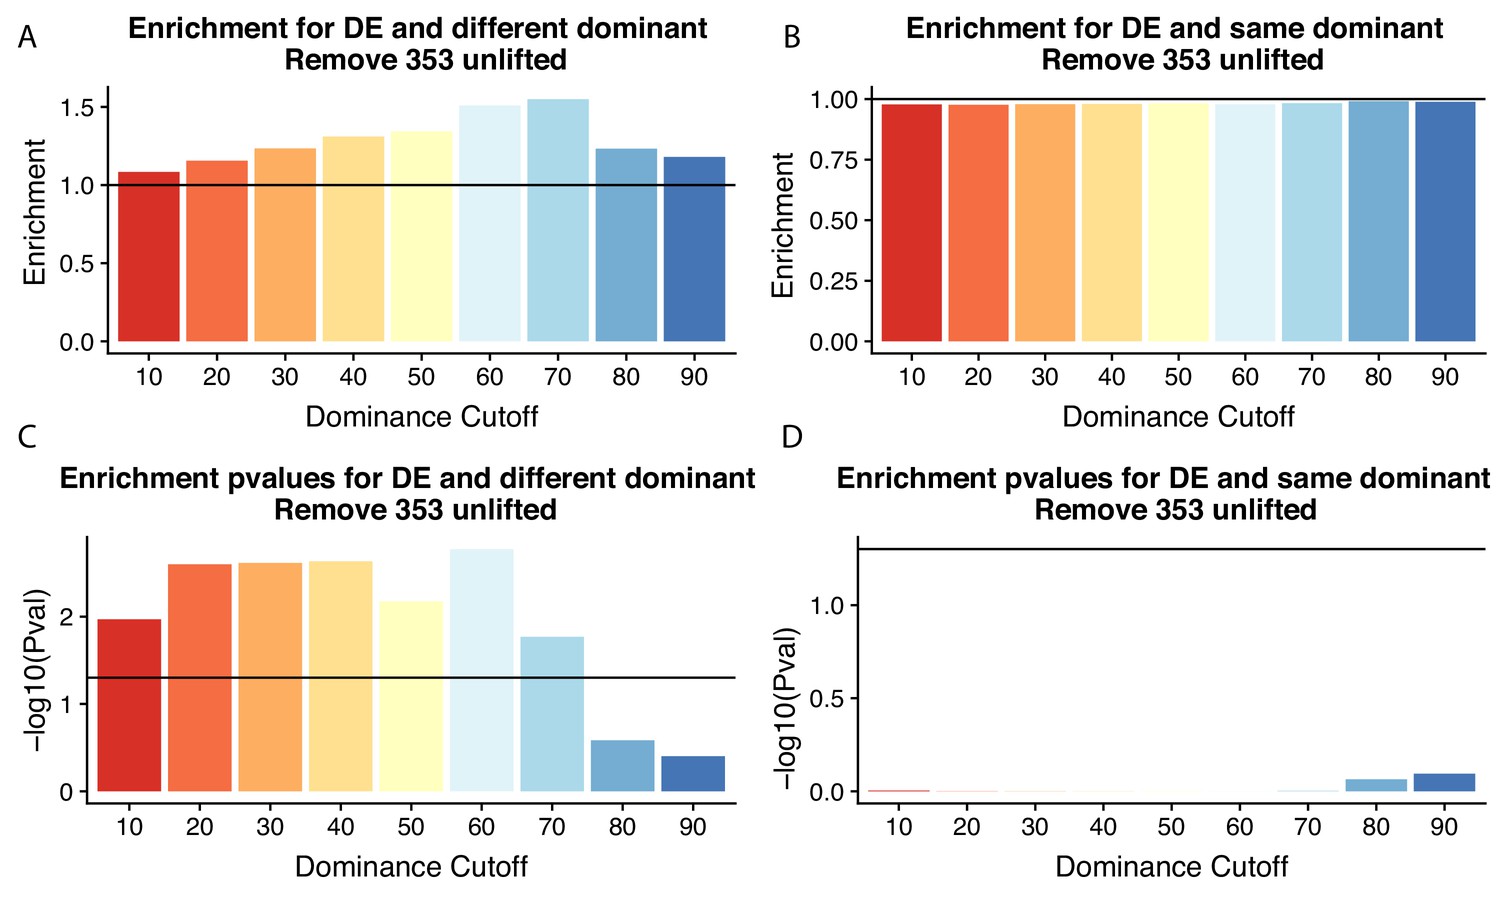
Figure 4 without genes affected by liftover.
(A) Enrichment of genes with the different (left) or same (right) dominant polyadenylation sites (PAS) by dominant cutoff in differentially expressed genes after removing genes likely affected by liftover. (B) -log10 (p-values) for enrichments in (A) calculated with hypergeometric tests. Horizontal line represents p=0.05.
Figure 5 with 4 supplements

Polyadenylation sites (PAS)-level differences in alternative polyadenylation (APA) may drive differences in expression while isoform diversity differences likely drive translation differences.
(a) Enrichment of genes with isoform-level differences (ID), differences in APA at PAS level (PAS), or at both levels (Both) within differential expressed genes and differentially translated genes. Differentially translated genes reported by Wang et al., 2018b. (b) −log10 (p-values) for enrichments in A calculated with hypergeometric tests. Horizontal line represents a p-value of 0.05.
Figure 5—figure supplement 1
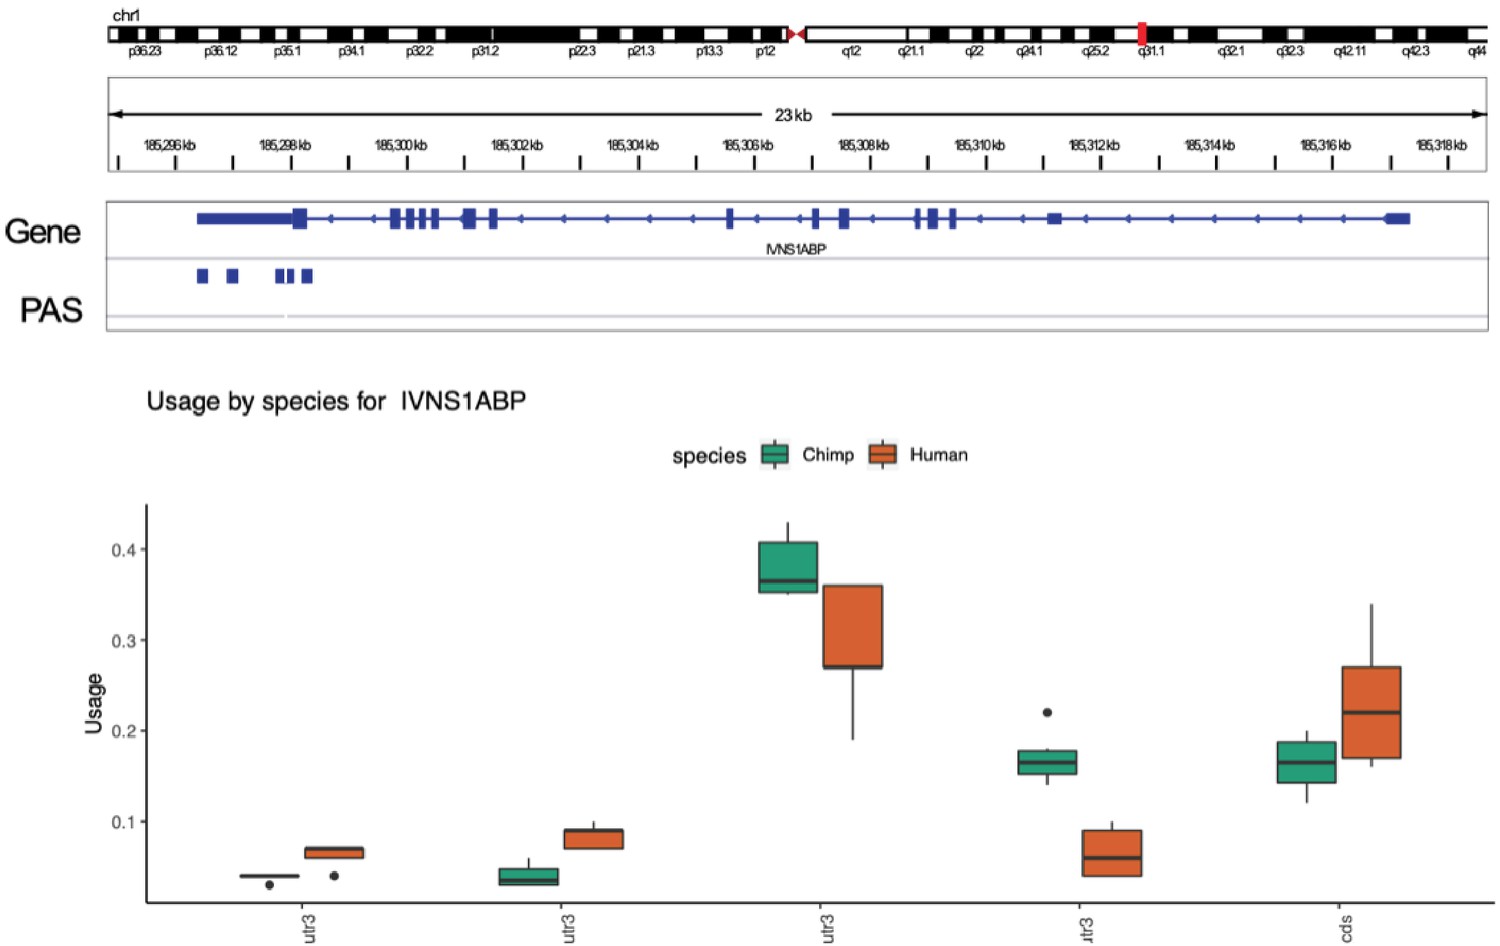
Gene with significant differences in isoform diversity only.
Human and chimpanzee usage for five polyadenylation sites (PAS) identified in the IVNS1ABP gene. None of the PAS measured have significant differences in the usage at 5% FDR. IVNS1ABP is not differentially expressed.
Figure 5—figure supplement 2
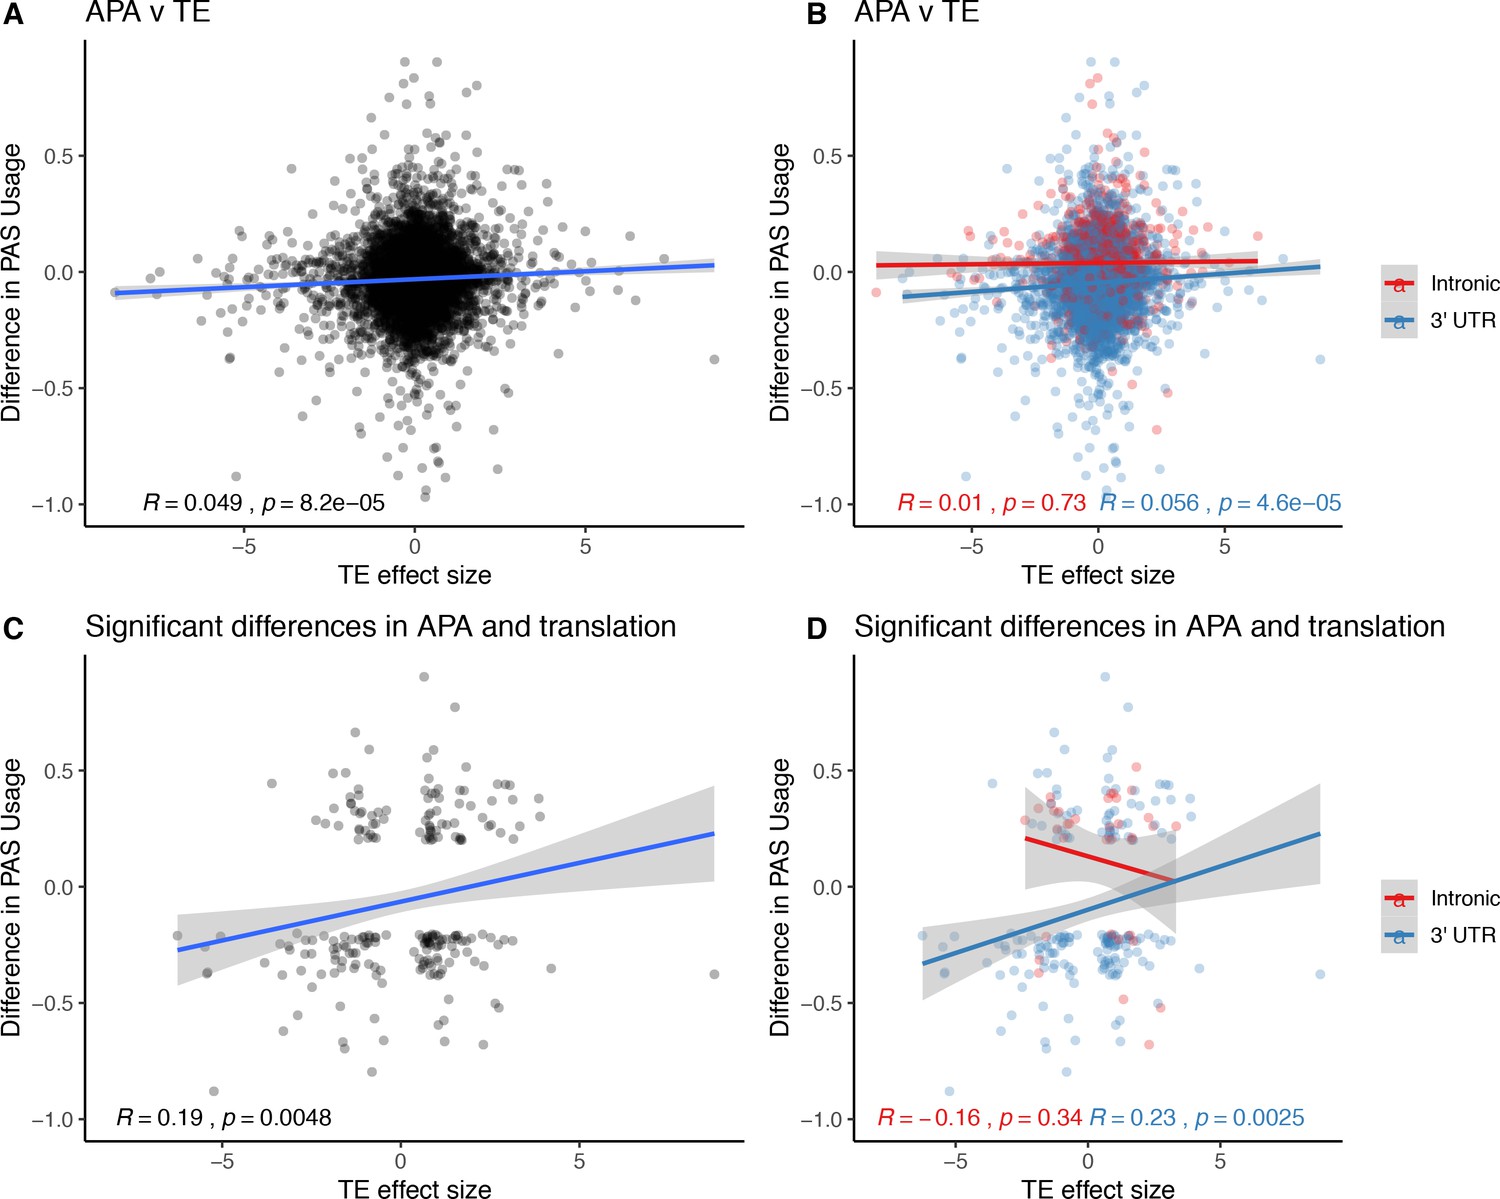
Relationship between changes in polyadenylation site usage (∆PAU) and differential translation (TE) effect sizes.
(A) ΔPAU for top 3' UTR and intronic polyadenylation sites (PAS) plotted against differential TE effect size as reported by Wang et al. ∆PAU for top 3' UTR and intronic PAS plotted against TE effect size as reported by Wang et al. separated by genic location. (C) ∆PAU for top 3' UTR and intronic PAS with significant differences in the usage plotted against TE effect size for significant genes (5% FWER) as reported by Wang et al. (D) ∆PAU for top 3' UTR and intronic PAS with significant differences in the usage plotted against TE effect size for significant genes (5% FWER) as reported by Wang et al. separated by genic location. Linear regression line was plotted and Pearson's correlation was calculated for data in each panel.
Figure 5—figure supplement 3
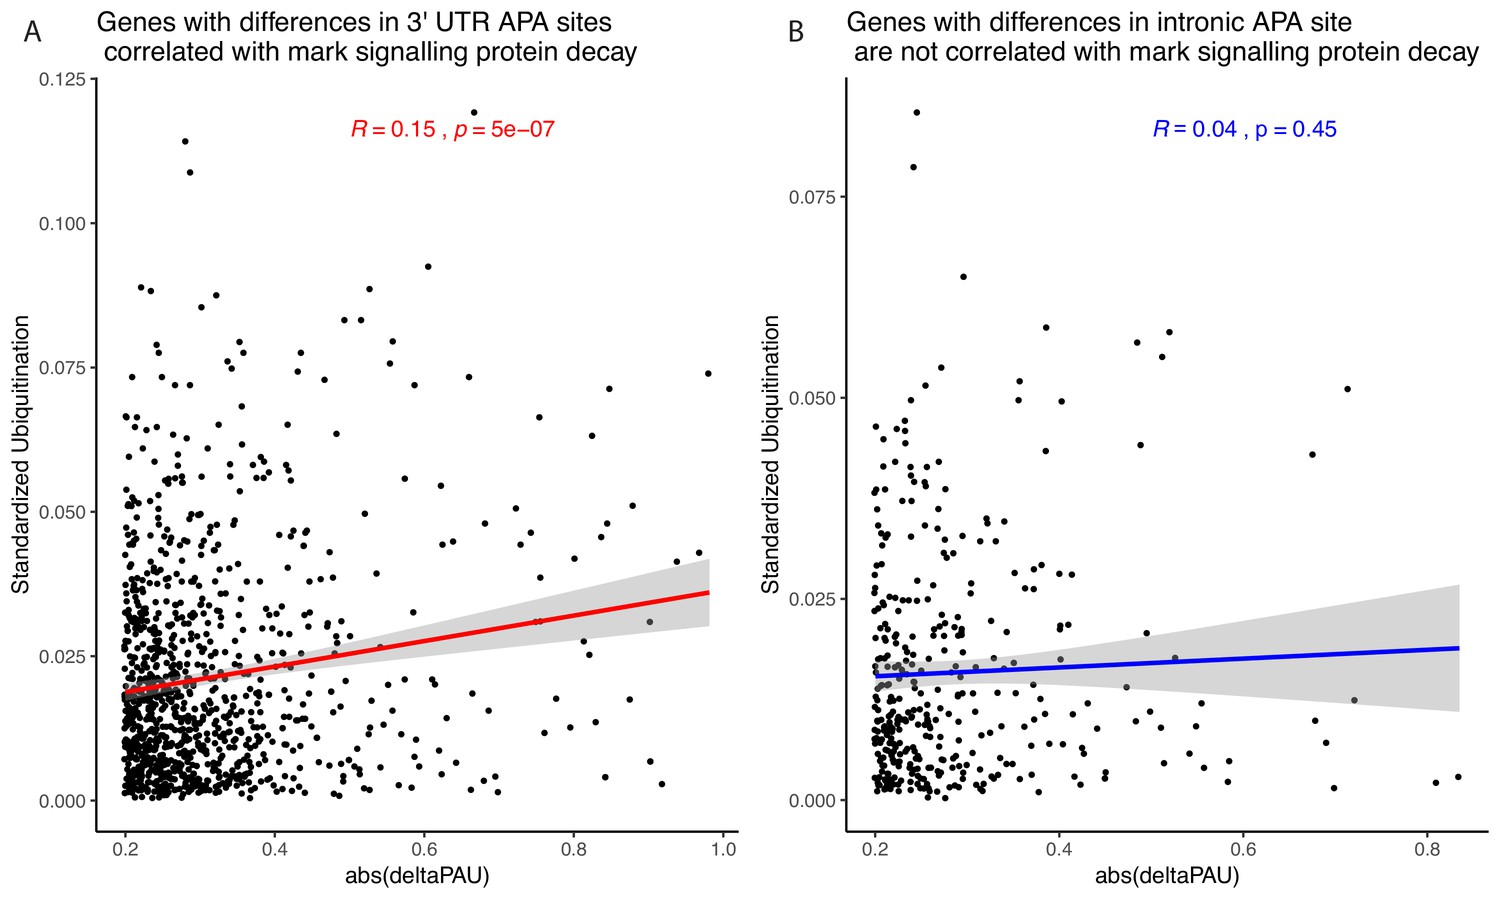
Relationship between alternative polyadenylation (APA) differences and protein decay mark.
(A) Absolute value of changes in polyadenylation site usage (∆PAU) for 3' UTR polyadenylation sites (PAS) with significant difference at site level plotted against the number of ubiquitination marks in the gene standardized by the number of amino acids. Regression line and Pearson's correlation are plotted in red. (B) Absolute value of ∆PAU for intronic PAS with significant difference at site level plotted against the number of ubiquitination marks in the gene standardized by the number of amino acids. Regression line and Pearson's correlation are plotted in blue.
Figure 5—figure supplement 4
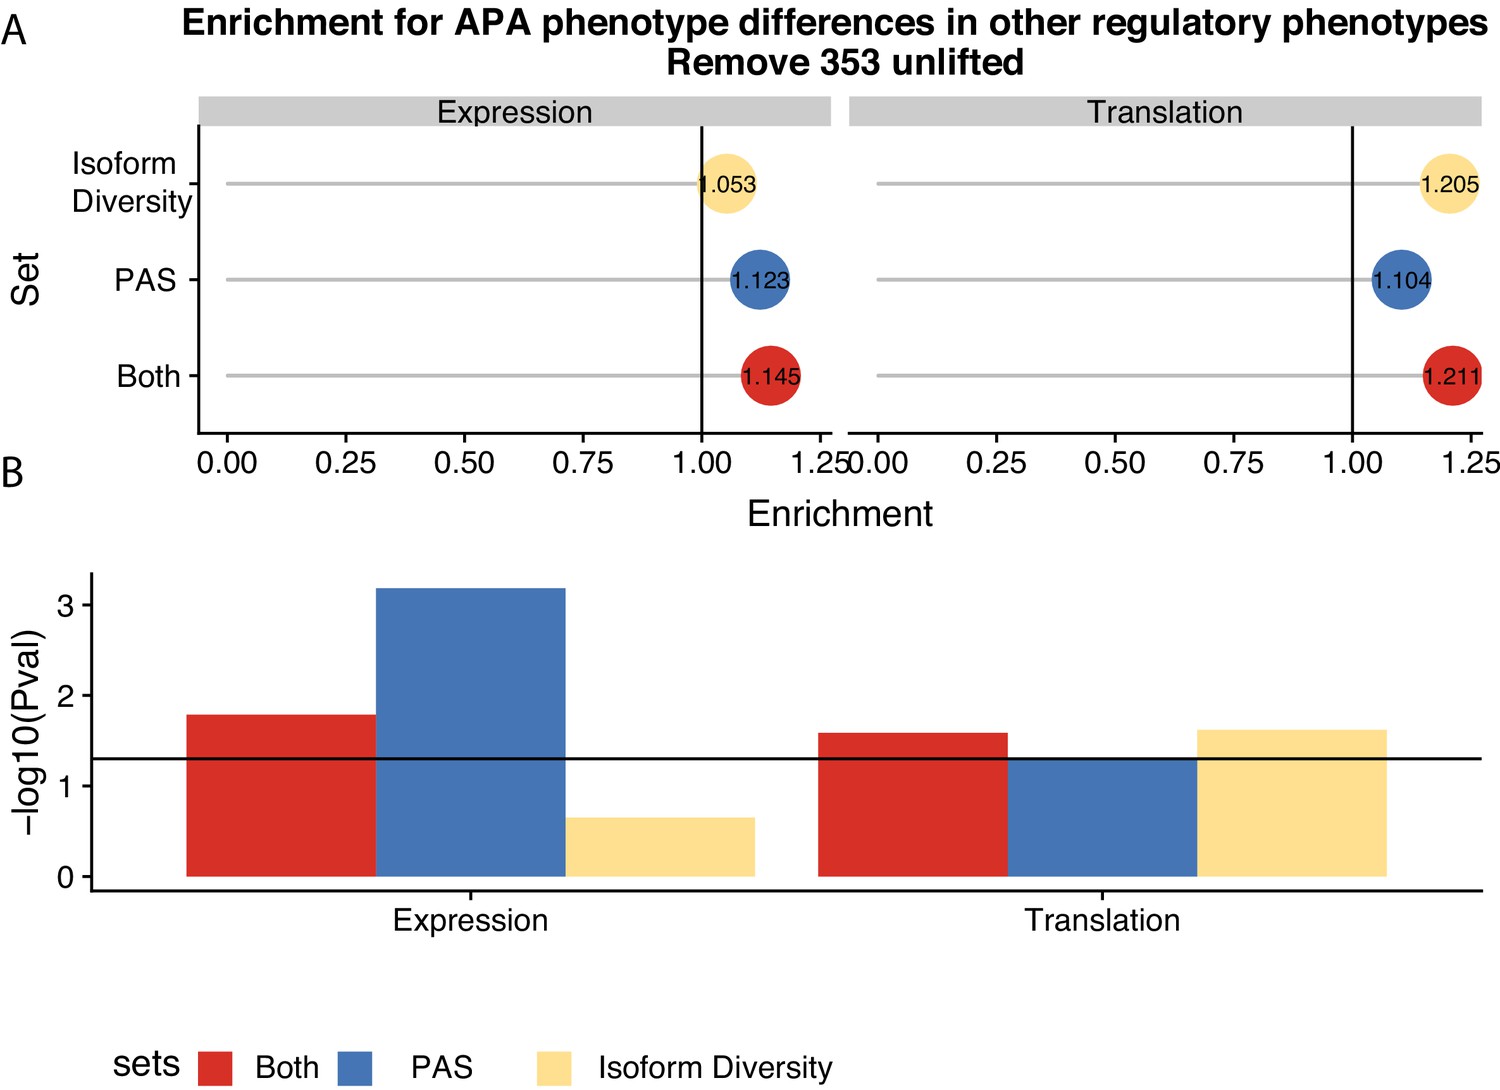
Figure 5 without genes affected by liftover.
(A) Enrichment of genes with differences in isoform diversity, polyadenylation sites (PAS) usage, or both within differentially expressed genes and differentially translated genes after removing genes likely affected by liftover. Differentially translated genes reported by Wang et al. (B) −log10 (p-values) for enrichments in A calculated with hypergeometric tests. Horizontal line represents p=0.05.
Figure 6 with 2 supplements
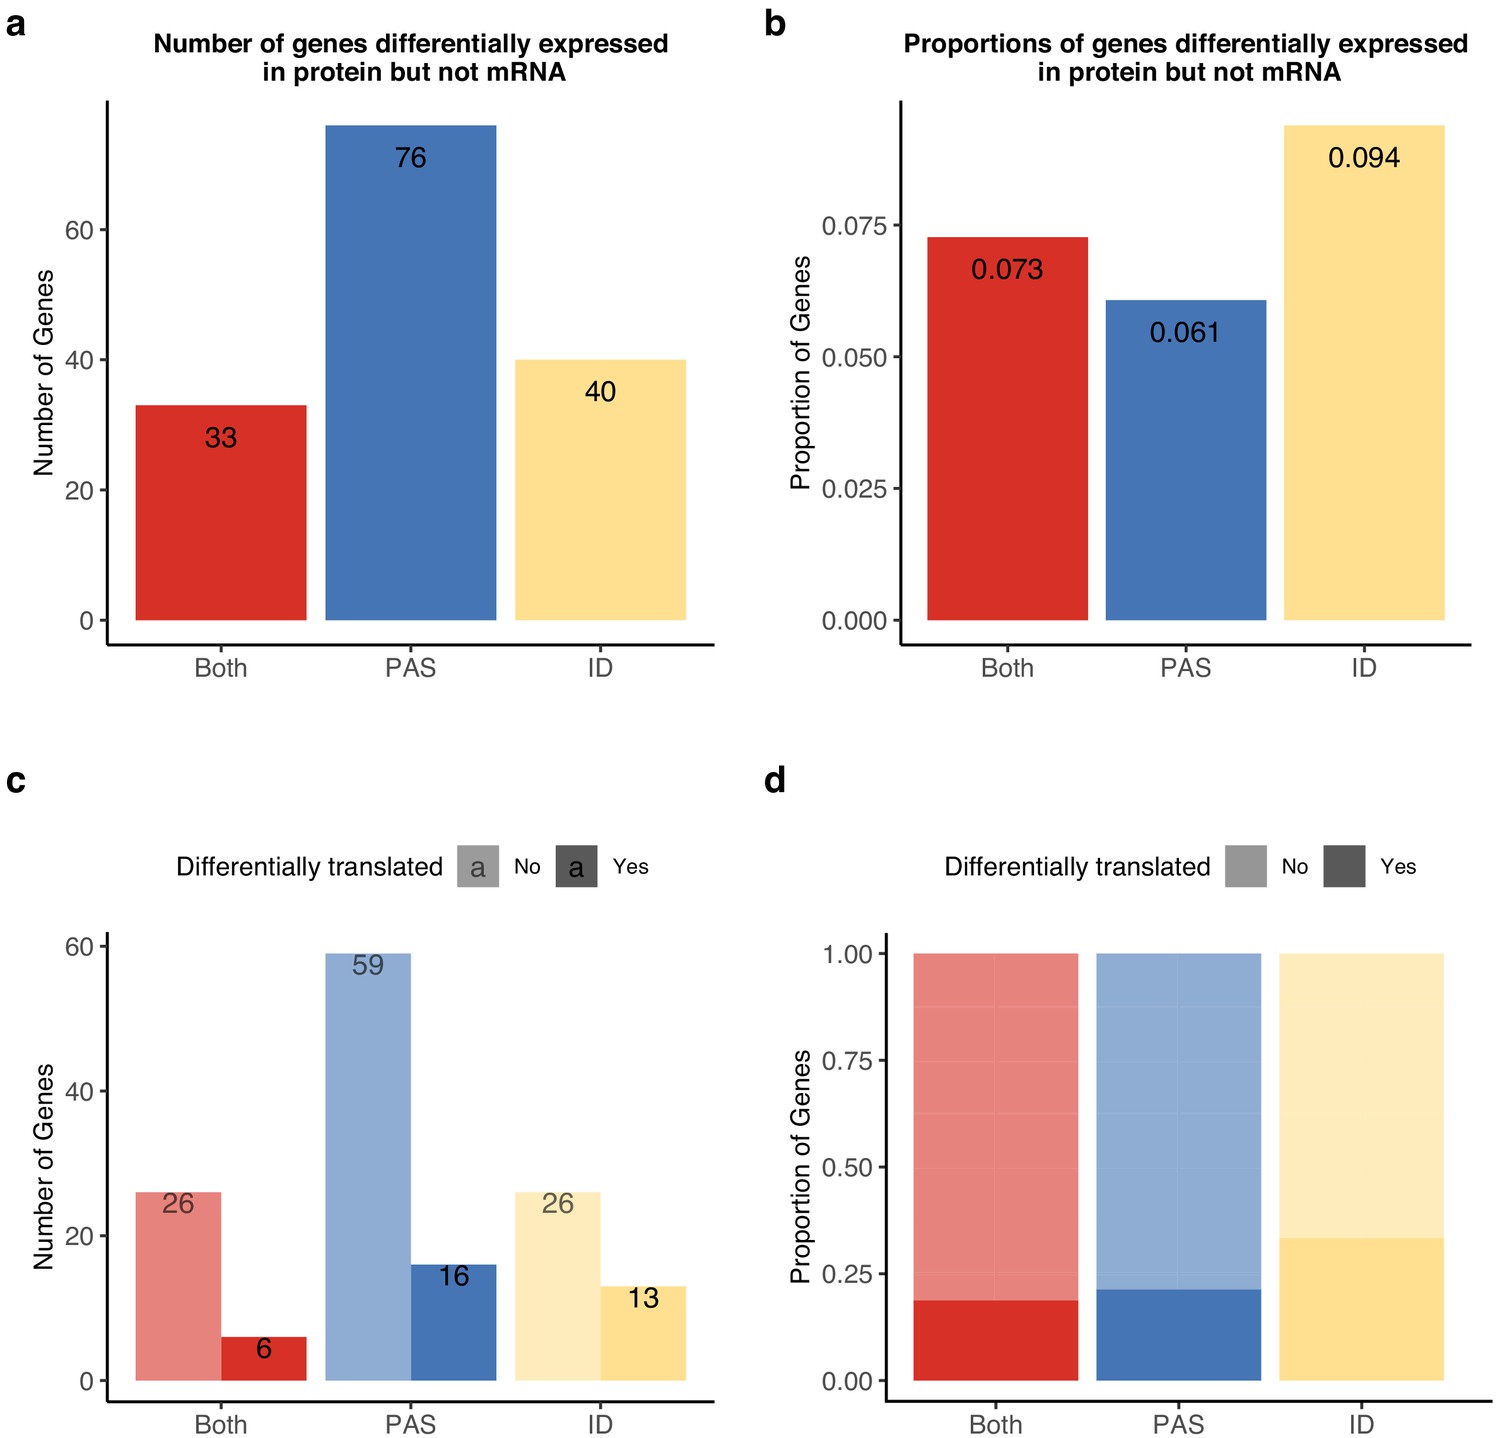
Alternative polyadenylation (APA) differences explain genes differentially expressed at protein level but not in mRNA.
APA likely mediates functional differences post-translationally. (a) Number of genes with isoform-level differences (ID), differences in APA at polyadenylation sites (PAS) level (PAS), or at both levels (Both) differentially expressed in protein (5% FDR) but not mRNA (5% FDR). Genes with differentially expressed protein reported in Khan et al., 2013. (b) Proportion of genes with differential usage at PAS level (1251 genes), isoform diversity level (426 genes), or both (454 genes) differentially expressed in protein (5% FDR) but not mRNA (5% FDR). (c) Genes reported in (a) separated by genes differentially translated at 5% FDR. Differentially translated genes reported in Wang et al., 2018b. (d) Genes differentially expressed in protein but not in mRNA, colored by differences in APA. Proportion of genes in the set differentially translated at 5% FDR.
Figure 6—figure supplement 1
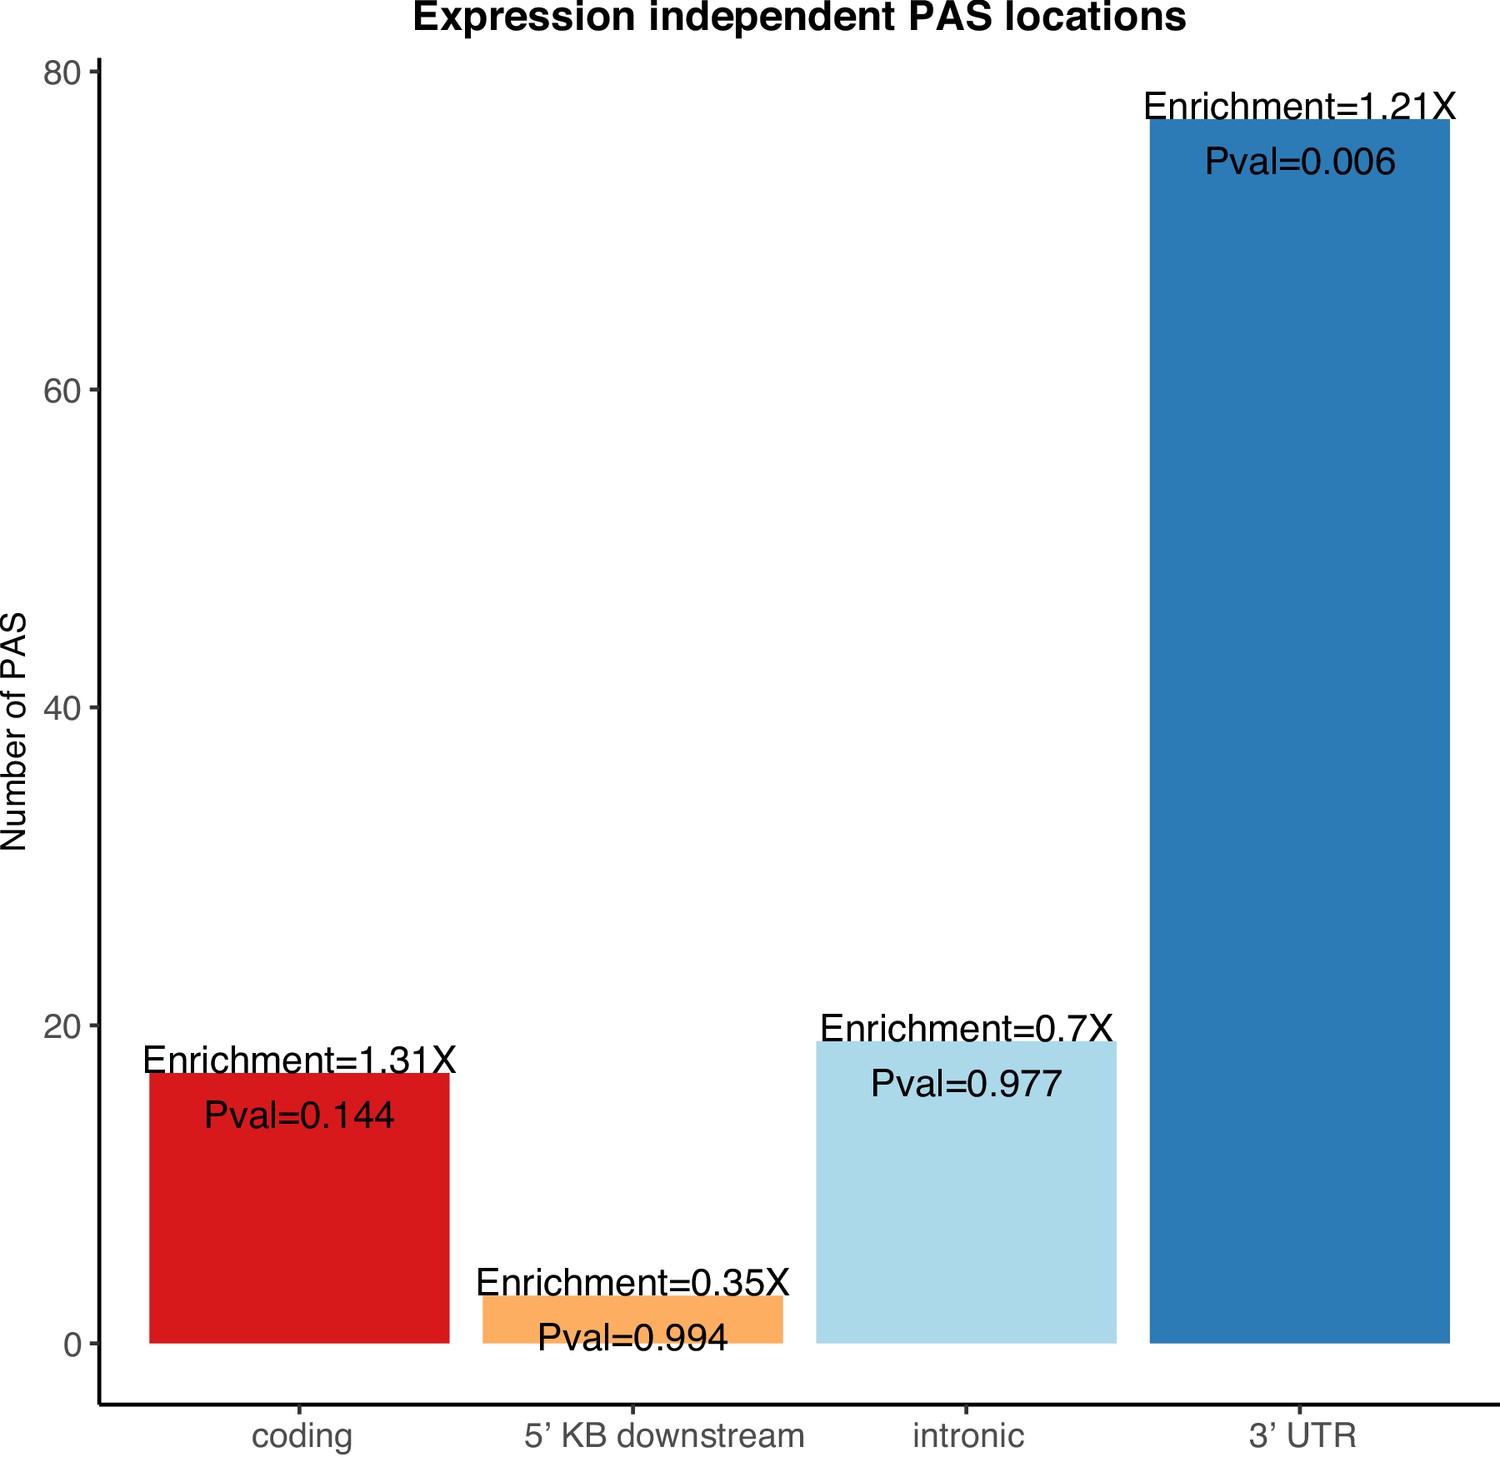
Enrichment of 3' UTR polyadenylation sites (PAS) in genes differentially expressed in protein but not in mRNA.
Genic location enrichments for the PAS in genes differentially expressed at protein level but not mRNA level among all differentially used PAS. p-values were calculated with a hypergeometric test.
Figure 6—figure supplement 2
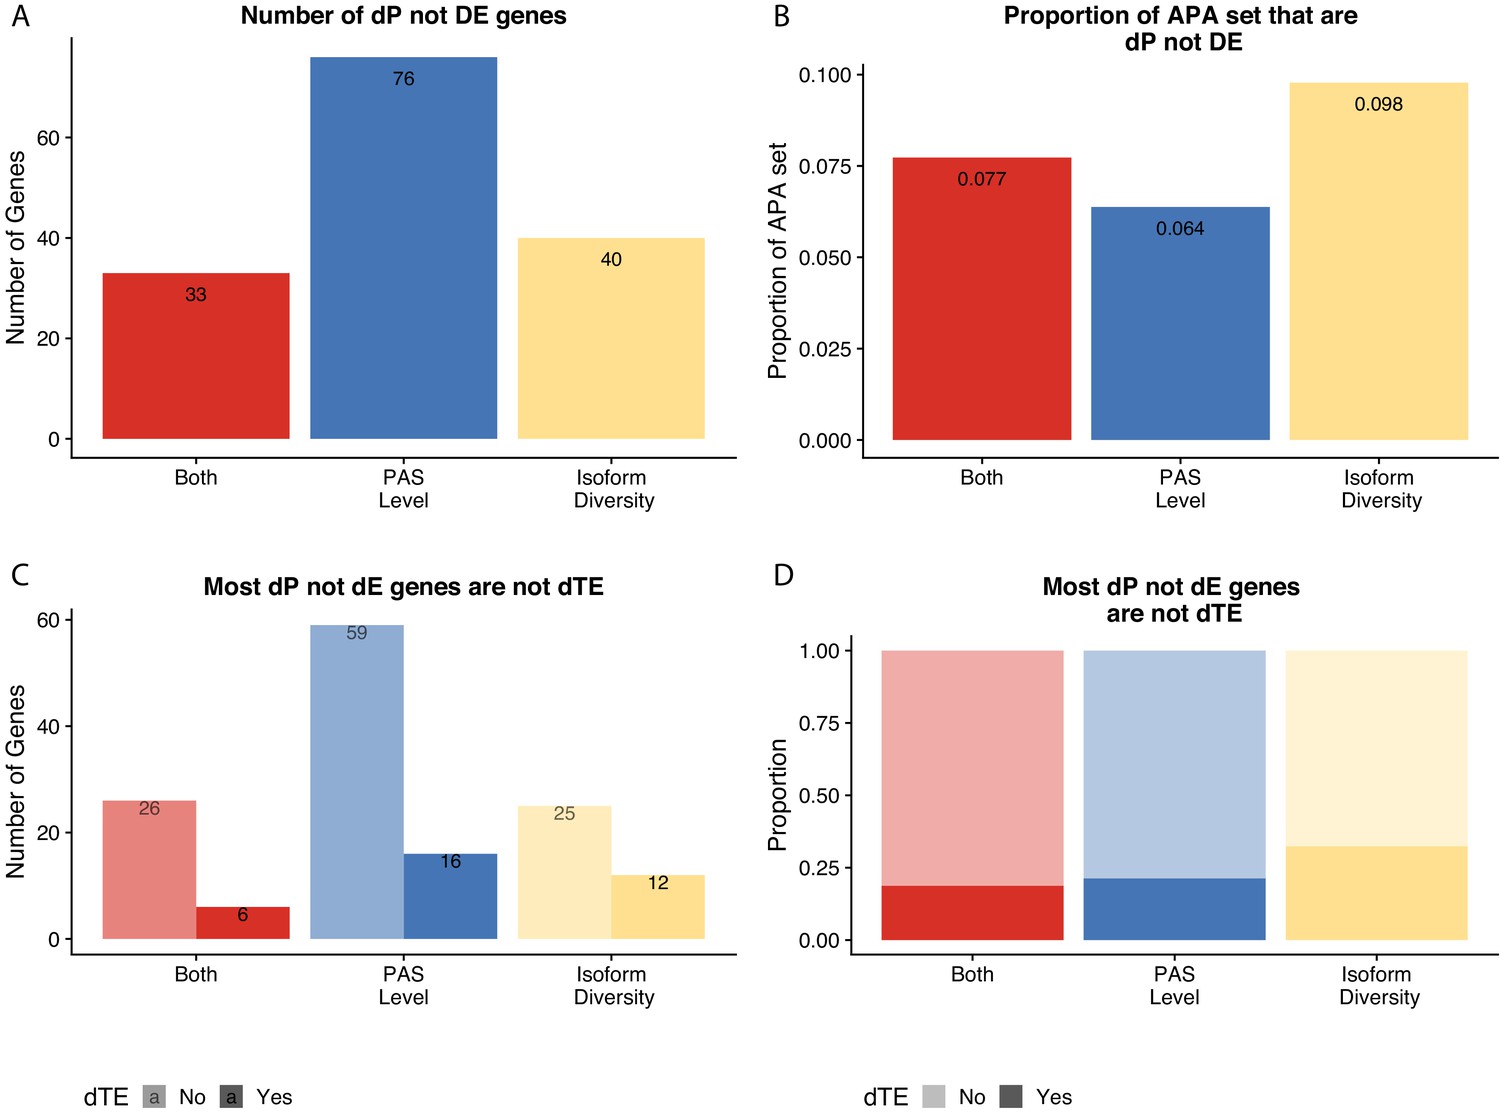
Figure 6 without genes affected by liftover.
(A) Number of genes with differences in isoform diversity, polyadenylation sites (PAS) usage, or both differentially expressed in protein (5% FDR) but not in mRNA (5% FDR). Genes differentially expressed in protein from Khan et al. (B) Proportion of genes with differential isoform diversity, PAS usage, or both that are differentially expressed in protein (5% FDR) but not mRNA (5% FDR). (C) Genes reported in (A), separated by genes differentially translated at 5% FDR. Differentially translated gene reported in Wang et al. (D) Genes differentially expressed in protein but not in mRNA, colored by differences in APA. Proportion of genes in the set differentially translated at 5% FDR.
Author response image 1
Additional files
-
Supplementary file 1
Gene ontology (GO) enrichment results.
Regulatory processes, components, and functions identified through GOrilla as enriched at 5% FDR. Table includes the species-specific PAS genes (species-specific PAS), genes differentially translated with at least one differentially used PAS (TranslationandAPA), and the genes differentially expressed in protein but not mRNA that also have at least one differentially used PAS (APA and protein, no expression difference). GO term, description, p-value, and FDR q-value from GOrilla.
- https://cdn.elifesciences.org/articles/62548/elife-62548-supp1-v2.txt
-
Supplementary file 2
Polyadenylation sites (PAS) differential usage results.
Column names as described – PAS: polyadenylation site, gene: gene (cluster in leafcutter), PAS_logeffectsize: log effect size for differential usage of the PAS between human and chimpanzee, PAS_deltaPAU: difference in polyadenylation site usage between human and chimpanzee (delta PSI in leafcutter), Gene_logLR: log likelihood ratio for differential usage of any PAS in the gene (cluster likelihood ratio in leafcutter), Gene_adjustedP-value: adjusted p-value for differential usage of the any PAS in the gene (cluster p-value in leafcutter).
- https://cdn.elifesciences.org/articles/62548/elife-62548-supp2-v2.txt
-
Supplementary file 3
Fast Gene Set Enrichment Analysis (FGSEA) results for enrichment genes differentially expressed with at least one differentially used polyadenylation sites (PAS).
FGSEA results using the C5: ontology gene set from the MSigDB collection. Pathway from C5 set, p-value adjusted for multiple testing, normalized enrichment score from FGSEA, and number of genes in the pathway.
- https://cdn.elifesciences.org/articles/62548/elife-62548-supp3-v2.txt
-
Supplementary file 4
3' Sequencing metadata.
Column names as described – Species: Cell line species, Lines: Cell line ID, Fraction: Cellular fraction, CollectionDate: Date of cell harvest and nuclear isolation, Extraction_date: Date of RNA extraction, Collection_person: Author initial for who processed cell harvest and nuclear isolation, UndilutedAverage: Average of two cell count measurements 1 × 10⁶, AverageAlive: Average of two cell live dead counts – calculated with trypan blue stain, Concentration: Extracted RNA concentration (ng/mL), RIN: RIN score for extracted RNA, 260.280.Ratio: 260/280 ratio calculated on nanodrop, Library: 3' Seq library date, Reads: Number of sequenced reads, Mapped_wMP: Number of Mapped reads before removing reads likely due to misprimming, Mapped_Clean: Number of Mapped reads after removing reads likely due to misprimming.
- https://cdn.elifesciences.org/articles/62548/elife-62548-supp4-v2.txt
-
Supplementary file 5
Metadata for RNA-sequencing data.
Column names as described – Species: Cell line species, Lines: Cell line ID, Collection_person: Author initial for who processed cell harvest and nuclear isolation, UndilutedAverage: Average of two cell count measurements 1 × 10⁶, AverageAlive: Average of two cell live dead counts – calculated with trypan blue stain, CollectionDate: Date of cell harvest and nuclear isolation, Extraction: Date of RNA extraction, RIN: RIN score for extracted RNA, BioAConc: RNA concentration (ng/µL), Reads: Number of Sequenced reads, Mapped: Number of mapped reads, AssignedOrtho: Number of mapped reads assigned to orthologous exons.
- https://cdn.elifesciences.org/articles/62548/elife-62548-supp5-v2.txt
-
Supplementary file 6
Differential expression results.
Column names as described – Differential expression results from limma. gene: tested gene, logFC: log twofold change in normalized gene expression, adj.P.Val: BH adjusted p-value from t test, B: Beta value, t: t statistic.
- https://cdn.elifesciences.org/articles/62548/elife-62548-supp6-v2.txt
-
Transparent reporting form
- https://cdn.elifesciences.org/articles/62548/elife-62548-transrepform-v2.docx
Download links
A two-part list of links to download the article, or parts of the article, in various formats.
Downloads (link to download the article as PDF)
Open citations (links to open the citations from this article in various online reference manager services)
Cite this article (links to download the citations from this article in formats compatible with various reference manager tools)
Divergence in alternative polyadenylation contributes to gene regulatory differences between humans and chimpanzees
eLife 10:e62548.
https://doi.org/10.7554/eLife.62548


