Slowly evolving dopaminergic activity modulates the moment-to-moment probability of reward-related self-timed movements
- Department of Neurobiology, Harvard Medical School, United States
- State Key Laboratory of Membrane Biology, Peking University School of Life Science, China
- Istituto Italiano di Tecnologia, Italy
Figures
Figure 1 with 2 supplements
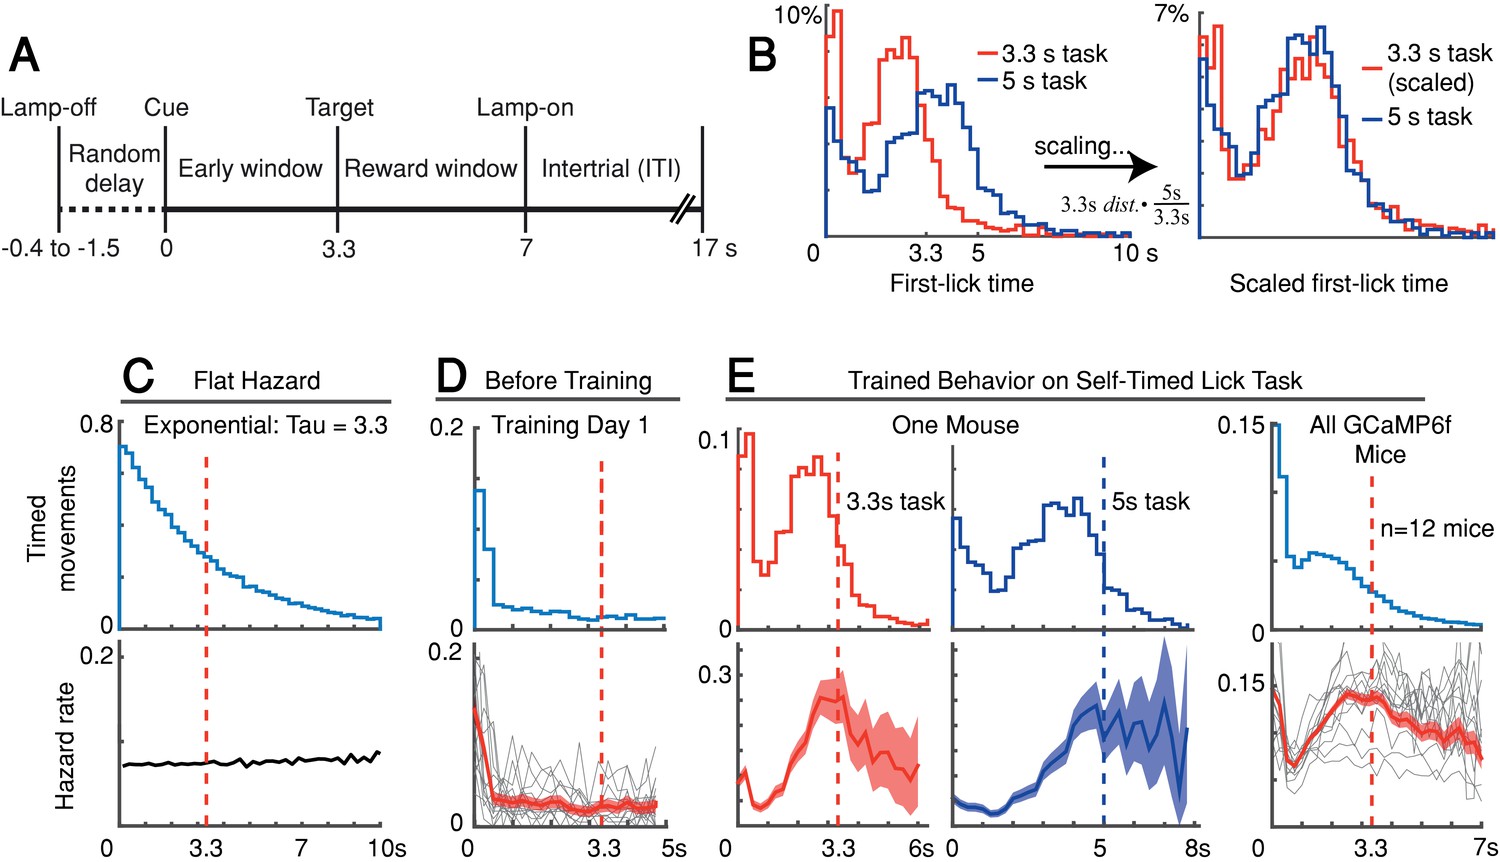
Self-timed movement task.
(A) Task schematic (3.3 s version shown). (B) First-lick timing distributions generated by the same mouse exhibit the scalar property of timing (Weber’s Law). Red: 3.3 s target time (four sessions); Blue: 5 s target time (four sessions). For all mice, see Figure 1—figure supplement 1B. (C–E) Hazard-function analysis. Time = 0 is the start-timing cue; dashed vertical lines are target times. (C) Uniform instantaneous probability of movement over time is equivalent to a flat hazard rate (bottom) and produces an exponential first-lick timing distribution (top). (D) Before Training: First day of exposure to the self-timed movement task. Top: average first-lick timing distribution across mice; bottom: corresponding hazard functions. Gray traces: single session data. Red traces: average among all sessions, with shading indicating 95% confidence interval produced by 10,000x bootstrap procedure. (E) Trained Behavior: Hazard functions (bottom) computed from the first-lick timing distributions for the 3.3 s- and 5 s tasks (top) reveal peaks at the target times. Right: average first-lick timing distribution and hazard functions for all 12 GCaMP6f photometry animals. Source data: Figure 1—source data 1.
-
Figure 1—source data 1
Self-timed movement task behavioral data.
- https://cdn.elifesciences.org/articles/62583/elife-62583-fig1-data1-v3.zip
Figure 1—figure supplement 1
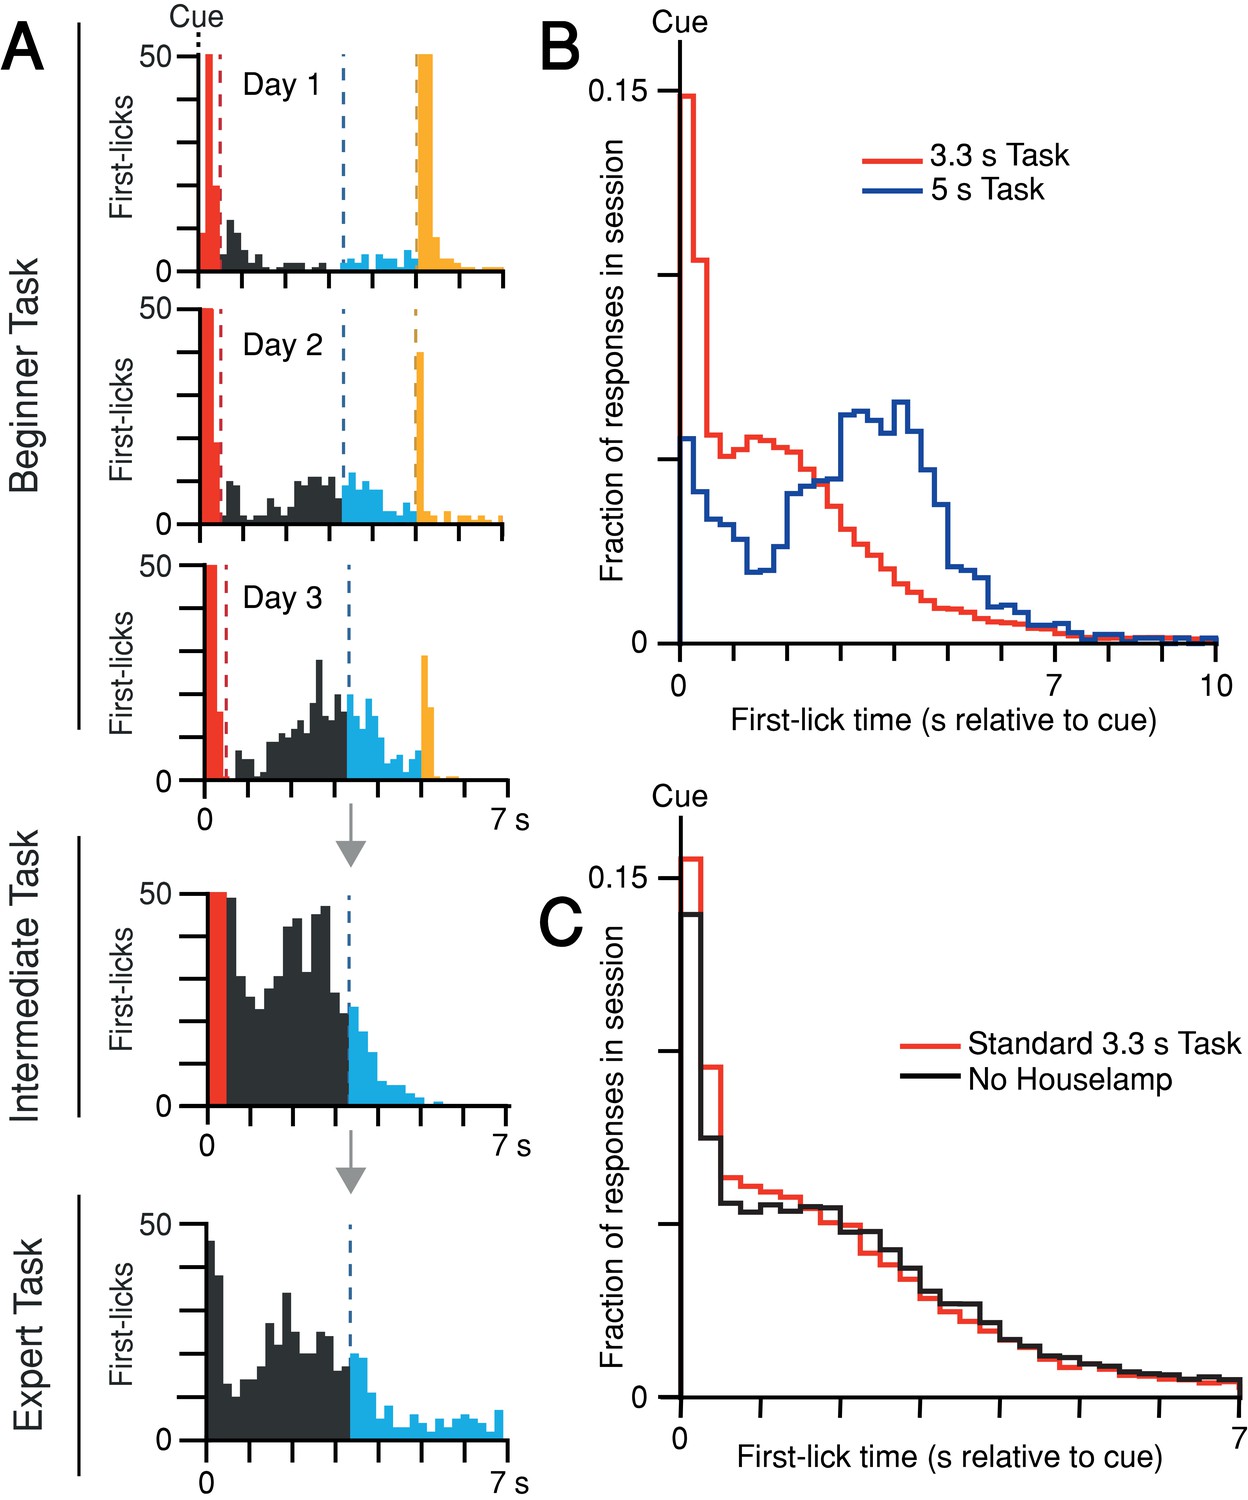
Self-timed movement task learning and variations.
(A) Task learning. Histogram of first-lick times from single sessions at different stages of training (red: reaction, gray: early, blue: operant-rewarded, yellow: Pavlovian-rewarded). Bars >50 first-licks truncated for clarity. (B) Mice adjust behavior to the timing-contingencies of the task. First-lick time distributions from tasks with different target timing intervals. Red: 3.3 s reward-boundary. Blue: 5 s reward-boundary (all sessions, all mice). (C) Mice time their first-licks relative to the start cue, not the houselamp. First-lick time distributions during behavior with (red) and without (black) houselamp events (4 mice, 4–5 sessions/mouse on each version of the task). Source data: Figure 1—source data 1.
Figure 1—figure supplement 2
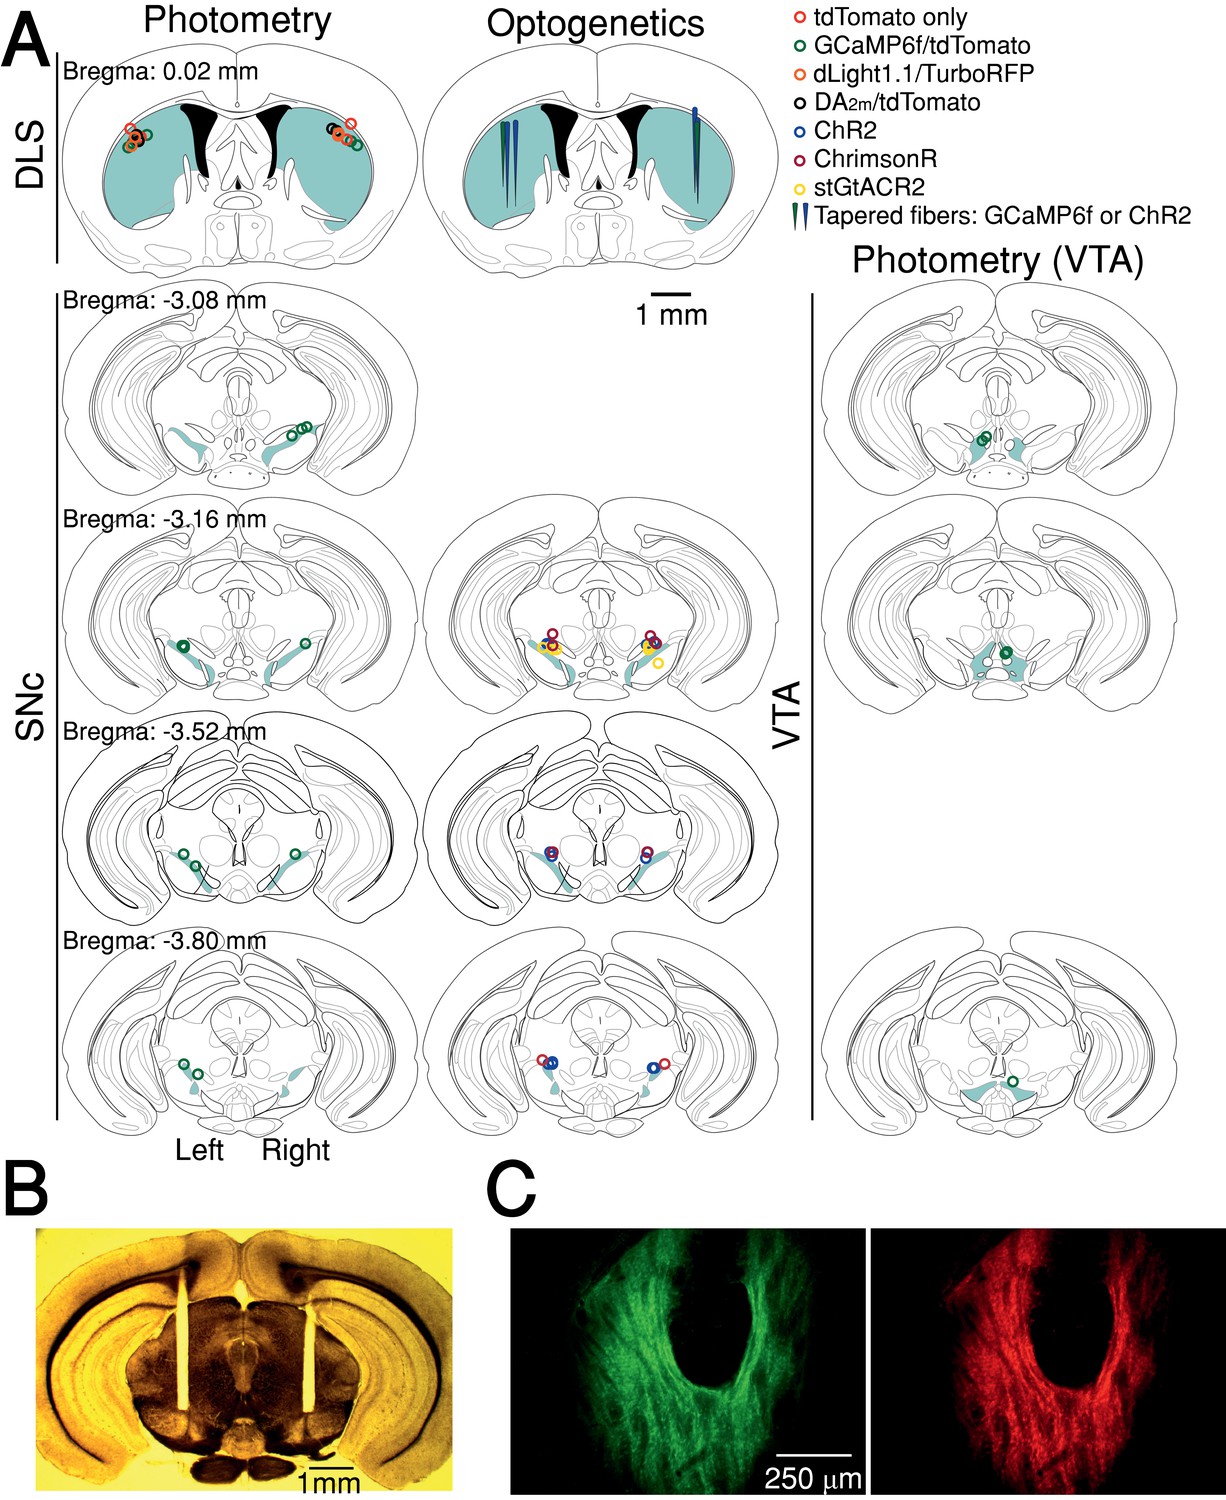
Fiber optic placement and histology.
(A) Approximate fiber positions for all mice. (B) Brightfield microscopy with polarized filter on a freshly cut brain slice showing bilateral fiber placement at SNc (from stGtACR2 experiment). (C) Example of co-expression of green (DA2m,) and red (tdTomato) fluorophores relative to fiber optic tip.
Figure 2 with 3 supplements

SNc DAN signals preceding self-timed movement.
(A) Left: surgical strategy for GCaMP6f/tdTomato fiber photometry. Right: average SNc DAN GCaMP6f response for first-licks between 3 and 3.25 s (12 mice). Data aligned separately to both cue-onset (left) and first-lick (right), with the break in the time axis indicating the change in plot alignment. (B) Average SNc DAN GCaMP6f responses for different first-lick times (indicated by dashed vertical lines). (C) Comparison of average DAN GCaMP6f and tdTomato responses on expanded vertical scale. Traces plotted up to 150 ms before first-lick. See also Figure 2—figure supplements 1–3. Figure 2—source data 1.
-
Figure 2—source data 1
SNc DAN signals during self-timing.
- https://cdn.elifesciences.org/articles/62583/elife-62583-fig2-data1-v3.zip
-
Figure 2—source data 2
Baseline SNc DAN signals.
- https://cdn.elifesciences.org/articles/62583/elife-62583-fig2-data2-v3.zip
-
Figure 2—source data 3
df/F methods.
- https://cdn.elifesciences.org/articles/62583/elife-62583-fig2-data3-v3.zip
-
Figure 2—source data 4
DAN signals recorded at SNc, DLS and VTA.
- https://cdn.elifesciences.org/articles/62583/elife-62583-fig2-data4-v3.zip
Figure 2—figure supplement 1
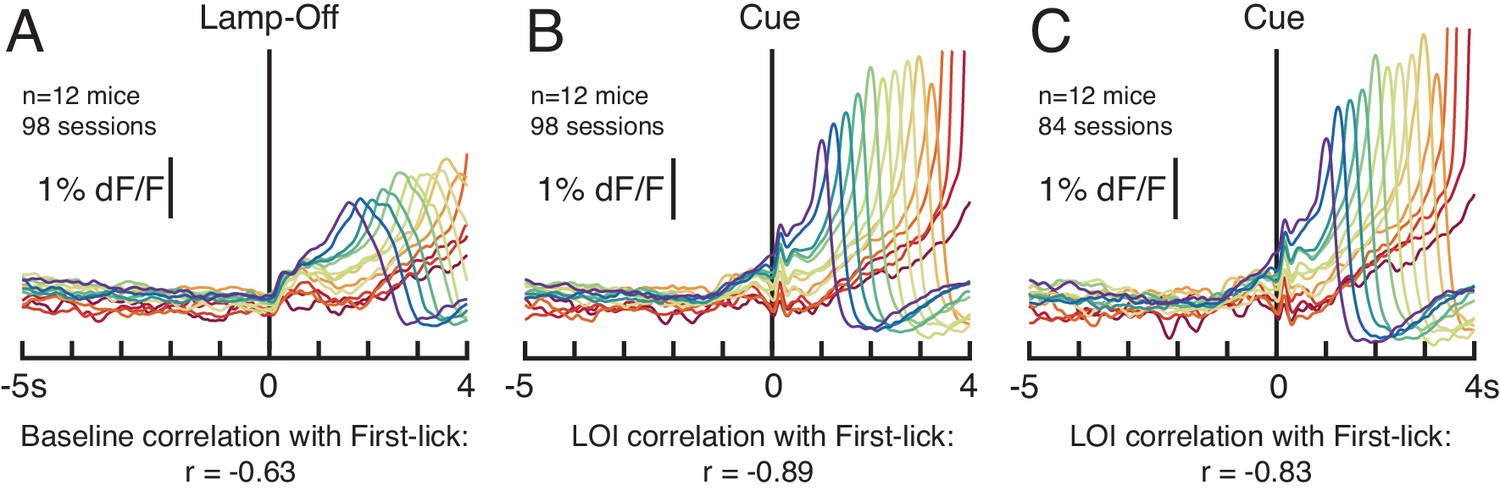
Baseline correlation of dopaminergic signal with first-lick time is not dependent on the duration of the lamp-off interval.
(A) SNc GCaMP6f dopaminergic signals aligned to the lamp-off event (n = 12 mice, all 98 sessions). ‘Baseline’: 2 s interval before lamp-off event. (B) SNc GCaMP6f dopaminergic signals aligned to the cue, all sessions. ‘LOI’: Lamp-Off-Interval between lamp-off and cue. (C) 14/98 sessions showed a small relationship between LOI duration and first-lick time (R2<0.04 for 13/14 sessions, sign of correlation inconsistent among sessions). Omitting these 14 sessions did not eliminate the Baseline or Lamp-Off Interval correlation between dopaminergic signal amplitude and first-lick timing. Figure 2—source data 2.
Figure 2—figure supplement 2
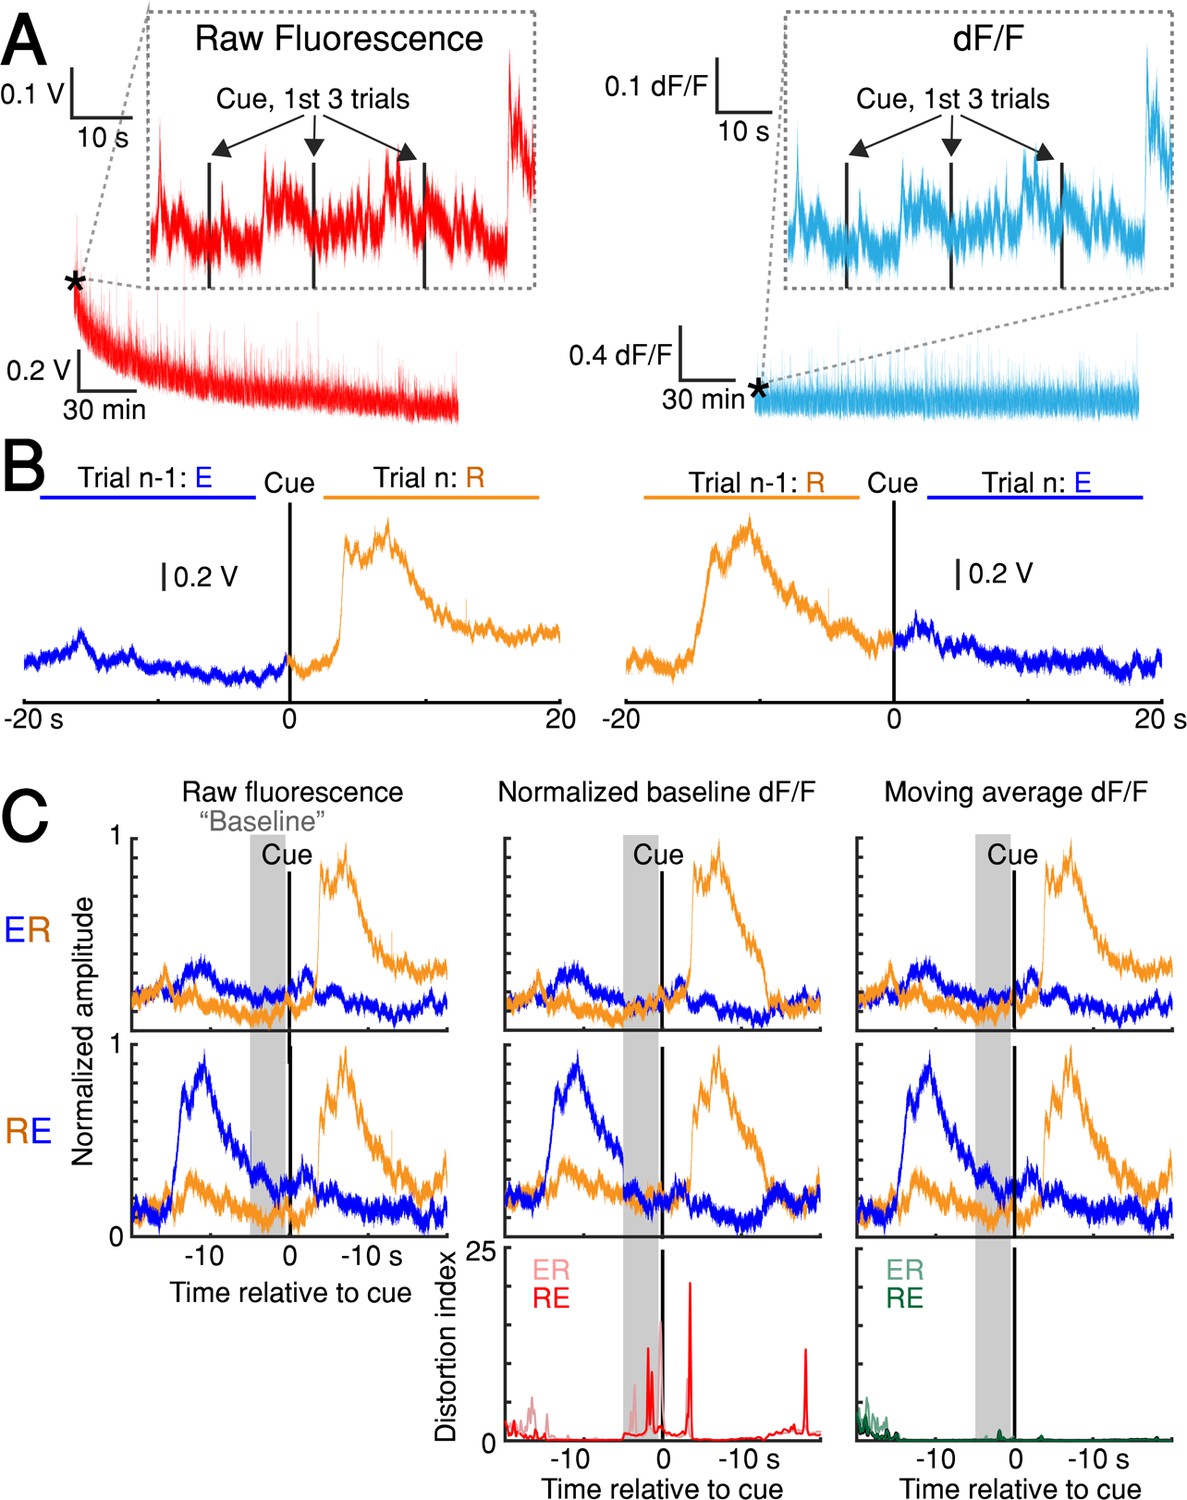
dF/F method validation.
(A) Left: slow, raw fluorescence bleaching across one session. Left inset: Minimal bleaching occurs across the first three trials (~1 min). Right: dF/F removes slow bleaching dynamics. Right inset: The same 3-trial window shown for dF/F signal. (B) Average raw fluorescence on paired, consecutive trials from one session aligned to cue on the nth trial. Left: n-1th trial was early, nth trial was rewarded (’ER‘ condition). Right: ‘RE’ condition (see Materials and methods: ‘dF/F method characterization and validation’). (C) Comparison of baseline GCaMP6f signals on paired, consecutive trials aligned to cue. Columns: three different versions of the signal (Raw fluorescence, Normalized baseline dF/F method, Moving average dF/F method). Top row: ER condition; middle row: RE condition; bottom row: distortion index. Red distortion index plot shows only Normalized baseline method. Green distortion index plot shows overlay of Moving Average, Low-Pass Filter, and Multiple Baseline dF/F Methods because the difference in signal distortion between these methods was indistinguishable (see Materials and methods: ‘dF/F method characterization and validation’). Figure 2—source data 3.
Figure 2—figure supplement 3
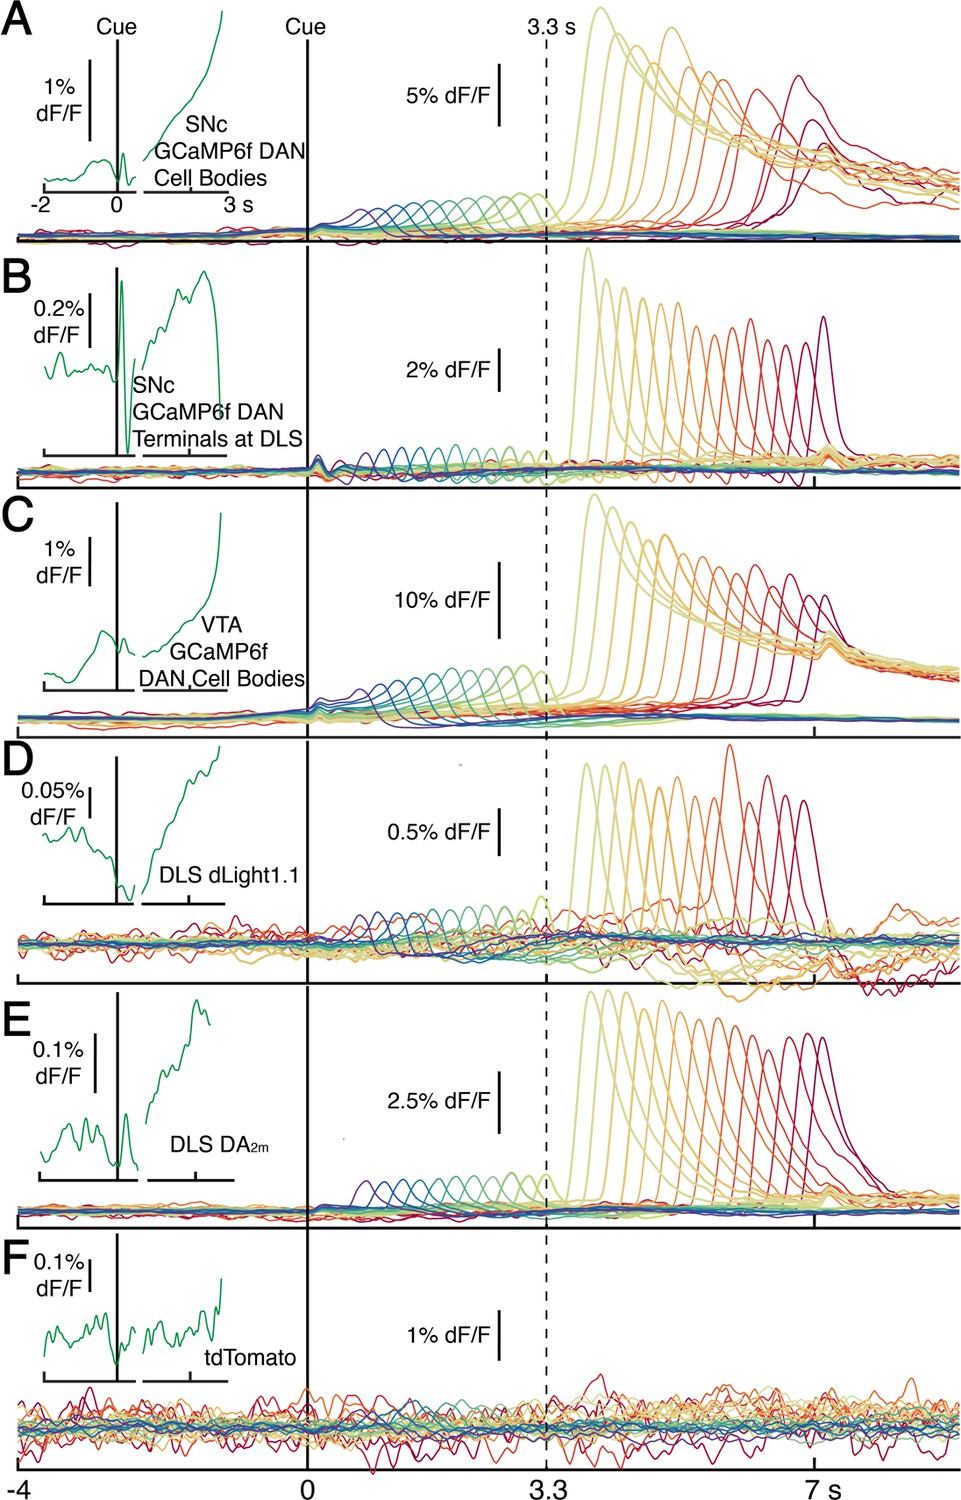
Average photometry signals, pooled every 250 ms by first-lick time, spanning 0.5 s (purple) to 7 s (red).
Signals in main panels aligned only to cue, not first-lick. (A) Average DAN GCaMP6f signals at SNc cell bodies (12 mice). (B) DAN GCaMP6f signals at axon terminals in DLS (10 mice). (C) Striatal dopamine detection with dLight1.1 at DLS (5 mice). (D) Striatal DA2m signals at DLS (4 mice). (E) DAN GCaMP6f signals at VTA cell bodies (4 mice). (F) tdTomato signals. Insets (left): Cue and lick-aligned average signals for a single time bin before first-lick to show pre-lick ramping present in all dopaminergic signals. Left of axis break: aligned to cue. Right of axis break: aligned to first-lick. Traces plotted up until 150 ms before first-lick. Figure 2—source data 4.
Figure 3 with 1 supplement
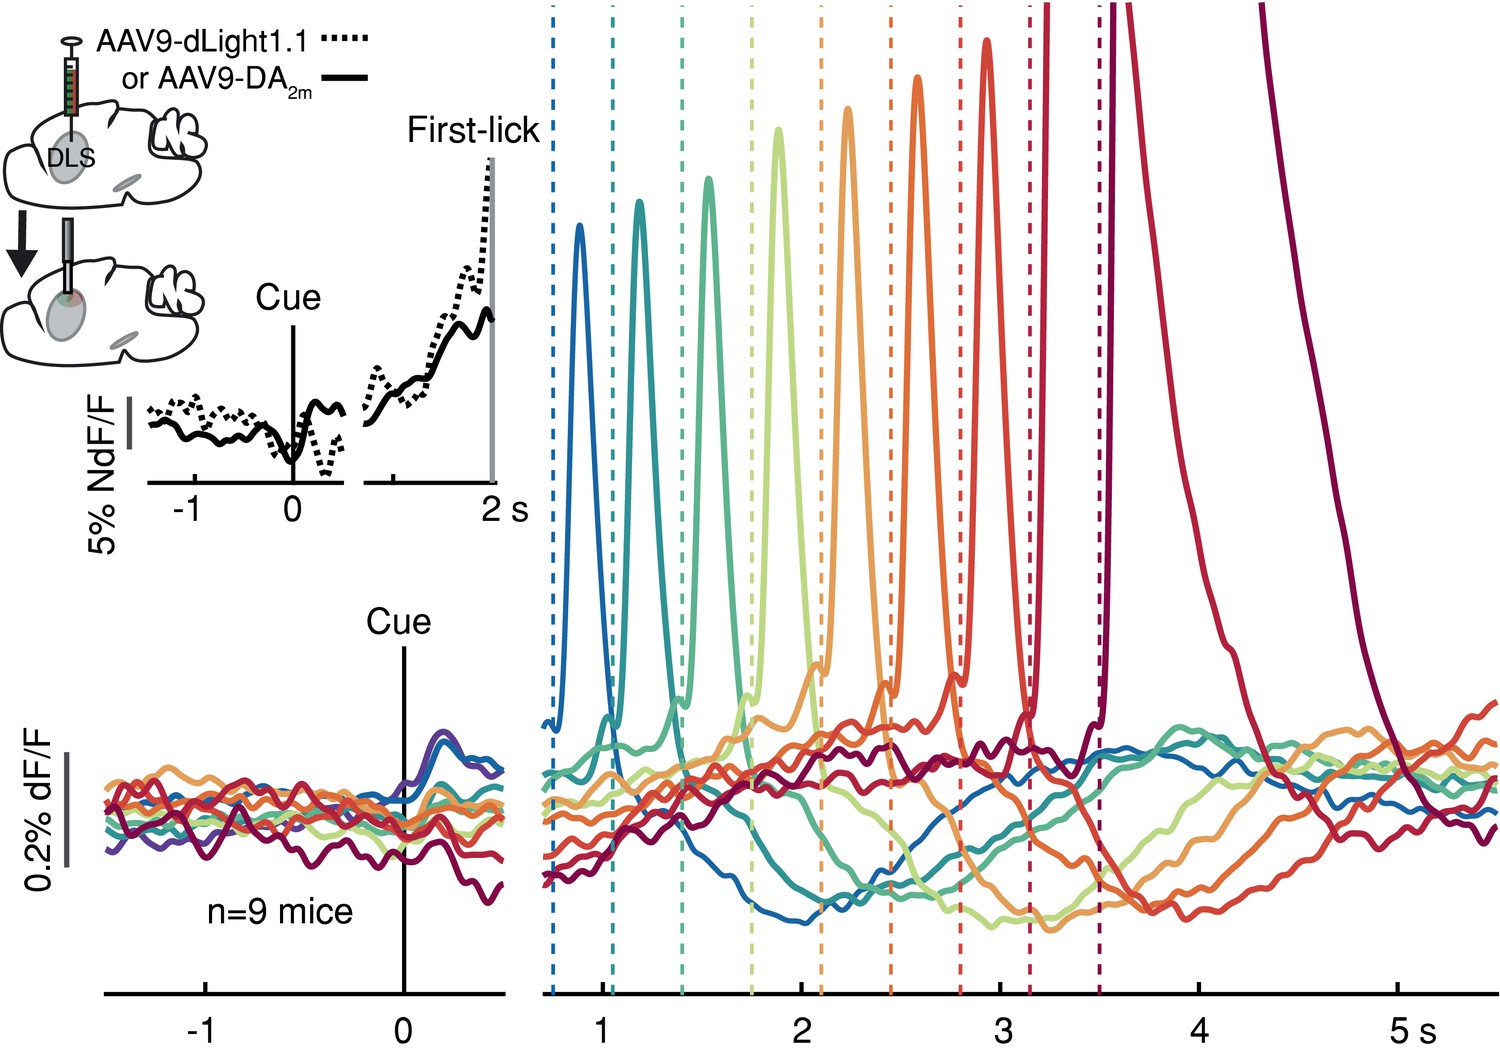
Striatal dopamine release during the self-timed movement task.
Photometry signals averaged together from DA2m signals (n = 4 mice) and dLight1.1 signals (n = 5 mice) recorded in DLS. Axis break and plot alignment as in Figure 2. Dashed lines: first-lick times. Inset, left: surgical strategy. Inset, right: Comparison of dLight1.1 and DA2m dynamics. Expanded vertical scale to show ramping in the average signals for DA2m (solid trace) and dLight1.1 (dashed trace) up until the time of the first-lick (first-lick occurred between 2 and 3 s after the cue for this subset of the data). See also: Figure 3—figure supplement 1. Figure 3—source data 1.
-
Figure 3—source data 1
Striatal dopamine indicator signals.
- https://cdn.elifesciences.org/articles/62583/elife-62583-fig3-data1-v3.zip
Figure 3—figure supplement 1
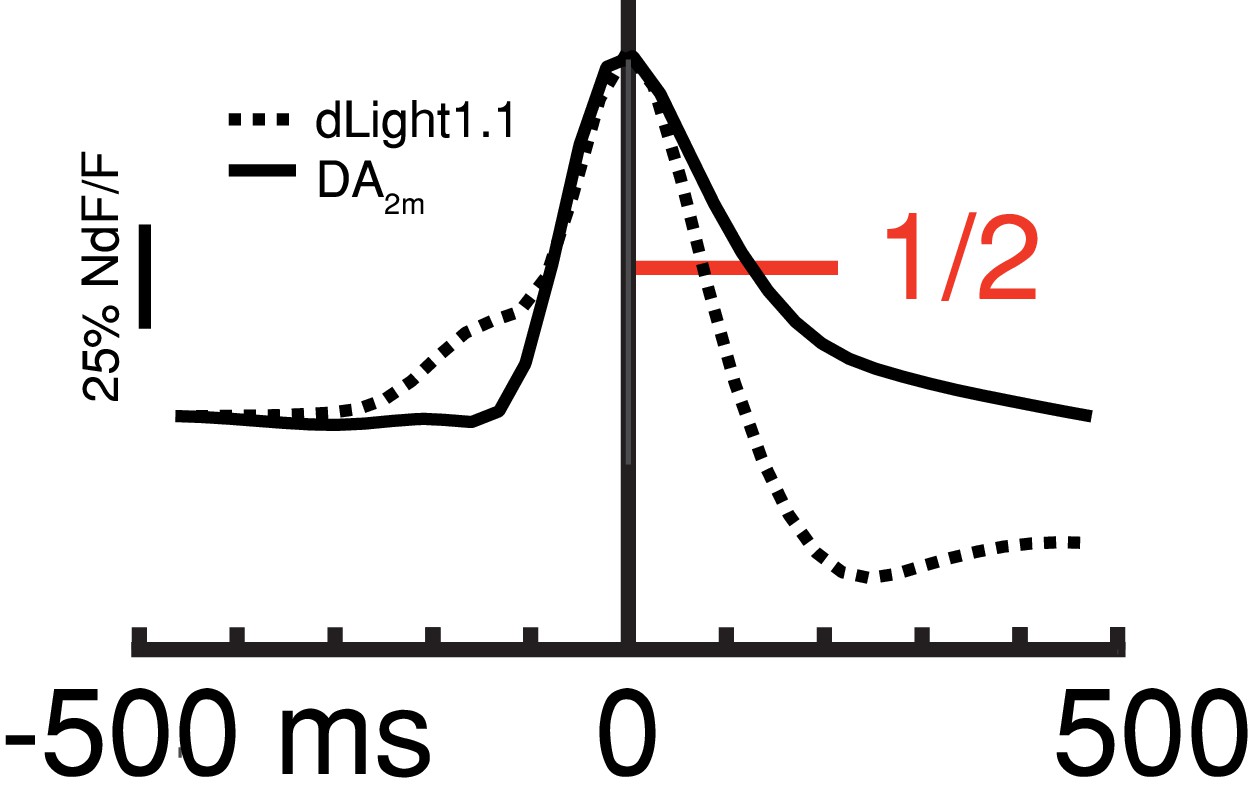
Comparison of dLight1.1 (dashed) and DA2m (solid) kinetics surrounding peak of unrewarded transient (first-lick time: 0.5–3.3 s).
Red line: ½ baseline-to-peak amplitude for measuring decay t1/2 (see Materials and methods). Figure 3—source data 1.
Figure 4 with 1 supplement
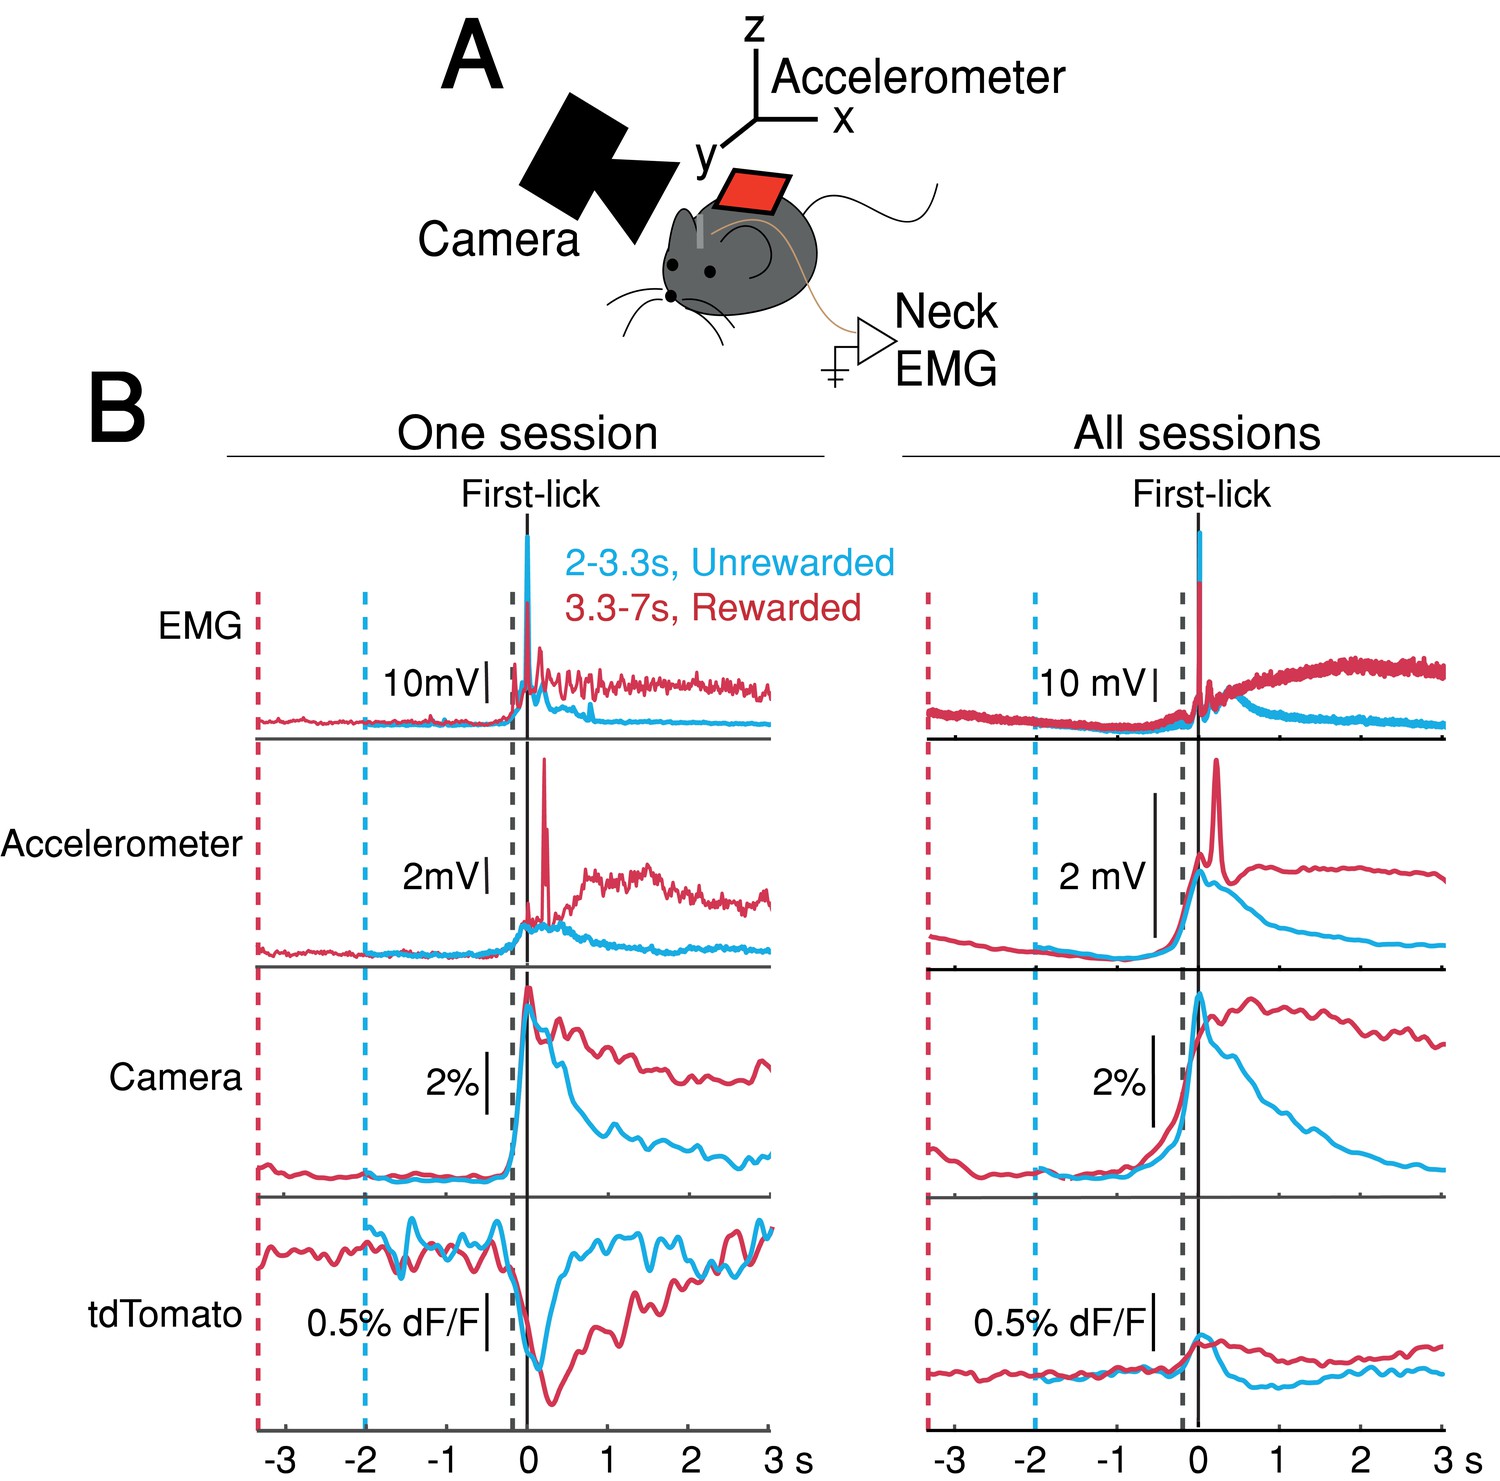
Movement controls reliably detected movements, but there were no systematic differences in movement during the timing interval.
(A) Schematic of movement-control measurements. (B) First-lick-aligned average movement signals on rewarded (red) and unrewarded (blue) trials. Pre-lick traces begin at the nearest cue-time (dashed red, dashed blue). Left: one session; Right: all sessions. Dashed grey line: time of earliest-detected movement on most sessions (150ms before first-lick). Average first-lick-aligned tdTomato optical artifacts showed inconsistent excursion directions (up/down), even within the same session; signals for each artifact direction shown in Figure 4—figure supplement 1. Source data: Figure 4—source data 1.
-
Figure 4—source data 1
Movement control signals.
- https://cdn.elifesciences.org/articles/62583/elife-62583-fig4-data1-v3.zip
Figure 4—figure supplement 1
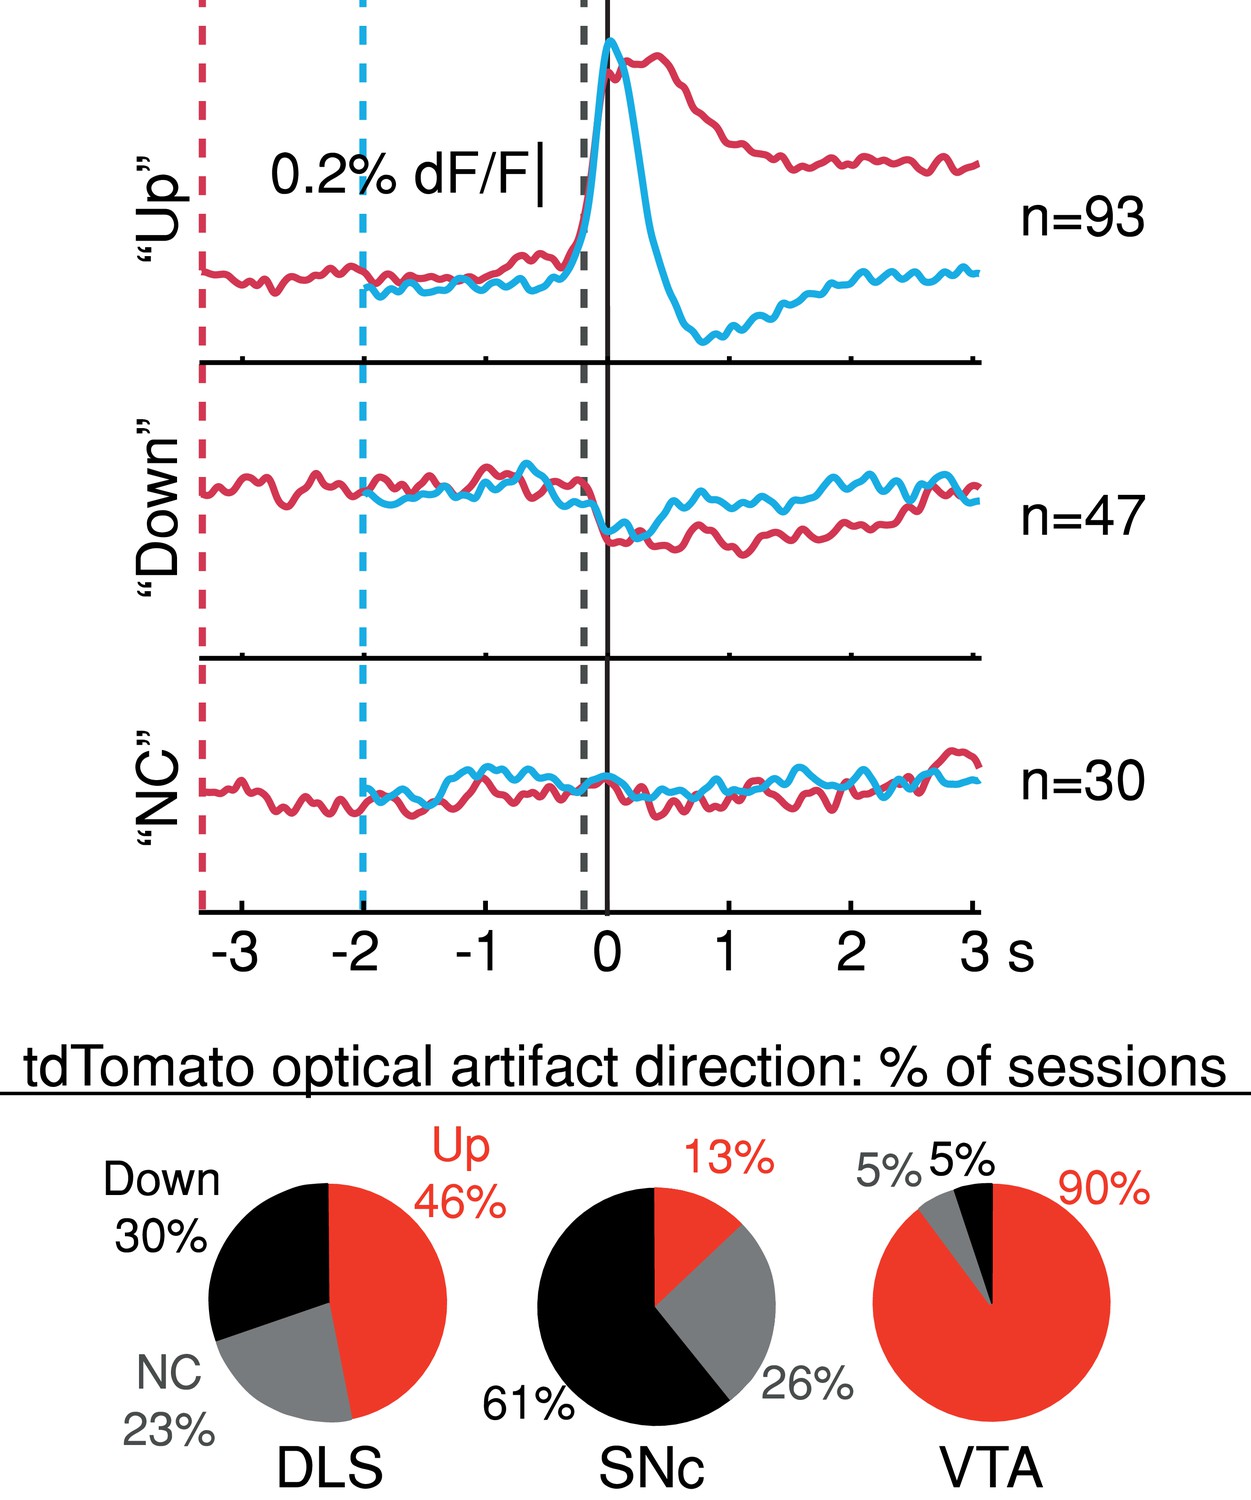
Average tdTomato optical artifacts (aligned to first-lick time) showed inconsistent excursion directions even within the same session.
Averages for all three types of artifact (consistently up, ‘Up’; consistently down, ‘Down’; and not consistent ‘NC’) shown for all sessions. Pie plots: Breakdown of average tdt artifact direction by session at each recording site. Source data: Figure 4—source data 1.
Figure 5 with 2 supplements
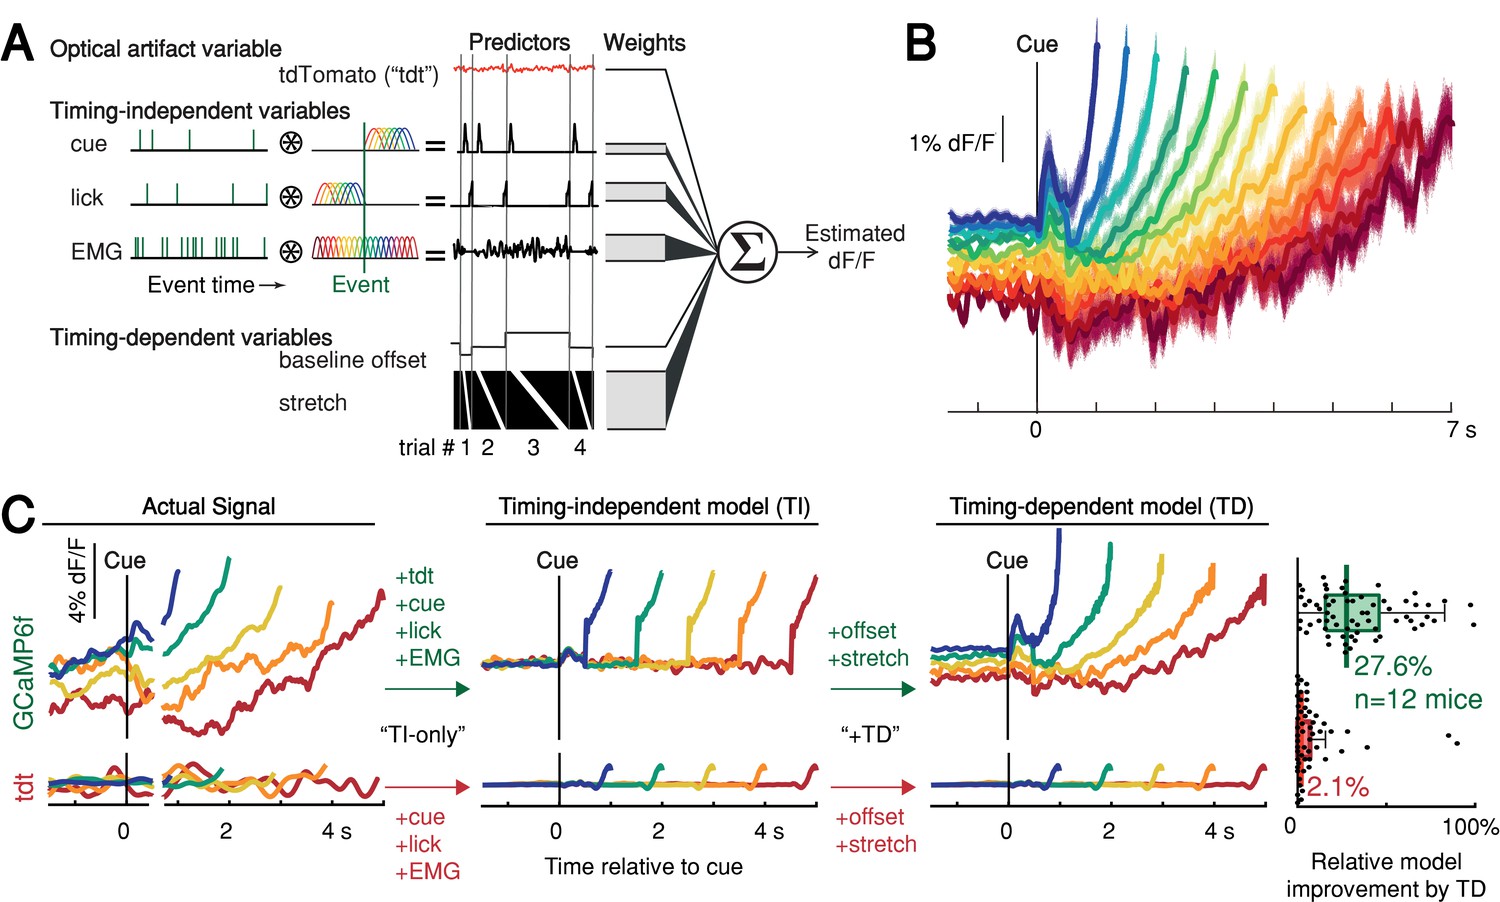
Contribution of optical artifacts, task variables and nuisance bodily movements to SNc GCaMP6f signals.
(A) Nested encoding model comparing the contribution of timing-independent predictors (TI) to the contribution of timing-dependent predictors (TD). (B) Predicted dF/F signal for one session plotted up to time of first-lick. Model error simulated 300x (shading). (C) Nested encoding model for one session showing the actual recorded signal (1st panel), the timing-independent model (2nd panel), and the full, timing-dependent model with all predictors (3rd panel). Top: GCaMP6f; Bottom: tdTomato (tdt). Right: relative loss improvement by timing-dependent predictors (grey dots: single sessions, line: median, box: lower/upper quartiles, whiskers: 1.5x IQR). See also Figure 5—figure supplement 1. Source data: Figure 5—source data 1.
-
Figure 5—source data 1
DAN signal encoding model.
- https://cdn.elifesciences.org/articles/62583/elife-62583-fig5-data1-v3.zip
Figure 5—figure supplement 1
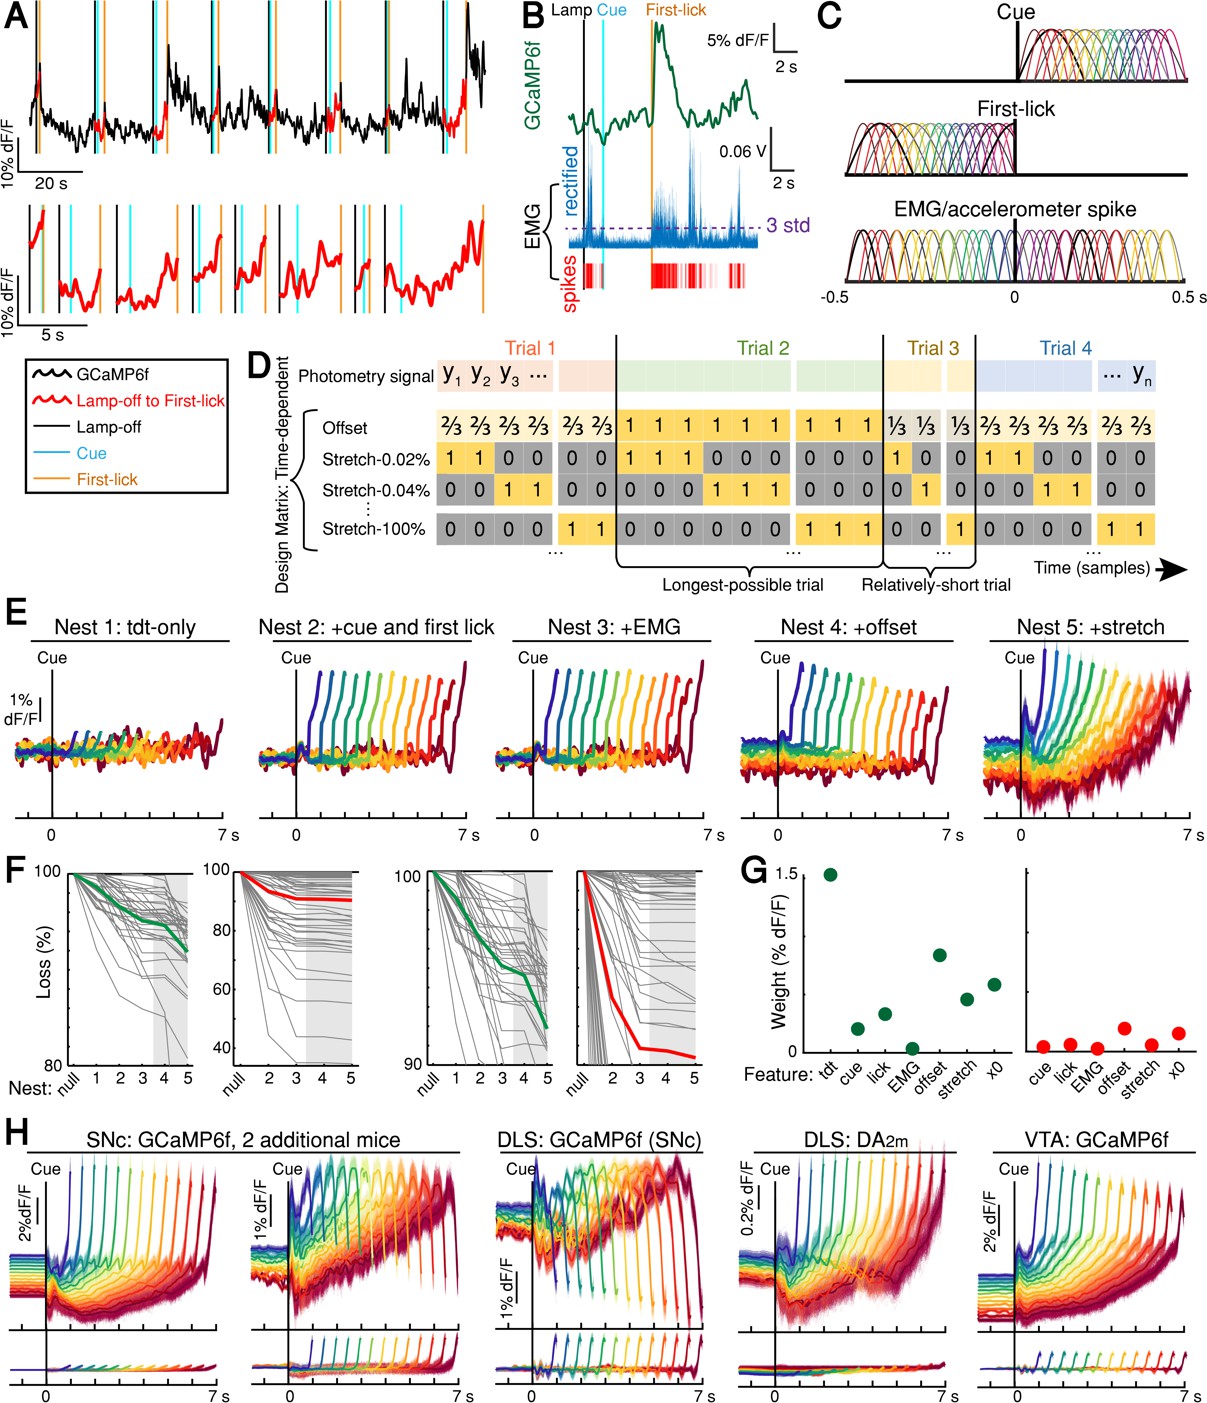
DAN signal encoding model parameterization and model selection.
(A) Schematic of photometry timeseries fit by encoding model. The lamp-off to first-lick interval was excised from each trial in a session (top) and concatenated to produce the timeseries fit by the model (bottom). (B) EMG spikes derivation: thresholding rectified EMG at three standard deviations (example trial). (C) Optimized basis kernels to produce timing-independent features. (D) Schematic of Design Matrix for timing-dependent features. (E) GCaMP6f model fits by nest iteration for example session. Shading: model error simulated 300x. (F) Model loss by nest iteration. Green: mean loss for SNc GCaMP6f; red: mean loss for tdTomato (tdt); grey lines: individual sessions; grey shading: timing-dependent nests. Left: full-scale view of all datasets. Right: mean GCaMP6f and tdt loss compared on same scale. (G) Summary of feature weights across SNc GCaMP6f (left) and tdt (right) models. Coefficient weights were rectified, summed, and divided by the number of predictors per feature. 2x standard error bars (too small to see). All features were significant in both GCaMP6f and tdt models. (H) Top: examples of the full timing-dependent model (nest 5) from additional mice for all recorded dopaminergic signals. Bottom: tdt control channel fit. Model errors simulated 300x. Some mice showed downward-going movement-related spikes at SNc cell bodies (second panel). All mice showed downward-going movement-related spikes from SNc terminals in DLS (middle panel). Source data: Figure 5—source data 1.
Figure 5—figure supplement 2
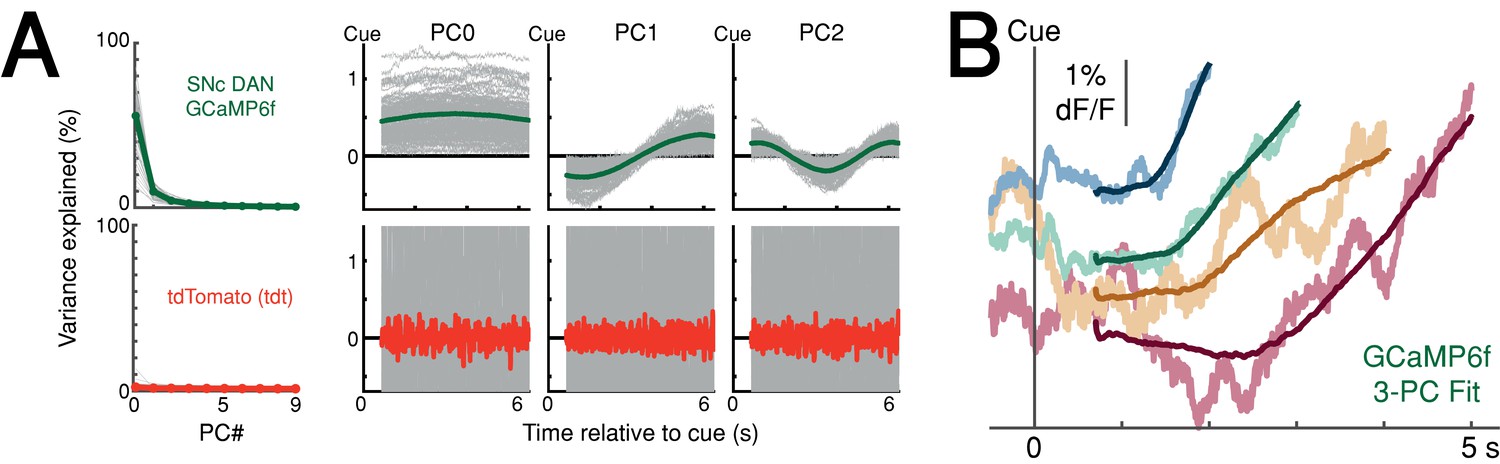
Principal component analysis (PCA) of the ramping interval (0.7 s up to first-lick; relative to cue).
(A) Left: Variance explained by first 10 principal components (PC). Right: first three principal components. Green line: mean PC, GCaMP6f recorded at SNc; Red line: mean PC, tdTomato (tdt) recorded at SNc and VTA; Gray lines: single-session data. X-axis shown for longest-possible interpolated trial duration; trials of shorter duration were interpolated to have the same number of samples for PCA. (B) Example session data simulated with first three PCs. Noisy traces: actual averaged GCaMP6f signals truncated at first-lick onset; Smooth traces: PC fits of the same trials. Source data: Figure 5—source data 1.
Figure 6 with 4 supplements

Single-trial DAN signals predict first-lick timing.
(A) Schematic of nested decoding model. Categories for n-1th trial predictors: (2) reaction, (3) early, (4) reward, (5) ITI first-lick (see Materials and methods). Bottom: single-trial cue-aligned SNc DAN GCaMP6f signals from one session (six trials shown for clarity). Traces plotted up to first-lick. Right: threshold-crossing model. Low/Mid/High label indicates threshold amplitude. Dots: single trials. (B) Model weights. Error bars: 95% CI, *: p<0.05, two-sided t-test. Numbers indicate nesting-order. (C) Variance explained by each model nest. Gray lines: single sessions; thick black line: average. For model selection, see Figure 6—figure supplement 1. (D) Predicted vs. actual first-lick time, same session as 6A. See also Figure 6—figure supplements 1–4. Source data: Figure 6—source data 1.
-
Figure 6—source data 1
Movement time decoding model.
- https://cdn.elifesciences.org/articles/62583/elife-62583-fig6-data1-v3.zip
Figure 6—figure supplement 1
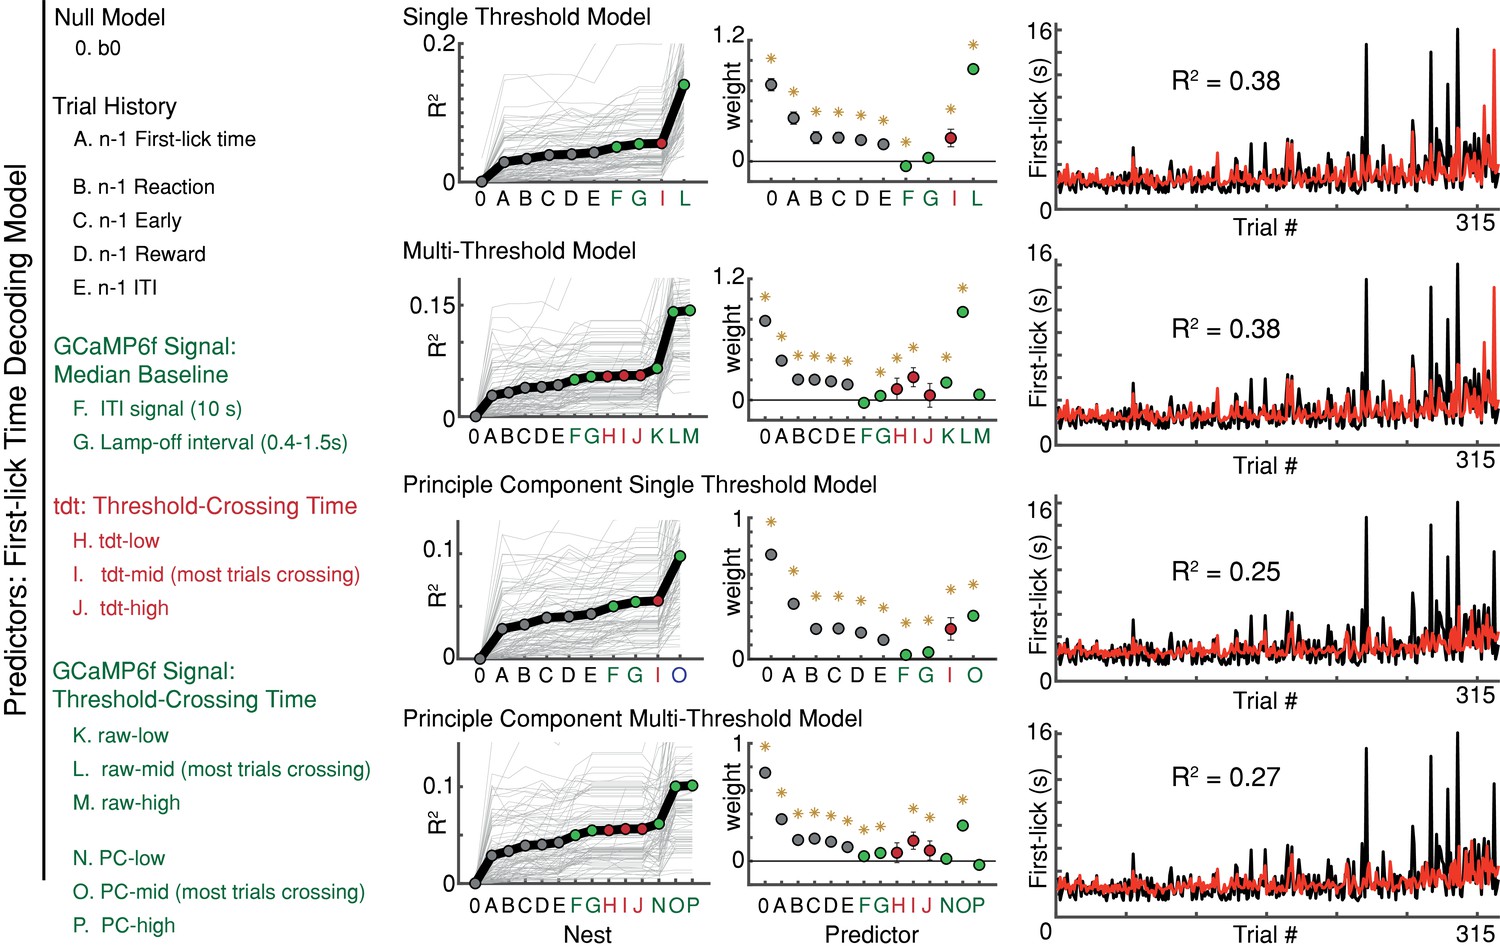
Variations of the first-lick time decoding model.
*: p<0.05, error bars: 95% confidence intervals. GCaMP6f threshold crossing time dominated every version of the model; n-1th trial first-lick time was consistently the second-best predictor. Source data: Figure 6—source data 1.
Figure 6—figure supplement 2
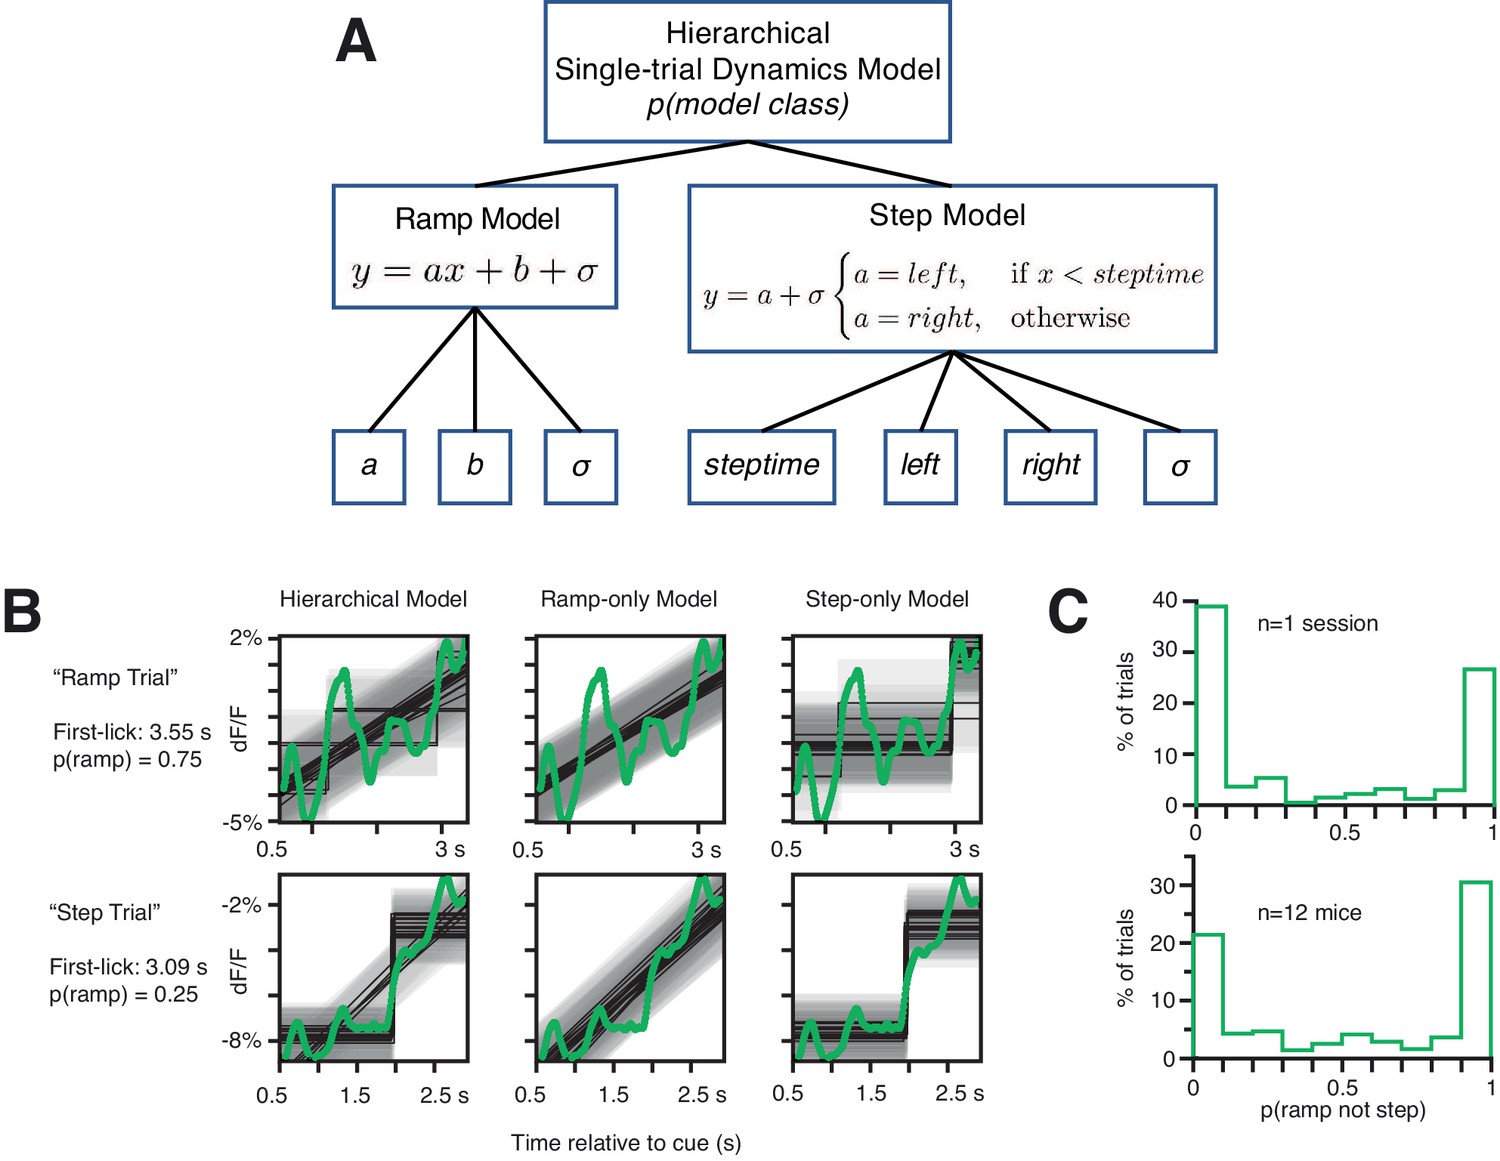
Analysis of single-trial dynamics: Hierarchical Bayesian Ramp vs Step Modeling.
(A) Schematic (see Materials and methods: ‘Hierarchical Bayesian Modeling of Single-trial Dynamics’). (B) Example fits from hierarchical model on two example single trials from the same epoch in a single session. Green: SNc GCaMP6f single-trial signal, light gray shading: noise band, dark gray lines: model fits. Note that the top trial is more frequently classified as a ramp, and the lower trial is more frequently classified as a step. However, both the ramp and step models return intuitive and reasonable fits to both single-trial signals. (C). Probability of model class across all trials. X axis: 0 indicates that all probabilistic fits for a given trial returned step-class models; 1 indicates that all best-fits were ramp-class models. Single sessions across mice showed considerable uncertainty in model classification. Source data: Figure 6—source data 1.
Figure 6—figure supplement 3
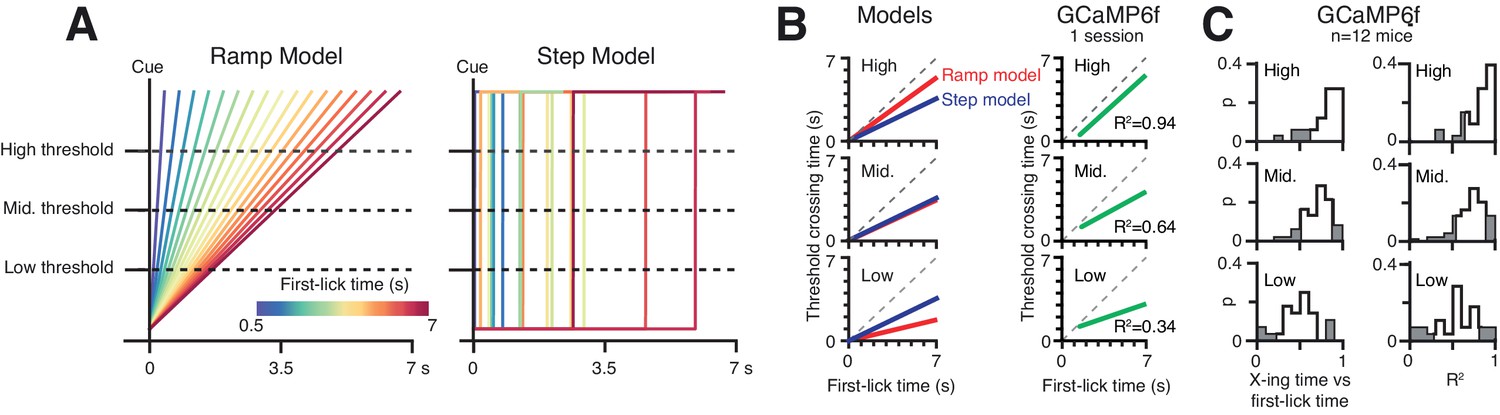
Geometric analysis of single-trial dynamics with Multiple Threshold Modeling.
(A) Left: linear ramp model, Right: discrete step model. Step positions drawn from uniform distribution over the cue-to-first-lick interval. Low-, Mid-, and High-level thresholds shown. (B) Threshold-crossing time vs. first-lick time (‘X-ing time vs. first-lick time’) for (from top to bottom) High-, Mid-, and Low-level thresholds. Left: simulation predictions for ramp and step models. Right: X-ing time vs. first-lick time regression fit on single trials from one session (data from Figure 6A). The step model predicts that the X-ing time vs. first-lick time does not change across threshold levels, whereas the ramp model predicts that the slope of this relationship increases as threshold is raised. Single-trial GCaMP6f data exhibits increasing X-ing time vs. first-lick time slope with increasing threshold level, consistent with the ramp model but inconsistent with the step model. (C). X-ing time vs. first-lick time across all mice. Left column: frequency of slope relationship across sessions, right column: variance explained. Source data: Figure 6—source data 1.
Figure 6—figure supplement 4
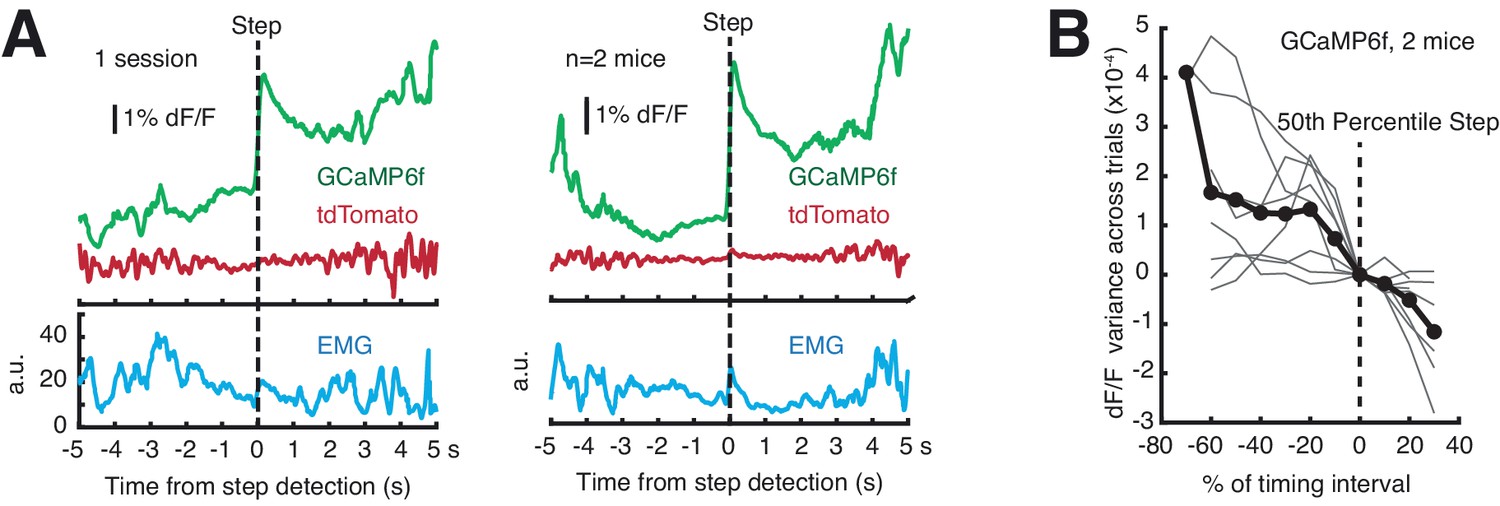
Assessing single-trial dynamics.
(A) Single-trial signals aligned to discrete step position (as found by Bayesian step model) do not exhibit discrete step dynamics. To best estimate step times, the two animals with the highest GCaMP6f S:N were examined (Mouse B5 and B6). Left: 1 session, Right: average of signals from both mice. (B) Variance of GCaMP6f signals across trials. Step times were computed by Bayesian step model. An ideal step model predicts maximal variance at the 50th percentile step, but variance declined monotonically on average. Gray lines: single sessions; black line: average. For detailed explanation, see Materials and methods: ‘Single-trial variance analysis for discrete step dynamics.’ Source data: Figure 6—source data 1.
Figure 7 with 4 supplements
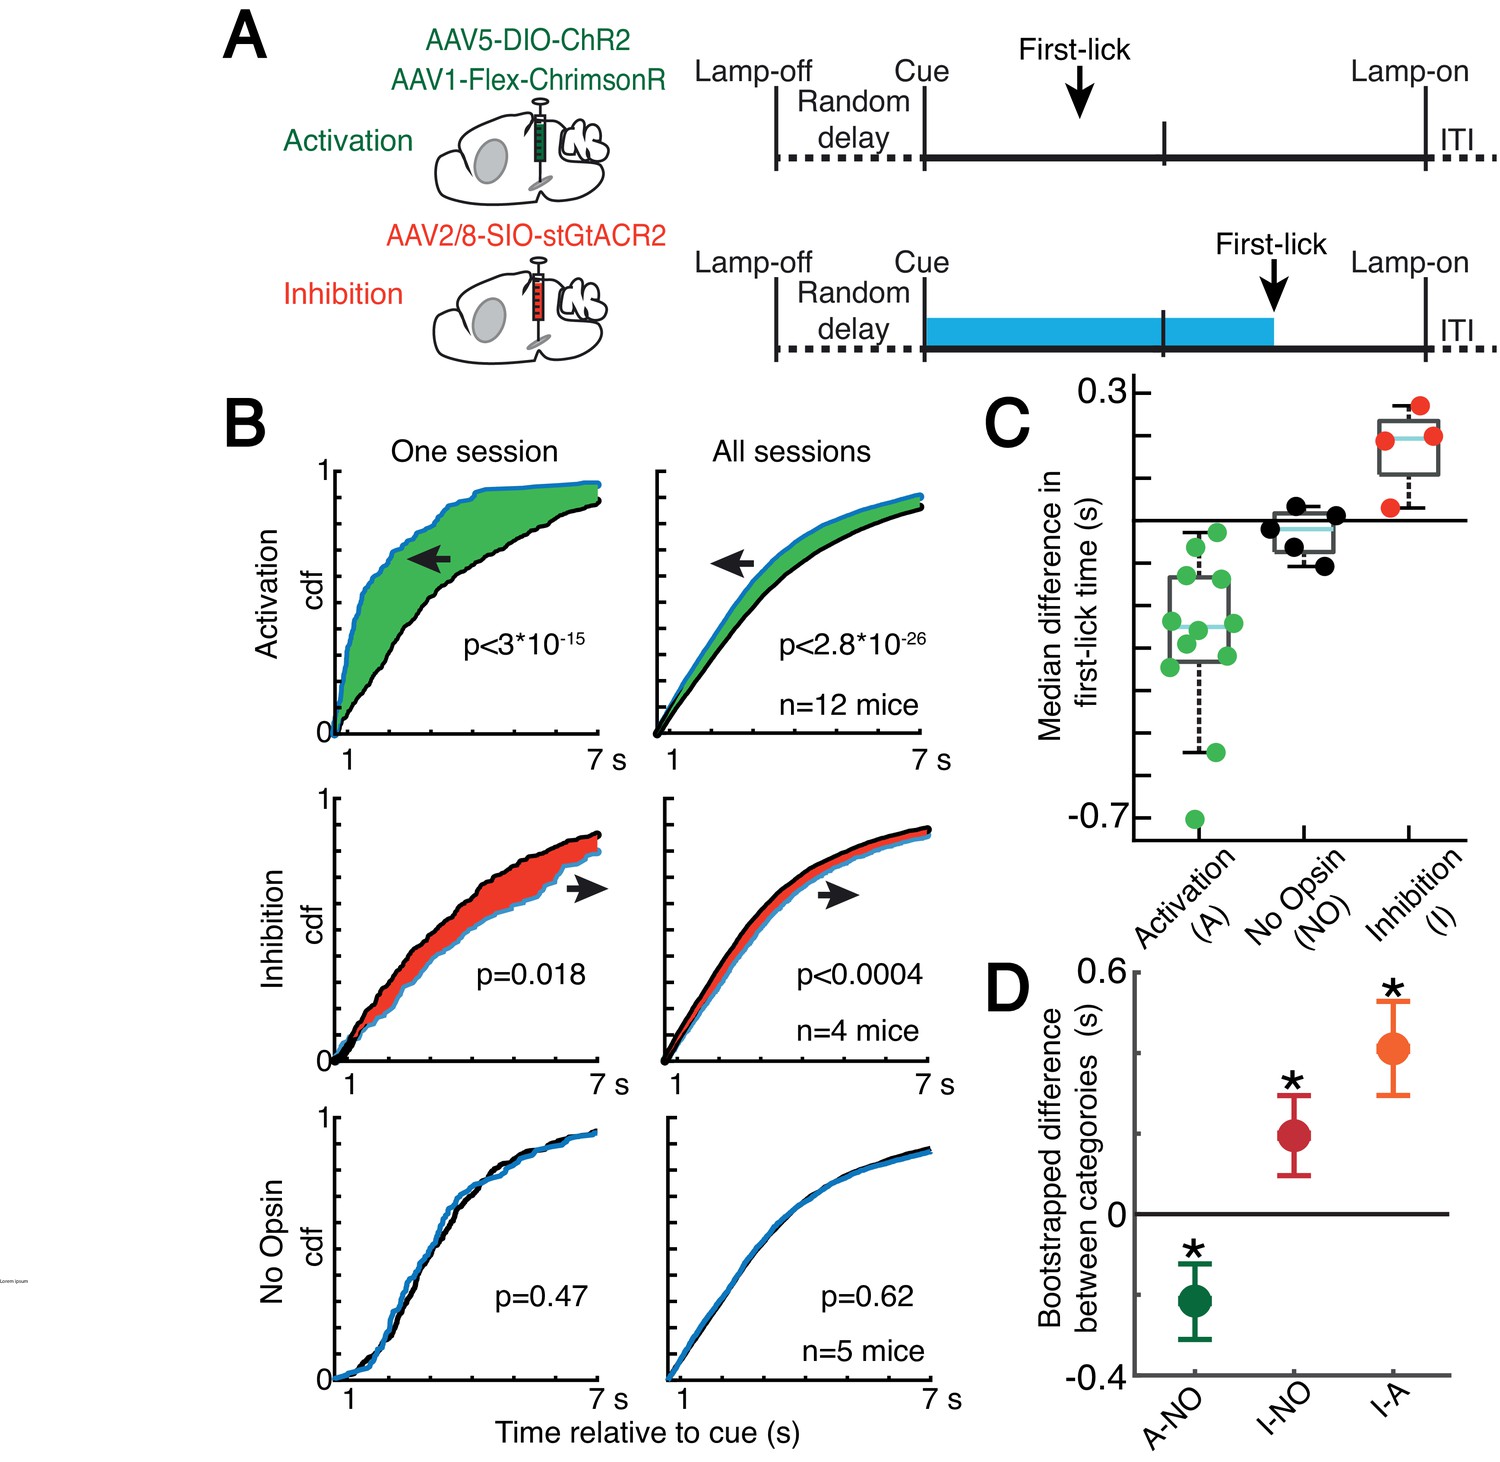
Optogenetic DAN manipulation systematically and bidirectionally shifts the timing of self-timed movements.
(A) Strategy for optogenetic DAN activation or inhibition. Mice were stimulated from cue-onset until first-lick or 7 s. (B) Empirical continuous probability distribution functions (cdf) of first-lick times for stimulated (blue line) versus unstimulated (grey line) trials. Arrow and shading show direction of effect. p-Values calculated by Kolmogorov-Smirnov test (for other metrics, see Figure 7—figure supplements 1 and 3). (C) Median 1,000,000x bootstrapped difference in first-lick time, stimulated-minus-unstimulated trials. Box: upper/lower quartile; line: median; whiskers: 1.5x IQR; dots: single mouse. (D) Comparison of median first-lick time difference across all sessions. Error bars: 95% confidence interval (*: p<0.05, 1,000,000x bootstrapped median difference in first-lick time between sessions of different stimulation categories). See also Figure 7—figure supplements 1–4. Source data: Figure 7—source data 1.
-
Figure 7—source data 1
Optogenetic manipulation of SNc DANs.
- https://cdn.elifesciences.org/articles/62583/elife-62583-fig7-data1-v3.zip
Figure 7—figure supplement 1
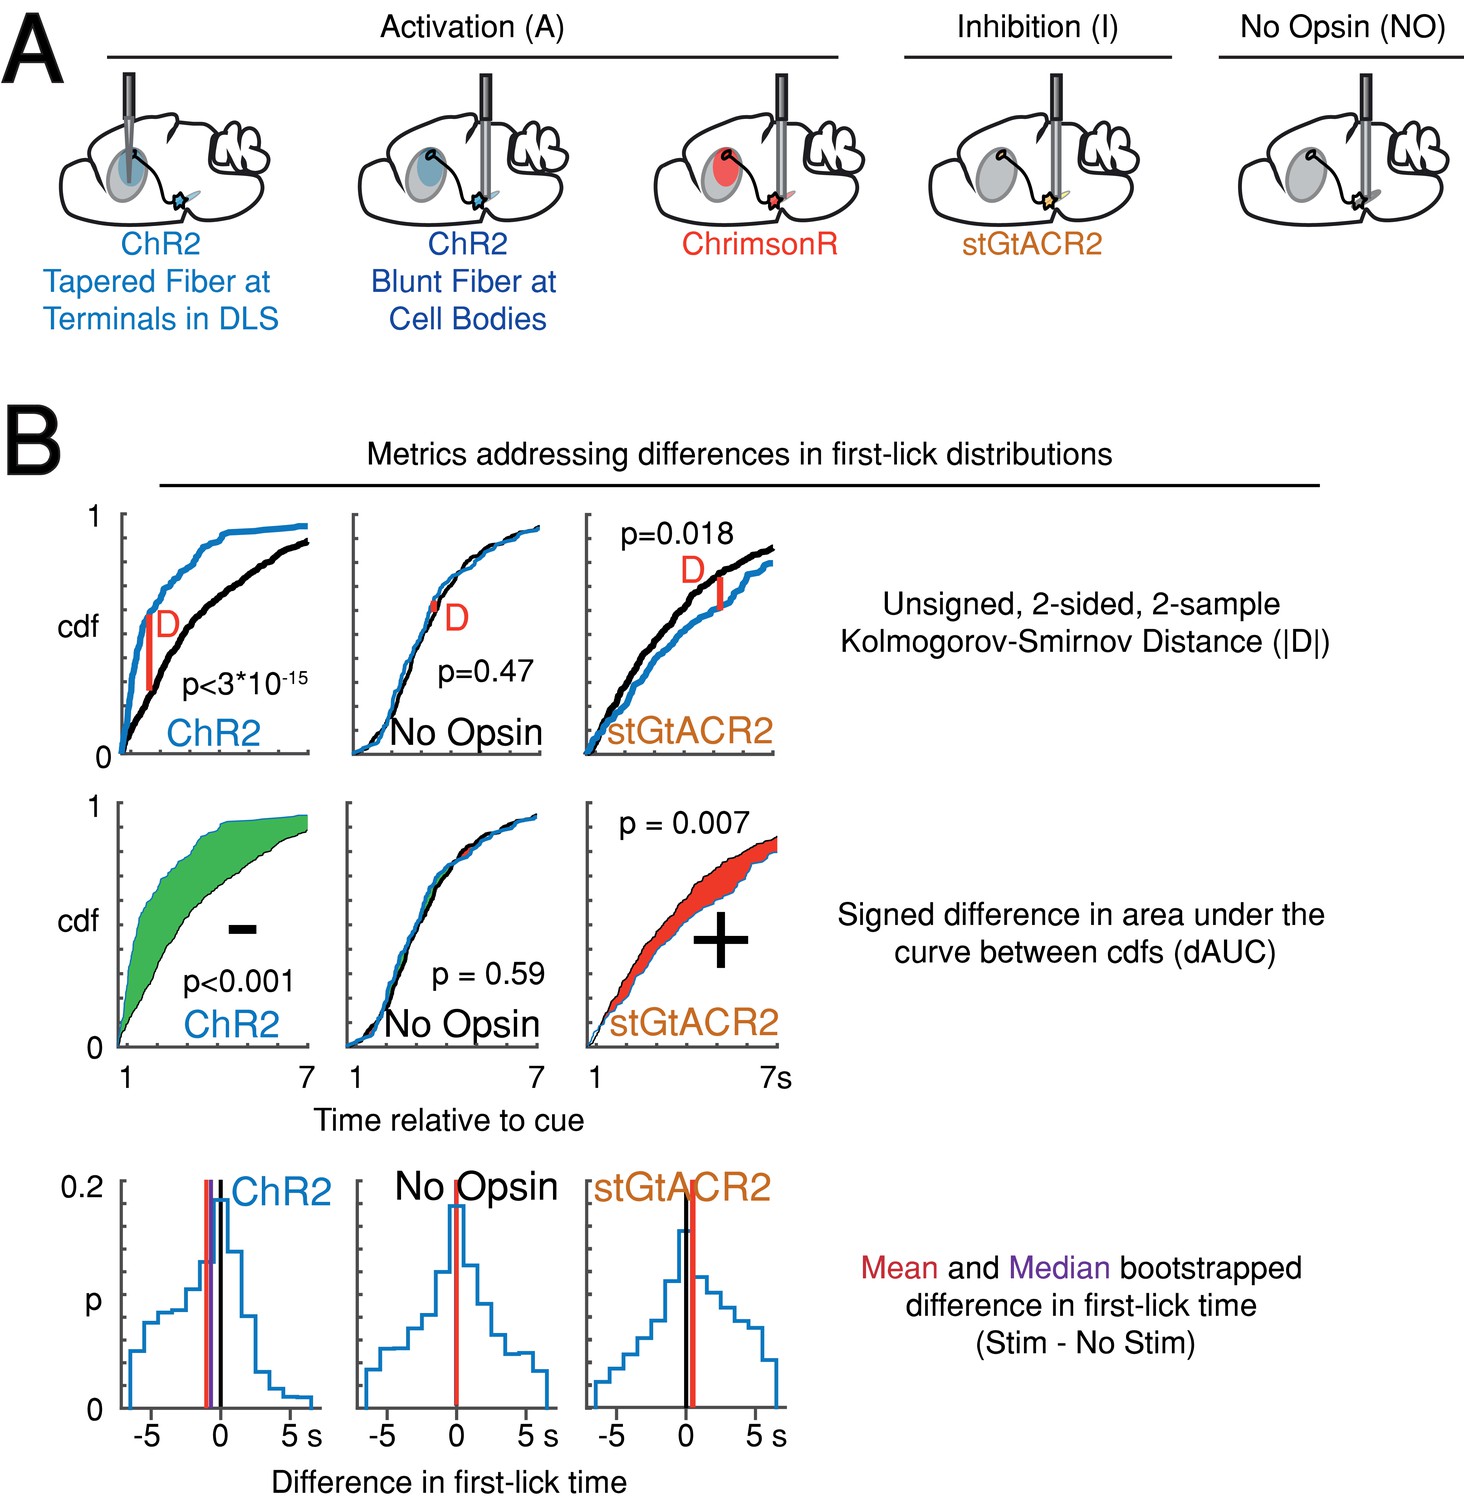
Variations on measurements of optogenetic effects.
(A) Strategy for optogenetic targeting of DANs. (B) Comparison of four complementary metrics for addressing optogenetic effects. Top: unsigned Kolmogorov-Smirnov Distance (KS-D) analysis of differences in first-lick time distribution. Middle: signed, bootstrapped comparison of the difference in area under the cdf curves (dAUC). Bottom: mean and median bootstrapped difference in first-lick time. Source data: Figure 7—source data 1.
Figure 7—figure supplement 2
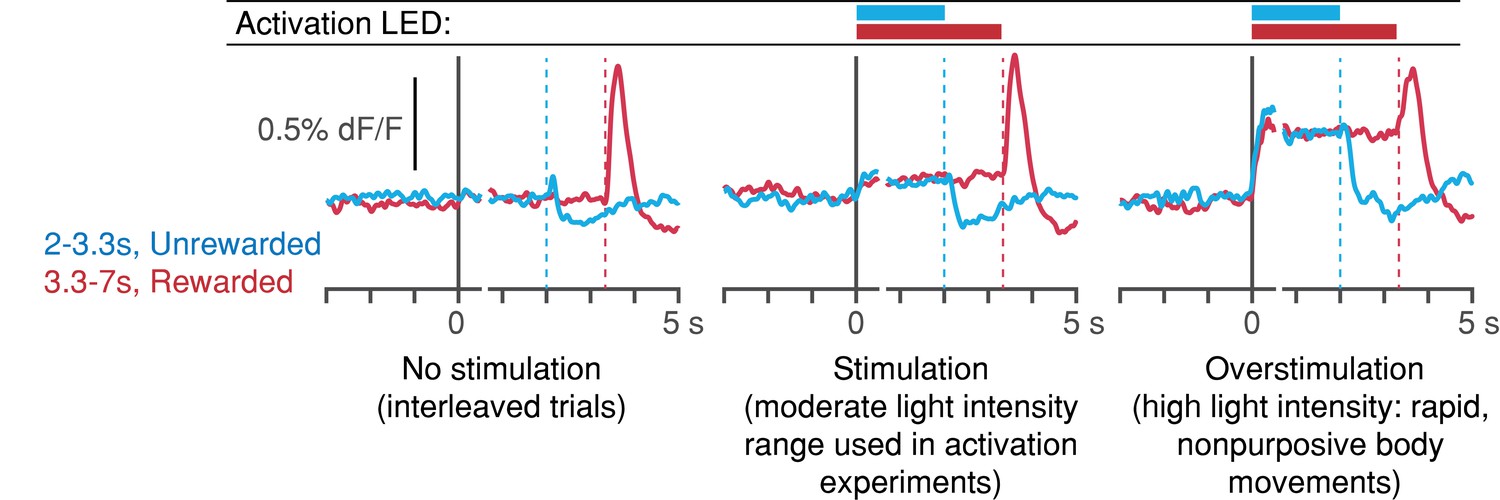
Light-power calibration for optogenetic activation of DANs.
In preliminary experiments, DLS dopamine levels were monitored during the self-timed movement task, in which SNc DANs were activated randomly on 30% of interleaved trials. Dashed vertical lines: first-lick time. Left: interleaved, unstimulated trials (2 mice, 8 sessions). Middle: stimulated trials at the range of light levels used in the activation experiments show slightly elevated DLS dopamine signals compared to interleaved, unstimulated trials. First-lick timing was generally early-shifted in these sessions. Right: in a subset of preliminary calibration sessions, stimulation light levels were increased to the point where rapid, nonpurposive limb/trunk movements were observed throughout stimulation (1 mouse, 3 sessions). DLS dopamine signals show much higher, sustained increases throughout stimulation. Ongoing body movements disrupted task participation. Source data: Figure 7—source data 1.
Figure 7—figure supplement 3
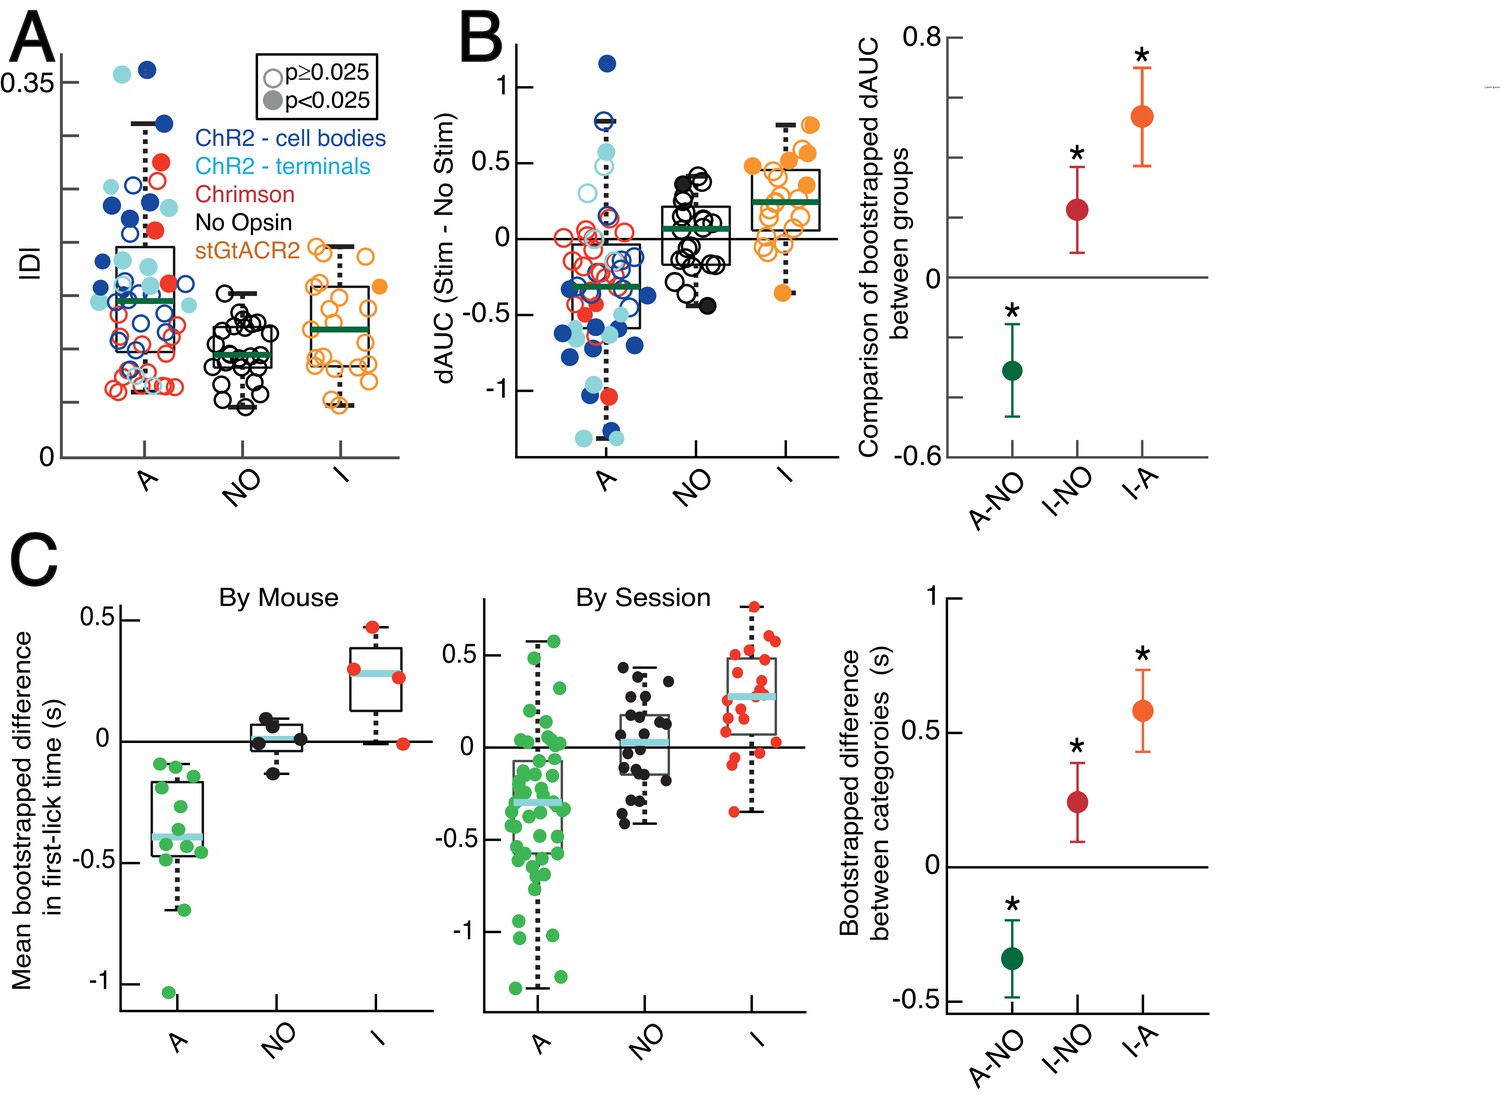
Quantification of optogenetic effects with additional metrics.
(A) KS-D analysis: all sessions. ’A‘: activation sessions; ‘NO‘: no opsin sessions; ’I‘: inhibition sessions. Filled circles indicate significant difference between stimulated/unstimulated trials on single session (p<0.025, two-sided, two-sample KS test). Standard box plot, line: median, box: upper/lower quartiles; whiskers: 1.5x IQR. (B) Left: bootstrapped dAUC Assay: all sessions, standard box plot as in A. Filled circles: significant difference on single session (p<0.025, two-sided bootstrapped dAUC test, see Materials and methods). Right: comparison of dAUC in first-lick distributions across all sessions between groups. Error bars denote bootstrapped 95% confidence interval (*: p<0.05). (C) Mean bootstrapped difference in first-lick time, stimulated-minus-unstimulated trials, standard box plot as in A. Left: single mice; Middle: single sessions. Right: Comparison of mean difference in first-lick time across all sessions. Error bars denote bootstrapped 95% confidence interval (*: p<0.05). Source data: Figure 7—source data 1.
Figure 7—figure supplement 4
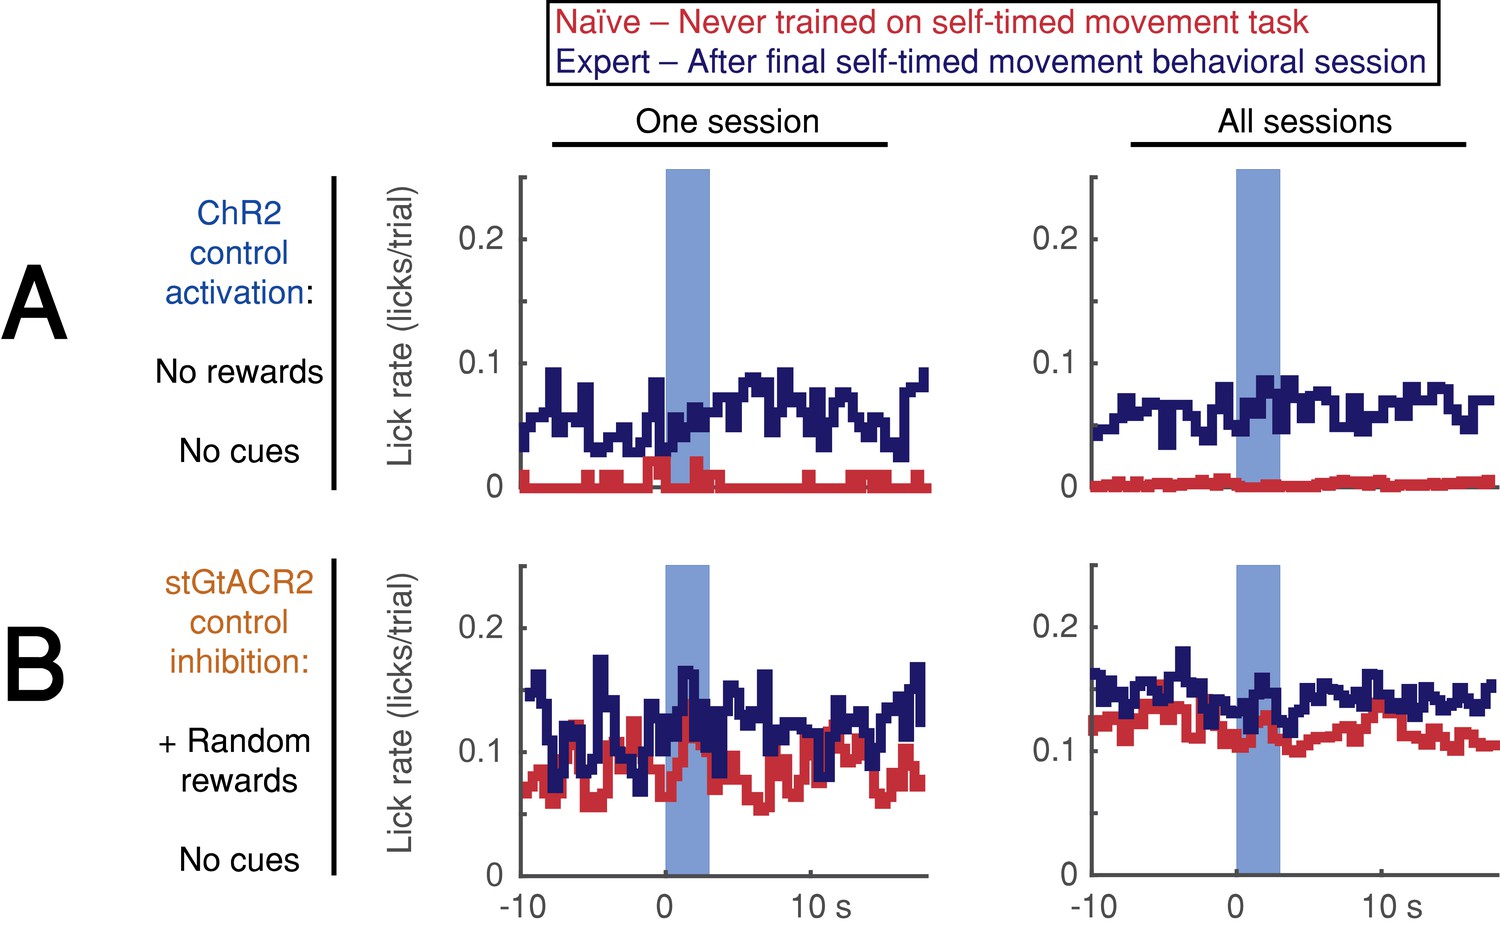
Optogenetic DAN stimulation does not cause or prevent licking.
(A,B) Stimulation-aligned lick-rate during control sessions. Animals were tested in 1–3 control sessions both before exposure to the self-timed movement task (red) and in 1–2 control sessions after the end of behavioral training (navy). Blue bar indicates stimulation period (3 s). Left: one session, Right: all sessions. (A) Activation control sessions (no cues or rewards). Animals were head-fixed on the behavioral platform and stimulated randomly at the same pace as the standard 3.3 s self-timed movement task. Activation did not elicit immediate licking in any session. (B) Inhibition control sessions (no cues, + random rewards). Animals were head-fixed on the behavioral platform while receiving juice rewards at random times. Inhibition did not prevent licking in any session. Source data: Figure 7—source data 1.
Figure 8 with 2 supplements

Single-trial dynamic dopaminergic signals predict the moment-to-moment probability of movement initiation.
(A) Probabilistic movement-state model schematic. (B) Single-trial DAN GCaMP6f signals at SNc from one session. First-lick time truncated 150 ms before movement detection to exclude peri-movement signals. Bottom: Movement states for the trials shown as a function of time. Diagram on the right schematizes the model predictors relative to an example time = t on a single trial. (C) Nested model fitted coefficients. (D) Decoded hazard functions from full model (with all 10 predictors). Thick line: mean. n = 12 mice. (E) Hazard function fitting with shuffled datasets abolished the predictive power of the model (same 12 mice). See also Figure 8—figure supplements 1–2. Figure 8—source data 1.
-
Figure 8—source data 1
Movement state decoding model.
- https://cdn.elifesciences.org/articles/62583/elife-62583-fig8-data1-v3.zip
Figure 8—figure supplement 1
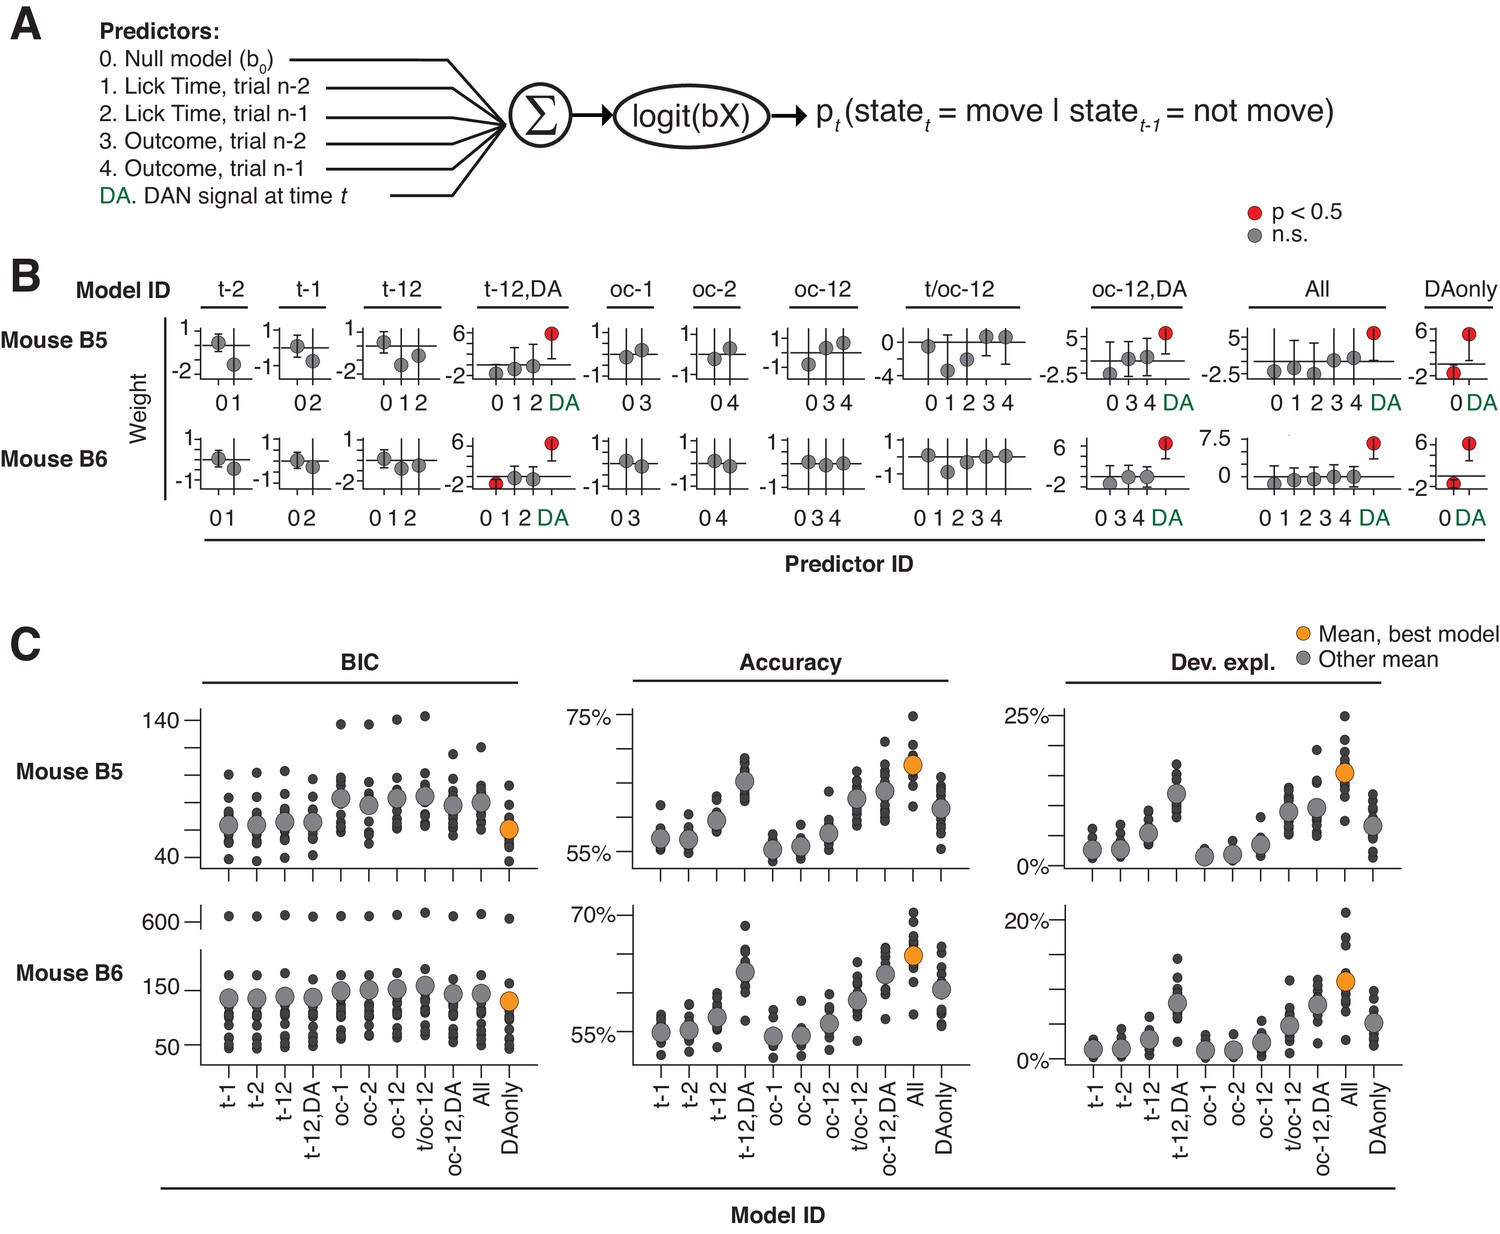
Probabilistic movement time decoding model: model selection.
(A) Model schematic. To assess previous trial history on the same footing as dopaminergic signals, time t during model selection was limited to a 500 ms ‘time-slice,’ with each time-slice fit separately by the model. Dopaminergic signals were averaged within each time-slice, such that each trial provided one and only one dopaminergic measurement, one set of trial history terms, and one movement state per time-slice (see Materials and methods: ‘Single-trial probabilistic movement state decoding model, model selection’). (B) Model fit weights. Model ID: corresponds to the predictors included from the schematic. X-axis labels: the predictor ID from the schematic. Predictor weights were averaged across time-slices. (C) Model selection criteria. The model omitting the previous trial history predictors (predictors #1–4) was consistently the best model as selected by BIC, AIC, and AICc (results similar across metrics, BIC shown alone for clarity). Source data: Figure 8—source data 1.
Figure 8—figure supplement 2
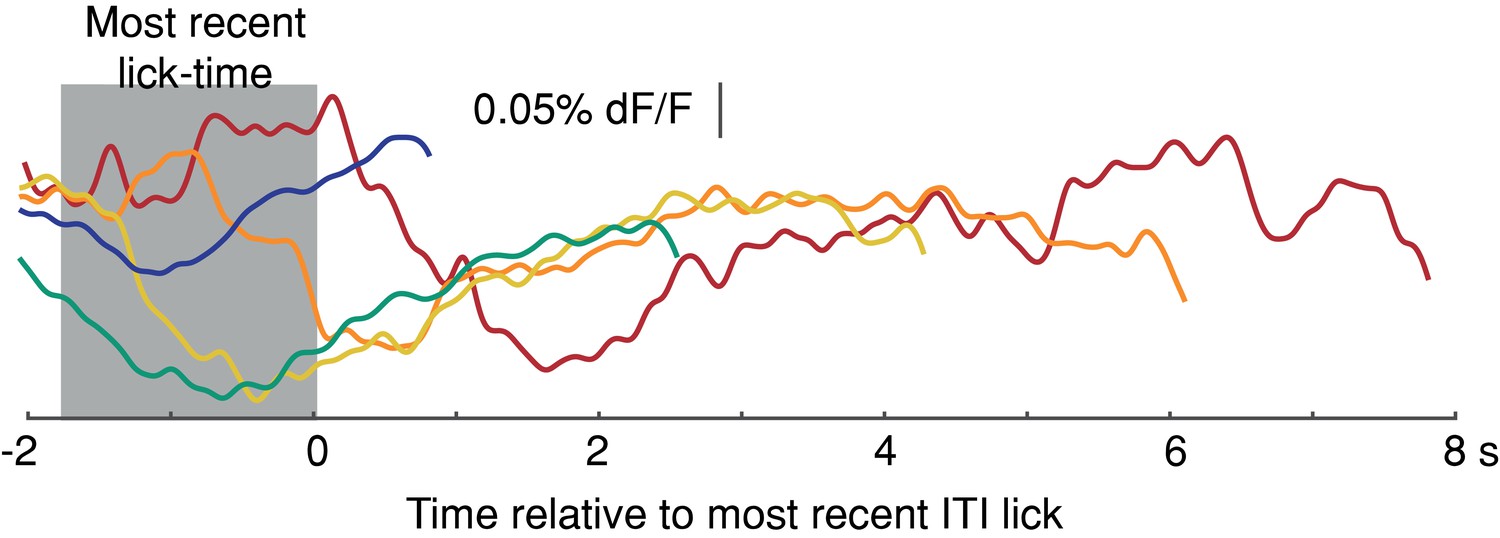
Average Intertrial Interval (ITI) GCaMP6f signals aligned to most recent previous lick-time.
Signals plotted up to onset of next spontaneous, self-initiated lick during the ITI (1 mouse, 5 sessions, truncated 150 ms before lick). Source data: Figure 8—source data 1.
Author response image 1
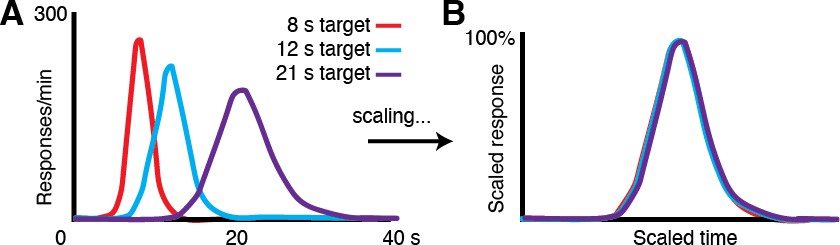
Performance in timing tasks follows the scalar property.
(A) Human response-time distributions for three different criterion times, 8, 12 and 21 s (Figure adapted from Allman et al., 2014 (Figures 2 and 3).; data from (Rakitin et al., 1998)). (B) When the distributions in A are scaled by the time of the peaks, they closely overlap, demonstrating the scalar property canonical to timing tasks across species.
Author response image 2
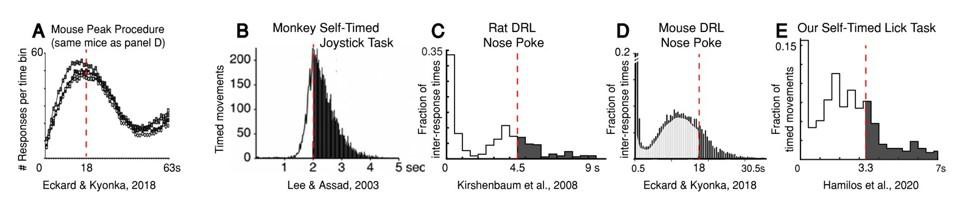
Animals across species frequently move before the criterion time during timing tasks, even at the expense of reward.
Author response image 3
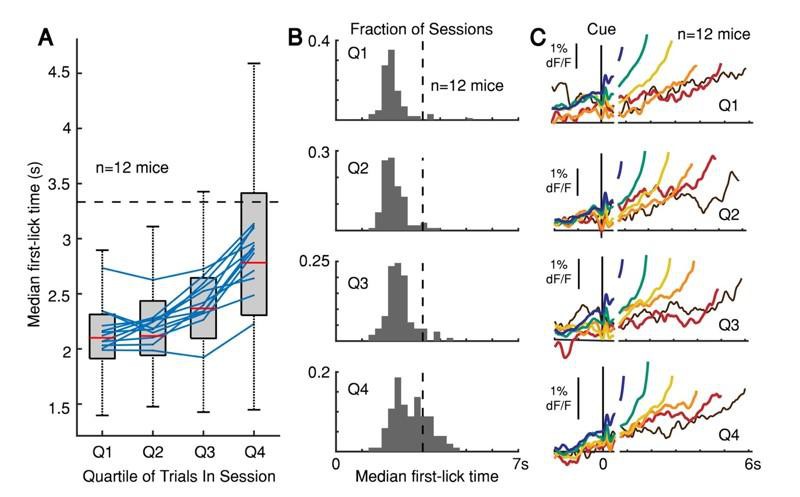
The peak of the timing distribution becomes later over the course of a behavioral session, but the pattern of dopaminergic responses as a function of movement time does not change.
(A) Median first-lick time divided into quartiles across sessions (only first-licks between 0.7-7 s considered to exclude rapid reactions and licks occurring after end-of-trial). Boxplot shown for individual photometry sessions with at least 100 first-licks (102 sessions total, red line: median, box: 25-75th percentiles, whiskers: 1.5 IQR). Blue lines: individual animal averages across sessions; n=12 mice. (B) Histograms of median first-lick time for each of the 102 sessions shown in A. (C) Corresponding SNc GCaMP6f signals from DAN cell bodies averaged separately for each quartile, aligned both on cue onset (left) and first-lick-time (right). Traces plotted to 150 ms before first-lick to exclude movement-related response. Trials pooled into bins of 1 s each, e.g., blue: 1-2 s, green: 2-3 s… etc.
Author response image 4
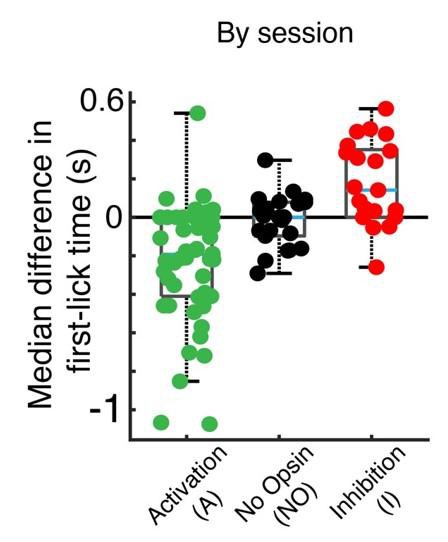
Original by-session figure compared to by-animal figure (figure 7—figure supplement 3C).
Author response image 5
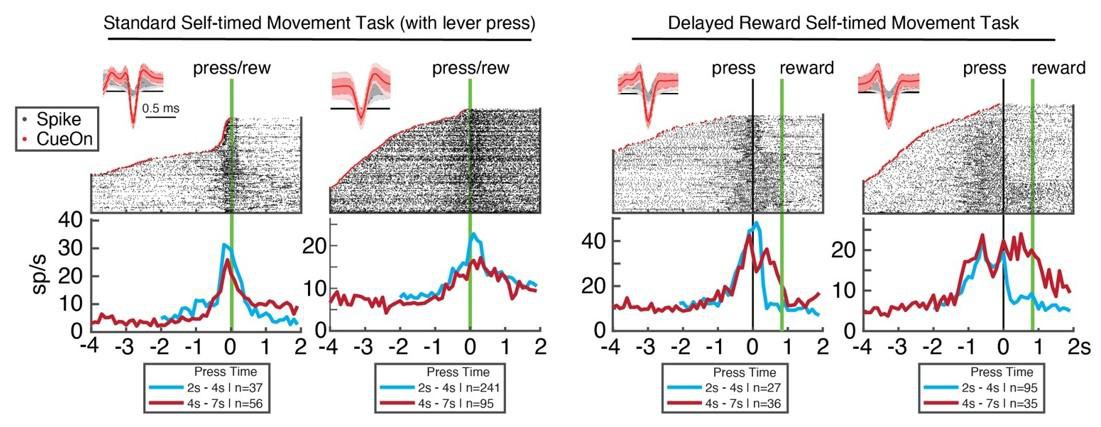
Ramping of putative DAN spiking rates peaks at the time of self-timed movement initiation, not the time of reward delivery.
Tables
Key resources table
| Reagent type (species) or resource | Designation | Source or reference | Identifiers | Additional information |
|---|---|---|---|---|
| Strain, strain background (M. musculus) | DAT-Cre | The Jackson Laboratory, Bar Harbor, ME | B6.SJL-Slc6a3tm1.1(cre)Bkmm/JRRID:IMSR_JAX:020080 | Cre expression in dopaminergic neurons |
| Strain, strain background (M. musculus) | Wild-type | The Jackson Laboratory, Bar Harbor, ME | C57BL/6RRID:IMSR_JAX:000664 | |
| Other | tdTomato (“tdt”) | UNC Vector Core, Chapel Hill, NC | AAV1-CAG-FLEX-tdT | Virus, for control photometry expression |
| Other | gCaMP6f | Penn Vector Core, Philadelphia, PA | AAV1.Syn.Flex.GCaMP6f.WPRE.SV40 | Virus, for photometry expression |
| Other | DA2m | Vigene, Rockville, MD | AAV9-hSyn-DA4.4(DA2m) | Virus, for photometry expression |
| Other | dLight1.1 | Lin Tian Lab; Children’s Hospital Boston Viral Core, Boston, MA | AAV9.hSyn.dLight1.1.wPRE | Virus, for photometry expression |
| Other | turboRFP | Penn Vector Core | AAV1.CB7.CI.TurboRFP.WPRE.rBG | Virus, for control photometry expression |
| Other | ChR2 | UNC Vector Core, Chapel Hill, NC | AAV5-EF1a-DIO-hChR2(H134R)-EYFP-WPRE-pA | Virus, for opsin expression |
| Other | ChrimsonR | UNC Vector Core, Chapel Hill, NC | AAV1-hSyn-FLEX-ChrimsonR-tdT | Virus, for opsin expression |
| Other | stGtACR2 | Addgene/Janelia Viral Core, Ashburn, VA | AAV2/8-hSyn1-SIO-stGtACR2-FusionRed | Virus, for opsin expression |
| Software, algorithm | Matlab | Mathworks | Matlab2018B | For most analyses |
| Software, algorithm | Julia Programming Language | The Julia Project | Julia 1.5.3 | For probabilistic models |
| Software, algorithm | Gen.jl | The Gen Team | Gen.jl | For probabilistic models |
Additional files
Download links
A two-part list of links to download the article, or parts of the article, in various formats.
Downloads (link to download the article as PDF)
Open citations (links to open the citations from this article in various online reference manager services)
Cite this article (links to download the citations from this article in formats compatible with various reference manager tools)
Slowly evolving dopaminergic activity modulates the moment-to-moment probability of reward-related self-timed movements
eLife 10:e62583.
https://doi.org/10.7554/eLife.62583


