Structural and mechanistic basis of the EMC-dependent biogenesis of distinct transmembrane clients
- Molecular, Cellular, and Computational Biophysics Graduate Program, University of California, San Francisco, United States
- Department of Biochemistry and Biophysics, University of California, San Francisco, United States
- Department of Biology, Whitehead Institute, MIT, United States
- Department of Cellular and Molecular Pharmacology, University of California, San Francisco, United States
- Department of Molecular Machines and Signaling, Max Planck Institute of Biochemistry, Germany
- Biomedical Sciences Graduate Program, University of California, San Francisco, United States
- Department of Pharmaceutical Chemistry, University of California, San Francisco, United States
- Howard Hughes Medical Institute, United States
Figures
Figure 1 with 9 supplements
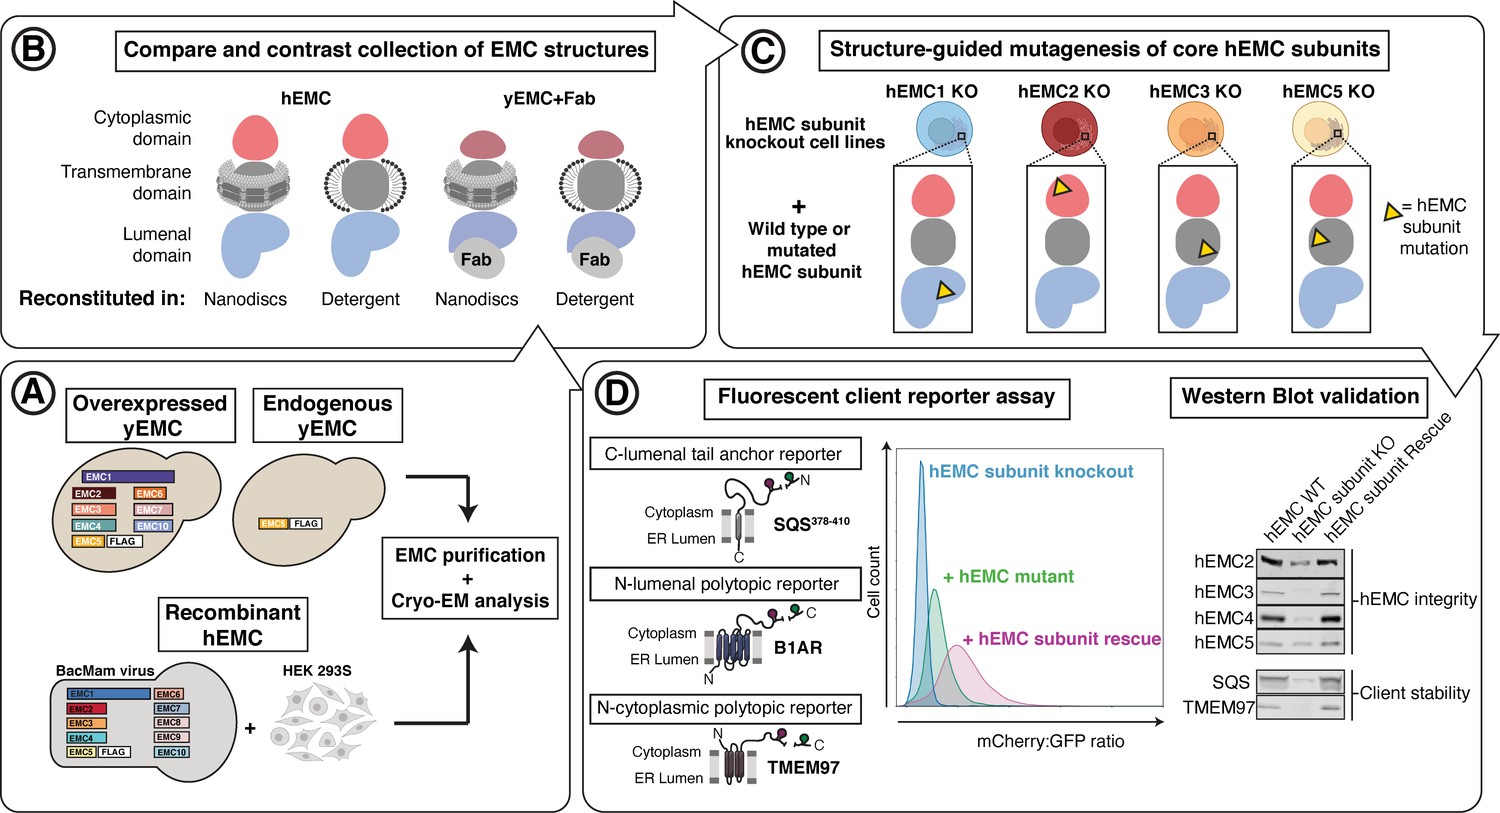
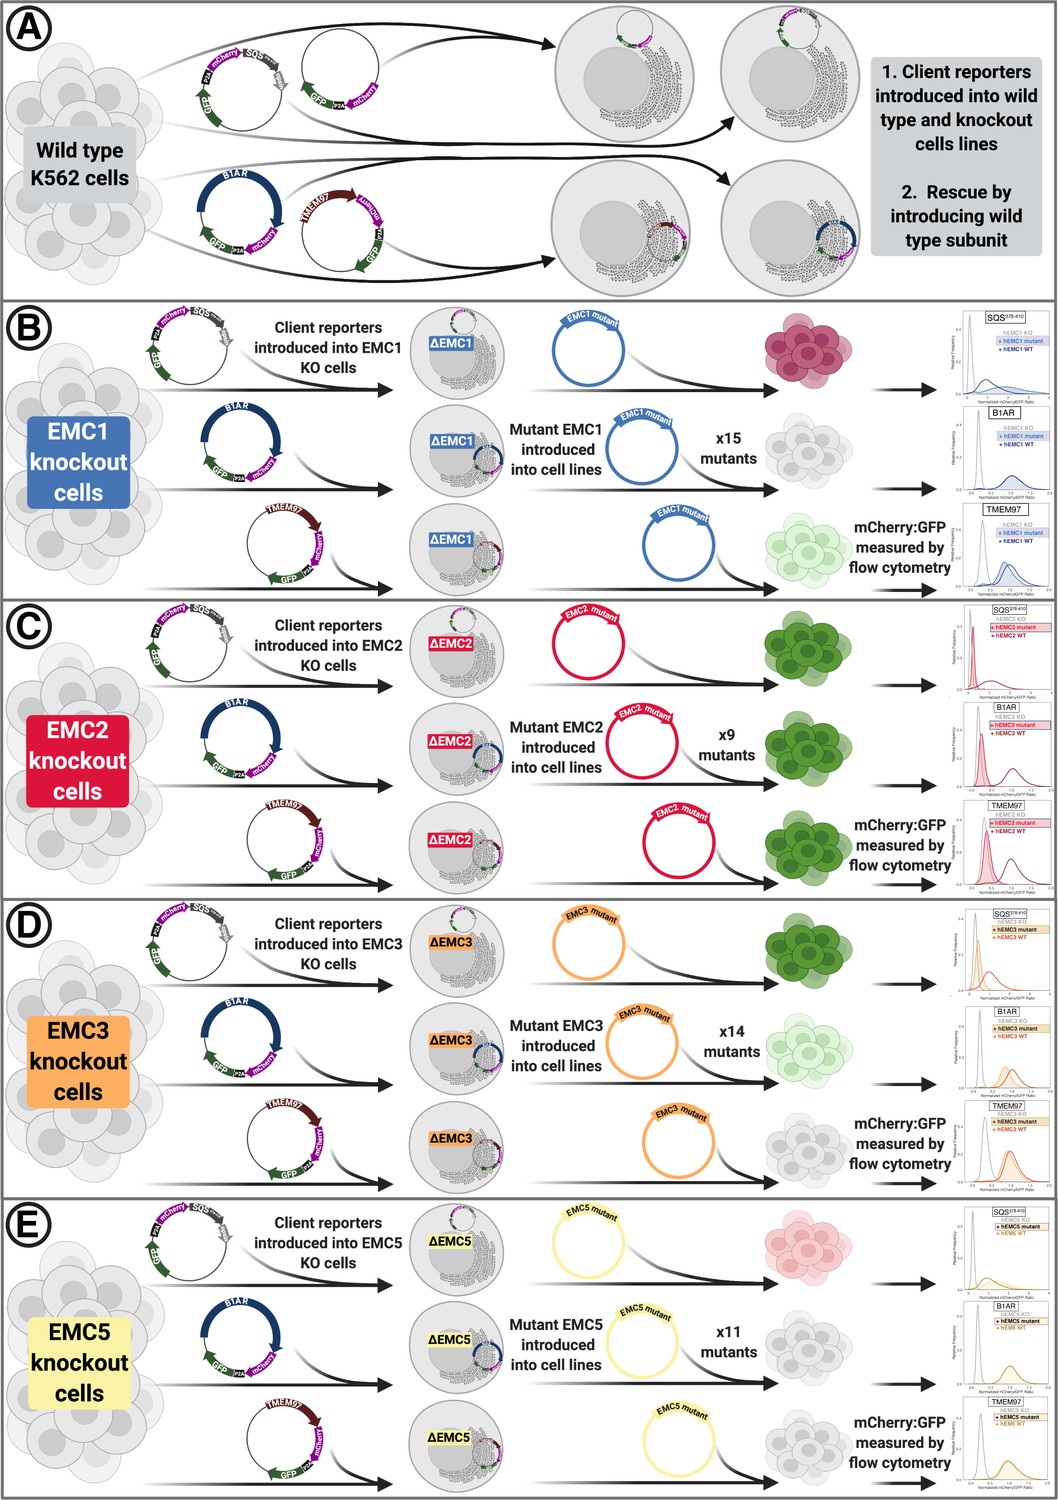
Experimental strategy for the dissection of EMC function.
Schematic representation of the combined structural and mutational approach to dissect EMC function. (A) yEMC was purified either by overexpression of all subunits together and affinity pulldown with 3xFlag-tagged yEMC5 or by pulldown of endogenous yEMC proteins using an affinity pulldown with 3xFlag-tagged yEMC5. For hEMC, all subunits were overexpressed together with Flag-tagged EMC5 via a single recombinant BacMam virus. Both yEMC and hEMC were purified by column chromatography and subjected to cryo-EM analysis. (B) The obtained collection of cryo-EM structures of yEMC and hEMC in lipid nanodiscs or detergent micelles were compared to identify similarities and differences. (C) Structure-guided mutagenesis was performed across four core hEMC subunits: hEMC1, hEMC2, hEMC3, and hEMC5 in mammalian K562 cells. (D) Each hEMC subunit knockout (KO) cell line was individually transduced with three different fluorescent client reporters: SQS378-410, full-length B1AR, and full-length TMEM97. Mutant hEMC subunits were then introduced into the corresponding subunit KO cell lines carrying each of the three fluorescent hEMC client reporters. hEMC client stability in each mutant hEMC subunit cell line was assessed by quantifying the mCherry-to-GFP ratio. Western blotting was performed for each mutant-transduced cell line to assess EMC integrity (by immunoblotting for hEMC subunits) as well as client stability (by immunoblotting for hEMC clients) compared against both wild-type (WT) and KO cell lines.
Figure 1—figure supplement 1
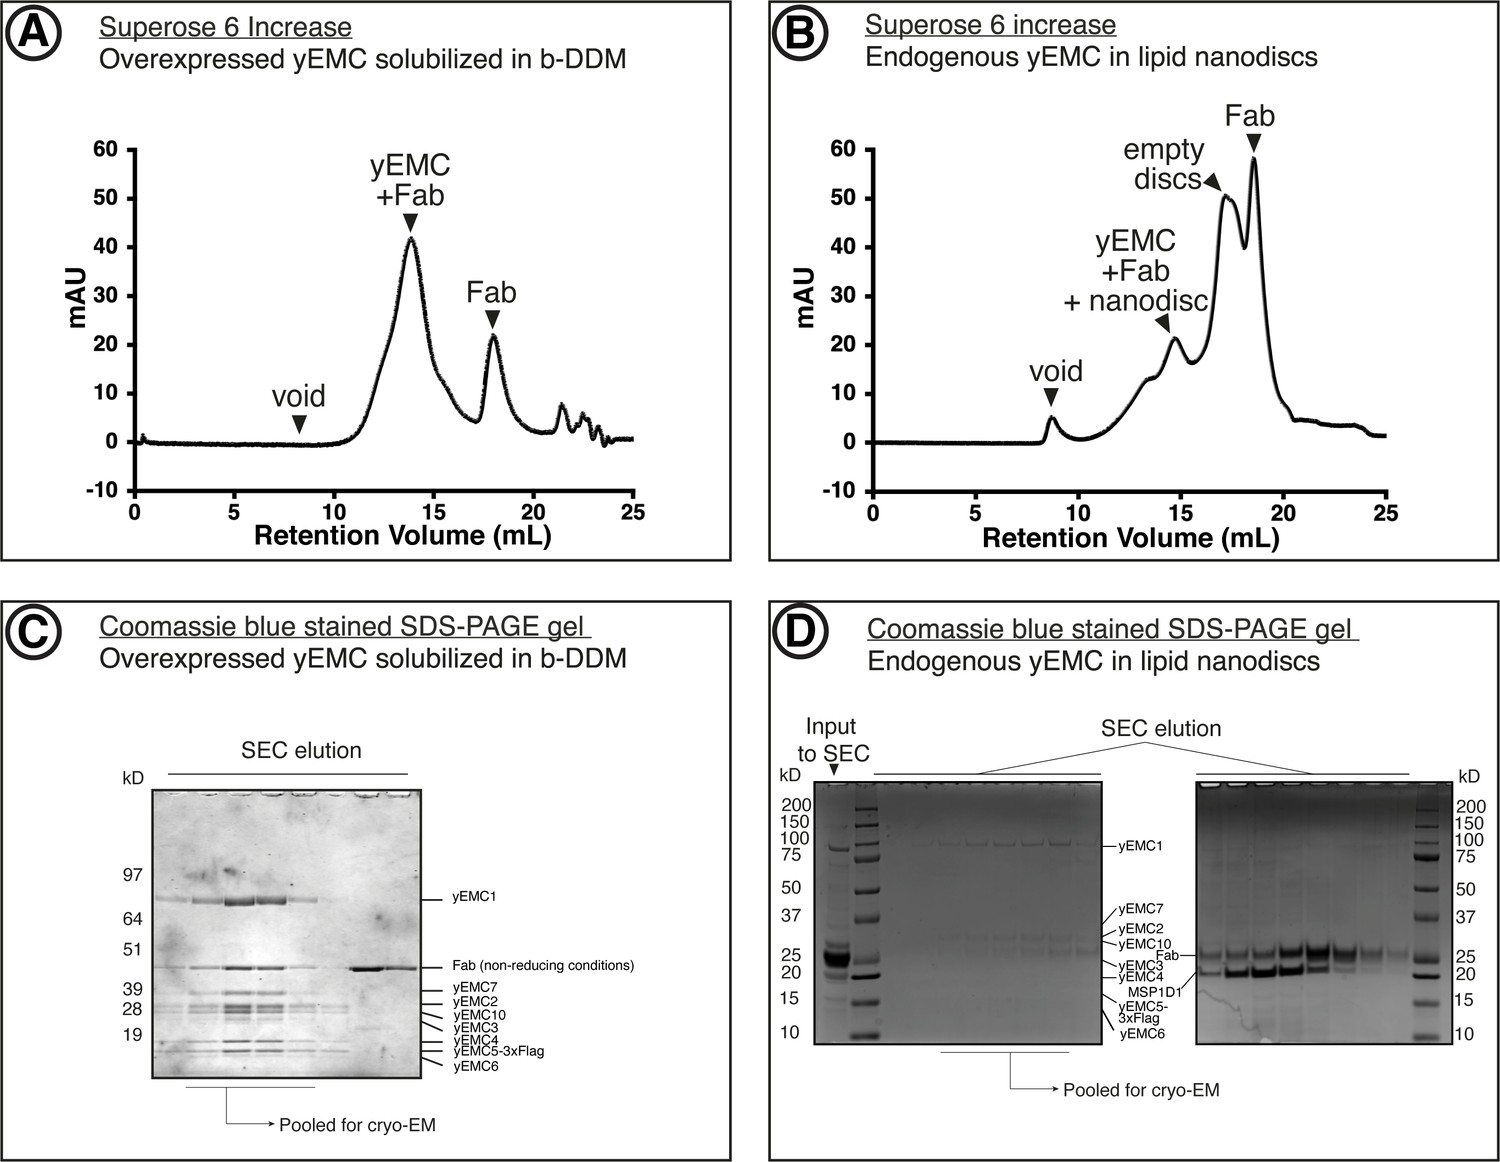
Purification of yEMC.
(A) Size-exclusion chromatography (SEC) purification of overexpressed yEMC+FAb in DDM detergent micelles. (B) SEC purification of endogenous yEMC + FAb in MSP1D1 nanodisc. (C) Coomassie-stained SDS-PAGE analysis of SEC elution fractions from (A). The expected molecular weight of the subunits are as follows: yEMC1 - 87 kDa, yEMC2 - 34 kD, yEMC7 - 27 kD, yEMC10 - 25 kD, yEMC3 - 23 kD, yEMC4 - 21 kD, yEMC5-3xflag - 17 kD, yEMC6 - 12 kD. (D) Coomassie-stained SDS-PAGE analysis of SEC elution fractions from (B).
Figure 1—figure supplement 2
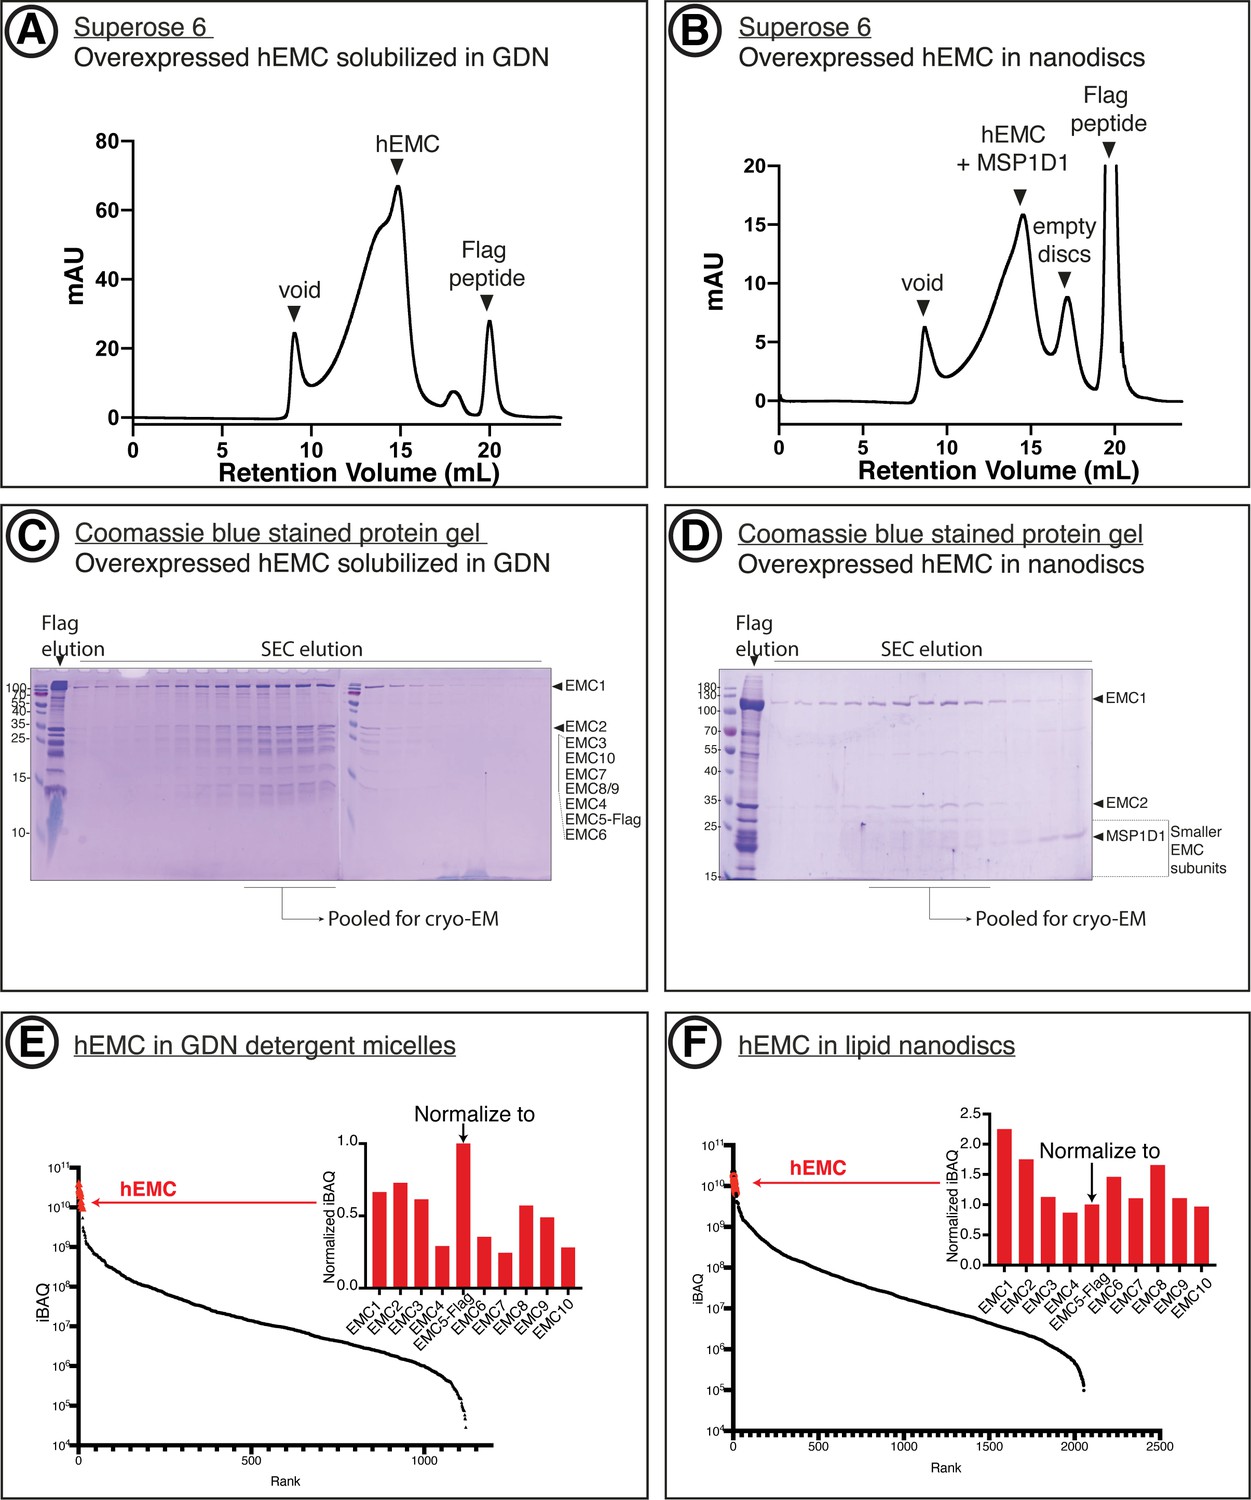
Purification of recombinant hEMC.
(A) Size-exclusion chromatography (SEC) purification of hEMC in GDN detergent. (B) SEC purification of hEMC reconstituted in MSP1D1 nanodiscs. (C) Coomassie-stained SDS-PAGE analysis of the SEC elution fractions from (A). The expected molecular weight of the subunits are as follows: hEMC1 - 110 kDa, hEMC2 - 35 kD, hEMC3 - 30 kD, hEMC10 - 25 kD, hEMC7 - 24 kD, hEMC8/9 - 24 kD, hEMC4 - 20 kD, hEMC5-flag - 16 kD, hEMC6 - 12 kD. (D) Coomassie-stained SDS-PAGE analysis of the SEC elution fractions from (B). (E) Mass spectrometry analysis of purified hEMC in GDN following SEC. iBAQ values for identified proteins in the sample are sorted in descending order along the X-axis. hEMC subunits form a cluster (red) and their normalized iBAQ values (against EMC5-Flag) are shown in the inset. (F) As in (E) for hEMC in lipid nanodiscs.
Figure 1—figure supplement 3
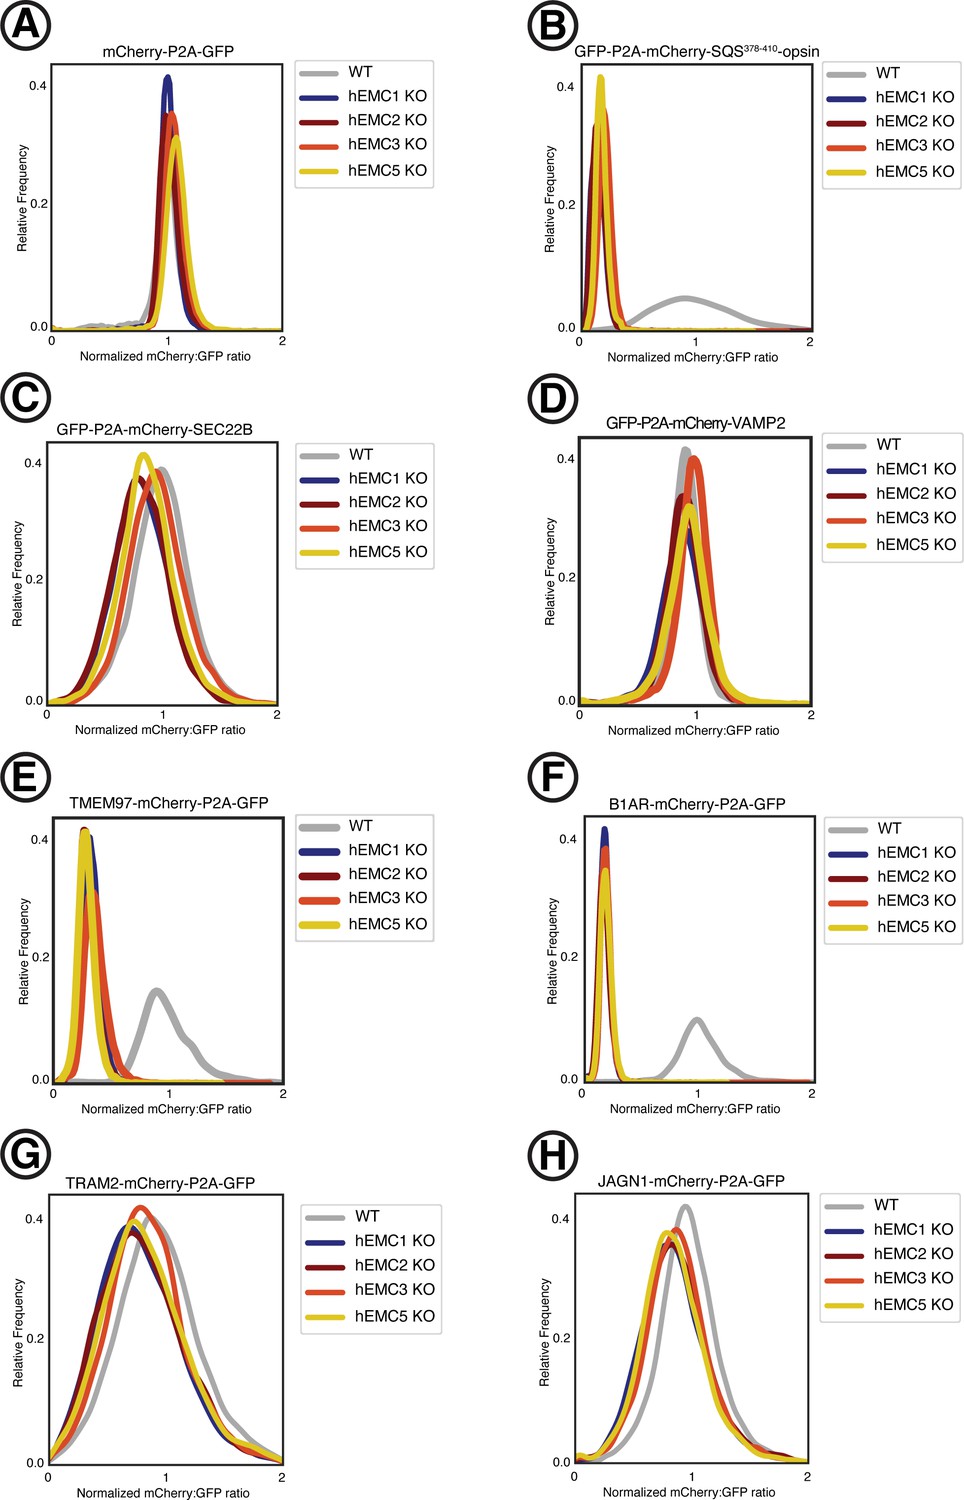
Fluorescent reporter cell line generation.
Fluorescent reporter cell lines were created by introducing lentivirus containing the fluorescently-tagged client reporters into five K562 cells lines: (1) wild type, (2) hEMC1 knockout (3) hEMC2 knockout, (4) hEMC3 knockout, and (5) hEMC5 knockout. A construct with mCherry-P2A-GFP was introduced into each cell line (control). This process was repeated individually for three tail anchor membrane proteins with N-terminal tags: one EMC-dependent tail anchor client membrane protein (SQS) and two EMC-independent tail anchor membrane proteins (SEC22B, VAMP2). This process was repeated individually for four polytopic membrane proteins with C-terminal tags: an EMC-dependent polytopic membrane protein client with the N-terminus in the ER lumen (B1AR), an EMC-dependent polytopic membrane protein client with the N-terminus in the cytoplasm (TMEM97), and two EMC-independent polytopic membrane proteins with N-termini in the cytoplasm (TRAM2, JAGN1). (A) Ratio of mCherry to GFP measured by flow cytometry for mCherry-P2A-GFP construct for each of the five cell lines. (B) Same as (A) for GFP-P2A-mCherry-SQS378-410-opsin. (C) Same as (A) for GFP-P2A-mCherry-SEC22B. (D) Same as (A) for GFP-P2A-mCherry-VAMP2. (E) Same as (A) for TMEM97-mCherry-P2A-GFP. (F) Same as (A) for B1AR-mCherry-P2A-GFP. (G) Same as (A) for TRAM2-mCherry-P2A-GFP. (H) Same as (A) for JAGN1-mCherry-P2A-GFP.
Figure 1—figure supplement 4
Overview of functional assays.
(A) Into each K562 cell line (WT or knockout of respective subunit), fluorescent client reporters were introduced lentivirally. Subsequently, knockout phenotypes were rescued by re-introducing the wild-type hEMC subunit. (B) After introducing client reporters into hEMC1 knockout cell lines cells were sorted to obtain a pure population. Then mutant hEMC subunits were re-introduced lentivirally and selected with puromycin. Upon reaching a pure population, cells lines were subjected to flow cytometry to measure abundance of mCherry and GFP for each client reporter in each mutant background. Cell pellets were collected for subsequent western blot analysis for each mutant in WT and knockout cell line in a cell line with an mCherry-P2A-GFP reporter. (C) Same as (B) for hEMC2. (D) Same as (B) for hEMC3. (E) Same as (B) for hEMC5.
Figure 1—figure supplement 5

Western blots for EMC1 and EMC2.
Western blots of endogenous human EMC subunits and client proteins functional assay to check for complex stability and endogenous protein levels. For each mutant, abundance of several hEMC subunits as well as several representative client proteins were tested. (A) Western blots for hEMC1 mutant cell lines, blotting for hEMC subunits hEMC1, hEMC3, hEMC4, and hEMC10. In addition, levels of three endogenous client proteins (SQS, BCAP31, and TMEM97) were blotted for. Wild-type cells with the fluorescent reporter displayed in Lanes 1 and 16. hEMC1 knockout cells displayed in Lanes 2 and 17. hEMC1 knockout cells with reintroduction of wild-type hEMC1 shown in Lanes 3 and 18. (B) Western blots for hEMC2 mutant cell lines, blotting for hEMC subunits hEMC2, hEMC3, hEMC4, and hEMC5. In addition, levels of three endogenous client proteins (SQS, BCAP31, and TMEM97) were blotted for. Wild-type cells with the fluorescent reporter displayed in Lane 1. hEMC2 knockout cells displayed in Lane 2. hEMC2 knockout cells with reintroduction of wild-type hEMC2 shown in Lane 3. Mutant hEMC2 E206A+E209A+D252A is in Lane 10, flow cytometry of this mutant is not included. For the remaining mutants, both western blot and flow cytometry were conducted.
Figure 1—figure supplement 6
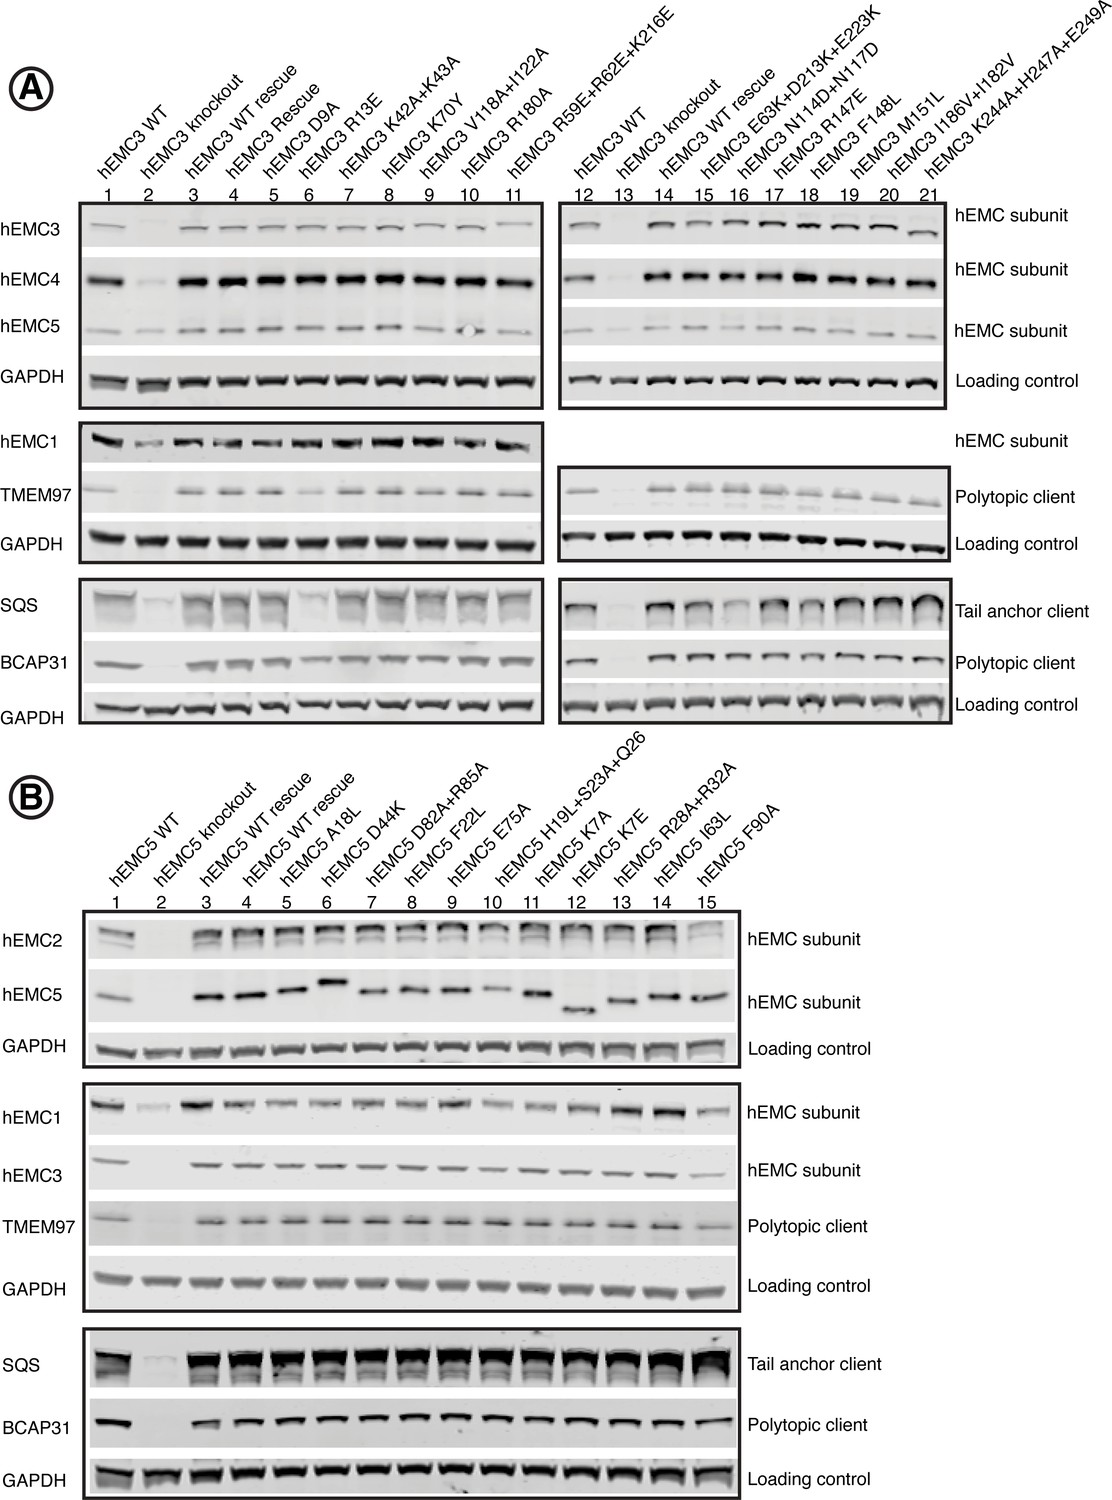
Western blots for EMC3 and EMC5.
Human functional assay to check for complex stability. For each mutant, abundance of several EMC subunits as well as several representative client proteins was tested. (A) Western blots for hEMC3 mutant cell lines, blotting for hEMC subunits hEMC1, hEMC3, hEMC4, and hEMC5. In addition, levels of three endogenous client proteins (SQS, BCAP31, and TMEM97) were blotted for. Wild-type cells with the fluorescent reporter displayed in Lanes 1 and 12. hEMC3 knockout cells displayed in Lanes 2 and 13. hEMC3 knockout cells with reintroduction of wild-type hEMC1 shown in Lanes 3 and 14. (B) Western blots for hEMC5 mutant cell lines, blotting for hEMC subunits hEMC1, hEMC2, hEMC3, and hEMC5. In addition, levels of three endogenous client proteins (SQS, BCAP31, and TMEM97) were blotted for. Wild-type cells with the fluorescent reporter displayed in Lane 1. hEMC5 knockout cells displayed in Lane 2. hEMC5 knockout cells with reintroduction of wild-type hEMC5 shown in Lanes 3 and 4.
Figure 1—figure supplement 7
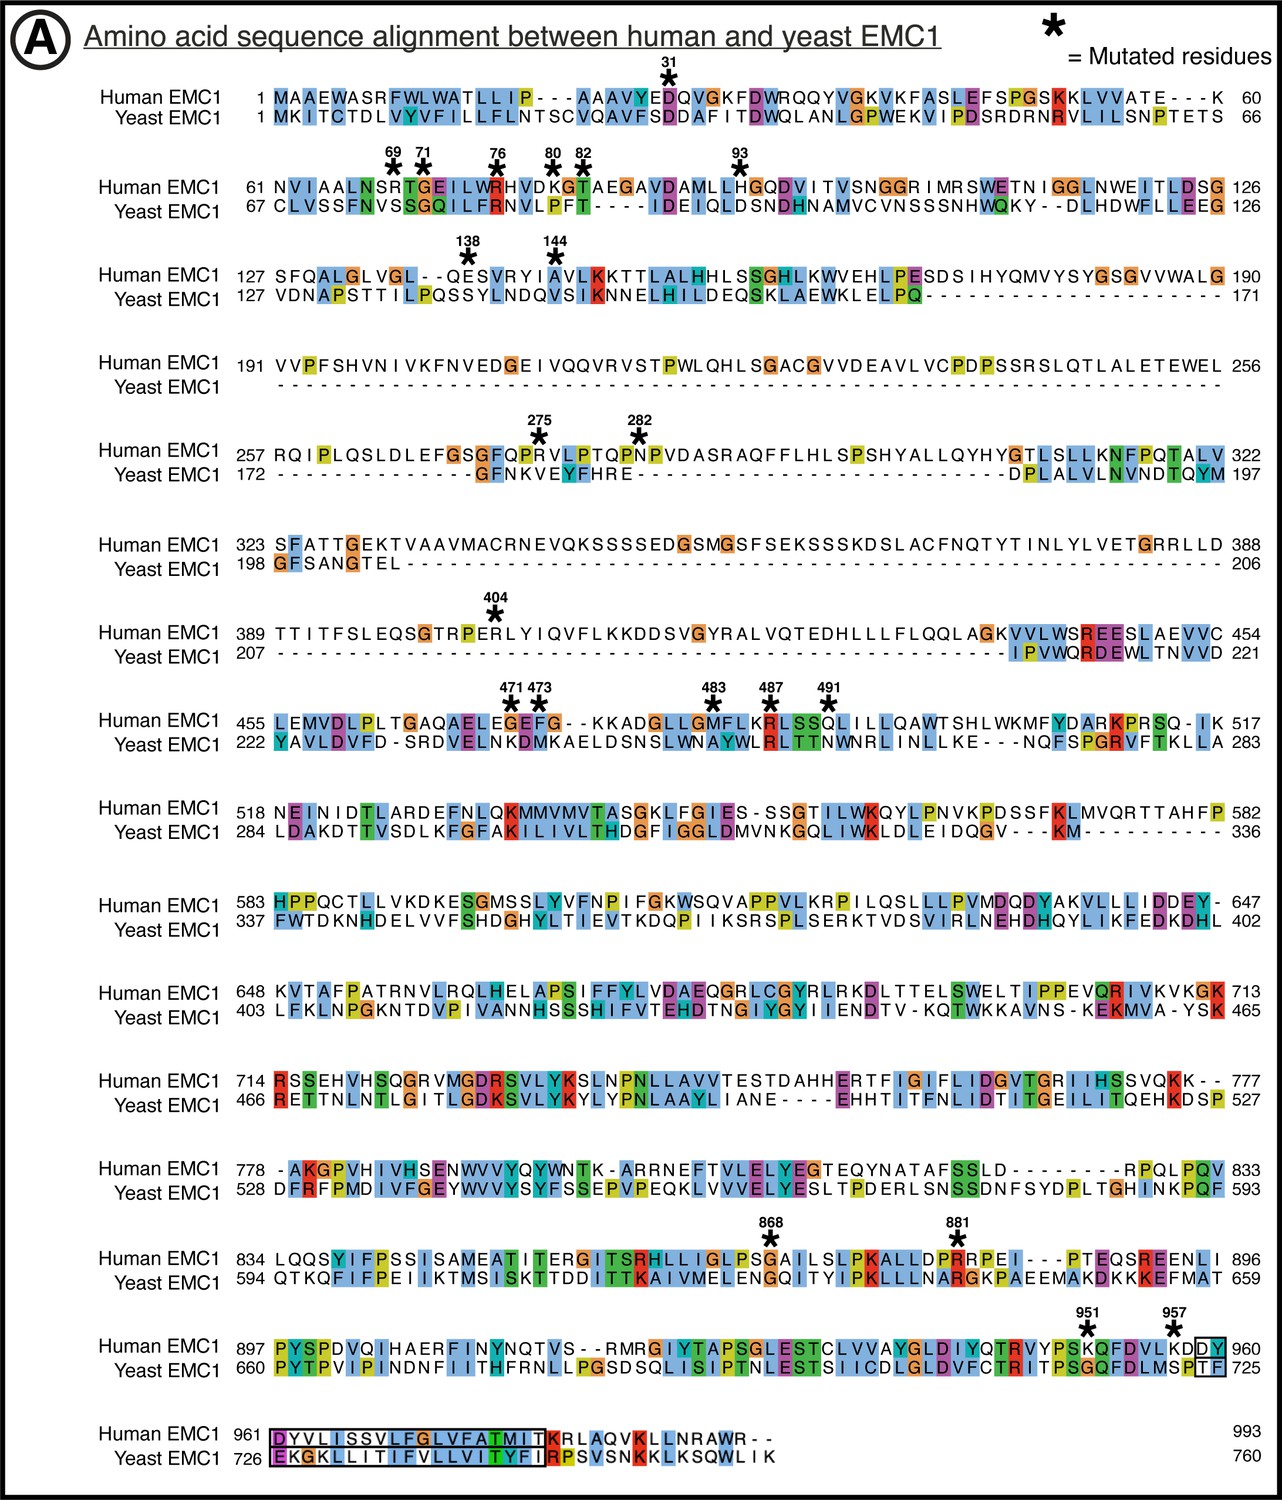
Amino acid conservation of EMC1.
(A) Yeast (yEMC sequence from uniprot entry for Saccharomyces cerevisiae EMC1, sequence identifier: P25574-1) to human (hEMC sequence from uniprot entry for Homo sapiens EMC1 sequence identifier: Q8N766-1). Sequence alignment of EMC1 by T-Coffee PSI-Coffee homology extension online server. Colored by ClustalX coloring –Blue for hydrophobic (AILMFWV); Red for positive charge (KR); Magenta for negative charge (ED); Green for polar (NQST); Pink for cysteines (C); Orange for glycines (G); Yellow for prolines (P); Cyan for aromatic (HY); No color for any residues other than proline or glycine that are not conserved. Residues represented within hEMC mutagenesis are marked with hEMC amino acid sequence numbering and (*). Transmembrane helices are outlined in black, as annotated in uniprot entries.
Figure 1—figure supplement 8
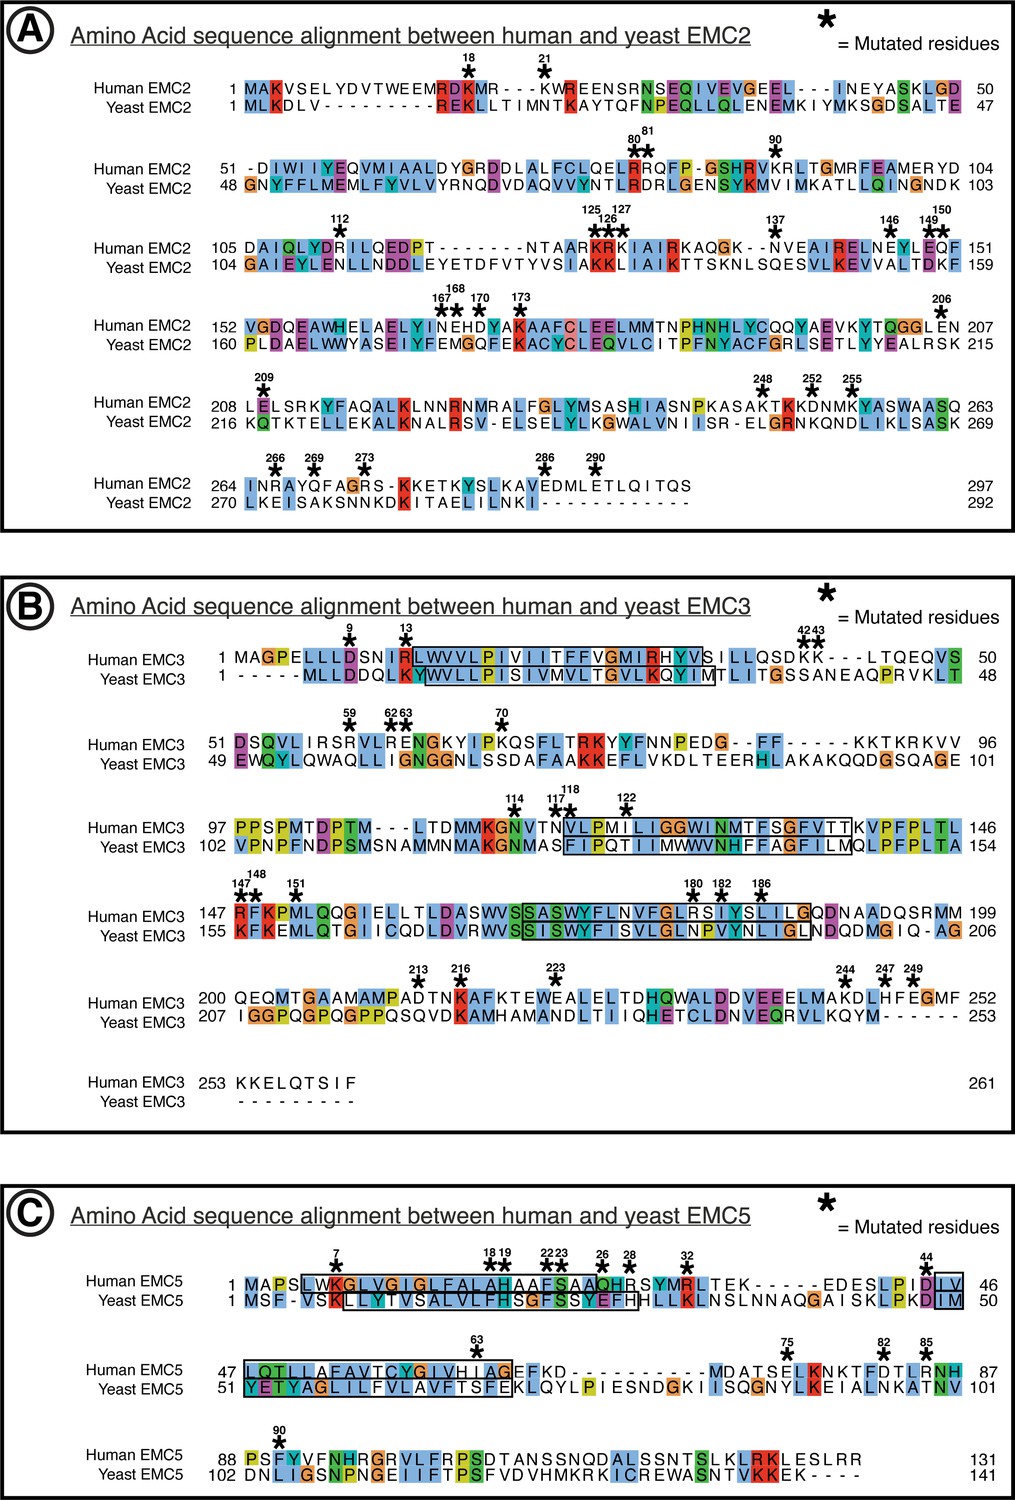
Amino acid conservation of EMC2, EMC3, EMC5.
Yeast to human sequence alignments. (A) Alignment of hEMC2 and yEMC2. Computed by t-Coffee PSI-Coffee homology extension online server. Colored by ClustalX coloring – Blue for hydrophobic (AILMFWV); Red for positive charge (KR); Magenta for negative charge (ED); Green for polar (NQST); Pink for cysteines (C); Orange for glycines (G); Yellow for prolines (P); Cyan for aromatic (HY); No color for any residues other than proline or glycine that are not conserved. Residues represented within hEMC mutagenesis experiments are marked with hEMC amino acid sequence numbering and (*). Transmembrane segments are outlined in black, as annotated in uniprot entries. (B) Same as (A) for hEMC3 and yEMC3. (C) Same as (A) for hEMC5 and yEMC5.
Figure 1—figure supplement 9

Genotyping of 10 mutants.
(A) Sanger sequencing of mutant aligned to wild-type sequence for hEMC1 T82M. (B) Sanger sequencing of mutant aligned to wild-type sequence for hEMC3 E63K+D213K+E223K. (C) Sanger sequencing of mutant aligned to wild-type sequence for hEMC1 A144T. (D) Sanger sequencing of mutant aligned to wild-type sequence for hEMC3 F148L. (E) Sanger sequencing of mutant aligned to wild-type sequence for hEMC1 G868R. (F) Sanger sequencing of mutant aligned to wild-type sequence for hEMC3 M151L. (G) Sanger sequencing of mutant aligned to wild-type sequence for hEMC1 R881C. (H) Sanger sequencing of mutant aligned to wild-type sequence for hEMC5 K7E. (I) Sanger sequencing of mutant aligned to wild-type sequence for hEMC3 R13E. (J) Sanger sequencing of mutant aligned to wild-type sequence for hEMC5 H19L+S23A+Q26L.
Figure 2 with 9 supplements
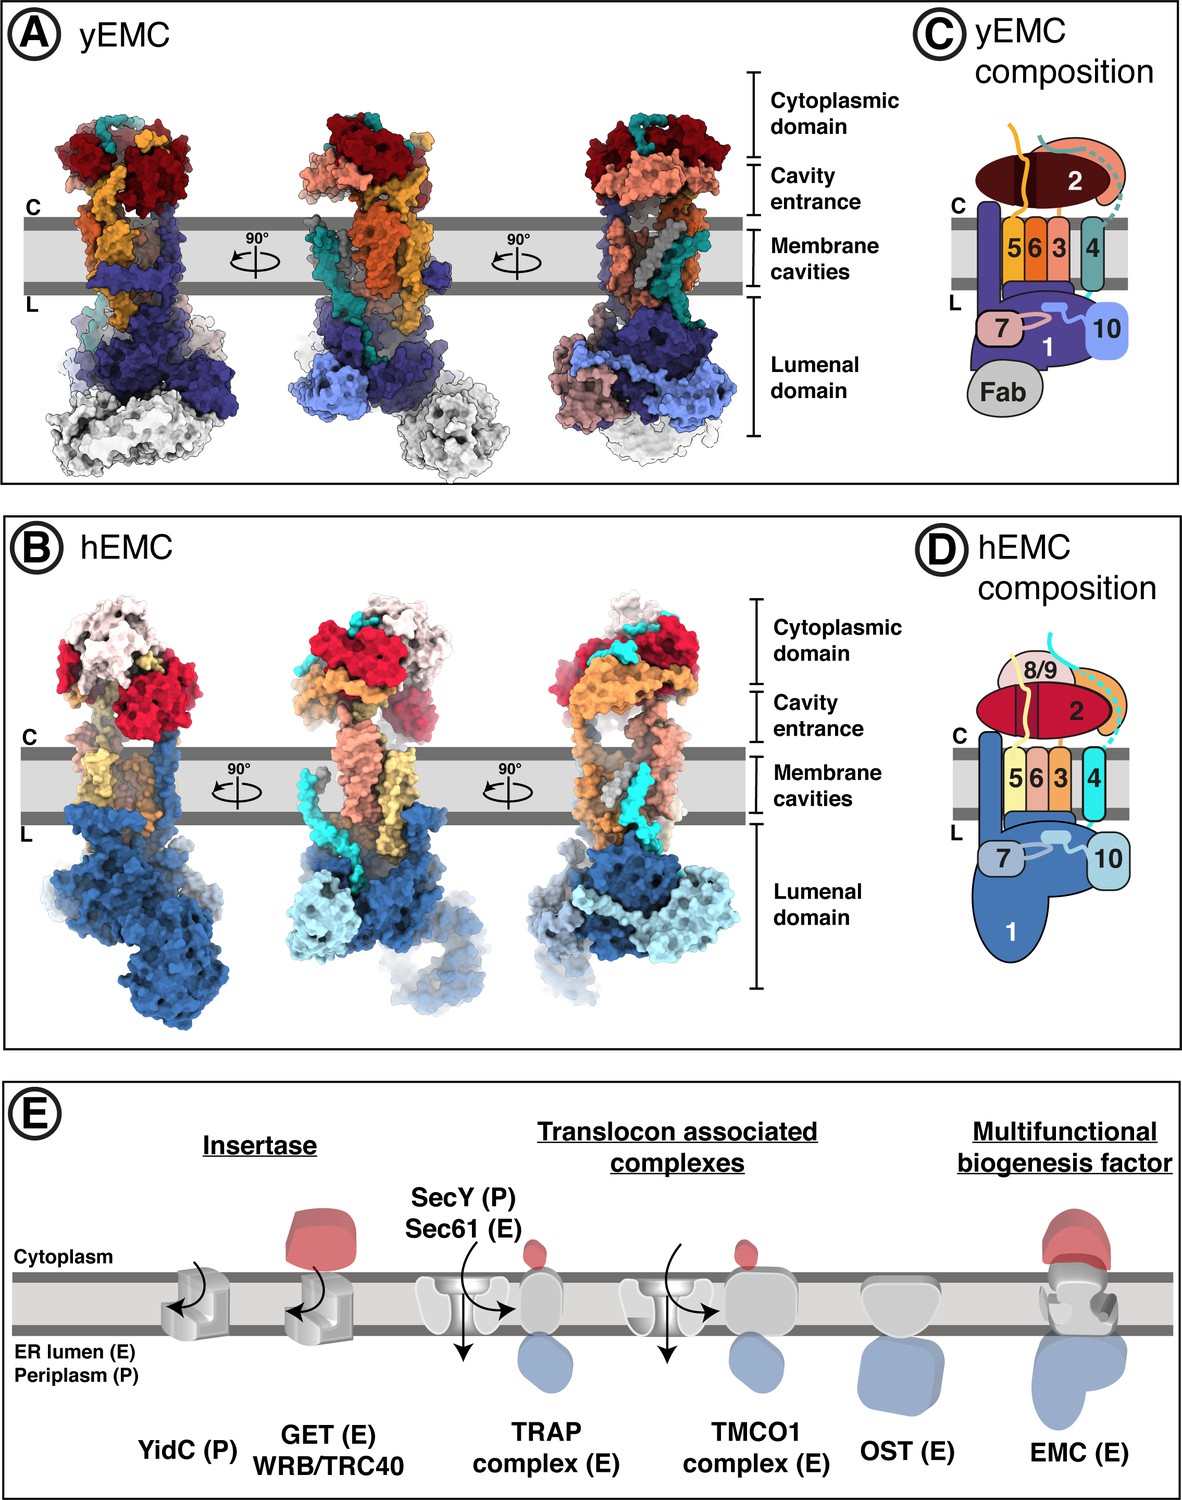
Overall structures of yeast and human EMC.
(A) Cryo-EM structure of yEMC in nanodiscs. Three orthogonal views of the yEMC cryo-EM structure shown as surface rendering. Gray bars delineate the approximate ER membrane boundaries with the cytoplasmic (C) and lumenal (L) sides indicated. The FAb molecule bound to the yEMC1 lumenal domain is colored in gray. (B) Cryo-EM structure of hEMC in nanodiscs. Labeling as in (A). (C) Subunit composition and color scheme of yEMC used throughout the manuscript. Dotted line indicates a portion of yEMC4 unresolved in the cryo-EM map and left unmodeled. (D) Subunit composition and color scheme of hEMC used throughout the manuscript. (E) Schematic depiction and comparison of the EMC architecture to known transmembrane protein biogenesis factors in the ER and the bacterial plasma membrane. Cytoplasmic, transmembrane and lumenal domains are depicted as cartoons colored red, gray and blue, respectively. E, eukaryotic; P, prokaryotic.
Figure 2—figure supplement 1
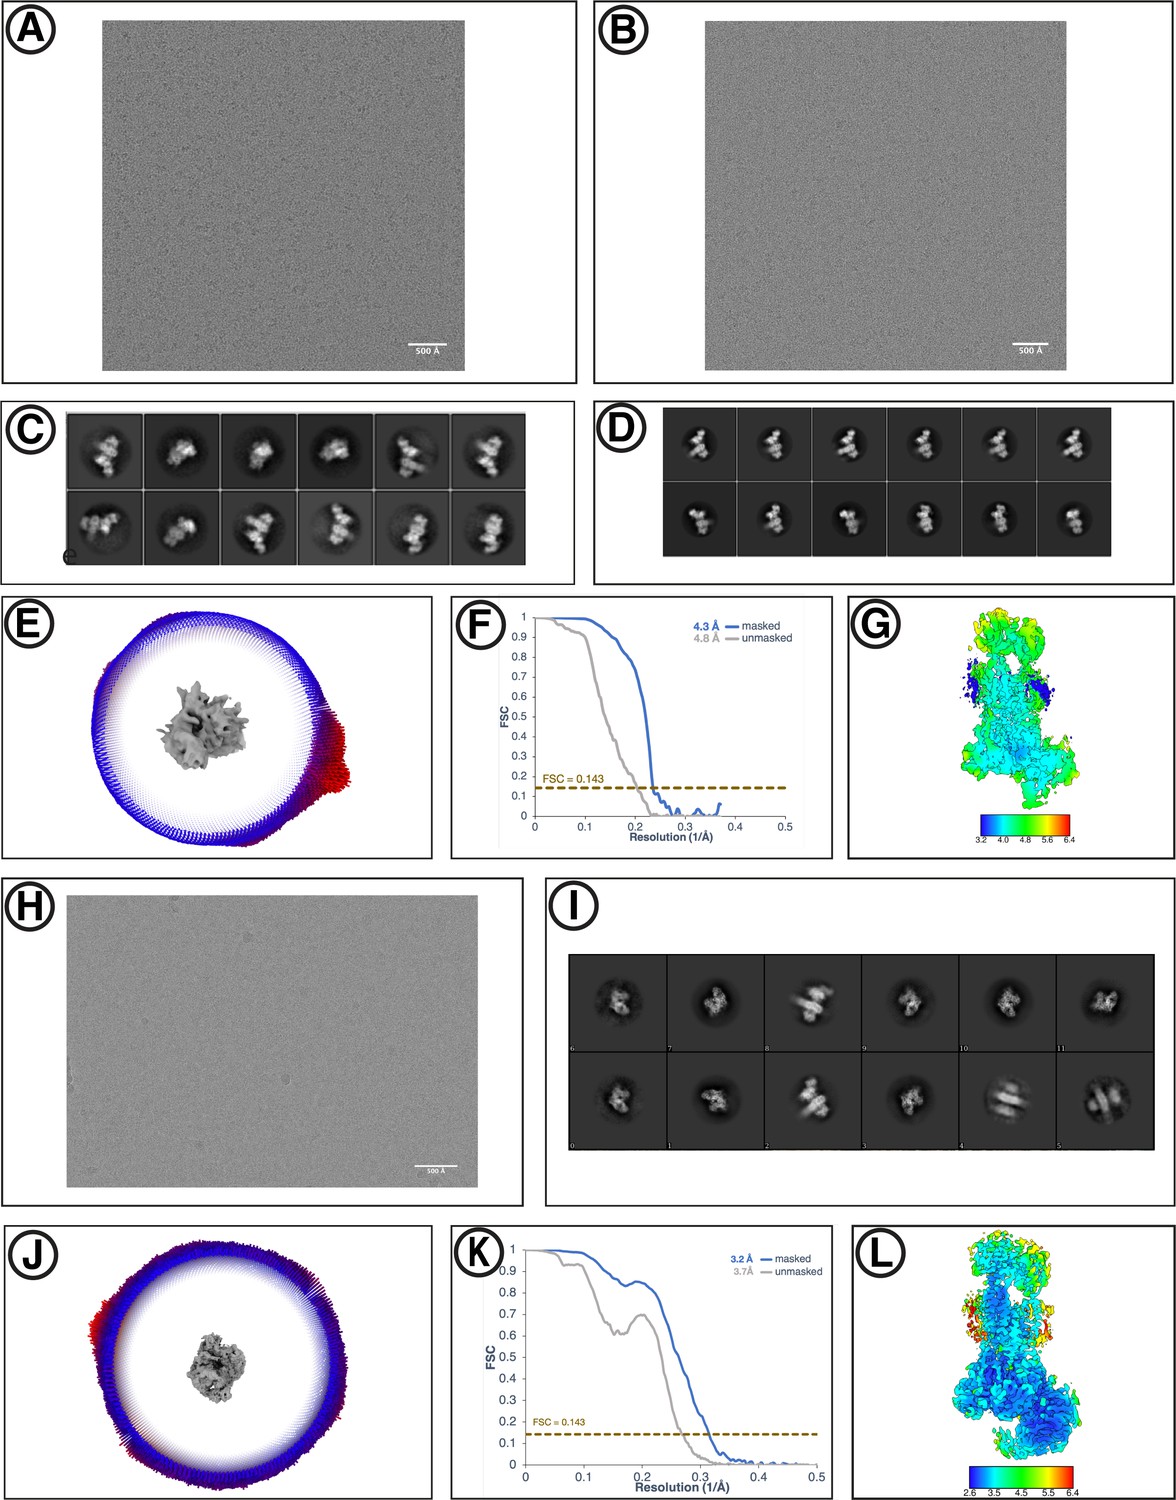
Cryo-EM reconstruction of yEMC.
(A) Representative motion-corrected micrograph for yEMC-FabE in DDM. Scale-bar = 500 Å. (B) Representative motion-corrected micrograph for yEMC-FabH in DDM. Scale-bar = 500 Å. (C–D) Gallery of 2D classes for the final consensus particle set of yEMC in DDM. (E) Angular distribution of the final consensus particle set of yEMC in DDM. (F) Gold-standard Fourier shell correlation (FSC) of the consensus yEMC DDM map. The FSC at 0.143 is indicated by a gold line. (G) A slice through the consensus yEMC DDM map colored by local resolution. (H) Representative motion-corrected micrograph for yEMC in nanodiscs. Scale-bar = 500 Å. (I) Gallery of 2D classes of yEMC in nanodiscs. (J) Angular distribution of the final consensus particle set of yEMC in nanodiscs. (K) Gold-standard Fourier shell correlation (FSC) of the consensus yEMC nanodisc map. The FSC at 0.143 is indicated by a gold line. (L) A slice through the consensus yEMC nanodisc map colored by local resolution.
Figure 2—figure supplement 2
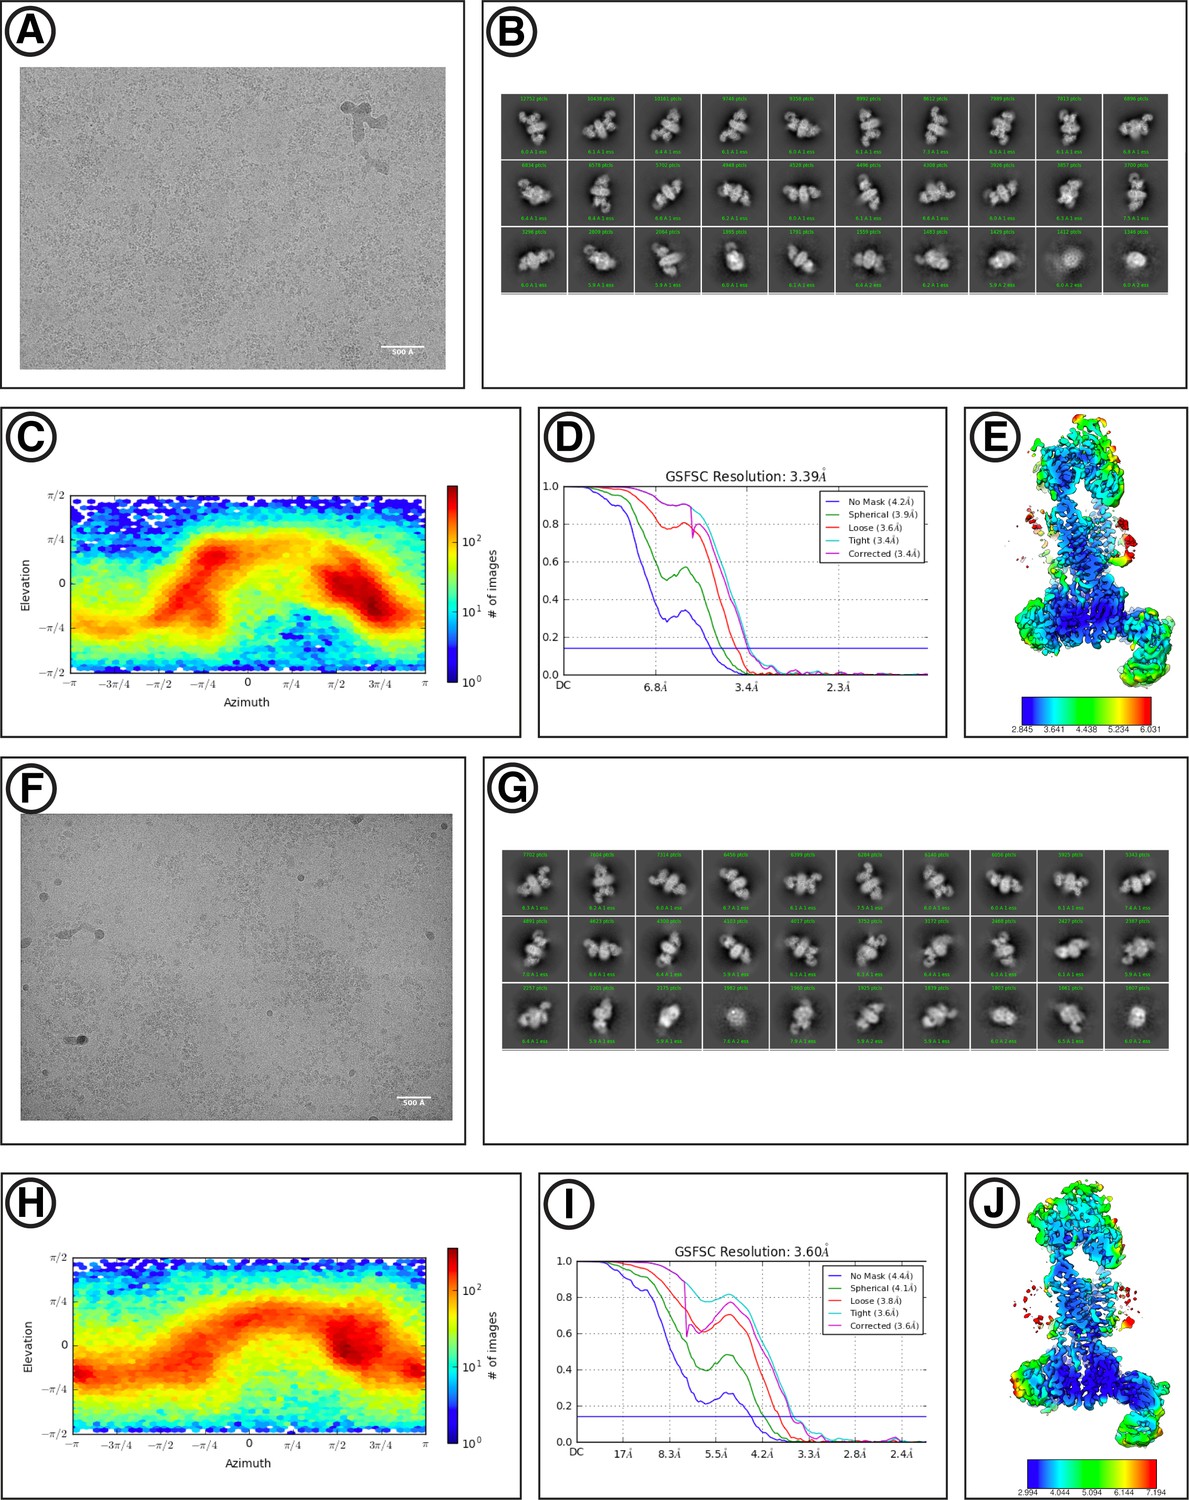
Cryo-EM reconstruction of hEMC.
(A) Representative motion-corrected micrograph for hEMC in nanodiscs. Scale-bar = 500 Å. (B) Gallery of 2D classes for the final consensus particle set of hEMC in nanodiscs. (C) Angular distribution of the final consensus particle set of hEMC in nanodiscs. (D) Gold-standard Fourier shell correlation (FSC) of the consensus hEMC nanodisc map. The FSC at 0.143 is indicated by a blue line. (E) A slice through the consensus hEMC nanodisc map colored by local resolution. (F–J) As for (a – e) but for hEMC in detergent.
Figure 2—figure supplement 3
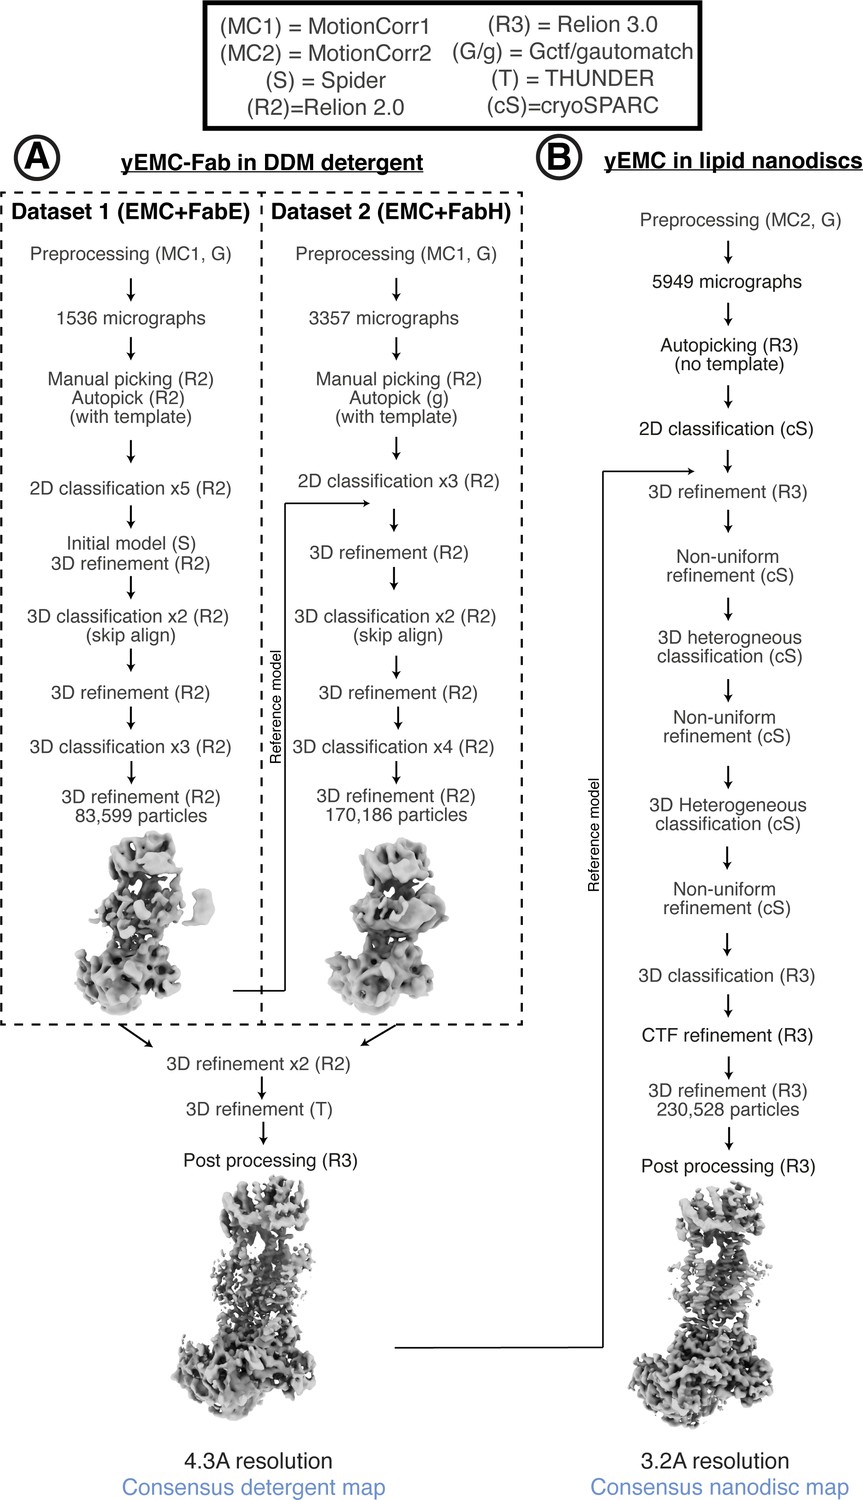
Cryo-EM data processing workflow for yEMC.
(A) Schematic of cryoEM data processing workflow for yEMC+Fab in b-DDM detergent micelles. (B) Schematic of cryoEM data processing workflow for yEMC+Fab in lipid nanodiscs.
Figure 2—figure supplement 4
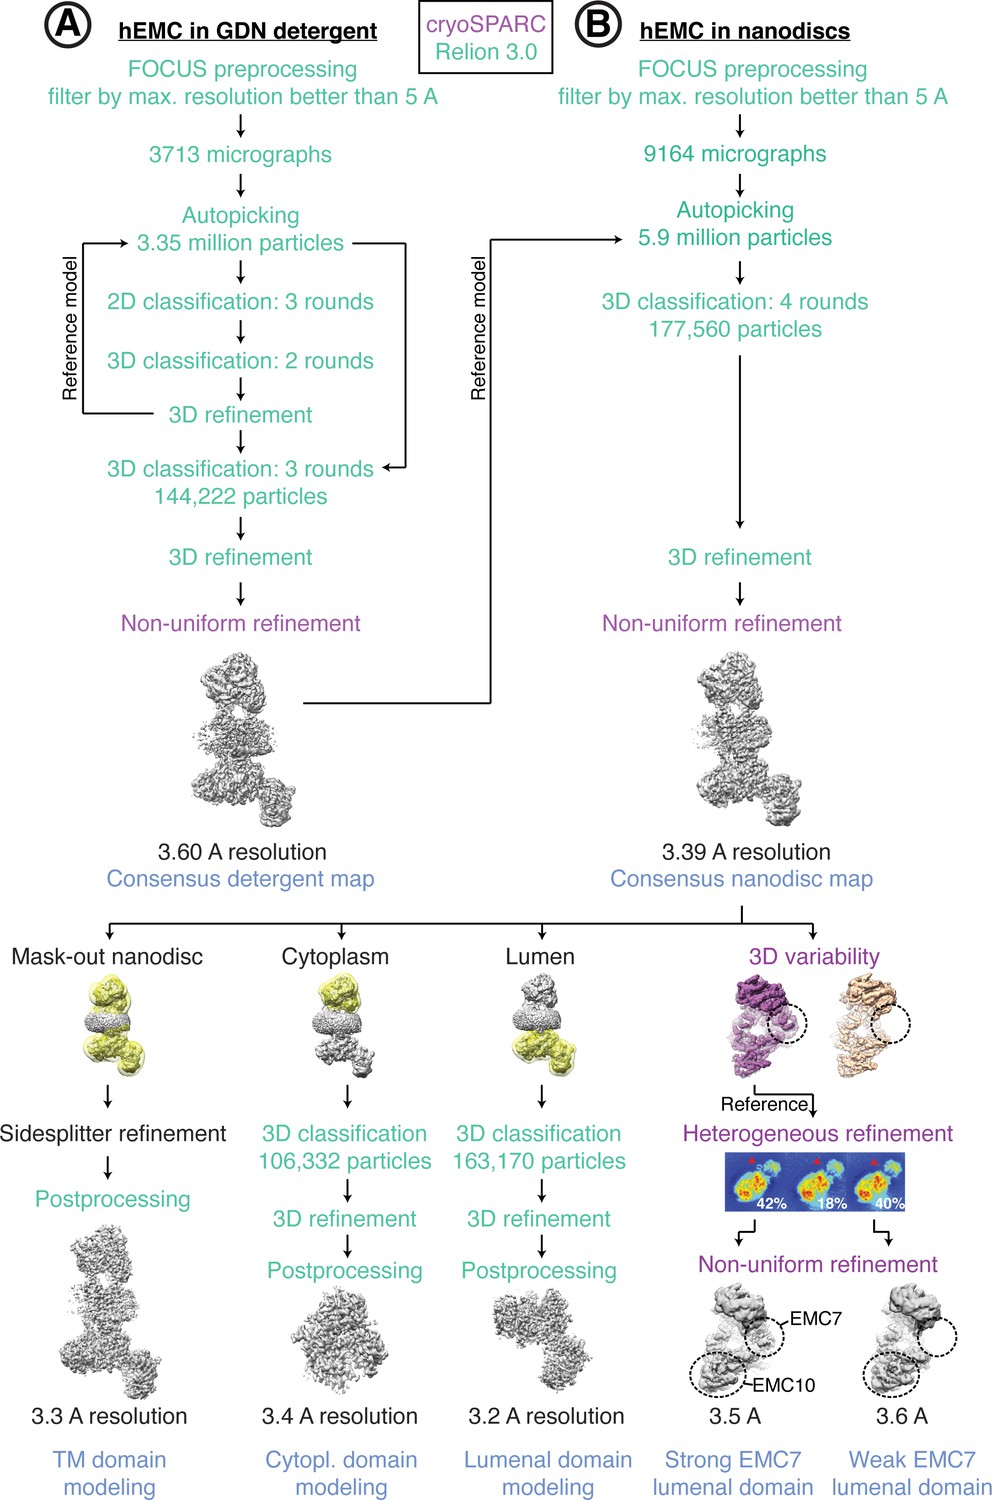
Cryo-EM data processing workflow for hEMC.
(A) Schematic of cryoEM data processing workflow for hEMC in GDN detergent micelles. (B) Schematic of cryoEM data processing workflow for hEMC in lipid nanodiscs.
Figure 2—figure supplement 5
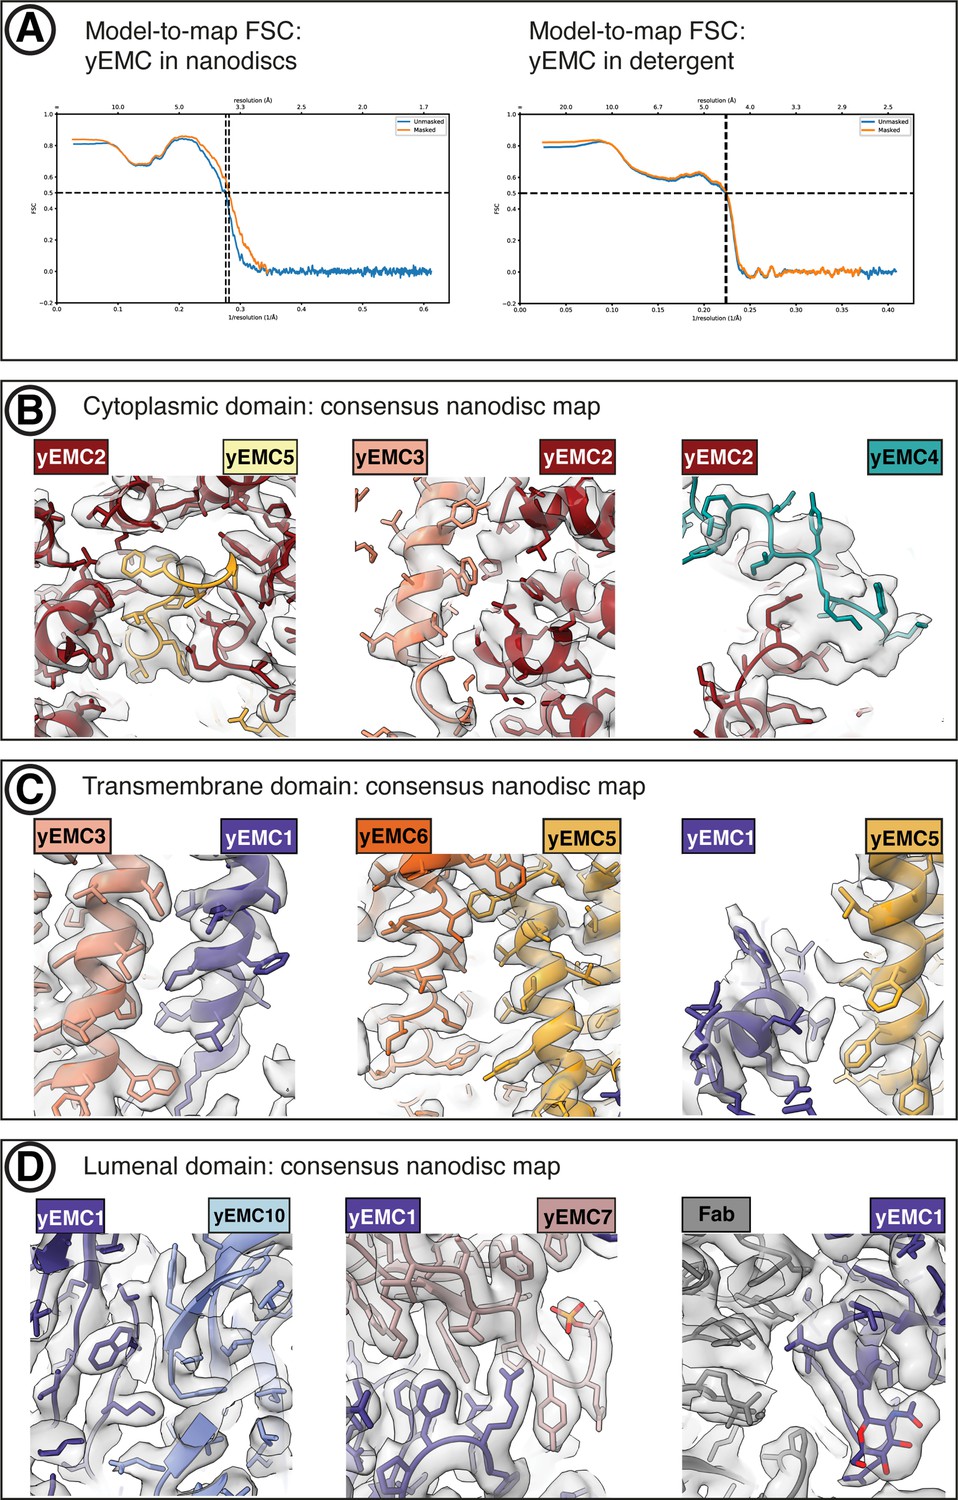
yEMC cryo-EM map validation.
(A) Final model-to-map FSC curve shown for yEMC in nanodiscs (left) and detergent (right). (B) Consensus yEMC nanodisc density shown superposed on the final yEMC nanodisc model. Three cytoplasmic subunit interfaces are depicted. (C) As in (B), for transmembrane subunit interfaces. (D) As in (B), for lumenal subunit interfaces.
Figure 2—figure supplement 6
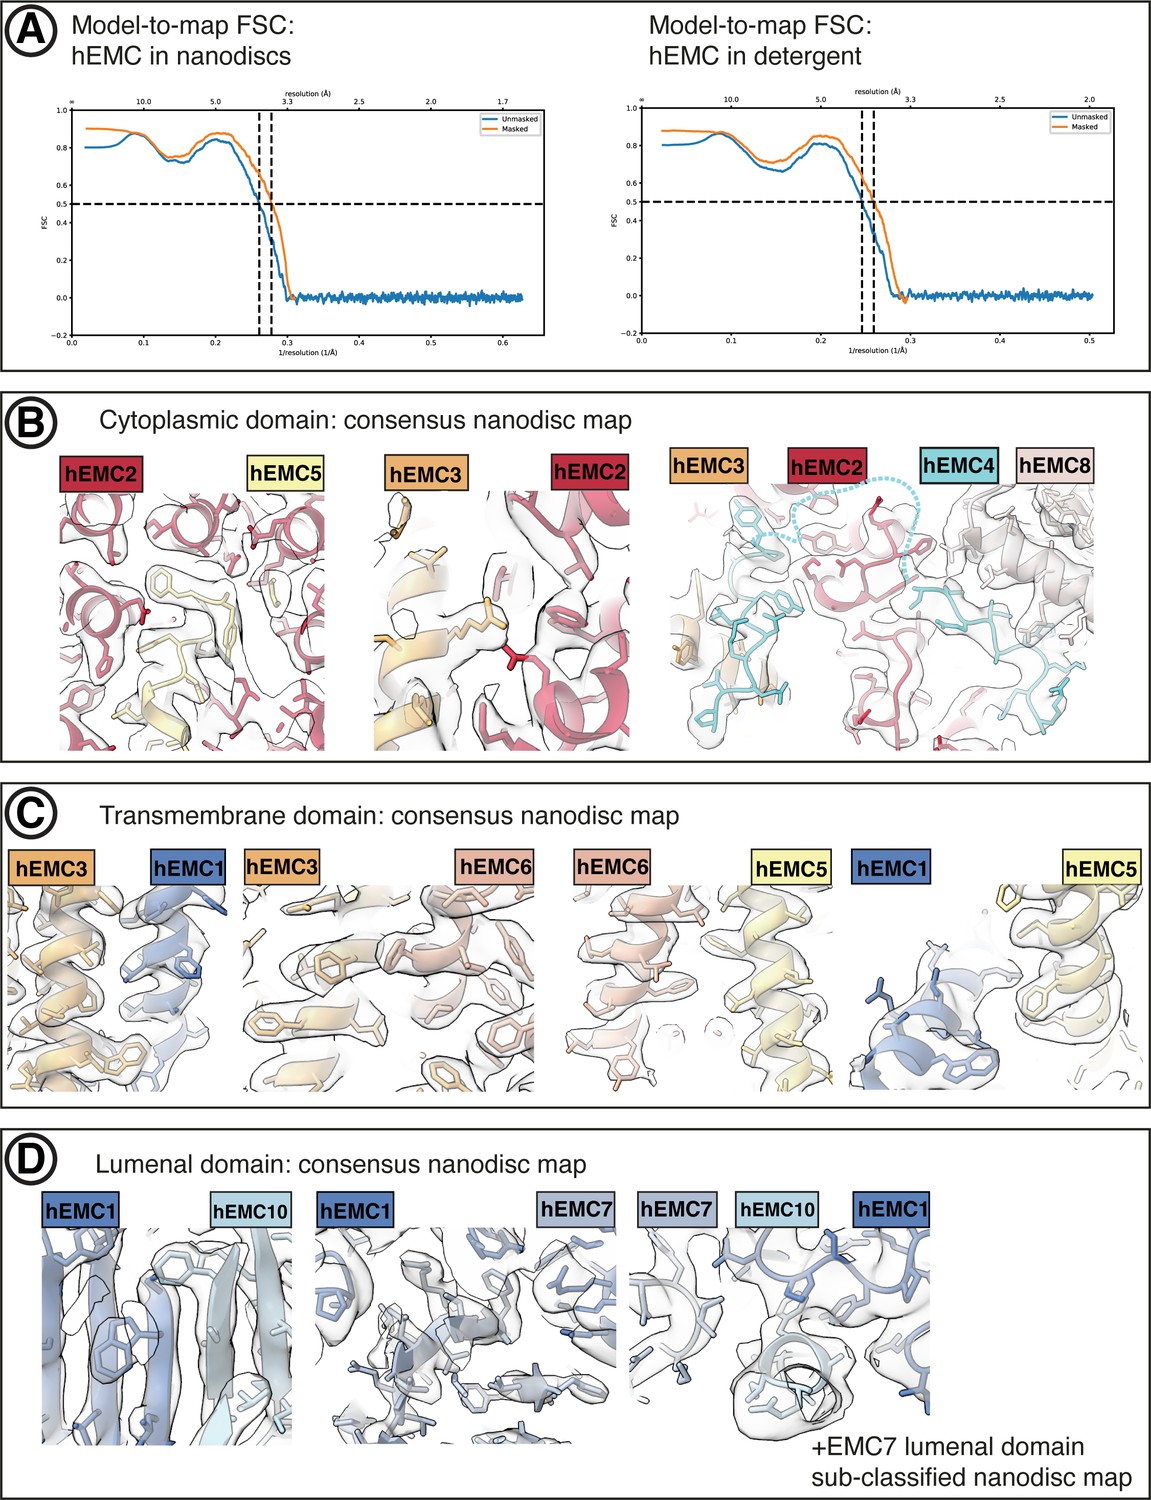
hEMC cryo-EM map validation.
(A) Final model-to-map FSC curves shown for hEMC in nanodiscs (left) and detergent (right). (B) Consensus hEMC nanodisc density shown superposed on the final hEMC nanodisc model. Three cytoplasmic subunit interfaces are depicted. Cyan dashed lines correspond to an unresolved cytoplasmic loop of EMC4. (C) As in (B), for transmembrane subunit interfaces. (D) As in (B), for lumenal subunit interfaces. The right most panel depicts the sub-classified hEMC nanodisc map featuring stronger EMC7 lumenal density.
Figure 2—figure supplement 7
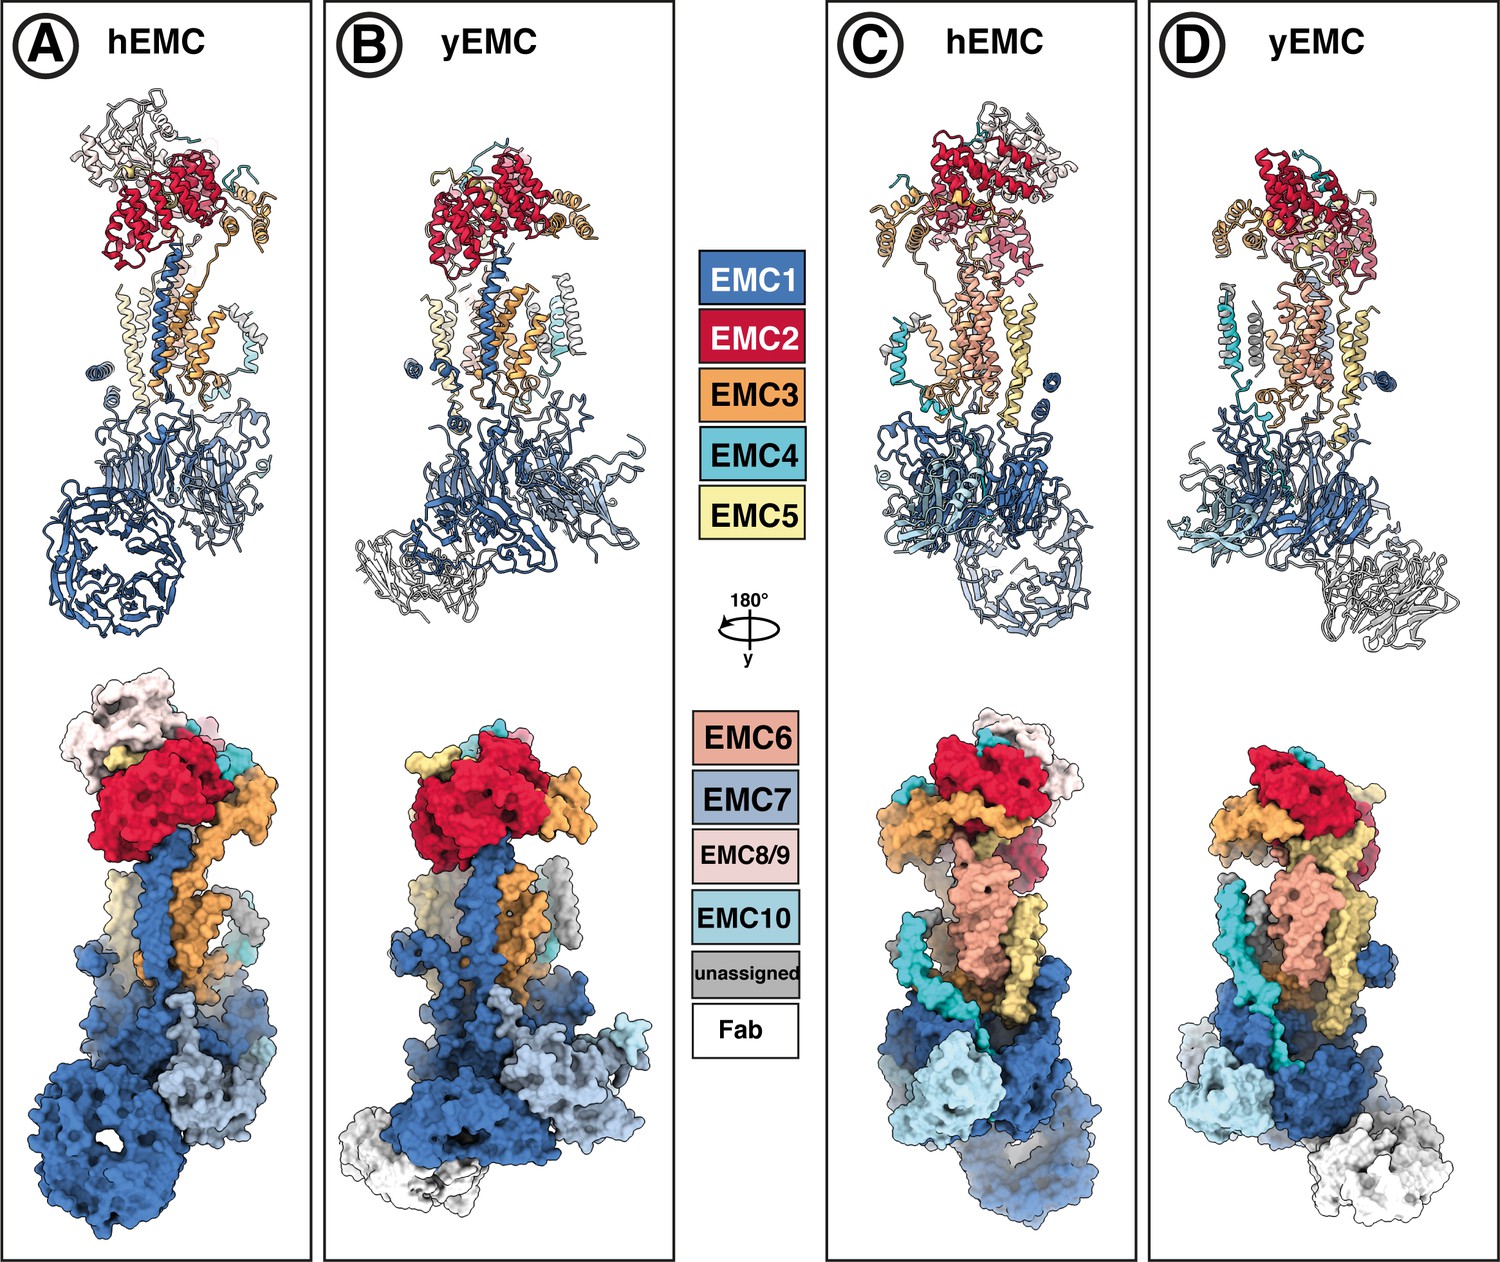
Subunit-subunit correspondence between yEMC and hEMC.
(A–D) EMC models from both human (A,C) and yeast (B,D) in lipid nanodiscs are colored with the same subunit color code, shown in the middle. Both cartoon ribbons and surface rendering are shown in two different views.
Figure 2—figure supplement 8
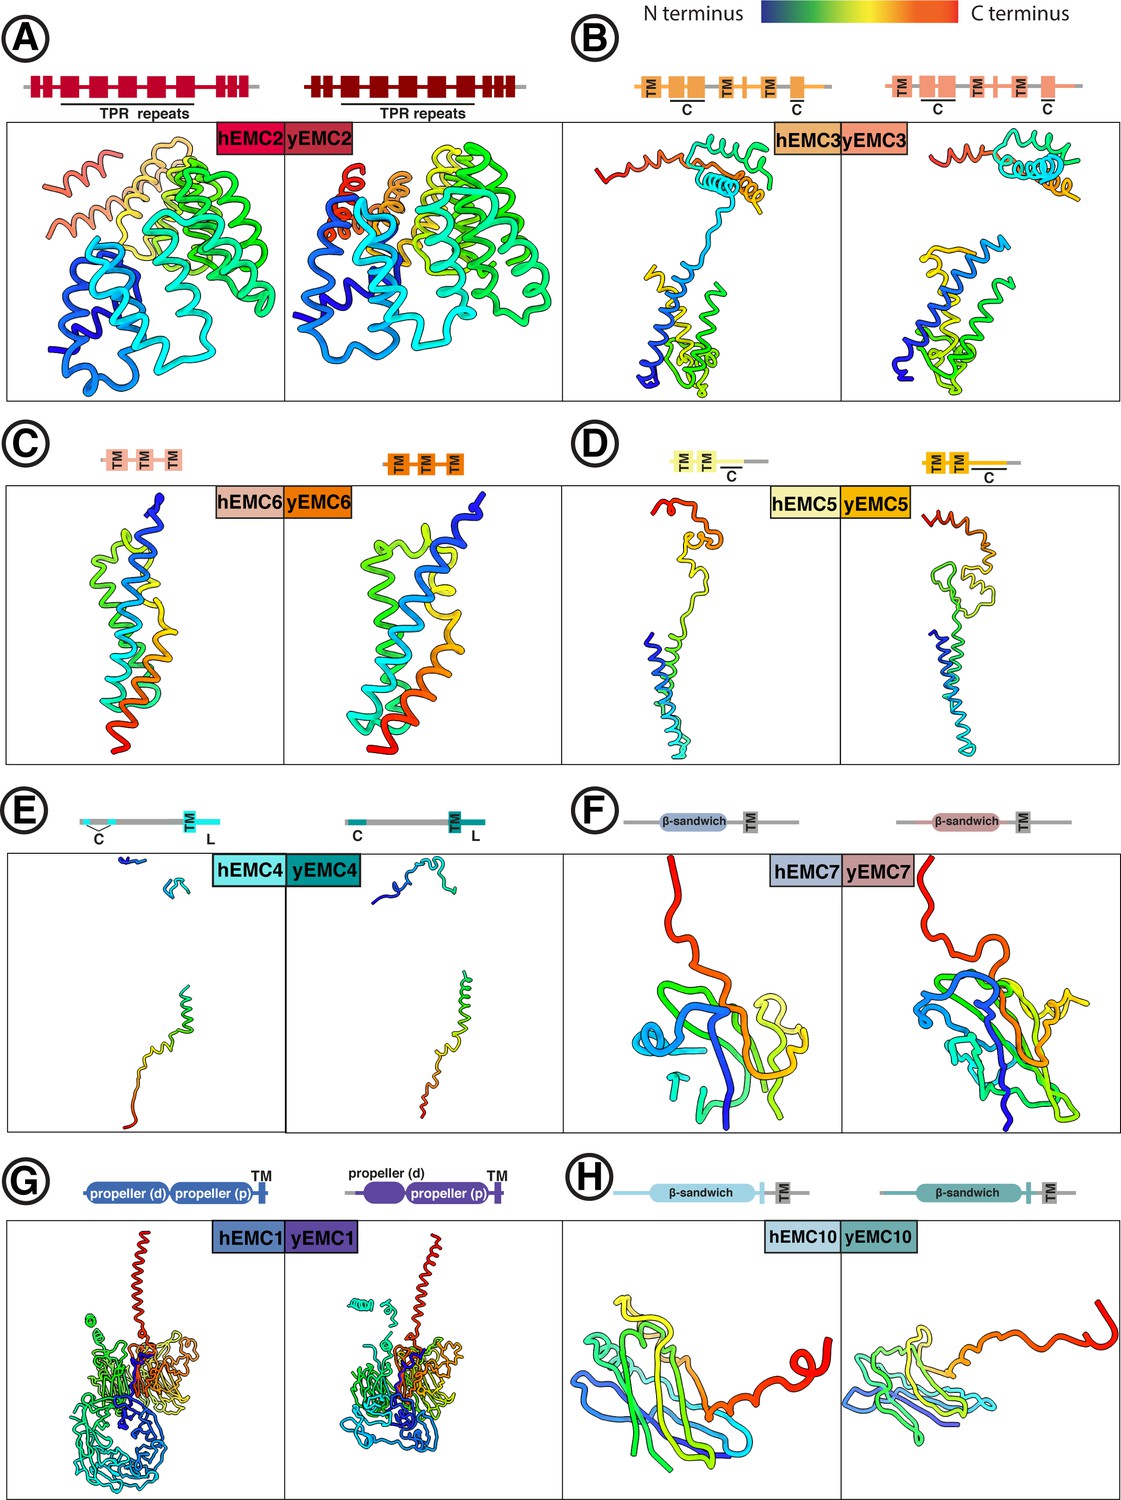
Comparison between individual yEMC and hEMC subunits.
(A–H) Each panel shows a side-by-side comparison of homologous yeast and human EMC subunits, colored from N- (blue) to C-terminus (red). Schematics above each panel depict domain organization for each subunit. TM = transmembrane helix. C = cytoplasmic. L = ER lumenal.
Figure 2—figure supplement 9
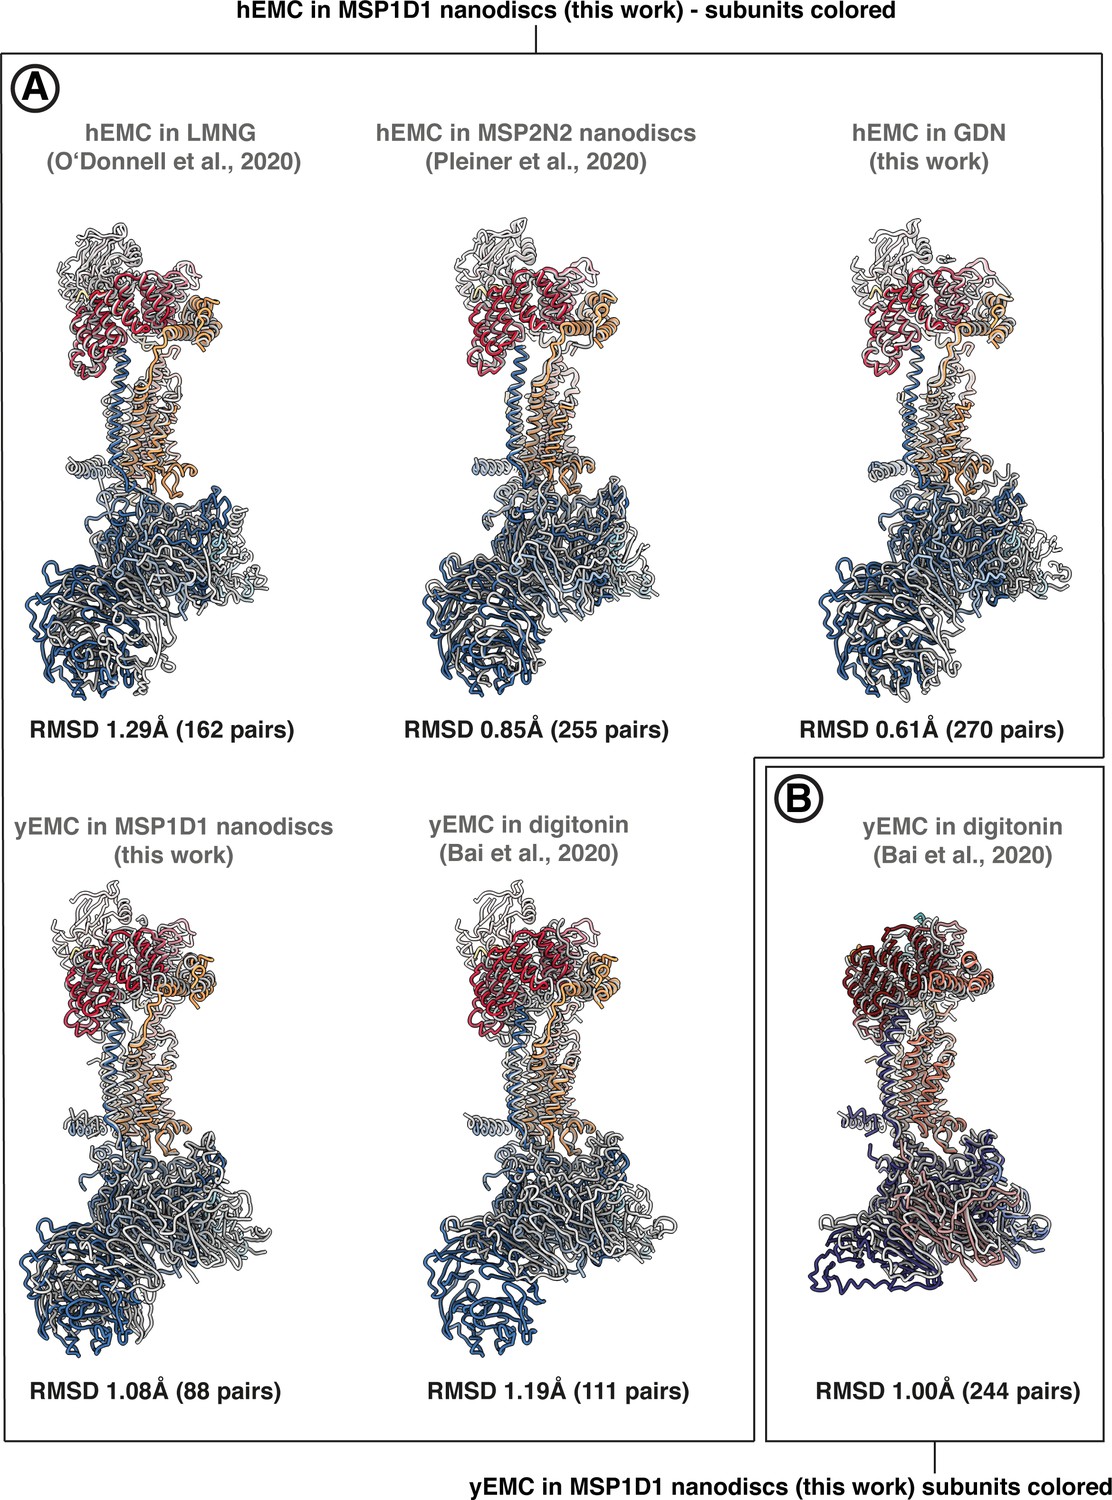
Pairwise superposition of EMC structures in the PDB.
Pairwise superpositions between hEMC and yEMC from this work and recently published EMC structures. Alignments were performed with the matchmaker command in ChimeraX, in each case aligning on the conserved core subunits EMC3 and EMC5. RMSD values for alignments between pruned atom pairs are shown. (A) Alignment on hEMC in nanodiscs (this work). (B) Alignment on yEMC in nanodiscs (this work).
Figure 3 with 3 supplements

The EMC cytoplasmic domain contains conserved functional interfaces and may engage C-tail-anchored clients directly.
(A) Position of the hEMC cytoplasmic domain relative to the membrane and the rest of the complex. Shown is the surface rendered hEMC structure reconstituted in nanodiscs. (B) EMC2 nucleates a protein-protein interaction hub in the cytoplasm. Zoomed-in view of the cytoplasmic domain from (A). EMC2 is shown as surface rendering while interacting EMC subunits are shown as cartoon cylinders. (C) EMC2 forms a TPR domain which binds EMC5. Overlaid are hEMC2 (red) and yEMC2 (dark red), illustrating the more tightly wound yEMC2 TPR solenoid. Two mutants, one in EMC5 and three in EMC2, are colored in blue, and show destabilizing phenotypes for EMC integrity. (D) A cytoplasmic cap structure involving EMC4 is conserved in yEMC and hEMC. Shown is a side-by-side comparison between the cytoplasmic domains of hEMC (left) and yEMC (right), highlighting the similar path EMC4 takes from the cytoplasmic domain toward the transmembrane domain. While an interaction surface between EMC8/9 and the EMC4 N-terminus is absent in yeast, yEMC4 binds at the top of the EMC2 TPR domain and assumes as similar position across the EMC3 cytoplasmic domain at the cytoplasm-membrane interface. (E) Fluorescent client reporter stability assay for TMEM97 (N-cytoplasmic polytopic client), B1AR (N-lumenal polytopic client) and SQS378-410 (C- lumenal tail-anchored client) in EMC2 KO cells expressing mutant hEMC2E168A+D170A+K173A (shaded) or WT hEMC2 rescue (unshaded). Shown is the model of hEMC in nanodiscs superposed with the unsharpened cryo-EM map, where the weaker density for EMC4 (23–42) becomes apparent. Mutated residues are colored blue and marked with asterisks for clarity. (F) Fluorescent client reporter stability assay, as in E, for the hEMC2E146A+E149A+Q150A mutant.
Figure 3—figure supplement 1
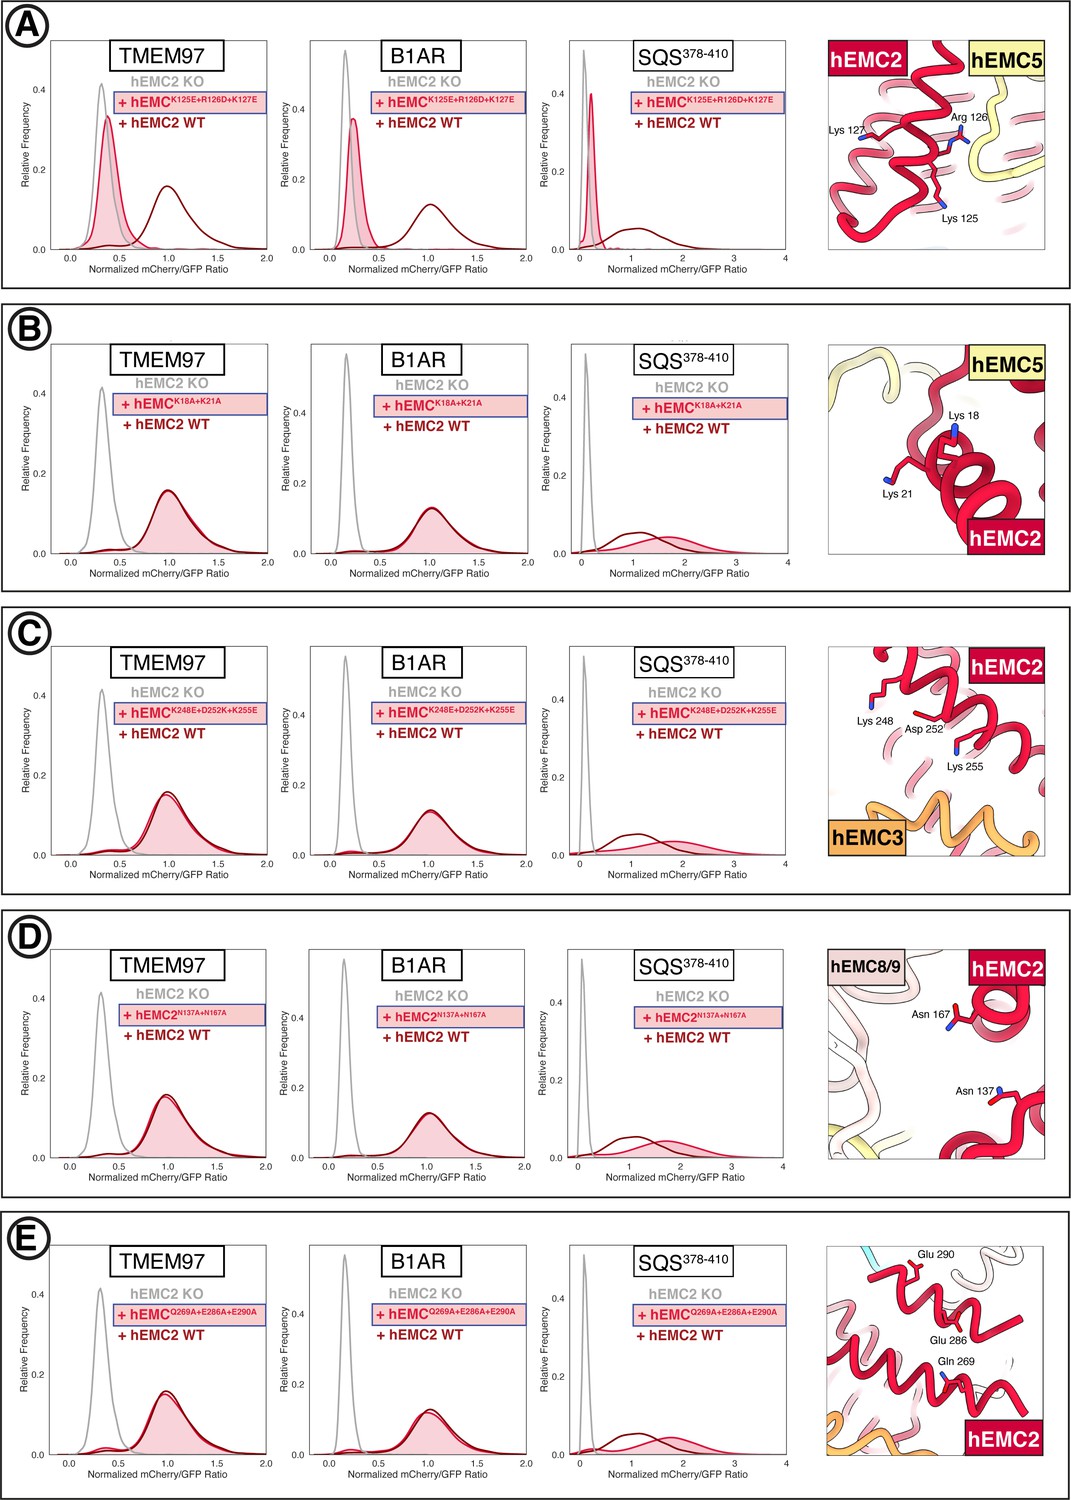
Flow cytometry for mutations in the EMC cytoplasmic domain.
(A) Mutant hEMC2K125E+R126D+K127E with TMEM97-mCherry, B1AR-mCherry, and mCherry-SQS378-410 cell lines. Image of hEMC ND model displaying the residues mutated. (B) Mutant hEMC2K18A+K21A with TMEM97-mCherry, B1AR-mCherry, and mCherry- SQS378-410 cell lines. Snapshot of hEMC ND model displaying the residues mutated. (C) Mutant hEMC2K248E+D252K+K255E with TMEM97-mCherry, B1AR-mCherry, and mCherry-SQScterm cell lines. Snapshot of hEMC ND model displaying the residues mutated. (D) Mutant hEMC2N137A+N167A with TMEM97-mCherry, B1AR-mCherry, and mCherry- SQS378-410 cell lines. Snapshot of hEMC ND model displaying the residues mutated. (E) Mutant hEMC2Q269A+E286A+E290A with TMEM97-mCherry, B1AR-mCherry, and mCherry- SQS378-410 cell lines. Snapshot of hEMC ND model displaying the residues mutated.
Figure 3—figure supplement 2
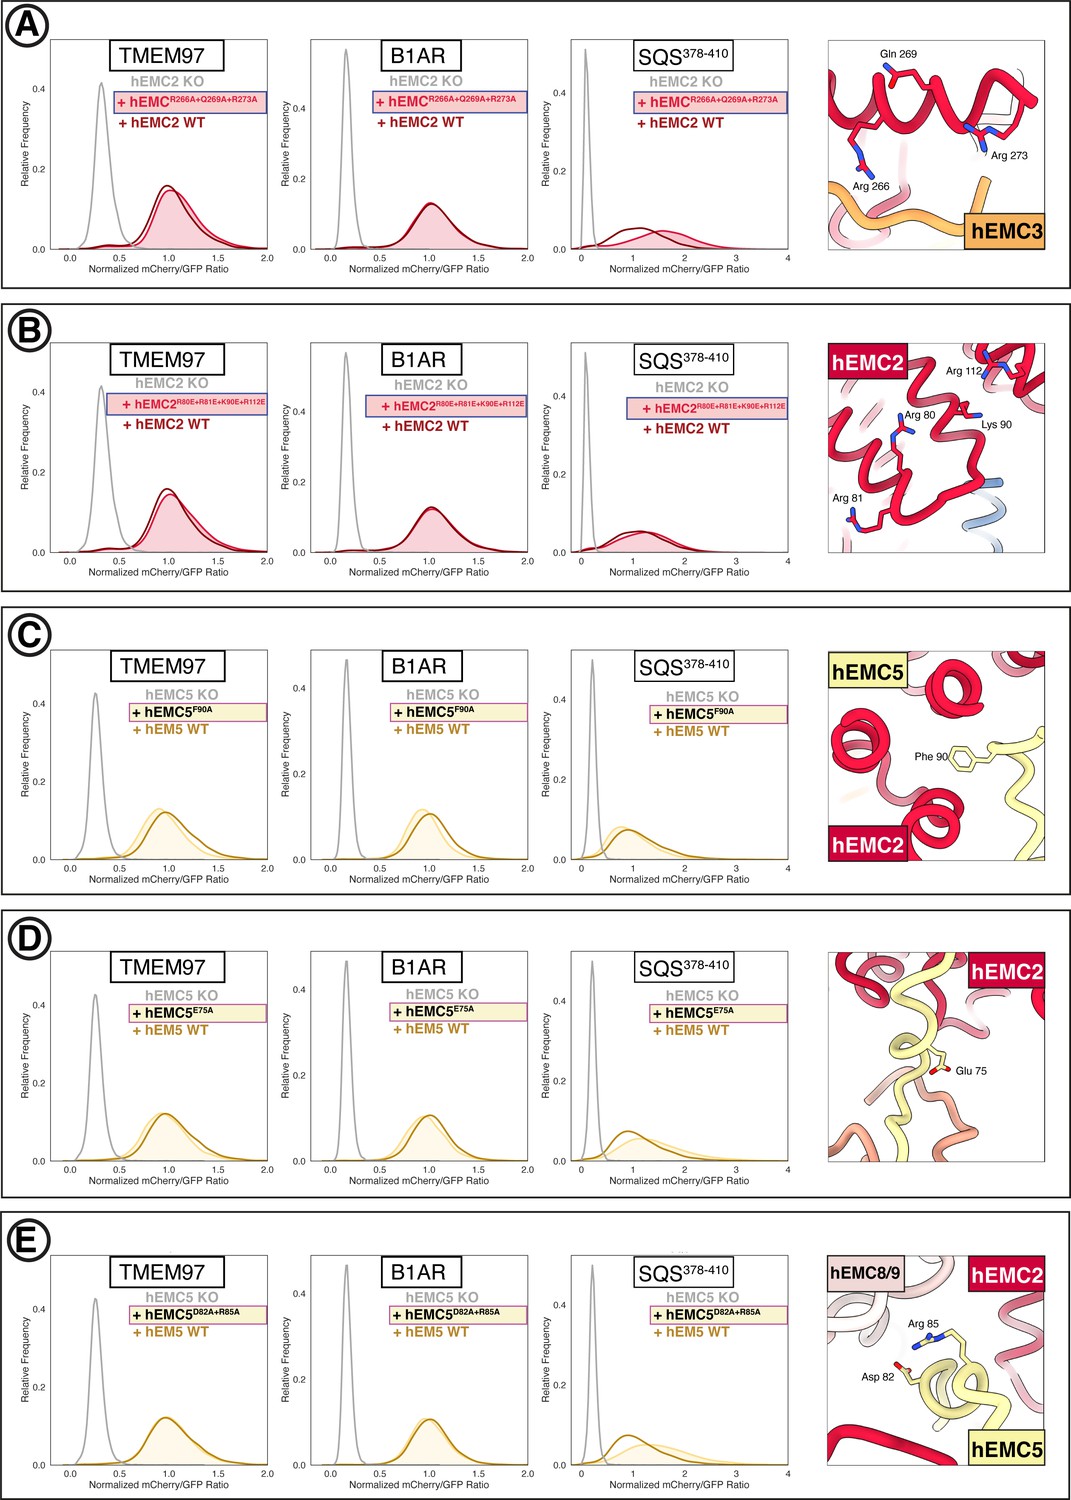
Additional flow cytometry for mutations in the EMC cytoplasmic domain.
(A) Mutant hEMC2R266A+Q269A+R273A with TMEM97-mCherry, B1AR-mCherry, and mCherry- SQS378-410 cell lines. Snapshot of hEMC ND model displaying the residues mutated. (B) Mutant hEMC2R80E+R81E+K90E+R112E with TMEM97-mCherry, B1AR-mCherry, and mCherry- SQS378-410 cell lines. Snapshot of hEMC ND model displaying the residues mutated. (C) Mutant hEMC5F90A with TMEM97-mCherry, B1AR-mCherry, and mCherry-SQScterm cell lines. Snapshot of hEMC ND model displaying the residues mutated. (D) Mutant hEMC5E75A with TMEM97-mCherry, B1AR-mCherry, and mCherry- SQS378-410 cell lines. Snapshot of hEMC ND model displaying the residues mutated. (E) Mutant hEMC5D82A+R85A with TMEM97-mCherry, B1AR-mCherry, and mCherry- SQS378-410 cell lines. Snapshot of hEMC ND model displaying the residues mutated.
Figure 3—figure supplement 3
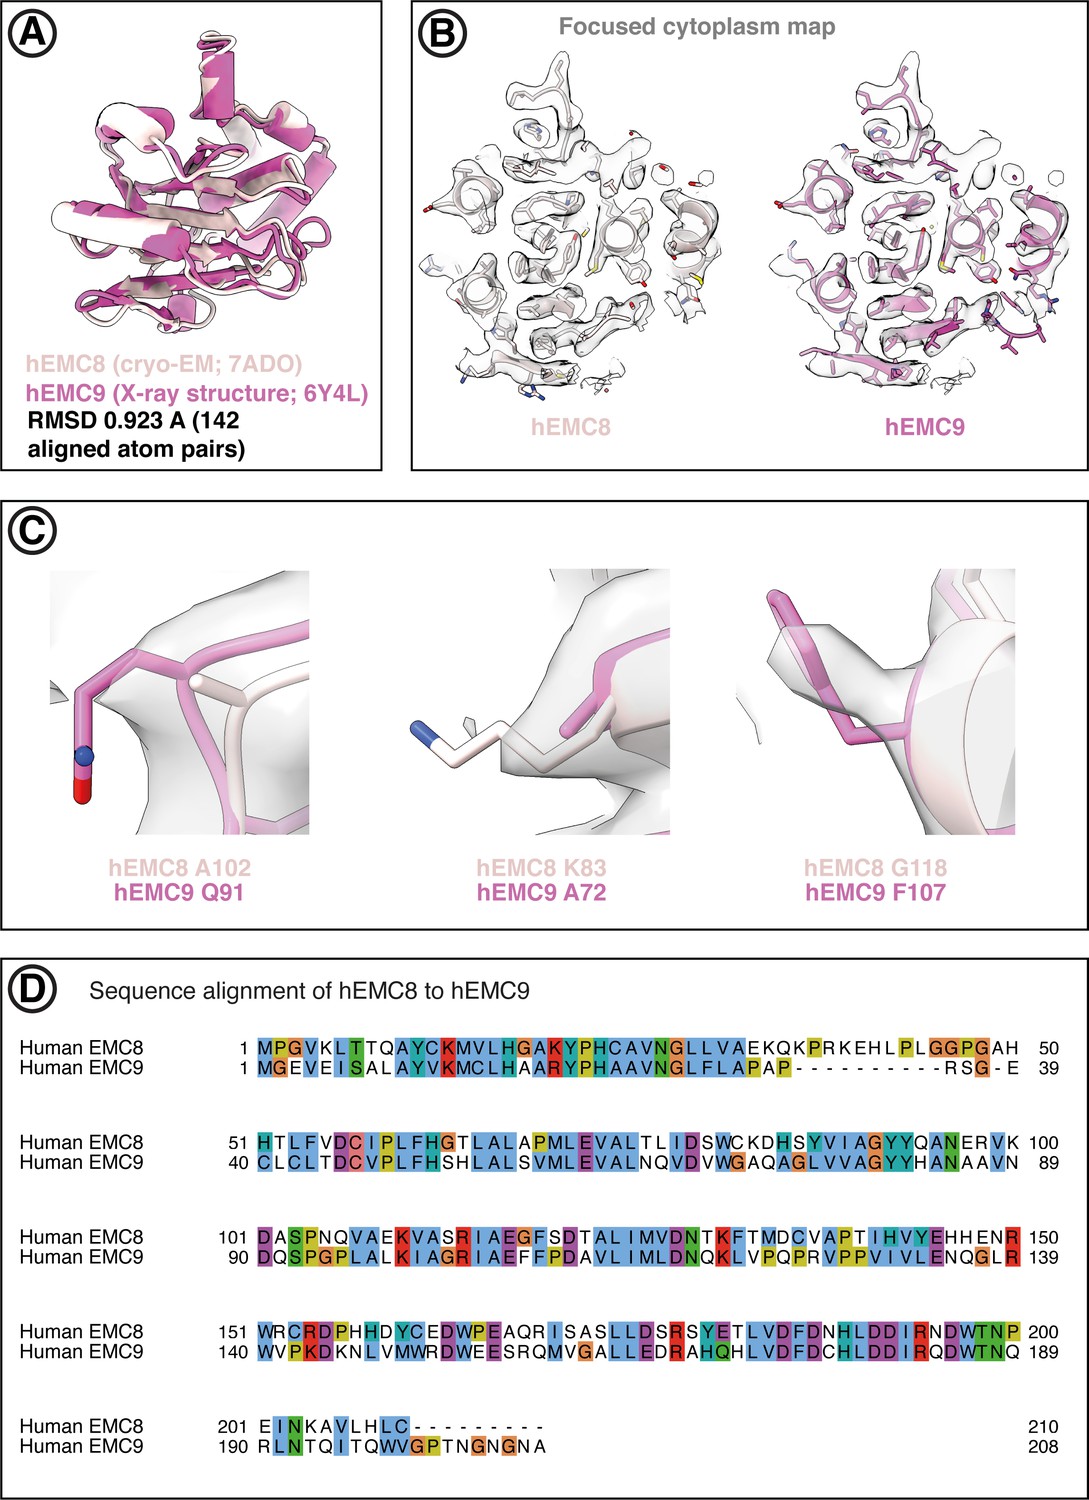
Both EMC8 and EMC9 can be fitted into the hEMC cryo-EM maps.
(A) Superposition of hEMC8 (cryo-EM model, this work) and hEMC9 (X-ray model, PDB code 6Y4L) reveals strong structural homology between the two paralogous hEMC subunits. (B) Central slide through the models of hEMC8 (cryo-EM) and hEMC9 (X-ray) fitted into the hEMC nanodisc cytoplasmic focused map. (C) Representative non-conserved residues in hEMC8 and hEMC9 showing evidence of side-chain density superposition. The hEMC nanodisc cytoplasmic focused map is depicted. (D) Tcoffee sequence alignment between hEMC8 and hEMC9, displayed in Jalview and ClustalX coloring.
Figure 4

The EMC houses two transmembrane cavities with conserved core structures and distinct accessibilities.
(A) Location and composition of the lipid-filled cavity. A zoom-in view on the cavity is shown below, which is composed of EMC1, EMC3, EMC5, and EMC6. Resolved lipid densities from the cryo-EM map of hEMC in POPC nanodiscs are shown as black mesh zoned within 3 Å of modeled POPC molecules. (B) Location and composition of the gated cavity. Two orthogonal zoom-in views of the cavity are shown below, which is composed of EMC3 and EMC6. A transmembrane gate opposite the cavity wall is depicted as transparent cartoon cylinders and has contributions from the C-terminal EMC4 transmembrane helix along with up to two additional, unassigned helices. Resolved lipid densities are shown as in (A). (C) The dual-cavity architecture of the EMC transmembrane domain is conserved between yEMC and hEMC. Unsharpened cryo-EM maps of hEMC and yEMC in nanodiscs (top) are shown along with corresponding schematic representations of the spatial organization of all transmembrane helices (bottom). The gate helices of the gated cavity represent the region of highest conformational heterogeneity across our collection of EMC structures. (D) The two EMC transmembrane cavities feature distinct accessibilities. Shown is a central slice through the surface rendered hEMC nanodisc structure with the two membrane cavities on opposite sides. Measuring from the lumenal to the cytoplasmic side, gated and lipid-filled cavities measure 45 Å and 35 Å across, respectively. This suggests that the gated cavity has accessibility from the cytoplasm while the lipid-filled cavity does not.
Figure 5 with 5 supplements

EMC houses an insertase module centered on EMC3 in the gated membrane cavity.
(A) A transmembrane gate anchored in the cytosol and the lumen is a structural hallmark of the EMC gated cavity. Shown is a surface rendering of the hEMC model in lipid nanodiscs with an unresolved EMC4 connection between the cytoplasm and the membrane depicted as a dashed line. An unassigned helix of the gate is shown in gray (H1). (B) The gated cavity in the hEMC nanodisc structure has sufficient space to accommodate a client transmembrane helix. The space-filling model of the first transmembrane helix of B1AR (B1AR TMH1) is shown placed inside an outline of the EMC gated cavity. (C) A hydrophobic gradient characterizes the surface of the EMC gated cavity from the cytoplasmic to the lumenal side. Gate helices have been omitted for clarity. The surface of the hEMC nanodisc structure is colored by electrostatic surface potential ranging from −15 (red) to +15 (blue) kcal/(mol·e). (D) Distinct EMC3 regions along the gated cavity hydrophobic gradient targeted for mutagenesis. Mutated residues are colored in lime. (E) Fluorescent client reporter stability assay for the EMC3 cavity entrance mutant, hEMC3E63K+D213K+E223K. (F) As in (E) for the EMC3 buried polar patch mutant, hEMC3N114D+N117D. (G) As in (E) for the EMC3 hydrophobic seal mutant, hEMC3M151L.
Figure 5—figure supplement 1
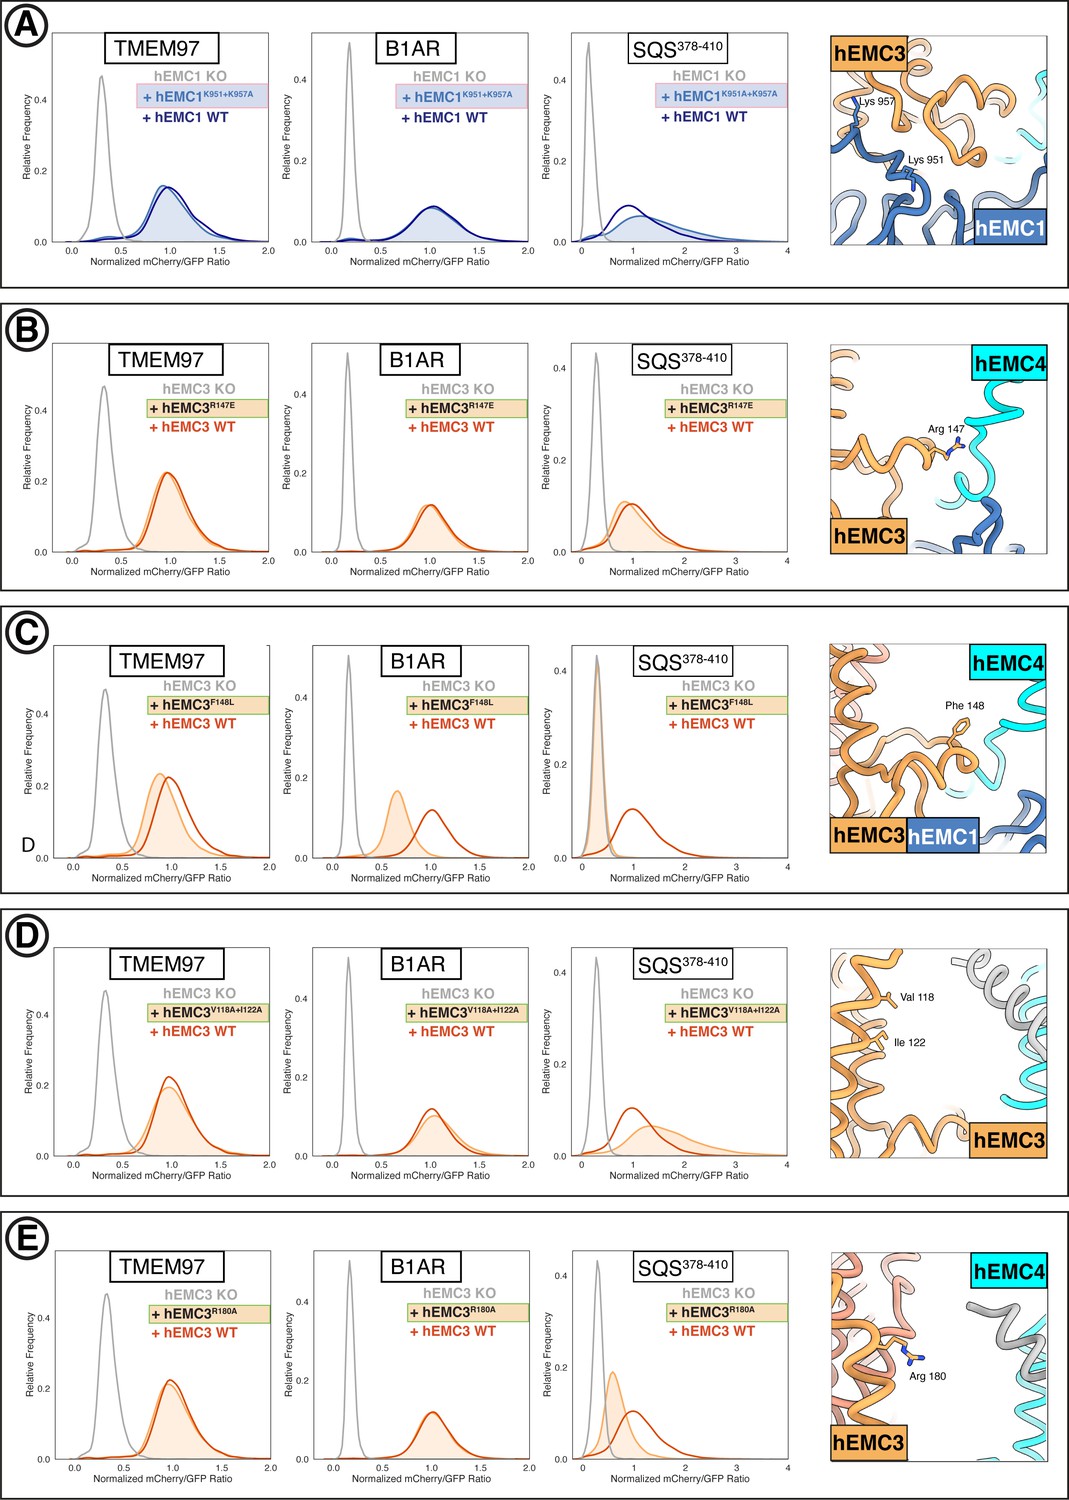
Flow cytometry of gated cavity mutants.
(A) Mutant hEMC1K951A+K957A with TMEM97-mCherry, B1AR-mCherry, and mCherry- SQS378-410 cell lines. Snapshot of hEMC ND model displaying the residues mutated. (B) Mutant hEMC3R147E with TMEM97-mCherry, B1AR-mCherry, and mCherry- SQS378-410 cell lines. Snapshot of hEMC ND model displaying the residues mutated. (C) Mutant hEMC3F148L with TMEM97-mCherry, B1AR-mCherry, and mCherry-SQScterm cell lines. Snapshot of hEMC ND model displaying the residues mutated. (D) Mutant hEMC3V118A+I122A with TMEM97-mCherry, B1AR-mCherry, and mCherry- SQS378-410 cell lines. Snapshot of hEMC ND model displaying the residues mutated. (E) Mutant hEMC3R180A with TMEM97-mCherry, B1AR-mCherry, and mCherry- SQS378-410 cell lines. Snapshot of hEMC ND model displaying the residues mutated.
Figure 5—figure supplement 2
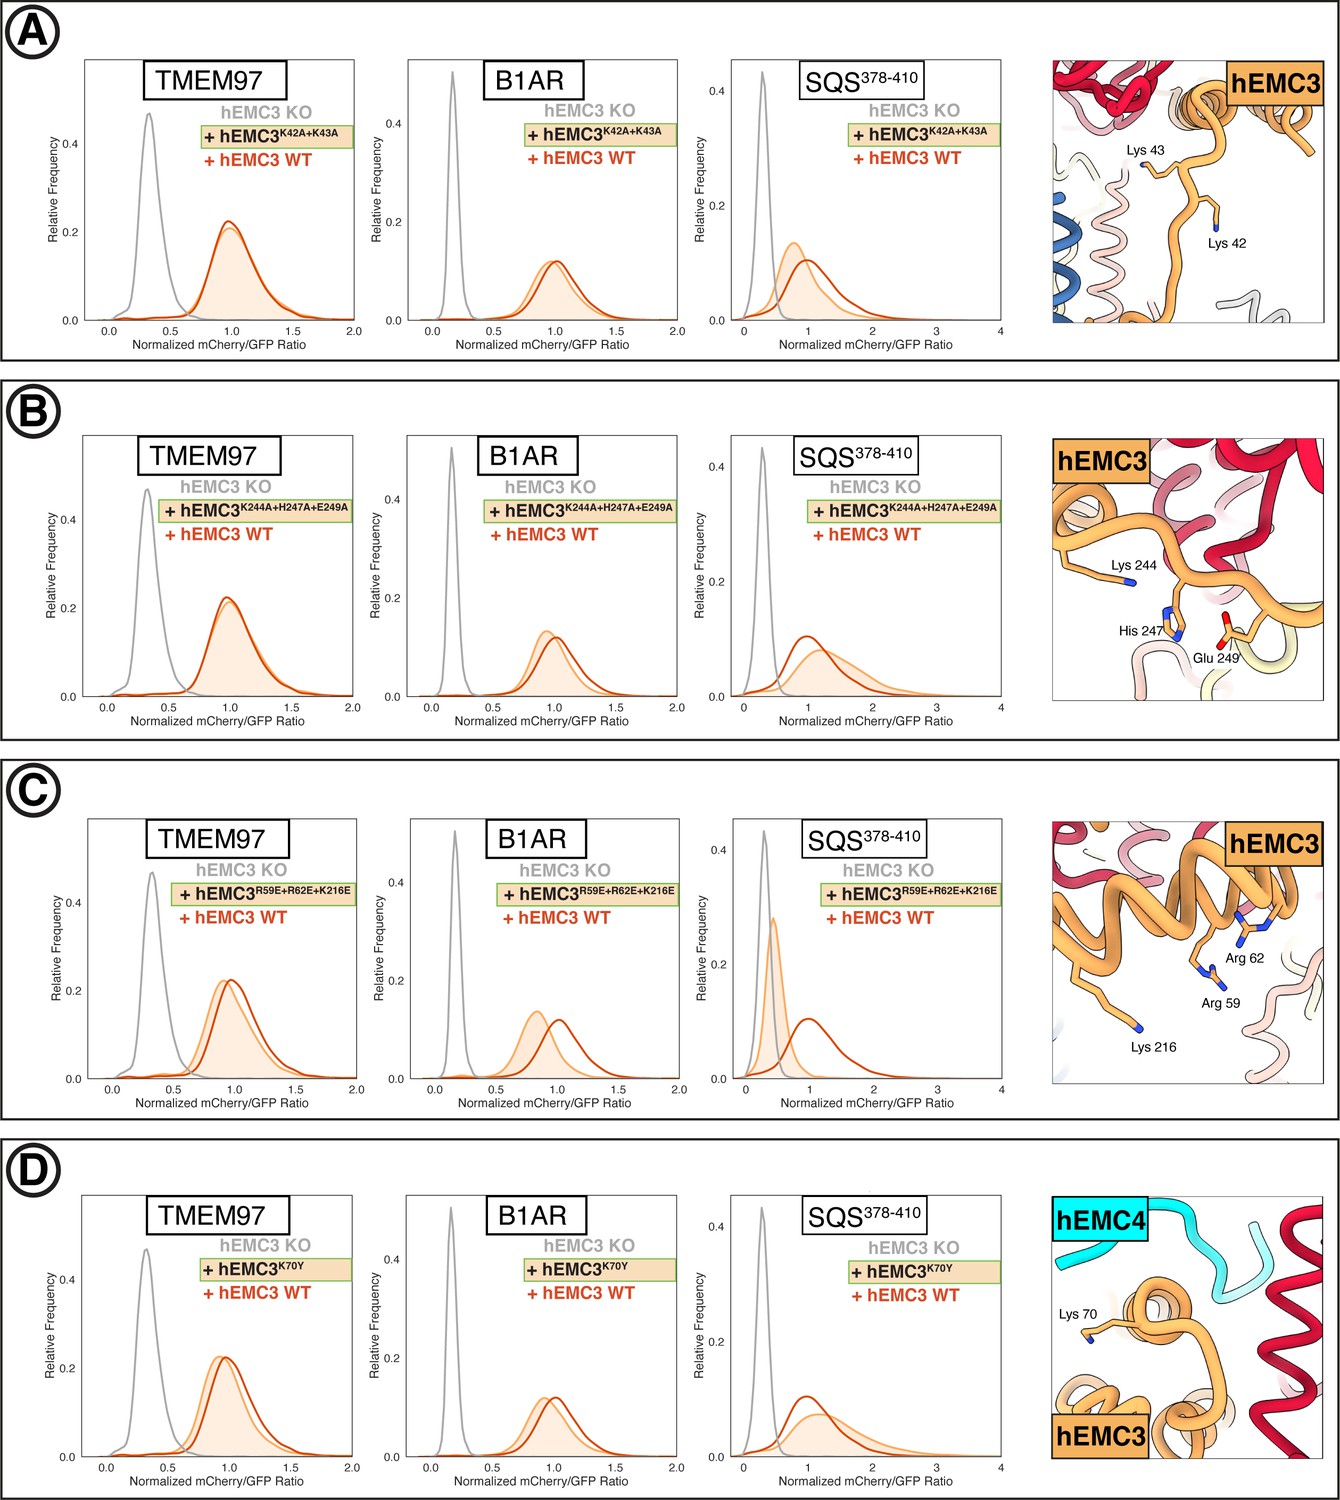
Additional flow cytometry of gated cavity mutants.
(A) Mutant hEMC3K42A+K43A with TMEM97-mCherry, B1AR-mCherry, and mCherry- SQS378-410 cell lines. Snapshot of hEMC ND model displaying the residues mutated. (B) Mutant hEMC3K244A+H247A+E249A with TMEM97-mCherry, B1AR-mCherry, and mCherry- SQS378-410 cell lines. Snapshot of hEMC ND model displaying the residues mutated. (C) Mutant hEMC3R59E+R62E+K216E with TMEM97-mCherry, B1AR-mCherry, and mCherry- SQS378-410 cell lines. Snapshot of hEMC ND model displaying the residues mutated. (D) Mutant hEMC3K70Y with TMEM97-mCherry, B1AR-mCherry, and mCherry-SQScterm cell lines. Snapshot of hEMC ND model displaying the residues mutated.
Figure 5—figure supplement 3
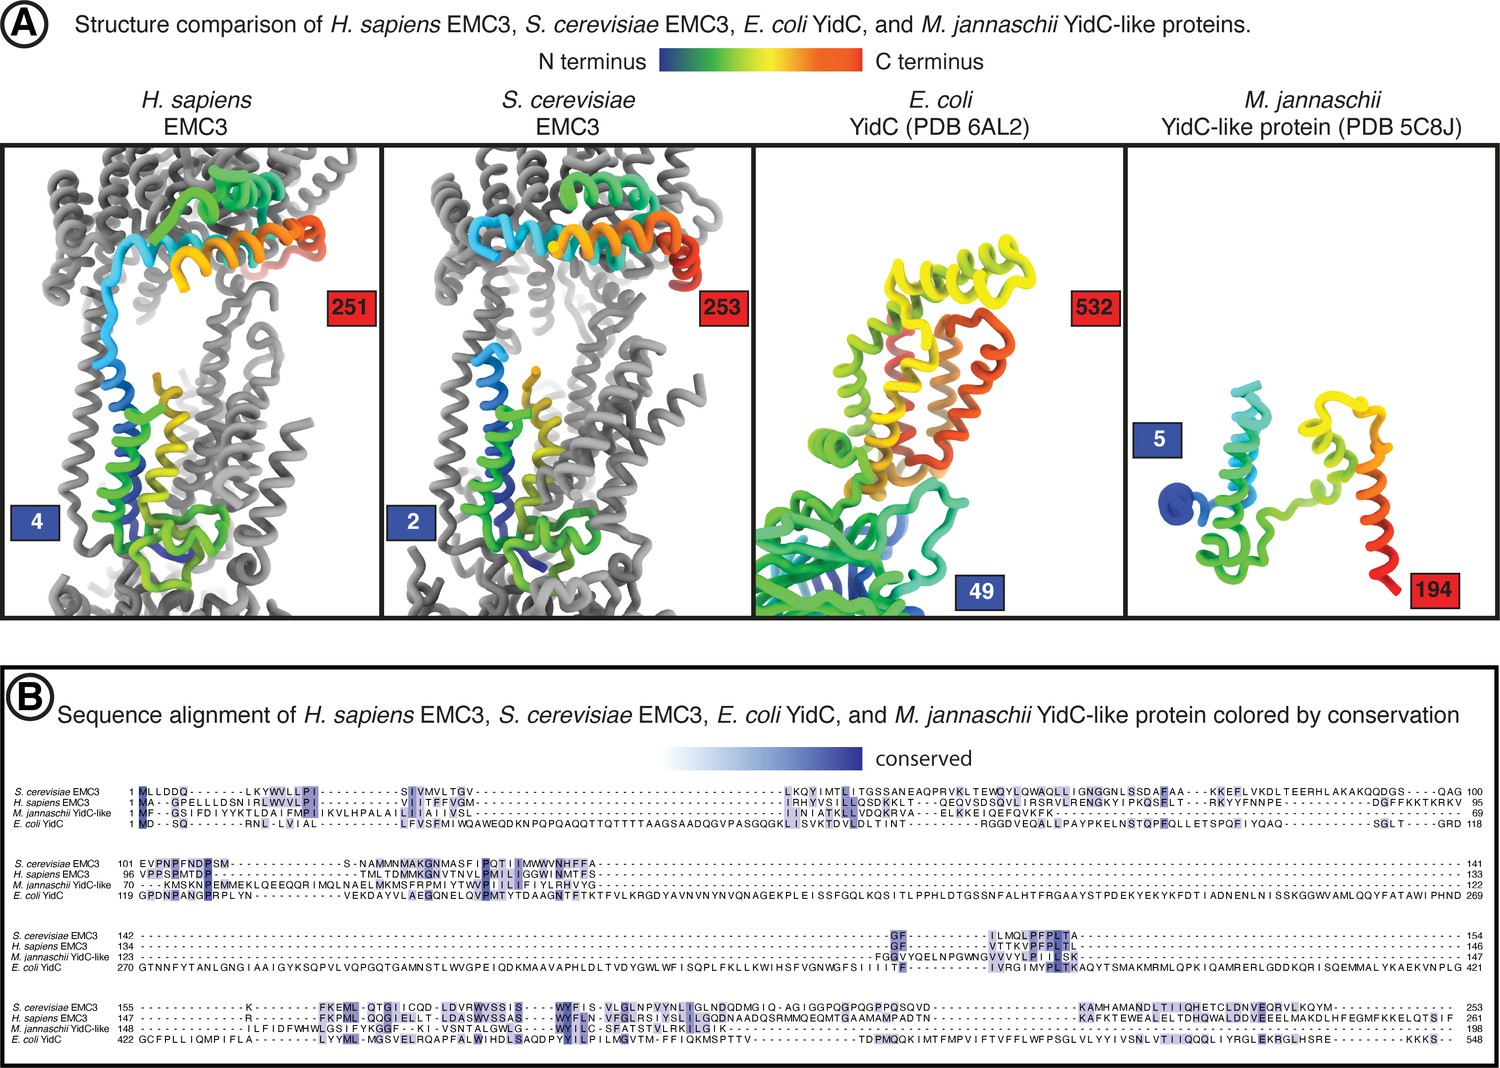
Comparison of EMC3 to YidC-family members.
Structure and sequence comparison between EMC3 and YidC-family proteins. (A) Side-by-side structure view of human EMC3, yeast EMC3, E. coli YidC, and M. jannaschii YidC-like protein. hEMC3 and yEMC are displayed within the context of the EMC complex. EMC3 and YidC subunits are colored from the N-terminus (blue) to the C-terminus (red). (B) Amino acid sequence alignment between human EMC3, yeast EMC3, E. coli YidC, and M. jannaschii YidC-like protein. Alignment from T-Coffee online server. Conserved residues colored in shades of blue to indicate degree of conservation.
Figure 5—figure supplement 4
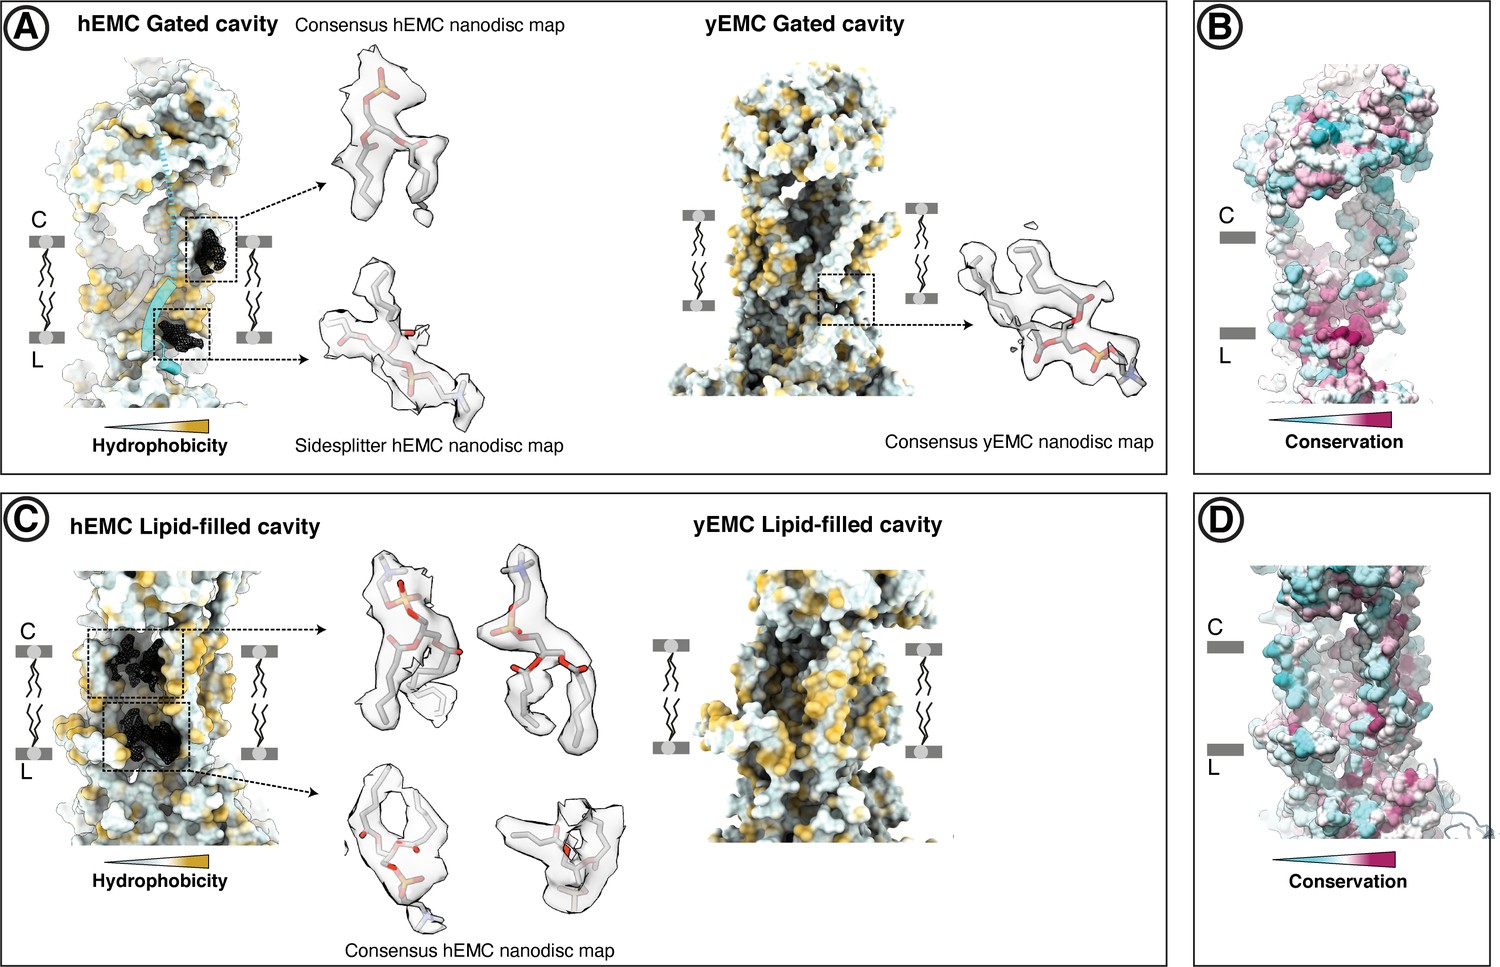
Resolved lipid densities in hEMC and yEMC nanodisc maps.
(A) Resolved lipids in the hEMC gated cavity. Left: The hEMC model is shown as surface rendering, colored by molecular lipophilicity potential (mint = hydrophilic, gold = hydrophobic). Black mesh corresponds to the hEMC consensus nanodisc map zoned within 3 Å of the modeled POPC molecules. Enlarged views of lipid densities are shown, although the second lipid on the lumenal side of the cavity is shown with the corresponding zoned Sidesplitter hEMC nanodisc map. Since this particular lipid molecule shows only weak features in the consensus map, it is left unmodeled in the hEMC nanodisc model. Right: The yEMC model is shown as surface rendering, colored by molecular lipophilicity potential. One POPC lipid is modeled at the lumenal side of the yEMC gated cavity and shown is an enlarged view from the yEMC consensus nanodisc map zoned within 3 Å of a modeled POPC molecule. (B) Same view as in (a), with the hEMC model molecular surface colored according to amino acid conservation. (C) As for (A) but for the hEMC lipid-filled cavity. (D) Same view as in (C), with the hEMC model molecular surface colored according to amino acid conservation.
Figure 5—figure supplement 5

Comparison of gate conformations.
(A) Comparison of gate helix conformations across hEMC and yEMC structures. In each panel, the model of hEMC in nanodiscs is shown as ribbons (color-coded as elsewhere in the manuscript). Cryo-EM maps were aligned on their transmembrane cores and gate helices segmented, with the EMC4 transmembrane helix colored cyan and unassigned gate helices colored gray. (B) Comparison of gate helix densities in cryo-EM maps of hEMC (O'Donnell et al., 2020) and yEMC (Bai et al., 2020), the latter of which was smoothed by Gaussian filtering for clarity. Panels are in same view as (A), with the hEMC model from this work shown as colored ribbons. (C) Topology diagrams of EMC4, EMC7, and EMC10. Based on resolved N- and C-terminal domains of EMC4 in our hEMC structure, EMC4 can possess either one or two transmembrane domains, the latter scenario proposed by Bai et al., 2020 and O'Donnell et al., 2020. The resolved EMC7 and EMC10 N-terminal lumenal domains in our yEMC and hEMC structures orient their C-terminal, predicted transmembrane helices, toward the membrane. (D) Unsharpened maps of the gate helix densities from yEMC in nanodiscs. The assigned C-terminal EMC4 transmembrane helix is colored cyan, whereas two unassigned helices are colored gray. (E) Predicted transmembrane helices for EMC4, EMC7, and EMC10 were extracted from full-sequence prediction models generated with Robetta (robetta.bakerlab.org). (F) Predicted transmembrane helices for EMC7 and EMC10 were docked into the unassigned gate helix densities. (G) Predicted transmembrane helices for EMC4 were docked into the unassigned gate helix densities.
Figure 6 with 2 supplements
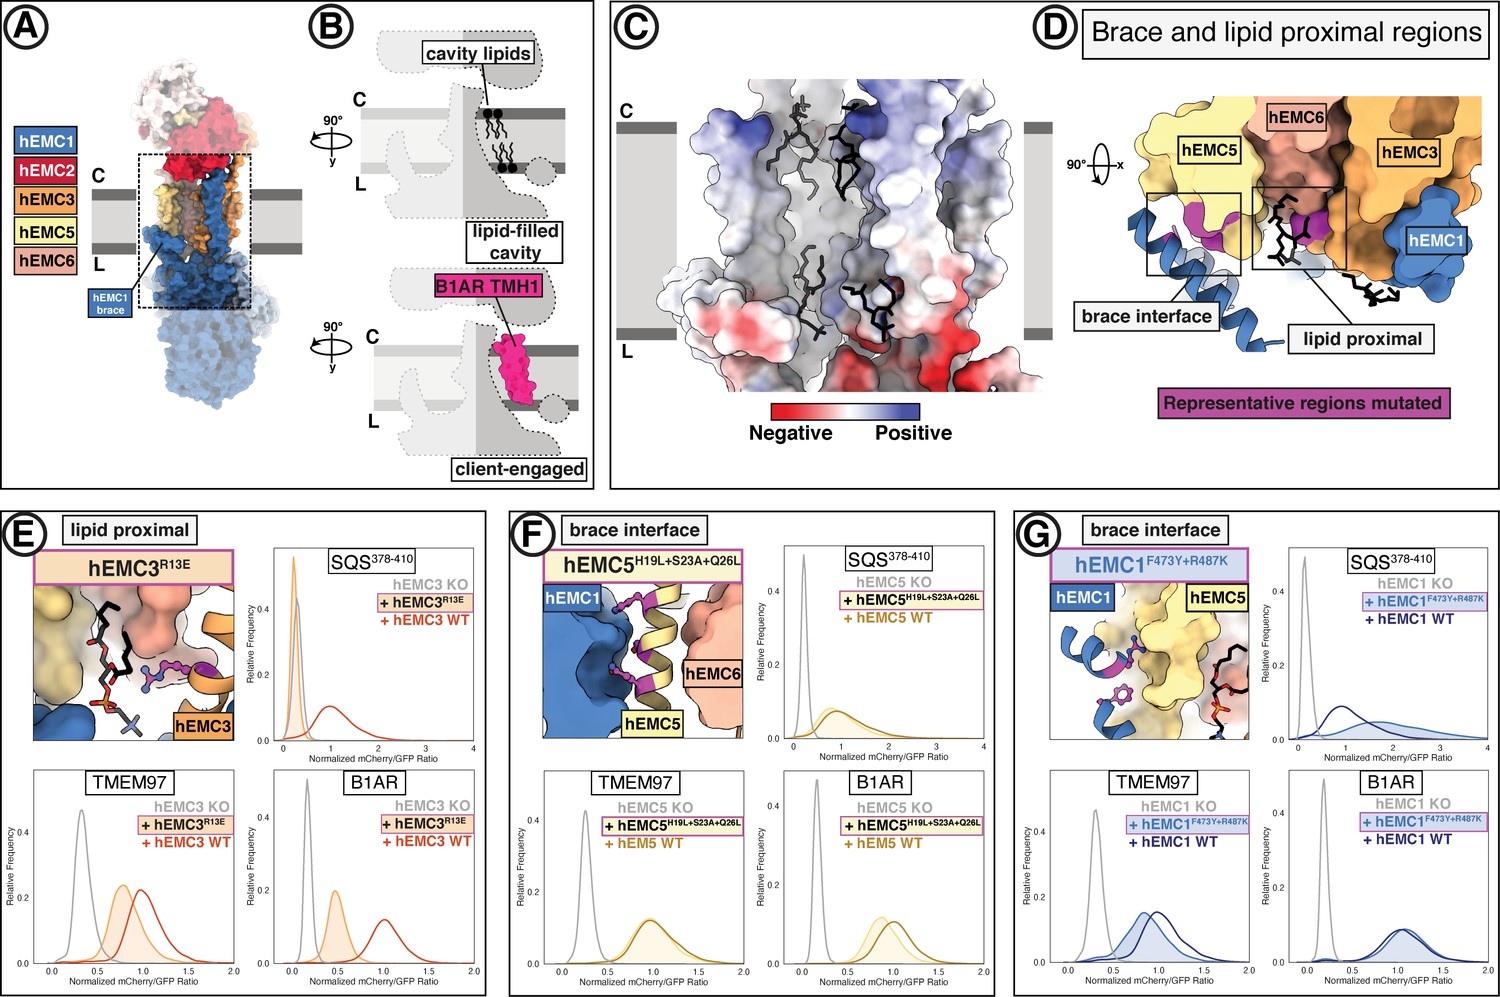
A lipid-filled cavity in the EMC transmembrane domain stabilizes disparate client proteins.
(A) An EMC1 amphipathic brace helix delineates the boundary of the lipid-filled transmembrane cavity and packs against EMC5. Shown is a surface rendering of the hEMC model in nanodiscs. EMC4, EMC5, EMC6, and EMC1 subunits all contribute to the cavity lining. (B) The lipid-filled cavity in the hEMC nanodisc is occupied by several lipid molecules. Cartoon outlines of the gated cavity illustrate that the cavity could in principle allow for occupancy of a client helix (B1AR TMH1), possibly by lipid displacement or movement of the EMC1 brace helix. (C) The lipid-filled cavity has a uniform hydrophobic lining. Shown is an electrostatic surface rendering of the hEMC nanodisc structure colored as in Figure 5C. The cytoplasm-membrane interface contains positively charged residues and the lumenal interface contains negatively charged residues. Modeled phospholipid molecules are displayed in black. (D) Lipid-proximal and brace interface residues targeted for mutagenesis. Selected regions targeted for mutagenesis are colored in magenta and include brace interface mutations both in EMC1 and EMC5, as well as a lipid-proximal residue in EMC3. (E) Fluorescent client reporter stability assay for the hEMC3R13E mutant, which is in close proximity to a modeled POPC molecule. (F) As in (E) for the hEMC5H19L+S23A+Q26L mutant, which sits at the interface to the EMC1 amphipathic brace helix. (G) As in (E) for the hEMC1F473Y+R487K mutant, which sits at the interface to the EMC5 transmembrane helices.
Figure 6—figure supplement 1
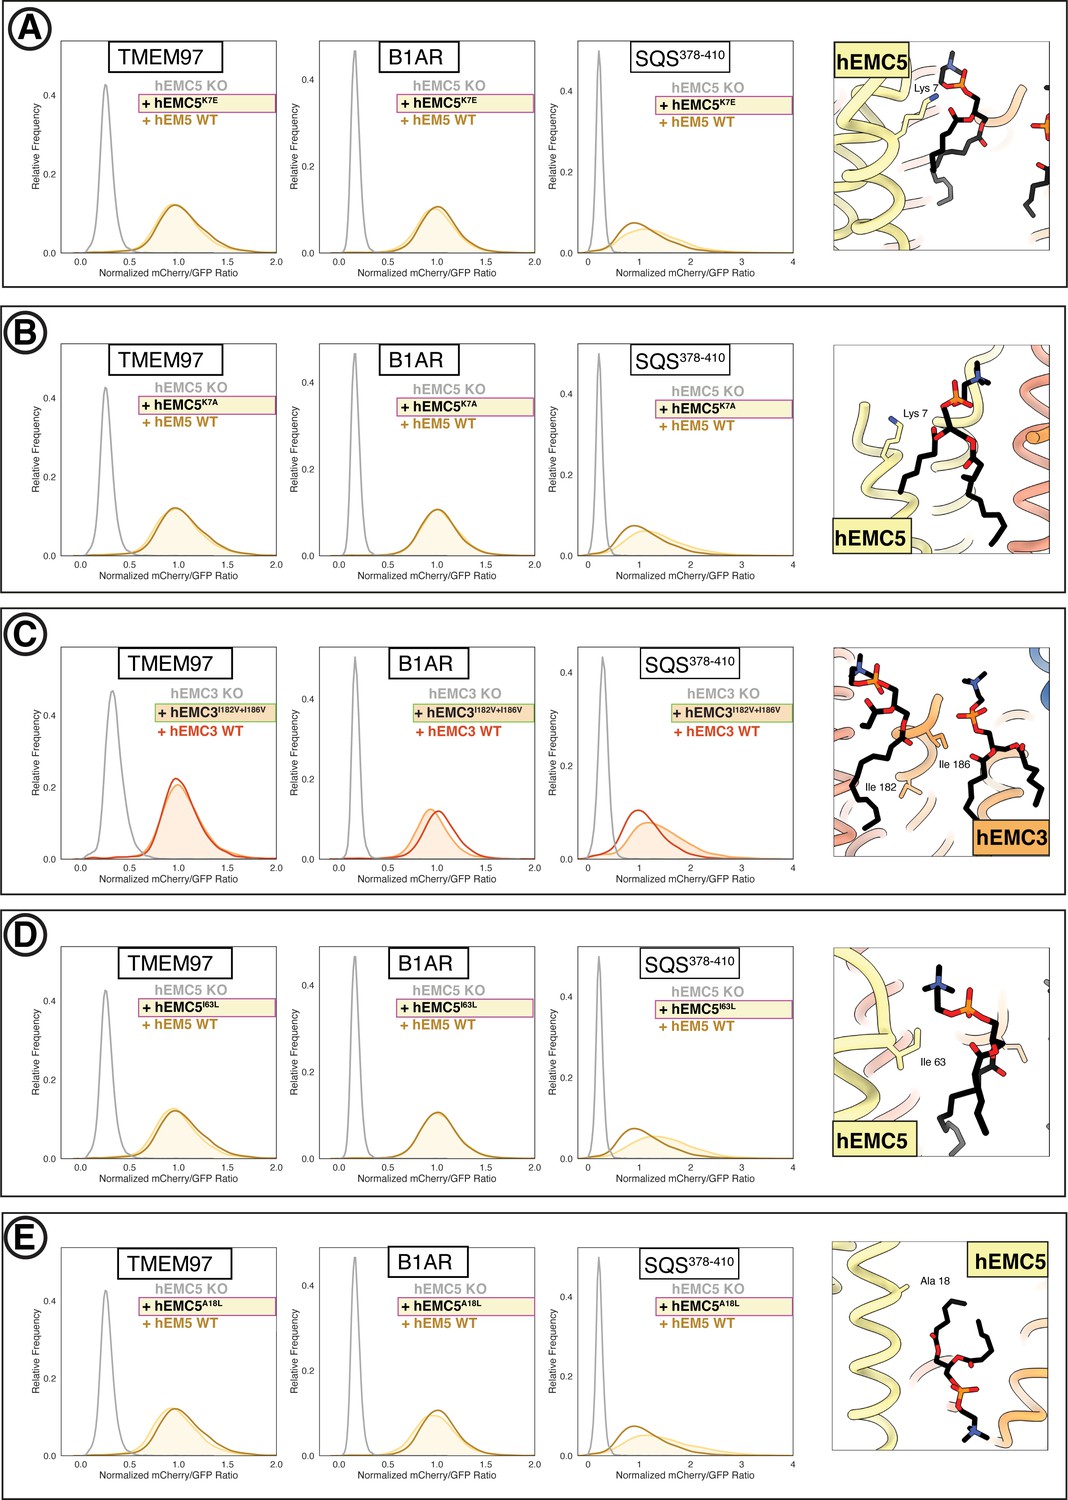
Flow cytometry of lipid-filled cavity mutants.
(A) Mutant hEMC5K7E with TMEM97-mCherry, B1AR-mCherry, and mCherry- SQS378-410 cell lines. Snapshot of hEMC ND model displaying the residues mutated. (B) Mutant hEMC5K7A with TMEM97-mCherry, B1AR-mCherry, and mCherry- SQS378-410 cell lines. Snapshot of hEMC ND model displaying the residues mutated. (C) Mutant hEMC3I182V+I186V with TMEM97-mCherry, B1AR-mCherry, and mCherry- SQS378-410 cell lines. Snapshot of hEMC ND model displaying the residues mutated. (D) Mutant hEMC5I63L with TMEM97-mCherry, B1AR-mCherry, and mCherry- SQS378-410 cell lines. Snapshot of hEMC ND model displaying the residues mutated. (E) Mutant hEMC5A18L with TMEM97-mCherry, B1AR-mCherry, and mCherry- SQS378-410 cell lines. Snapshot of hEMC ND model displaying the residues mutated.
Figure 6—figure supplement 2
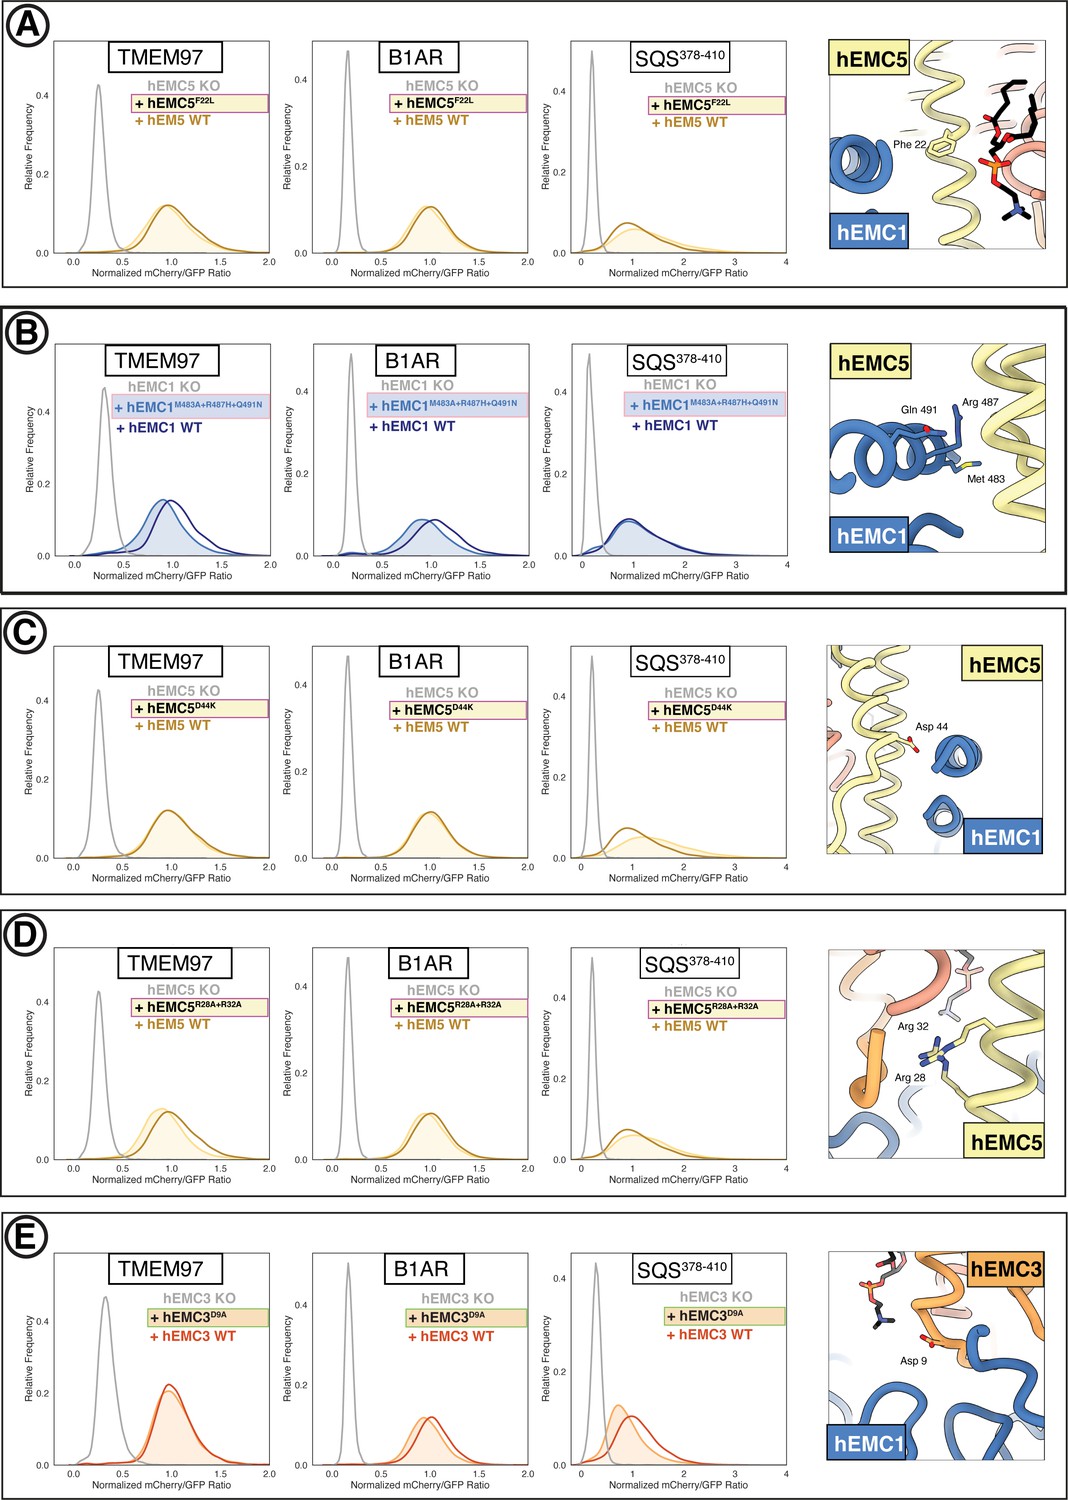
Additional flow cytometry of lipid-filled cavity mutants.
(A) Mutant hEMC5F22L with TMEM97-mCherry, B1AR-mCherry, and mCherry- SQS378-410 cell lines. Snapshot of hEMC ND model displaying the residues mutated. (B) Mutant hEMC1M483A+R487H+Q491N with TMEM97-mCherry, B1AR-mCherry, and mCherry- SQS378-410 cell lines. Snapshot of hEMC ND model displaying the residues mutated. (C) Mutant hEMC5D44K with TMEM97-mCherry, B1AR-mCherry, and mCherry- SQS378-410 cell lines. Snapshot of hEMC ND model displaying the residues mutated. (D) Mutant hEMC5R28A+R32A with TMEM97-mCherry, B1AR-mCherry, and mCherry- SQS378-410 cell lines. Snapshot of hEMC ND model displaying the residues mutated. (E) Mutant hEMC3D9A with TMEM97-mCherry, B1AR-mCherry, and mCherry- SQS378-410 cell lines. Snapshot of hEMC ND model displaying the residues mutated.
Figure 7 with 3 supplements

The large EMC lumenal domain is the site for several annotated disease mutations.
(A) Two views of the hEMC nanodisc structure. Two beta propellers are present in EMC1, one proximal to the membrane and one distal. (B) EMC1 is the largest EMC subunit and differs in size between yeast and human. Shown are human EMC1 (nanodisc), an overlay of human and yeast EMC1 (both nanodisc), and yeast EMC1 (nanodisc). (C) The hEMC1R881C mutant sits near the EMC4 lumenal gate anchor. Left: Location of the mutation (colored pink). Right: Fluorescent client R881C reporter stability assay for hEMC1. (D) As in (C) for for the hEMC1G868R mutant. (E) As in (C) for the hEMC1D31K mutant.
Figure 7—figure supplement 1
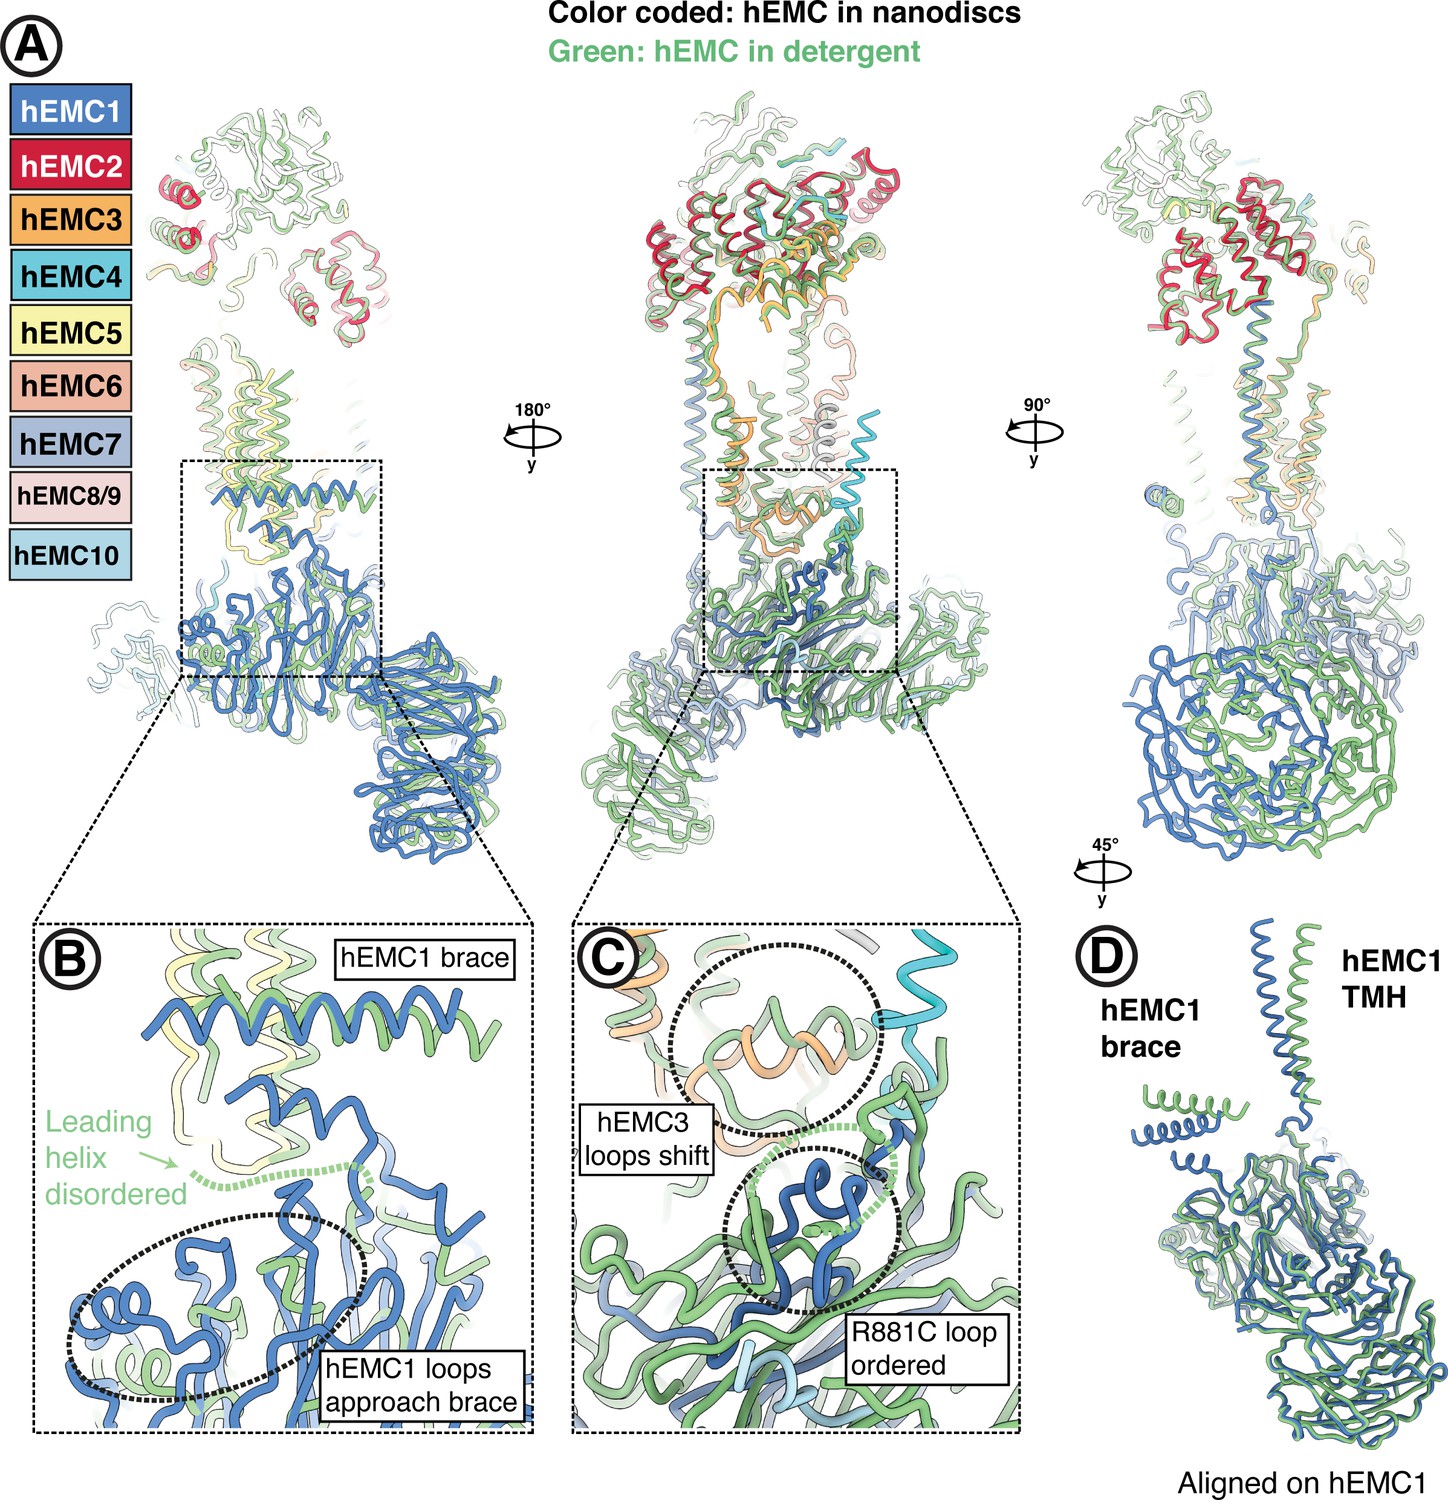
Conformational heterogeneity of the hEMC lumenal domain between detergent and nanodisc maps.
(A) Superposition of hEMC in detergent (green) and nanodiscs (color-coded). Models were aligned on hEMC2 (cytoplasm) and hEMC5 (transmembrane), revealing a rotation of the lumenal domain. (B) Enlarged view on the superposition around the area of the hEMC1 brace and the membrane proximal beta-propeller. A helix leading toward the amphipathic brace is resolved in the nanodisc map and disordered in the detergent map. In the nanodisc structure, several proximal propeller loops approach and form stabilizing interactions with the leading helix (dashed circle). (C) Enlarged view on the superposition around the area of the lumenal hydrophobic seal of the gated cavity. The loop stabilized by hEMC1R881 (corresponding to the disease mutant R881C) is well resolved in the hEMC nanodisc map and more disordered in the detergent map. The loops of the hEMC3 hydrophobic seal shift concomitantly with the lumenal rotation between detergent and nanodisc structures. (D) Structural alignment of hEMC1 from the detergent (green) and nanodisc (blue) models. While the beta-propellers align extremely well, a clear rotation of the hEMC1 brace and the hEMC1 transmembrane helix can be observed.
Figure 7—figure supplement 2
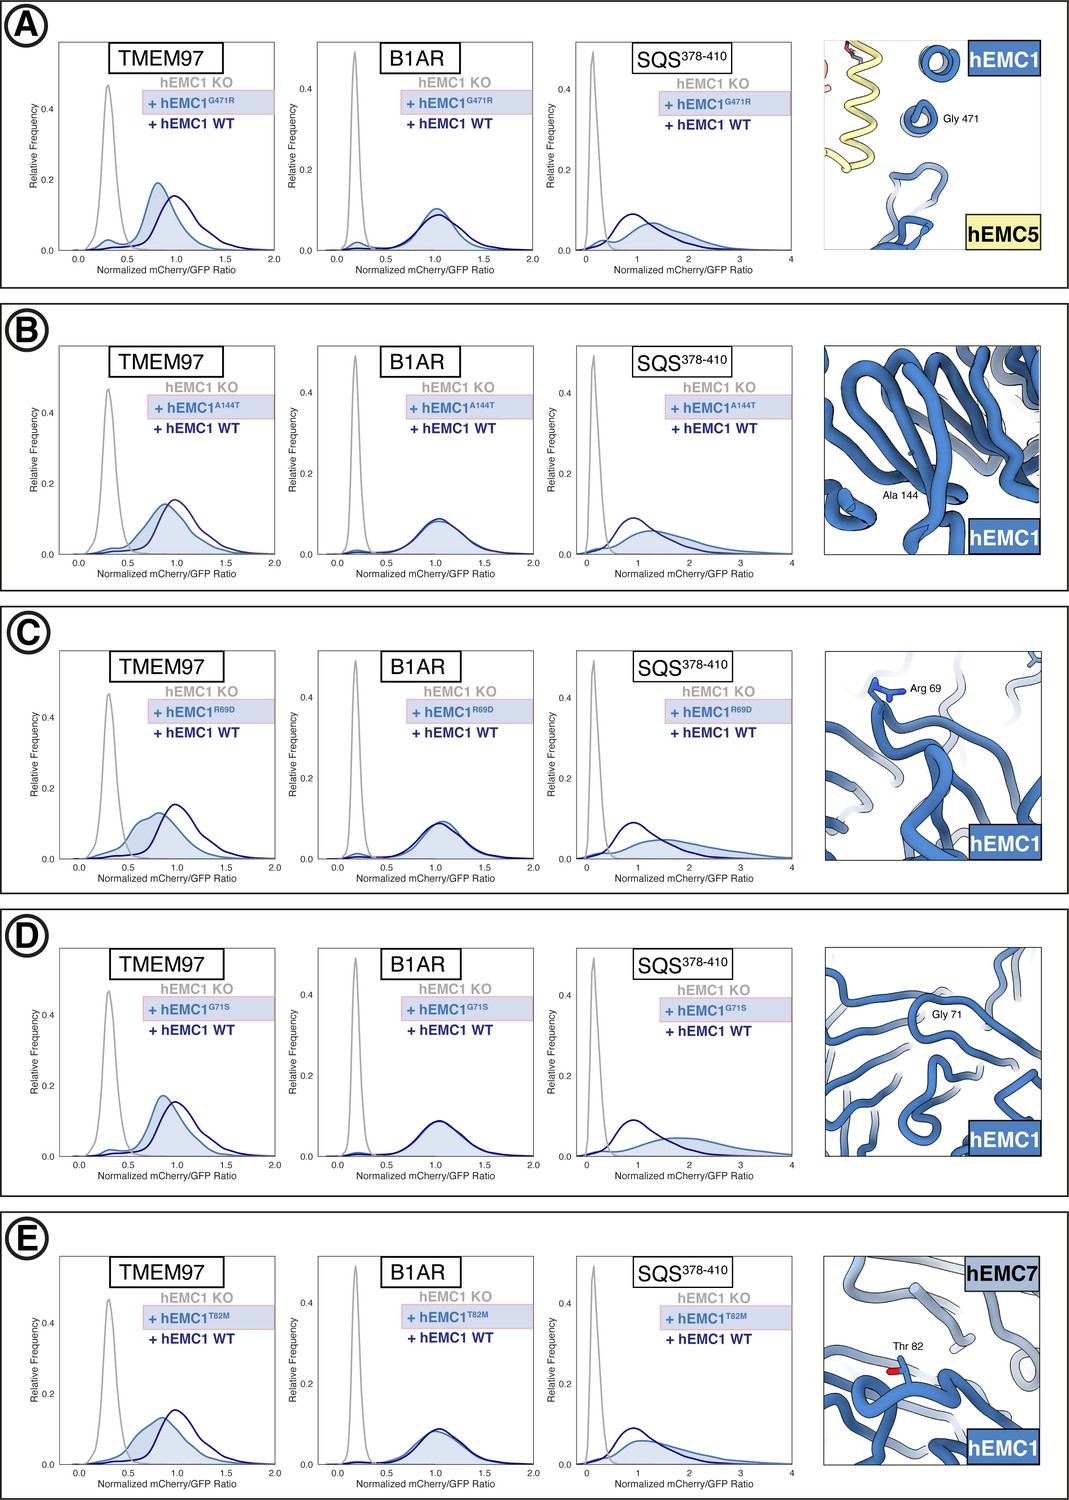
Flow cytometry of lumenal domain mutants.
(A) Mutant hEMC1G471R with TMEM97-mCherry, B1AR-mCherry, and mCherry- SQS378-410 cell lines. Snapshot of hEMC ND model displaying the residues mutated. (B) Mutant hEMC1A144T with TMEM97-mCherry, B1AR-mCherry, and mCherry- SQS378-410 cell lines. Snapshot of hEMC ND model displaying the residues mutated. (C) Mutant hEMC1R69D with TMEM97-mCherry, B1AR-mCherry, and mCherry- SQS378-410 cell lines. Snapshot of hEMC ND model displaying the residues mutated. (D) Mutant hEMC1G71S with TMEM97-mCherry, B1AR-mCherry, and mCherry- SQS378-410 cell lines. Snapshot of hEMC ND model displaying the residues mutated. (E) Mutant hEMC1T82M with TMEM97-mCherry, B1AR-mCherry, and mCherry- SQS378-410 cell lines. Snapshot of hEMC ND model displaying the residues mutated.
Figure 7—figure supplement 3
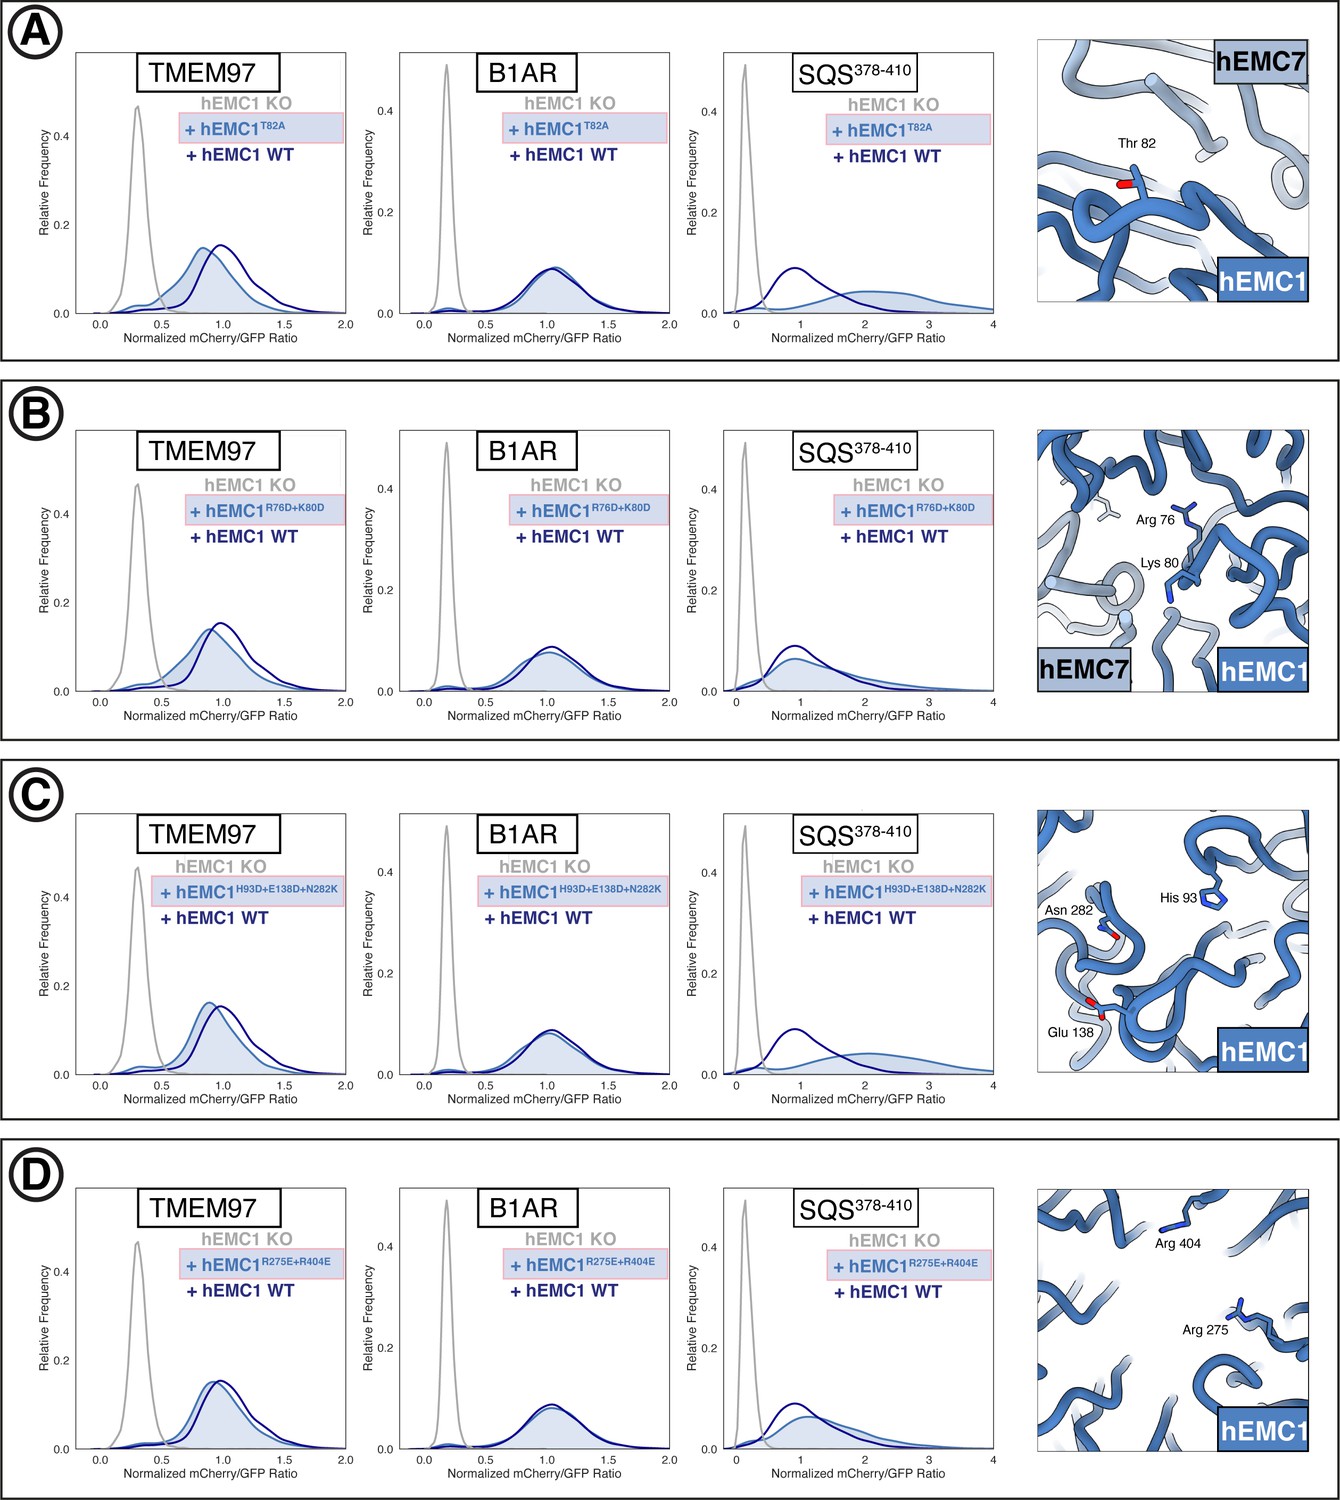
Additional flow cytometry of lumenal domain mutants.
(A) Mutant hEMC1T82A with TMEM97-mCherry, B1AR-mCherry, and mCherry- SQS378-410 cell lines. Snapshot of hEMC ND model displaying the residues mutated. (B) Mutant hEMC1R76D+K80D with TMEM97-mCherry, B1AR-mCherry, and mCherry- SQS378-410 cell lines. Snapshot of hEMC ND model displaying the residues mutated. (C) Mutant hEMC1H93D+E138D+N282K with TMEM97-mCherry, B1AR-mCherry, and mCherry- SQS378-410 cell lines. Snapshot of hEMC ND model displaying the residues mutated. (D) Mutant hEMC1R275E+R404E with TMEM97-mCherry, B1AR-mCherry, and mCherry- SQS378-410 cell lines. Snapshot of hEMC ND model displaying the residues mutated.
Figure 8
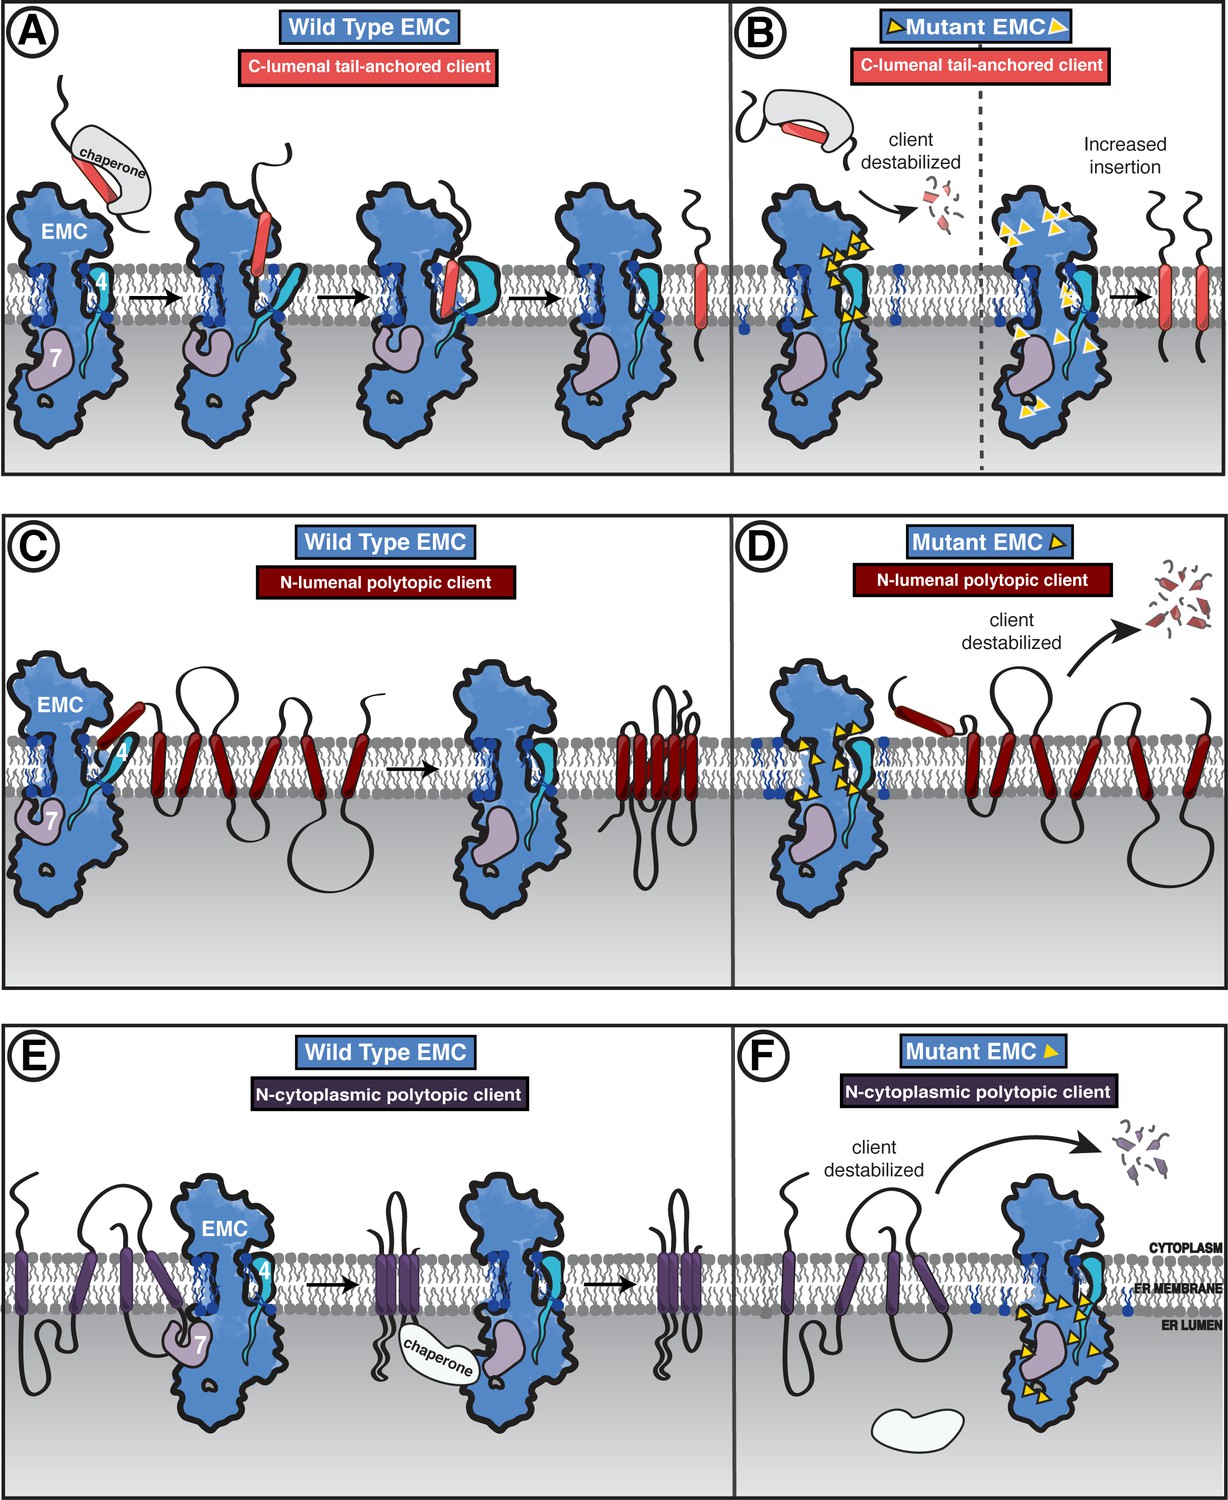
Model of coordinated EMC functions.
(A) Model of EMC insertase function for a C-lumenal tail-anchored client. Cytosolic factors bring post-translationally localized clients to the ER. Then the client engages the EMC cytoplasmic domain. The polar roof modulates entry into the gated cavity. A hydrophobic slide facilitates the client helix fully entering the cavity. A lateral movement of the gate releases the client helix into the membrane and the EMC gate closes. (B) Our mutagenesis data provide the following insights into EMC regions of functional importance for each of the three client types we tested. Mutants are depicted by yellow triangles. Tail-anchored client (coral) abundance was depleted upon mutagenesis of the cytoplasmic domain entrance to the gated cavity, polar and charged residues at the cytoplasm-membrane boundary, residues along the length of the gated cavity, in the hydrophobic seal to the lumen, and lipid interacting residues in both cavities (left). We also observed a subset of mutants that resulted in higher levels of the C-lumenal tail-anchored client (right) that are positioned in the cytoplasmic domain cap, throughout the ER lumenal domain, and one mutation at the center of the gated cavity. (C) The EMC facilitates biogenesis of N-lumenal polytopic client protein B1AR (dark red). (D) Regions important for B1AR stability primarily map to the transmembrane region of the EMC structure, with depletion observed for lipid proximal residues on both sides of the cavity, the polar entrance roof of the gated cavity, and the EMC1 brace helix. (E) The EMC facilitates biogenesis of N-cytoplasmic polytopic client protein TMEM97 (dark purple). (F) Regions important for TMEM97 stability were primarily located in the lumenal domain spanning both propellers, in EMC1. In addition to these lumenal regions, there was a depletion of TMEM97 at the lipid-interacting positions at the lumenal interface of both membrane cavities of the EMC. Figure - Figure Supplement legends.
Scheme 1
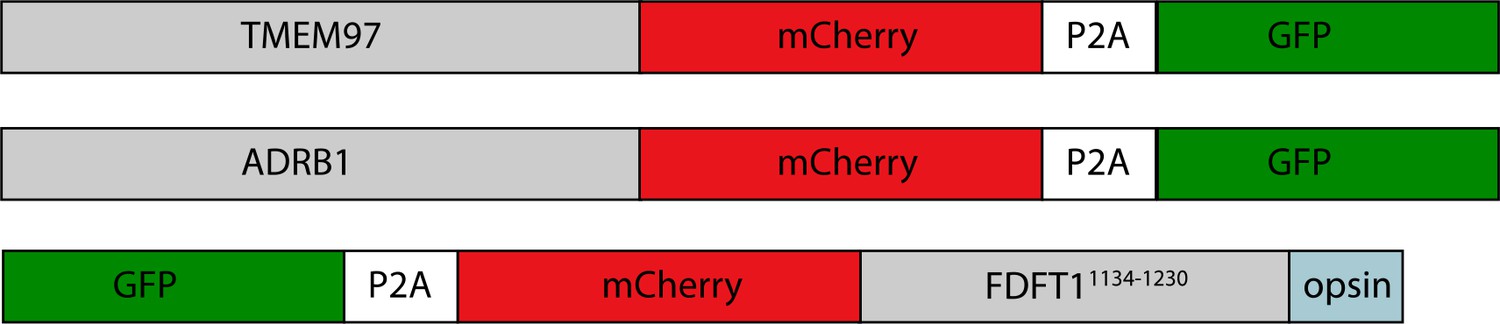
Client reporters.
Scheme 2

hEMC subunit mutation construct design.
Videos
Video 1
hEMC mutagenesis displayed on hEMC structures.
Three identical copies of hEMC in nanodisc (colored blue) are displayed here. Subsequent labeling and coloring of mutated residues by flow cytometric measure of reporter abundance, grouped into three categories: increased reporter levels (mCherry > GFP signal, colored white), wild-type levels (mCherry signal is close to GFP signal, colored light blue), and decreased reporter levels (mCherry < GFP signal, colored gold). Left hEMC structure displays phenotypes for the C-lumenal tail anchor reporter (GFP-P2A-mCherry-SQS378-410-opsin). Middle hEMC structure displays phenotypes for the N-lumenal polytopic reporter (B1AR-mCherry-P2A-GFP). Right hEMC structure displays phenotypes for the N- cytoplasmic polytopic reporter (TMEM97-mCherry-P2A-GFP). Mutations with little to no phenotype are displayed as similar to wild-type levels.
Video 2
EMC transmembrane cavity gate conformations.
Overview of hEMC colored and labeled by subunit. Volume fades away to hEMC nanodisc model. hEMC nanodisc model remains constant as segmented maps of the unassigned gate helices are shown of hEMC detergent, yEMC detergent, and yEMC nanodisc maps. hEMC is colored cyan, yEMC is colored dark cyan, and gate helices are colored in shades of gray and purple as indicated by the label on the left. Two residues are shown in stick representation colored gold.
Video 3
hEMC lumenal domain differences between nanodisc and detergent models.
Overview of hEMC nanodisc model colored and labeled by subunit. Structural landmarks are labeled. hEMC detergent model (colored gray) fades in and both models rotate. As the models rotate several structural features are highlighted.
Tables
Table 1
Cryo-EM data acquisition, reconstruction, and model refinement statistics.
| yEMC in detergent dataset 1 | yEMC in detergent dataset 2 | yEMC in nanodiscs | hEMC in detergent | hEMC in nanodiscs | |
|---|---|---|---|---|---|
| EMDB accession code | EMD-23033 | EMD-23003 | EMD-11733 | EMD-11732 | |
| PDB accession code | PDB-7KTX | PDB-7KRA | PDB-7ADP | PDB-7ADO | |
| Data collection and processing | |||||
| Microscope | FEI Technai Polara | FEI Titan Krios | FEI Titan Krios | FEI Titan Krios | FEI Titan Krios |
| Camera | Gatan K2 Summit | Gatan K2 Summit | Gatan K3 | Gatan K3 | Gatan K3 |
| Magnification | 31,000x | 22,500x | 105,000x | 81,000x | 105,000x |
| Voltage (kV) | 300 | 300 | 300 | 300 | 300 |
| Electron exposure (e-/Å2) | 56.8 | 58.3 | 67 | 62 | 72 |
| Defocus range (µm) | −1.0 to −3.0 | −1.0 to −3.0 | −0.8 to −2.5 | 0.7–2.8 | 0.7–2.8 |
| Pixel size (Å) | 1.22 | 1.31 | 0.853 | 1.094 | 0.8512 |
| Software | Relion 2.0, Relion 3.0, THUNDER | Relion 2.0, Relion 3.0, THUNDER | Relion 3.0, cryoSPARC v2 | Relion 3.0, cryoSPARC v2 | Relion 3.0, cryoSPARC v2 |
| Symmetry imposed | C1 | C1 | C1 | C1 | C1 |
| Initial particle images (no.) | 419,907 | 670,078 | 6,100,000 | 3,350,000 | 5,900,000 |
| Final particle images (no.) | 83,599 | 170,186 | 230,528 | 144,222 | 177,560 |
| Overall map resolution (Å) | 8 | 7 | |||
| FSC threshold 0.143 | 4.3 (combined) | 3.2 | 3.60 | 3.39 | |
| Local map resolution range (Å) | 3.6–6.4 | 2.6–6.4 | 2.8–6.0 | 3.0–7.2 | |
| Refinement | |||||
| Software | Phenix 1.18 real-space-refine | Phenix 1.18 real-space-refine | Phenix 1.18 real-space-refine | Phenix 1.18 real-space-refine | |
| Model resolution (Å) | |||||
| FSC threshold 0.5 | 4.5 | 3.5 | 3.9 | 3.6 | |
| Map sharpening B factor (Å2) | −125 | −75 | −115 | −126 | |
| Model composition | |||||
| Non-hydrogen atoms | 17,315 | 17,293 | 15,040 | 16,652 | |
| Protein residues | 2171 | 2164 | 1880 | 2086 | |
| Ligands | NAG: 6 | NAG: 5; PCW: 1 | NAG: 2 | NAG: 4; PCW: 5 | |
| B factors (Å2) | |||||
| Protein (mean) | 167 | 107 | 111 | 126 | |
| Ligand (mean) | 146 | 92 | 107 | 127 | |
| R.m.s. deviations | |||||
| Bond lengths (Å) | 0.006 | 0.005 | 0.005 | 0.005 | |
| Bond angles (°) | 0.988 | 0.804 | 0.718 | 0.782 | |
| Validation | |||||
| MolProbity score | 1.44 | 1.29 | 1.46 | 1.28 | |
| Clashscore | 8.1 | 3.5 | 9 | 6 | |
| Ramachandran plot | |||||
| Favored (%) | 98 | 97 | 97 | 97 | |
| Allowed (%) | 2 | 3 | 3 | 3 | |
| Disallowed (%) | 0 | 0 | 0 | 0 | |
Key resources table
| Reagent type (species) or resource | Designation | Source or reference | Identifiers | Additional information | |
|---|---|---|---|---|---|
| Gene (Homo sapiens) | hEMC1 | NIH Mammalian Gene Collection | NCBI: BC034589 | ||
| Gene (Homo sapiens) | hEMC2 | NIH Mammalian Gene Collection | NCBI: BC021667 | ||
| Gene (Homo sapiens) | hEMC3 | NIH Mammalian Gene Collection | NCBI: BC022807 | ||
| Gene (Homo sapiens) | hEMC4 | Genestrand (Eurofins, Germany) | Uniprot: Q5J8M3-1 | ||
| Gene (Homo sapiens) | hEMC5 | NIH Mammalian Gene Collection | NCBI: BC033588 | ||
| Gene (Homo sapiens) | hEMC6 | NIH Mammalian Gene Collection | NCBI: BC001409 | ||
| Gene (Homo sapiens) | hEMC7 | NIH Mammalian Gene Collection | NCBI: BC104936 | ||
| Gene (Homo sapiens) | hEMC8 | NIH Mammalian Gene Collection | NCBI: BC020250 | ||
| Gene (Homo sapiens) | hEMC9 | NIH Mammalian Gene Collection | NCBI: BC002491 | ||
| Gene (Homo sapiens) | hEMC10 | Genestrand (Eurofins, Germany) | Uniprot: Q5UCC4-1 | ||
| Gene (Saccharomyces cerevisiae) | yEMC1 | Uniprot | Uniprot: P25574 | ||
| Gene (Saccharomyces cerevisiae) | yEMC2 | Uniprot | Uniprot: P47133 | ||
| Gene (Saccharomyces cerevisiae) | yEMC3 | Uniprot | Uniprot: P36039 | ||
| Gene (Saccharomyces cerevisiae) | yEMC4 | Uniprot | Uniprot: P53073 | ||
| Gene (Saccharomyces cerevisiae) | yEMC5 | Uniprot | Uniprot: P40540 | ||
| Gene (Saccharomyces cerevisiae) | yEMC6 | Uniprot | Uniprot: Q12431 | ||
| Gene (Saccharomyces cerevisiae) | yEMC7 | Uniprot | Uniprot: P39543 | ||
| Gene (Saccharomyces cerevisiae) | yEMC10 | Uniprot | Uniprot: Q12025 | ||
| Recombinant DNA reagent | pX458 | Addgene | pX458 | ||
| Recombinant DNA reagent | pKDP041 | This study; available from the Weissman Lab | Cas9-sfGFP- EMC5 sgRNA3 | single guide KO system targeting EMC5 gene | |
| Recombinant DNA reagent | pKDP077 | This study; available from the Weissman Lab | Cas9-sfGFP-EMC1_ sgRNA3_sgRNA4 | dual guide KO system targeting EMC1 gene | |
| Recombinant DNA reagent | pKDP080 | This study; available from the Weissman Lab | Cas9-sfGFP-EMC2_ sgRNA4_sgRNA5 | dual guide KO system targeting EMC2 gene | |
| Recombinant DNA reagent | pKDP083 | This study; available from the Weissman Lab | Cas9-sfGFP-EMC3_ sgRNA1_sgRNA2 | dual guide KO system targeting EMC3 gene | |
| Recombinant DNA reagent | pKDP119 | This study; available from the Weissman Lab | SFFV-insert site- IRES-Puro-P2A-BFP | parental vector | |
| Recombinant DNA reagent | pKDP121 | This study; available from the Weissman Lab | pTwist+Lenti+SFFV+ EMC1+IRES+Puro+ P2A+BFP+WPRE | EMC1 covering plasmid | |
| Recombinant DNA reagent | pKDP122 | This study; available from the Weissman Lab | pTwist+Lenti+SFFV+ EMC3+IRES+Puro+ P2A+BFP+WPRE | EMC3 covering plasmid | |
| Recombinant DNA reagent | pKDP124 | This study; available from the Weissman Lab | pTwist+Lenti+SFFV+ EMC5+IRES+Puro+ P2A+BFP+WPRE | EMC5 covering plasmid | |
| Recombinant DNA reagent | pKDP125 | This study; available from the Weissman Lab | pTwist+Lenti+SFFV+ EMC2+IRES+Puro+ P2A+BFP+WPRE | EMC2 covering plasmid | |
| Recombinant DNA reagent | pKDP110 | This study; available from the Weissman Lab | bAR1_mCherry_ P2A_GFP | See Supplementary file 5 for sequence | |
| Recombinant DNA reagent | pKDP111 | This study; available from the Weissman Lab | TMEM97_mCherry_ P2A_GFP | See Supplementary file 5 for sequence | |
| Recombinant DNA reagent | pKDP136 | This study; available from the Weissman Lab | GFP_P2A_mCherry_ SQS_TMD_opsintag | See Supplementary file 5 for sequence | |
| Recombinant DNA reagent | pKDP119_hsEMC1_ mut_D31K | Twist; available from the Weissman Lab | hsEMC1_mut_D31K | See Supplementary file 5 for sequence | |
| Recombinant DNA reagent | pKDP119_hsEMC1_ mut_R69D | Twist; available from the Weissman Lab | hsEMC1_mut_R69D | See Supplementary file 5 for sequence | |
| Recombinant DNA reagent | pKDP119_hsEMC1_ mut_G71S | Twist; available from the Weissman Lab | hsEMC1_mut_G71S | See Supplementary file 5 for sequence | |
| Recombinant DNA reagent | pKDP119_ hsEMC1_mut_ R76D_K80D | Twist; available from the Weissman Lab | hsEMC1_mut_ R76D_K80D | See Supplementary file 5 for sequence | |
| Recombinant DNA reagent | pKDP119_hsEMC1_ mut_T82M | Twist; available from the Weissman Lab | hsEMC1_mut_T82M | See Supplementary file 5 for sequence | |
| Recombinant DNA reagent | pKDP119_hsEMC1_ mut_T82A | Twist; available from the Weissman Lab | hsEMC1_mut_T82A | See Supplementary file 5 for sequence | |
| Recombinant DNA reagent | pKDP119_hsEMC1_ mut_A144T | Twist; available from the Weissman Lab | hsEMC1_mut_A144T | See Supplementary file 5 for sequence | |
| Recombinant DNA reagent | pKDP119_hsEMC1_ mut_H93D_E138D_N282K | Twist; available from the Weissman Lab | hsEMC1_mut_H93D_ E138D_N282K | See Supplementary file 5 for sequence | |
| Recombinant DNA reagent | pKDP119_hsEMC1_ mut_R275E_R404E | Twist; available from the Weissman Lab | hsEMC1_mut_ R275E_R404E | See Supplementary file 5 for sequence | |
| Recombinant DNA reagent | pKDP119_hsEMC1_ mut_G471R | Twist; available from the Weissman Lab | hsEMC1_mut_G471R | See Supplementary file 5 for sequence | |
| Recombinant DNA reagent | pKDP119_hsEMC1_ mut_F473Y_R487K | Twist; available from the Weissman Lab | hsEMC1_mut_ F473Y_R487K | See Supplementary file 5 for sequence | |
| Recombinant DNA reagent | pKDP119_hsEMC1_ mut_M483A_ R487H_Q491N | Twist; available from the Weissman Lab | hsEMC1_mut_M483A_ R487H_Q491N | See Supplementary file 5 for sequence | |
| Recombinant DNA reagent | pKDP119_hsEMC1_ mut_G868R | Twist; available from the Weissman Lab | hsEMC1_mut_G868R | See Supplementary file 5 for sequence | |
| Recombinant DNA reagent | pKDP119_hsEMC1_ mut_R881C | Twist; available from the Weissman Lab | hsEMC1_mut_R881C | See Supplementary file 5 for sequence | |
| Recombinant DNA reagent | pKDP119_hsEMC1_ mut_K951A_K957A | Twist; available from the Weissman Lab | hsEMC1_mut_ K951A_K957A | See Supplementary file 5 for sequence | |
| Recombinant DNA reagent | pKDP119_hsEMC2_ mut_K18A_K21A | Twist; available from the Weissman Lab | hsEMC2_mut_ K18A_K21A | See Supplementary file 5 for sequence | |
| Recombinant DNA reagent | pKDP119_hsEMC2_ mut_R80A_R81A_ K90A_R112A | Twist; available from the Weissman Lab | hsEMC2_mut_R80A_ R81A_K90A_R112A | See Supplementary file 5 for sequence | |
| Recombinant DNA reagent | pKDP119_hsEMC2_ mut_K125E_R126D_K127E | Twist; available from the Weissman Lab | hsEMC2_mut_K125E_ R126D_K127E | See Supplementary file 5 for sequence | |
| Recombinant DNA reagent | pKDP119_hsEMC2_ mut_N137A_N167A | Twist; available from the Weissman Lab | hsEMC2_mut_ N137A_N167A | See Supplementary file 5 for sequence | |
| Recombinant DNA reagent | pKDP119_hsEMC2_ mut_E146A_E149A_Q150A | Twist; available from the Weissman Lab | hsEMC2_mut_E146A_ E149A_Q150A | See Supplementary file 5 for sequence | |
| Recombinant DNA reagent | pKDP119_hsEMC2_ mut_E168A_D170A_K173A | Twist; available from the Weissman Lab | hsEMC2_mut_E168A_ D170A_K173A | See Supplementary file 5 for sequence | |
| Recombinant DNA reagent | pKDP119_hsEMC2_ mut_E206A_E209A_D252A | Twist; available from the Weissman Lab | hsEMC2_mut_E206A_ E209A_D252A | See Supplementary file 5 for sequence | |
| Recombinant DNA reagent | pKDP119_hsEMC2_ mut_K248E_D252K_K255E | Twist; available from the Weissman Lab | hsEMC2_mut_K248E_ D252K_K255E | See Supplementary file 5 for sequence | |
| Recombinant DNA reagent | pKDP119_hsEMC2_mut_ R266A_Q269A_R273A | Twist; available from the Weissman Lab | hsEMC2_mut_R266A_ Q269A_R273A | See Supplementary file 5 for sequence | |
| Recombinant DNA reagent | pKDP119_hsEMC2_mut_ Q269A_E286A_E290A | Twist; available from the Weissman Lab | hsEMC2_mut_Q269A_ E286A_E290A | See Supplementary file 5 for sequence | |
| Recombinant DNA reagent | pKDP119_hsEMC3_WT | Twist; available from the Weissman Lab | hsEMC3_WT | See Supplementary file 5 for sequence | |
| Recombinant DNA reagent | pKDP119_hsEMC3_ mut_D9A | Twist; available from the Weissman Lab | hsEMC3_mut_D9A | See Supplementary file 5 for sequence | |
| Recombinant DNA reagent | pKDP119_hsEMC3_ mut_R13E | Twist; available from the Weissman Lab | hsEMC3_mut_R13E | See Supplementary file 5 for sequence | |
| Recombinant DNA reagent | pKDP119_hsEMC3_ mut_K42A_K43A | Twist; available from the Weissman Lab | hsEMC3_mut_ K42A_K43A | See Supplementary file 5 for sequence | |
| Recombinant DNA reagent | pKDP119_hsEMC3_ mut_E63K_D213K_E223K | Twist; available from the Weissman Lab | hsEMC3_mut_E63K_ D213K_E223K | See Supplementary file 5 for sequence | |
| Recombinant DNA reagent | pKDP119_hsEMC3_ mut_K70Y | Twist; available from the Weissman Lab | hsEMC3_mut_K70Y | See Supplementary file 5 for sequence | |
| Recombinant DNA reagent | pKDP119_hsEMC3_ mut_V118A_I122A | Twist; available from the Weissman Lab | hsEMC3_mut_ V118A_I122A | See Supplementary file 5 for sequence | |
| Recombinant DNA reagent | pKDP119_hsEMC3_ mut_N114D_N117D | Twist; available from the Weissman Lab | hsEMC3_mut_ N114D_N117D | See Supplementary file 5 for sequence | |
| Recombinant DNA reagent | pKDP119_hsEMC3_ mut_R180A | Twist; available from the Weissman Lab | hsEMC3_mut_R180A | See Supplementary file 5 for sequence | |
| Recombinant DNA reagent | pKDP119_hsEMC3_ mut_R59E_R62E_K216E | Twist; available from the Weissman Lab | hsEMC3_mut_R59E_ R62E_K216E | See Supplementary file 5 for sequence | |
| Recombinant DNA reagent | pKDP119_hsEMC3_ mut_R147E | Twist; available from the Weissman Lab | hsEMC3_mut_R147E | See Supplementary file 5 for sequence | |
| Recombinant DNA reagent | pKDP119_hsEMC3_ mut_F148L | Twist; available from the Weissman Lab | hsEMC3_mut_F148L | See Supplementary file 5 for sequence | |
| Recombinant DNA reagent | pKDP119_hsEMC3_ mut_M151L | Twist; available from the Weissman Lab | hsEMC3_mut_M151L | See Supplementary file 5 for sequence | |
| Recombinant DNA reagent | pKDP119_hsEMC3_ mut_I186V_I182V | Twist; available from the Weissman Lab | hsEMC3_mut_ I186V_I182V | See Supplementary file 5 for sequence | |
| Recombinant DNA reagent | pKDP119_hsEMC3_ mut_K244A_ H247A_E249A | Twist; available from the Weissman Lab | hsEMC3_mut_K244A_ H247A_E249A | See Supplementary file 5 for sequence | |
| Recombinant DNA reagent | pKDP119_hsEMC5_WT | Twist; available from the Weissman Lab | hsEMC5_WT | See Supplementary file 5 for sequence | |
| Recombinant DNA reagent | pKDP119_hsEMC5_ mut_A18L | Twist; available from the Weissman Lab | hsEMC5_mut_A18L | See Supplementary file 5 for sequence | |
| Recombinant DNA reagent | pKDP119_hsEMC5_ mut_D44K | Twist; available from the Weissman Lab | hsEMC5_mut_D44K | See Supplementary file 5 for sequence | |
| Recombinant DNA reagent | pKDP119_hsEMC5_ mut_D82A_R85A | Twist; available from the Weissman Lab | hsEMC5_mut_ D82A_R85A | See Supplementary file 5 for sequence | |
| Recombinant DNA reagent | pKDP119_hsEMC5_ mut_F22L | Twist; available from the Weissman Lab | hsEMC5_mut_F22L | See Supplementary file 5 for sequence | |
| Recombinant DNA reagent | pKDP119_hsEMC5_ mut_E75A | Twist; available from the Weissman Lab | hsEMC5_mut_E75A | See Supplementary file 5 for sequence | |
| Recombinant DNA reagent | pKDP119_hsEMC5_ mut_H19L_S23A_Q26L | Twist; available from the Weissman Lab | hsEMC5_mut_H19L_ S23A_Q26L | See Supplementary file 5 for sequence | |
| Recombinant DNA reagent | pKDP119_hsEMC5_ mut_K7A | Twist; available from the Weissman Lab | hsEMC5_mut_K7A | See Supplementary file 5 for sequence | |
| Recombinant DNA reagent | pKDP119_hsEMC5_ mut_K7E | Twist; available from the Weissman Lab | hsEMC5_mut_K7E | See Supplementary file 5 for sequence | |
| Recombinant DNA reagent | pKDP119_hsEMC5_ mut_R28A_R32A | Twist; available from the Weissman Lab | hsEMC5_mut_ R28A_R32A | See Supplementary file 5 for sequence | |
| Recombinant DNA reagent | pKDP119_hsEMC5_ mut_I63L | Twist; available from the Weissman Lab | hsEMC5_mut_I63L | See Supplementary file 5 for sequence | |
| Recombinant DNA reagent | pKDP119_hsEMC5_ mut_F90A | Twist; available from the Weissman Lab | hsEMC5_mut_F90A | See Supplementary file 5 for sequence | |
| Antibody | Mouse GAPDH Primary Antibody | Abcam | ab8245 | See Supplementary file 5 for sequence | |
| Antibody | Rabbit TMEM97 primary | ThermoFisher Scientific | PA-23003 | ||
| Antibody | Rabbit FDFT1 Primary Antibody | Abcam | ab195046 | ||
| Antibody | Rat BAP31 Primary Antibody | ThermoFisher Scientific | MA3-002 | ||
| Antibody | Rabbit (KIAA0090) EMC1 primary antibody | Abcam | ab242112 | ||
| Antibody | Rabbit TTC35 (EMC2) primary antibody | Proteintech | 25443–1-AP | ||
| Antibody | Rabbit TM111 (EMC3) primary antibody | ThermoFisher Scientific | #711771 | ||
| Antibody | Rabbit EMC4 primary antibody | Abcam | ab184544 | ||
| Antibody | Rabbit MMGT1 (EMC5) primary antibody | Bethyl Laboratories | A305-833A-M | ||
| Antibody | Rabbit (C19orf63) EMC10 primary antibody | Abcam | ab180148 | ||
| Antibody | IRDye 800CW Goat anti-Mouse IgG Secondary Antibody | LI-COR Biosciences | 925–32210 | ||
| Antibody | IRDye 800CW Goat anti-Rabbit IgG Secondary Antibody | LI-COR Biosciences | 926–32211 | ||
| Peptide, recombinant protein | Fab DE4 | This study; available from the Weissman Lab | LMV83 | LFAIPLVVPFYSHSALDVVMTQSPLSLPV TPGEPASISCRSSQTLMNRNGNNFLDW YVQKPGQSPQLLIYLGSNRAPGVPDRFS GSGSGTDFTLKISRLEVEDVGVYYCMQA LQTPRTFGQGTKVEIKRTVAAPSVFIFPP SDEQLKSGTASVVCLLNNFYPREAKVQW KVDNALQSGNSQESVTEQDSKDSTYSLS STLTLSKADYEKHKVYACEVTHQGLSSP VTKSFNRGEC-- MAQVQLQQWGAGLLKPSETLSLTCAVYG GSFSGYYWSWIRQPPGKGLEWIGEINHS GSTNYNPSLKSRVTISVDTSKKQFSLKLS SVTAADTAVYYCARFSYYGSGIYWGQGTL VTVSSASTKGPSVFPLAPSSKSTSGGTAA LGCLVKDYFPEPVTVSWNSGALTSGVHT FPAVLQSSGLYSLSSVVTVPSSSLGTQTYI CNVNHKPSNTKVDKKVEPKSCAAAHHH HHHGAAEQKLISEEDLNGAA- | |
| Peptide, recombinant protein | Fab DH4 | This study; available from the Weissman Lab | LMV82 | LFAIPLVVPFYSHSALDVVMTQSPLSLPV TPGEPASISCRSSQTLMNRNGNNFLDW YLQKPGQSPQLLIYLGSNRAPGVPDRFS GSGSGTDFTLRISRVEPEDVGVYYCMQA LQTPSFGGGTKVEIRRTVAAPSVFIFPPS DEQLKSGTASVVCLLNNFYPREAKVQW KVDNALQSGNSQESVTEQDSKDSTYSL SSTLTLSKADYEKHKVYACEVTHQGLSS PVTKSFNRGEC-- MAQVQLQQWGAGLLKPSETLSLTCAVY GGSFSGYYWSWIRQPPGKGLEWIGEIN HSGSTNYNPSLKSRVTISVDTSKNQFSL KLSSVTAADTAVYYCARGLAGRGYYGSG SYLRWGQGTLVTVSSASTKGPSVFPLAP SSKSTSGGTAALGCLVKDYFPEPVTVSW NSGALTSGVHTFPAVLQSSGLYSLSSVV TVPSSSLGTQTYICNVNHKPSNTKVDK KVEPKSCAAAHHHHHHGAAE QKLISEEDLNGAA- | |
| Commercial assay or kit | Superose 6, 10/300 GL | GE Healthcare | 17517201 | ||
| Commercial assay or kit | R1.2/1.3 200 and 300 mesh Cu holey carbon grids | Quantifoil | 1210627 | ||
| Commercial assay or kit | BL21 Gold Star competent cells | Invitrogen | C602003 | ||
| Commercial assay or kit | Anti-Flag agarose beads | Millipore | A2220 | ||
| Commercial assay or kit | EconoPac Chromatography Columns | Biorad | 7321010 | ||
| Commercial assay or kit | 100 KD MW | EMD Millipore | UFC810024 | ||
| Commercial assay or kit | Superose 6, 10/300 GL | Cytiva | 29-0915-96 | ||
| Commercial assay or kit | cOmplete EDTA-free Protease Inhibitor Cocktail | Roche | catalog No. 05056489001 | ||
| Commercial assay or kit | Bio-Beads | Biorad | 1523920 | ||
| Commercial assay or kit | R1.2/1.3 200 and 300 mesh Cu holey carbon grids | Quantifoil | 1210627 | ||
| Commercial assay or kit | Ultrathin Carbon Film on Lacey Carbon Support Film, 400 mesh, Copper | Ted Pella | #01824 | ||
| Chemical compound, drug | FuGENE HD transfection reagent | Promega | E2312 | ||
| Chemical compound, drug | 1-Palmitoyl-2-oleoyl-sn- glycero-3-PC (POPC) | Cayman Chemical | 15102 | ||
| Chemical compound, drug | Glyco-diosgenin (GDN) | Anatrace | GDN101 | ||
| Chemical compound, drug | yeast extract total | Avanti Polar Lipids | 190000 P-100mg | ||
| Chemical compound, drug | Cholesteryl Hemisuccinate Tris Salt | Anatrace | CH210 5 GM | ||
| Chemical compound, drug | b-DDM | Anatrace | D310 | ||
| Chemical compound, drug | IPTG | GoldBio | I2481C5 | ||
| Chemical compound, drug | EX-CELL 420 Serum-Free Medium | Sigma-Aldrich | 14420 C | ||
| Chemical compound, drug | FreeStyle 293 Expression Medium | Thermo fischer | 12338018 | ||
| Cell line (Homo sapiens) | HEK293S GnTI- | ATCC | CRL-3022 | Mycoplasma negative | |
| Cell line (Spodoptera frugiperda) | Sf9 | Thermo Fischer | 11496015 | ||
| Cell line (Homo sapiens) | K562 crispri | Gilbert et al., 2014 | K562 crispri | ||
| Strain, strain background Saccharomyces cerevisiae | Overexpressed EMC with yEMC5-linker- TEV-linker-3xFlag | This study; available from the Weissman Lab | LMV84 | BY4743 ---- MATa/alpha, his3∆0/his3∆0, leu2∆0/leu2∆0, LYS2/lys2∆0, met15∆0/MET15, ura3∆0/ura3∆0, emc1::NatMX:: TEF2pr-EMC1/EMC1, emc3:: KanMX::TEF2pr-EMC3/EMC3, emc4::his3(CG)::TEF2pr-EMC4/ EMC4, sop4::HphMx::TEF2pr- SOP4/SOP4, EMC2/emc2::NatMX:: TEF2pr-EMC2, emc5::EMC5-TEV- 3xFLAG::ura3(KL)/emc5::his3(CG):: TEF2pr-EMC5-TEV-3xFLAG::KanMX, EMC6/emc6::HphMX::TEF2pr-EMC6, YDR056c/ydr056c::leu2(CG):: TEF2pr-ydr056c | |
| Strain, strain background Saccharomyces cerevisiae | Endogenous yEMC5- linker-TEV-linker-3xFlag | This study; available from the Weissman Lab | LMV85 | W303 ---- EMC5-3xF:ura - Linker-TEV- linker-3xFlag (GGSGSGENLYFQSGSGS DYKDDDDKDYKDDDDKDYKDDDDK) | |
| Software, algorithm | CryoSPARC version 2.12.4. | Punjani et al., 2017 | RRID:SCR_016501 | ||
| Software, algorithm | UCSF ChimeraX Version 1.0 | Goddard et al., 2018 | RRID:SCR_015872 | ||
| Software, algorithm | PHENIX Version 1.17 | Adams et al., 2011; | RRID:SCR_014224 | ||
| Software, algorithm | Coot Version 0.8 | Emsley et al., 2010 | RRID:SCR_014222 | ||
| Software, algorithm | RELION 3.1 | Kimanius et al., 2016; Zivanov et al., 2018 | http://www2.mrclmb.cam.ac.uk/relion | ||
| Software, algorithm | SerialEM | Mastronarde, 2005 | RRID:SCR_017293 | ||
Additional files
-
Supplementary file 1
Mass spectrometry analysis on purified hEMC.
SEC purified hEMC in detergent (sheet 1) or nanodiscs (sheet 2) were subjected to tryptic digestion and mass spectrometry. The tables list identified proteins sorted by iBAQ score (descending order). EMC subunits are highlighted in yellow.
- https://cdn.elifesciences.org/articles/62611/elife-62611-supp1-v3.xlsx
-
Supplementary file 2
Statistical significance values for flow cytometry data.
Table listing p-values for membrane controls (Sheet 1; relates to Figure 1—figure supplement 3) and flow cytometry for each of the three client reporters (Sheets 2, 3 and 4; relates to Main Figures 3 and 5–7 and figures supplements to those figures).
- https://cdn.elifesciences.org/articles/62611/elife-62611-supp2-v3.xlsx
-
Supplementary file 3
Comparison of EMC point mutant effects on client proteins.
Table listing point mutagenesis performed on hEMC and yEMC and assayed against different client types.
- https://cdn.elifesciences.org/articles/62611/elife-62611-supp3-v3.xlsx
-
Supplementary file 4
Uncropped western blots.
Blots provided here without cropping, related to Figure 1—figure supplements 5–6.
- https://cdn.elifesciences.org/articles/62611/elife-62611-supp4-v3.zip
-
Supplementary file 5
Plasmid sequences for hEMC mutants and reporters.
Table listing sequences of point mutagenesis plasmids used in the hEMC functional assay in this study.
- https://cdn.elifesciences.org/articles/62611/elife-62611-supp5-v3.xlsx
-
Transparent reporting form
- https://cdn.elifesciences.org/articles/62611/elife-62611-transrepform-v3.pdf
Download links
A two-part list of links to download the article, or parts of the article, in various formats.
Downloads (link to download the article as PDF)
Open citations (links to open the citations from this article in various online reference manager services)
Cite this article (links to download the citations from this article in formats compatible with various reference manager tools)
Structural and mechanistic basis of the EMC-dependent biogenesis of distinct transmembrane clients
eLife 9:e62611.
https://doi.org/10.7554/eLife.62611


