Structure of dual BON-domain protein DolP identifies phospholipid binding as a new mechanism for protein localisation
- Institute of Microbiology and Infection, University of Birmingham, United Kingdom
- School of Biosciences, University of Birmingham, United Kingdom
- Institute for Cancer and Genomic Sciences, University of Birmingham, United Kingdom
- Infection & Immunity Program, Biomedicine Discovery Institute and Department of Microbiology, Monash University, Australia
- Department of Chemistry, National University of Singapore, Singapore
- Institute for Molecular Bioscience, University of Queensland, Australia
- School of Life Sciences, The University of Warwick, United Kingdom
- Institute of Inflammation and Immunotherapy, University of Birmingham, United Kingdom
- Department of Biochemistry, University of Alberta, Canada
Figures
Figure 1 with 5 supplements
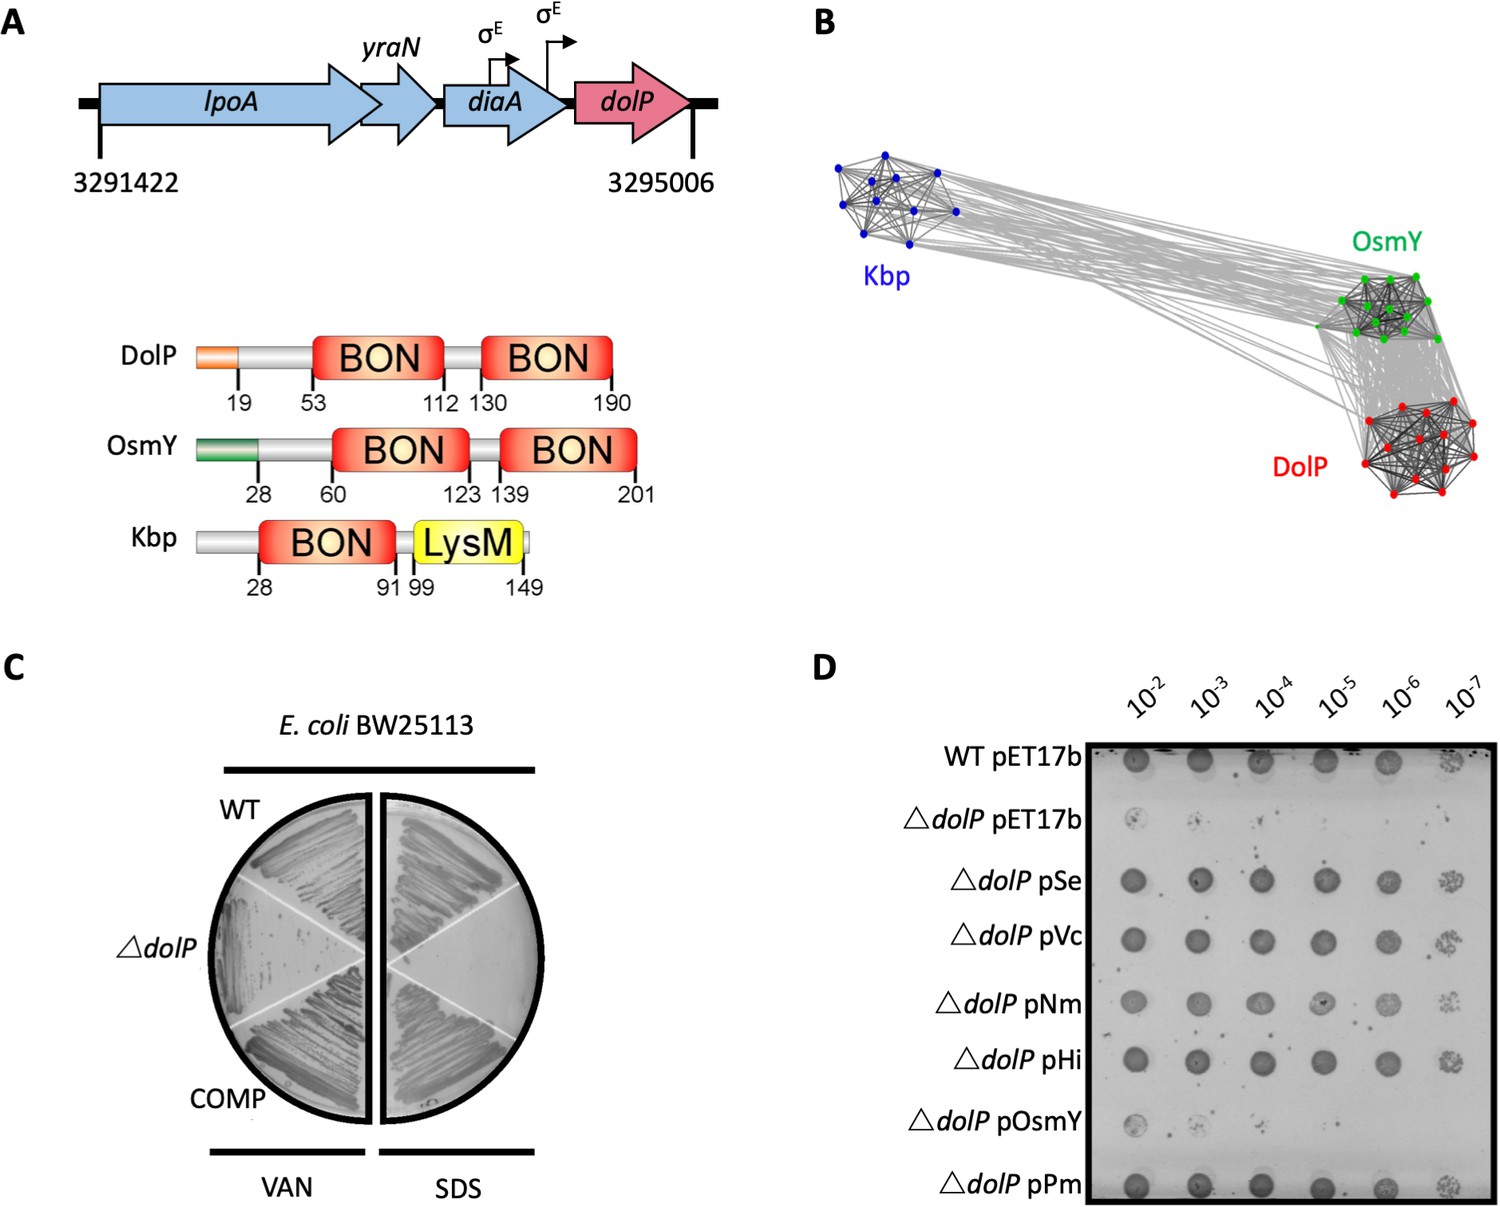
DolP is a conserved BON-domain protein with a distinct role in OM homeostasis.
(A) In E. coli, dolP is located downstream of diaA and encodes a lipoprotein with a signal sequence (orange) and two BON domains (red). The signal sequence is cleaved by LspA, the cysteine at position 19 acylated by Lgt and Lnt and finally the protein is targeted to the OM by the Lol system (Figure 1—figure supplement 1). E. coli contains three BON-domain proteins. DolP shares a similar domain organisation with OsmY, which encodes a periplasmic protein that possesses a signal sequence (green) which is recognised and cleaved by the signal peptidase LepB. Kbp is more divergent from DolP and OsmY, has no predictable signal sequence and is composed of BON and LysM domains (Figure 1—figure supplement 2). (B) DolP, OsmY and Kbp are widespread amongst proteobacteria, and cluster into three distinct groups based on the program CLANS (Frickey and Lupas, 2004) with connections shown for a P value cut-off of <10−2 (Table 4). (C) Growth phenotypes for mutant isolates lacking DolP (ΔdolP), wild-type strain (WT) or the complemented mutant (COMP). Strains were grown on LB agar containing vancomycin (100 μg/ml) or sodium dodecyl sulphate (SDS; 4.8%). (D) DolP from diverse proteobacterial species expressed in an E. coli ΔdolP strain restores growth in the presence of vancomycin as assessed by a serial dilution plate growth assay. Plasmids expressing OsmY do not complement the defect.
Figure 1—figure supplement 1
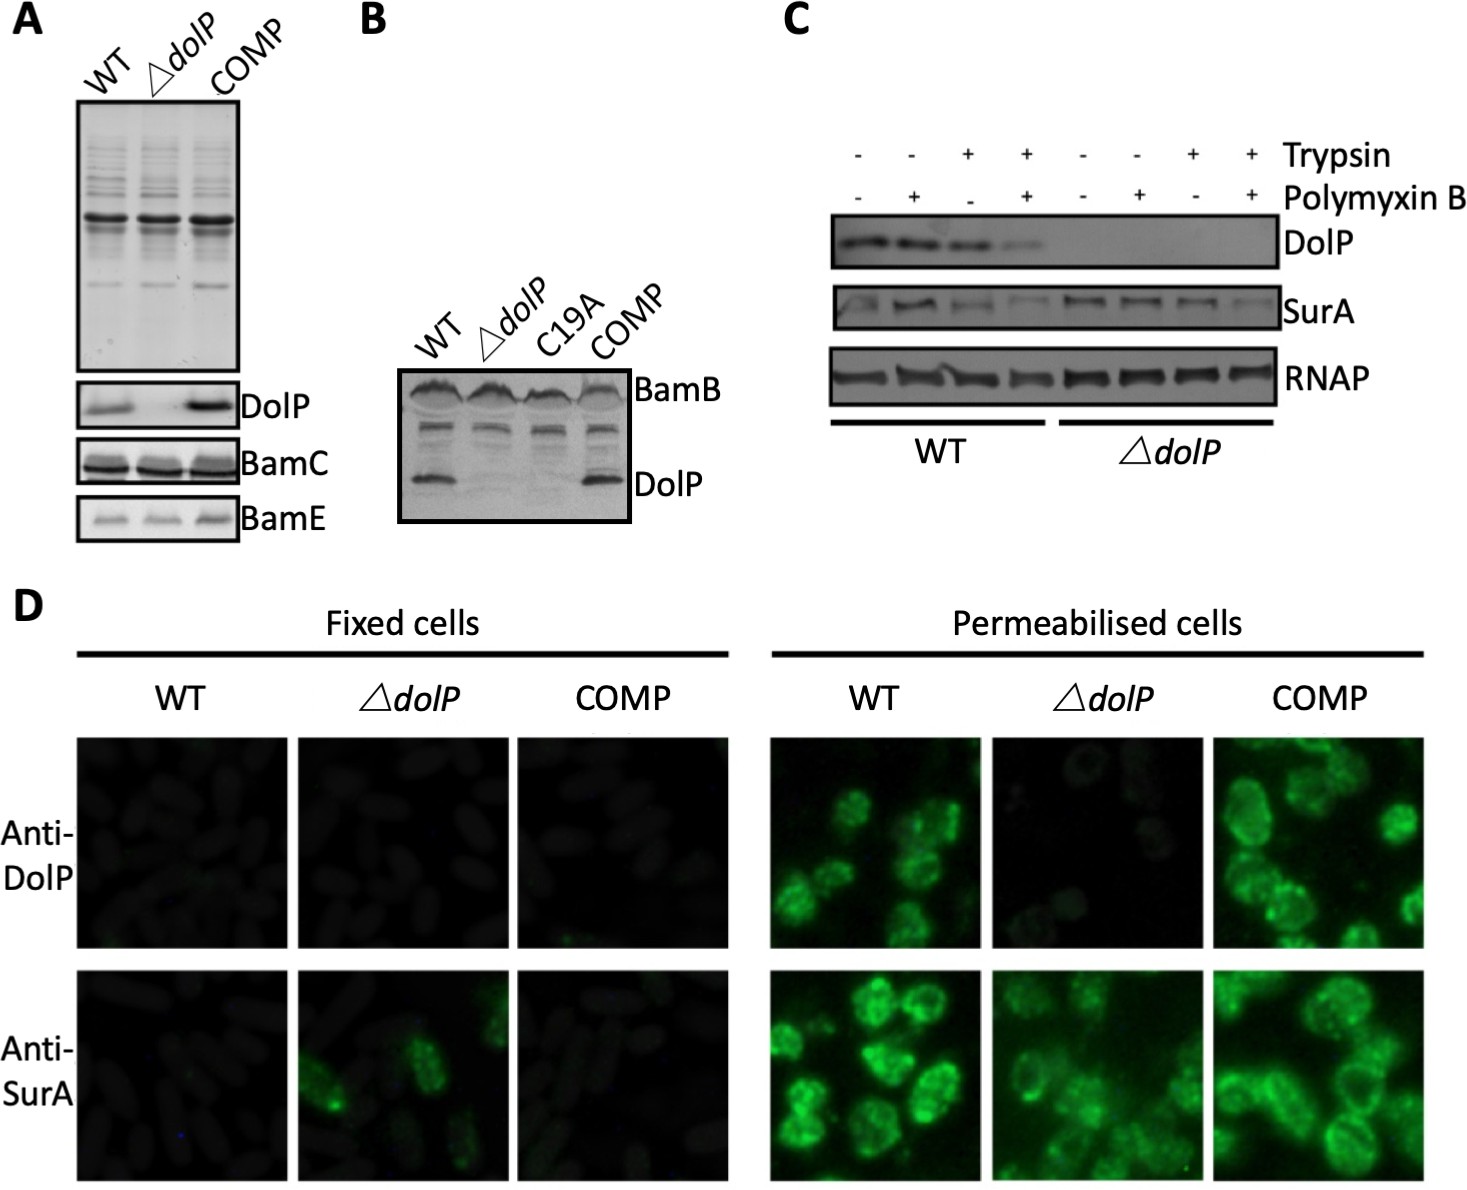
DolP is an OM lipoprotein.
(A) OM fractions of E. coli BW25113, an isogenic ∆dolP mutant and the complemented mutant were analysed by SDS-PAGE and Western immunoblotting with antibodies to DolP and the known OM lipoproteins BamC and BamE. DolP is not detected in the mutant but like BamC and BamE is found with the membrane fraction. (B) Western immunoblotting of OM fractions from E. coli ∆dolP complemented with a plasmid (pDolP-C19A) encoding DolP with a point mutation at position C19. (C) E. coli cells treated with protease in the presence (+) or absence (-) of polymyxin B, which permeablises the OM, allowing the protease access to the periplasm. Antibodies to the cytoplasmic RNA polymerase (RNAP) and the periplasmic chaperone SurA were used as controls. (D) Immunofluorescence photomicrographs of E. coli BW25113, an isogenic ∆dolP mutant and the complemented mutant. Cells were probed with anti-DolP before and after permeabilisation. Anti-SurA was used as a control.
-
Figure 1—figure supplement 1—source data 1
Subcellular localisation of DolP.
- https://cdn.elifesciences.org/articles/62614/elife-62614-fig1-figsupp1-data1-v2.pptx
Figure 1—figure supplement 2
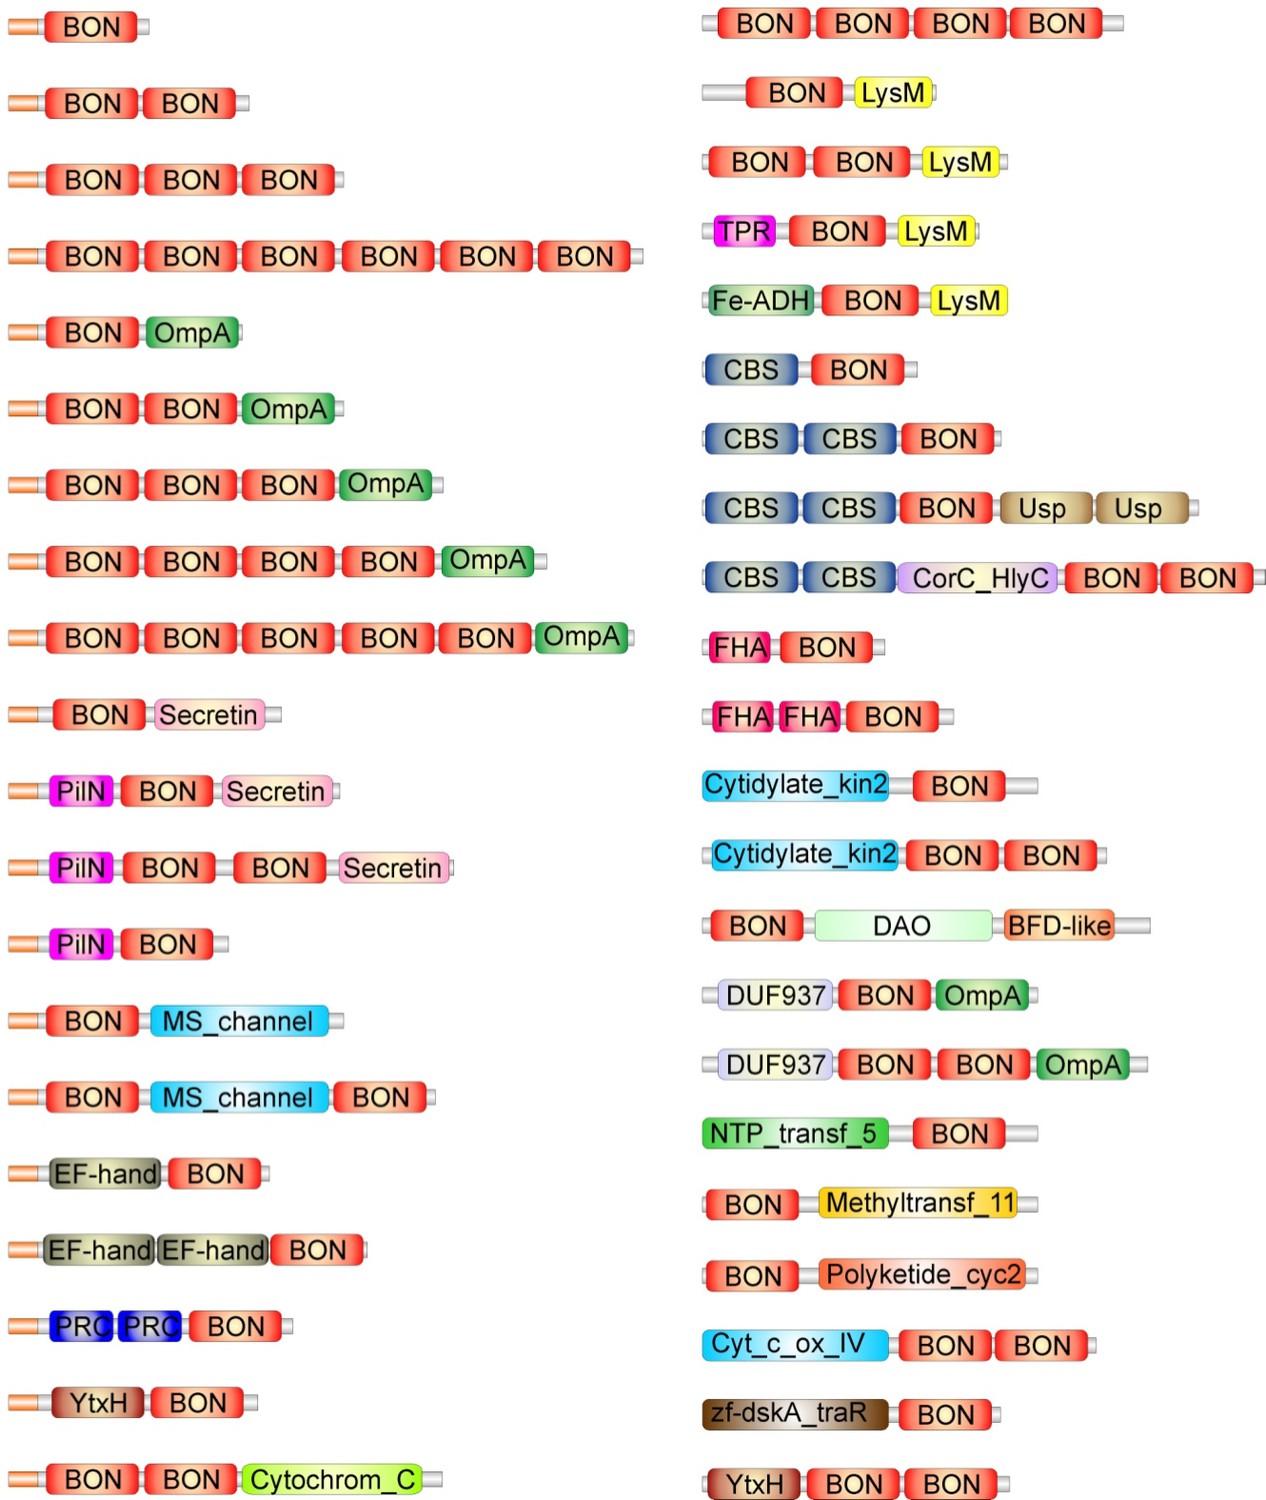
BON domain (Pfam: PF04972) containing proteins.
The Pfam database was interrogated for the presence of proteins containing BON domains. BON domains are widely distributed in bacteria and eight major architectures are noted (Table 1). The predominant architecture is that observed for DolP and OsmY where the protein possesses a signal sequence and one or more BON domains. The second major architecture is that observed for Kbp, where proteins possess one or more BON domains and a LysM domain. The other major architectures include associations with Secretin (Pfam: PF00263), CBS (Pfam: PF00571), OmpA (Pfam: PF00691), MS_channel (Pfam: PF00924), FHA (Pfam: PF00498) or cytidylate kinase (Pfam: PF13189) domains. Due to their functions, many of these domains would place their associated BON domains in proximity to cell membranes.
Figure 1—figure supplement 3
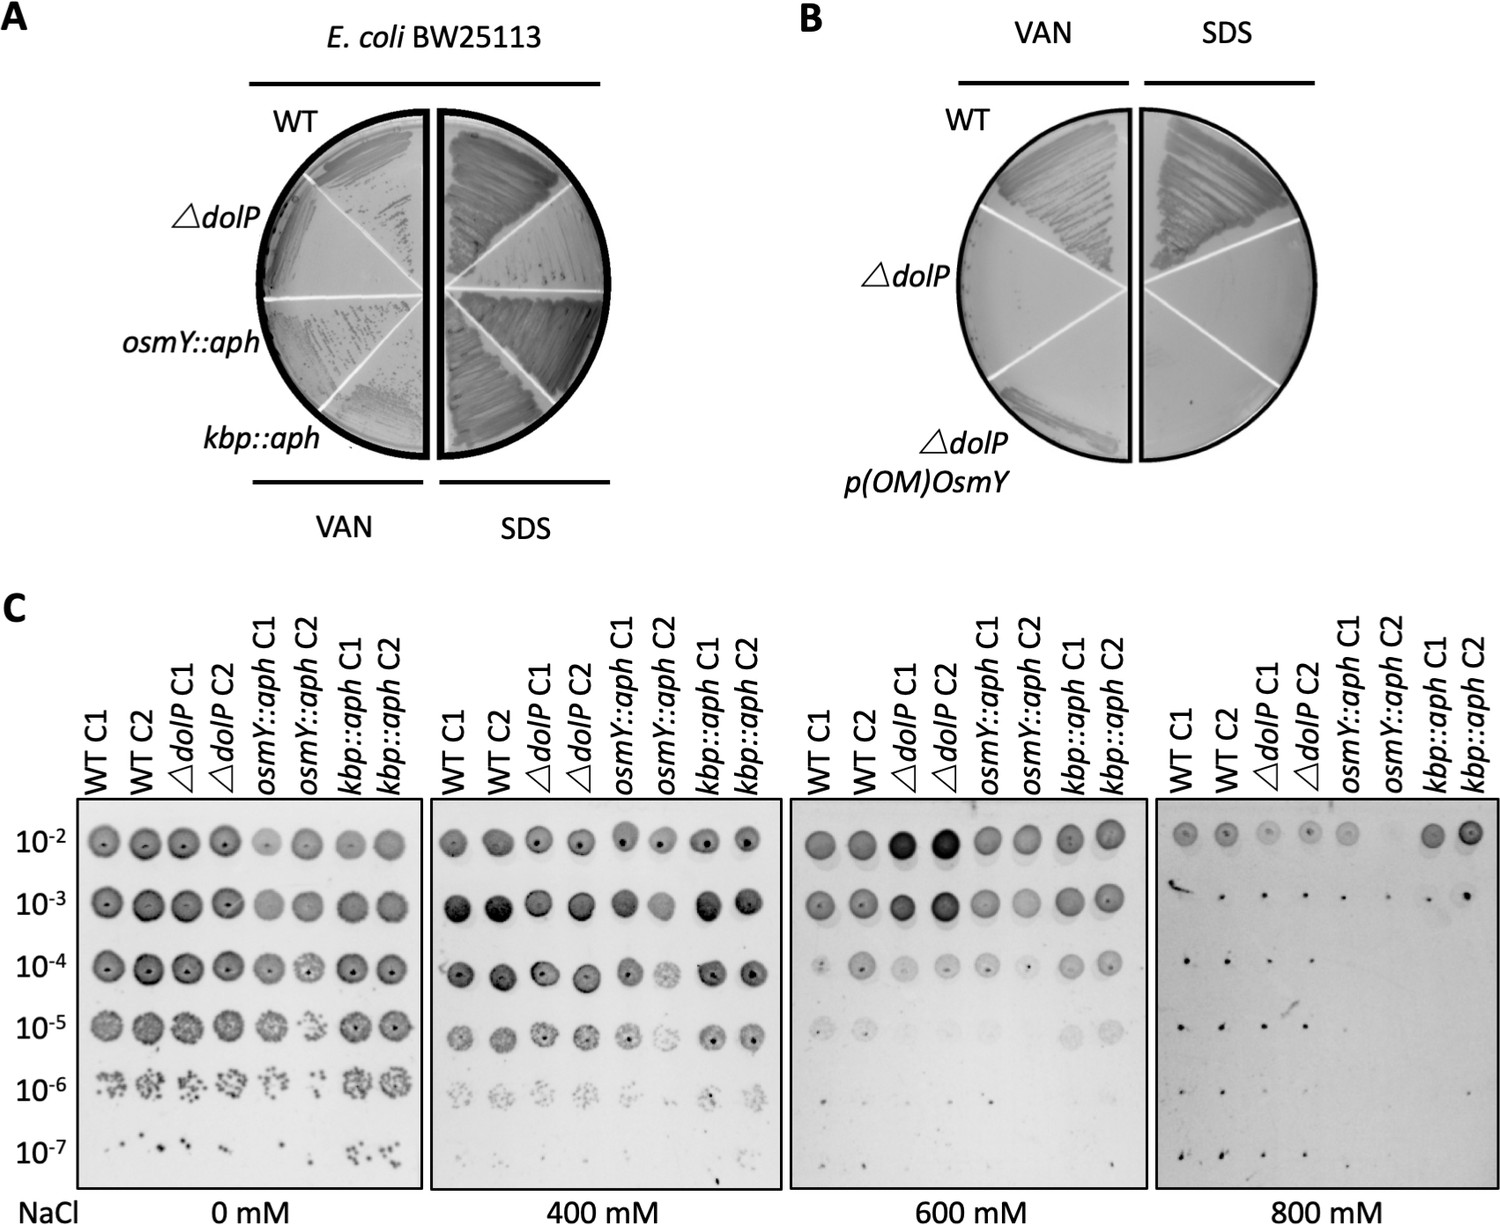
DolP has a distinct function from OsmY and Kbp.
The precise functions of Kbp and OsmY are unknown, though both are induced during adaptation to hyperosmolarity (Yan et al., 2019; Yim and Villarejo, 1992; Weber et al., 2006; Ashraf et al., 2016; Lennon et al., 2015) (A) Investigation of osmY and kbp null mutants of E. coli revealed neither was sensitive to vancomycin or SDS. Growth phenotypes for mutant isolates lacking BON-domain proteins, wild-type strains (WT) or complemented mutants (COMP). Strains were grown on LB agar containing vancomycin (100 μg/ml) or sodium dodecyl sulphate (SDS; 4.8%). (B) A plasmid encoding a DolP-OsmY chimeric protein composed of the lipoprotein targeting sequence of DolP and the BON domains of OsmY failed to complement the OM defect associated with loss of dolP. (C) E. coli BW25113 ΔdolP is not more susceptible to osmotic stress induced by NaCl than the parent strain as assessed by a serial dilution plate assay. Interestingly, our investigations did not reveal a role for either kbp or osmY in survival of osmotic stress as the E. coli BW25113 parent strain and isogenic osmY::aph and kbp::aph mutants survived equally well.
Figure 1—figure supplement 4
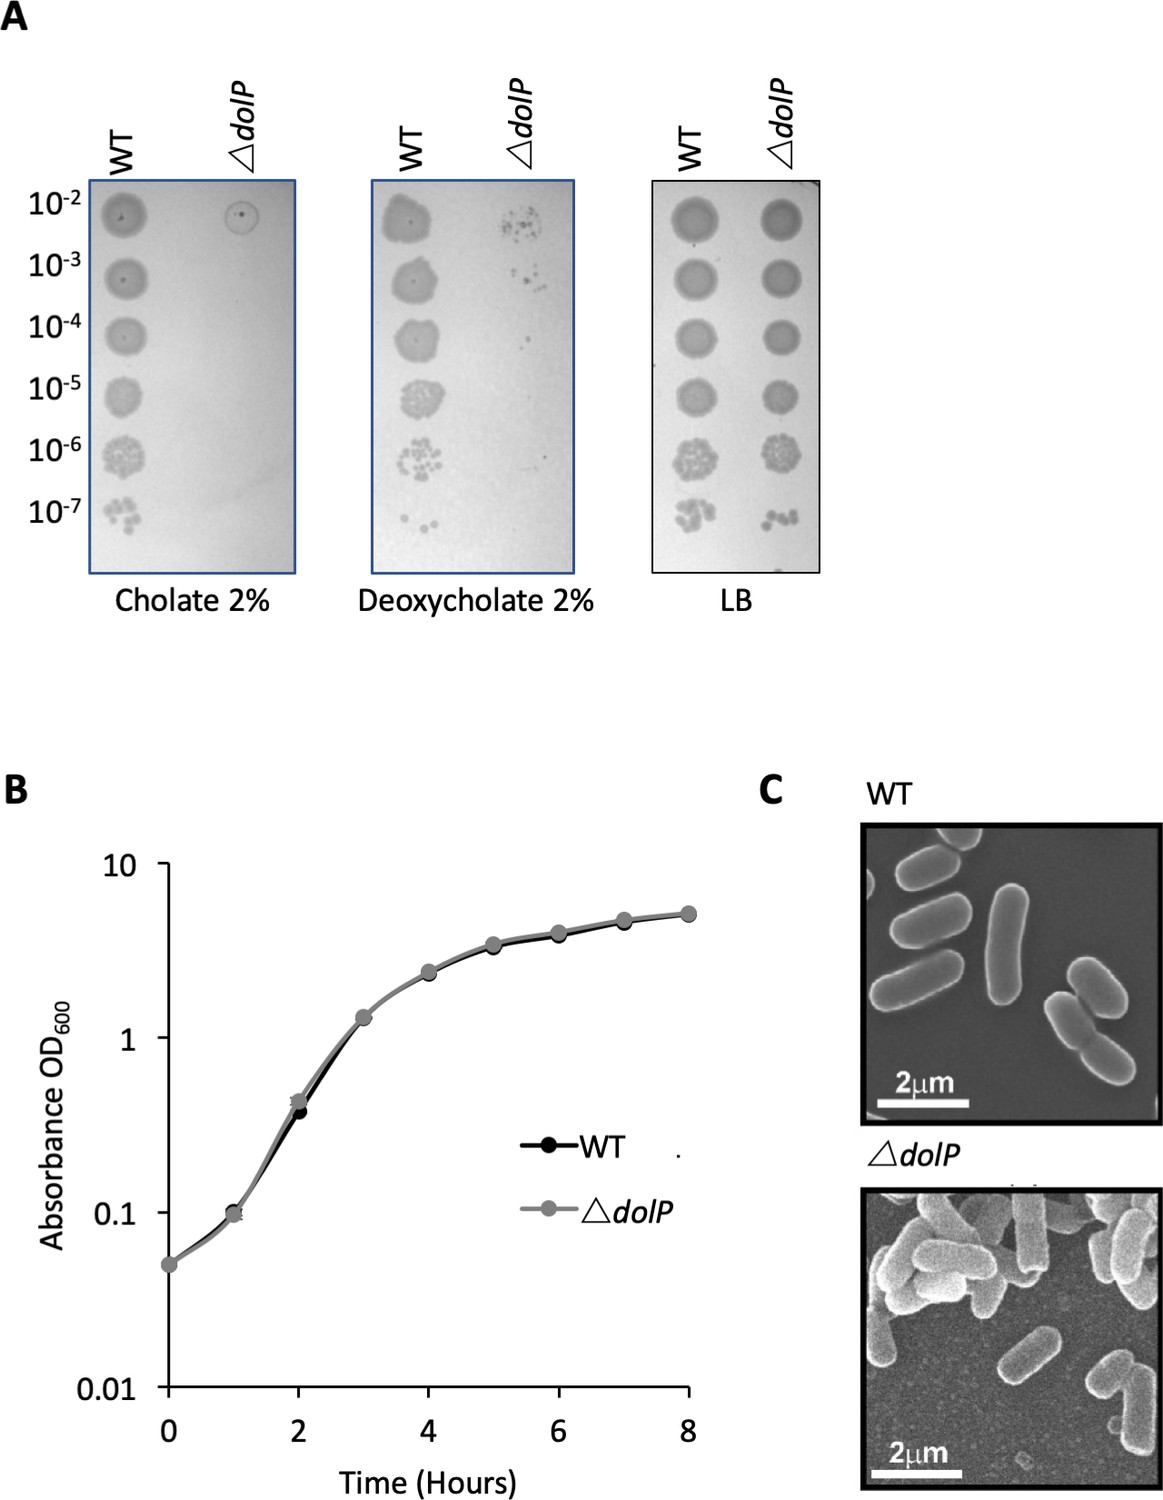
Phenotypes of E. coli BW25113 ∆dolP.
(A) Mutants lacking dolP are sensitive to the anionic detergents cholate and deoxycholate (B) Mutants lacking dolP have growth rates that are indistinguishable from wild-type E. coli. (C) Scanning electron microscopy reveals parental and E. coli ∆dolP cells have no discernible differences in cellular morphology.
-
Figure 1—figure supplement 4—source data 1
Comparison of bacterial growth rates of wild type and yraP mutant.
- https://cdn.elifesciences.org/articles/62614/elife-62614-fig1-figsupp4-data1-v2.xlsx
Figure 1—figure supplement 5
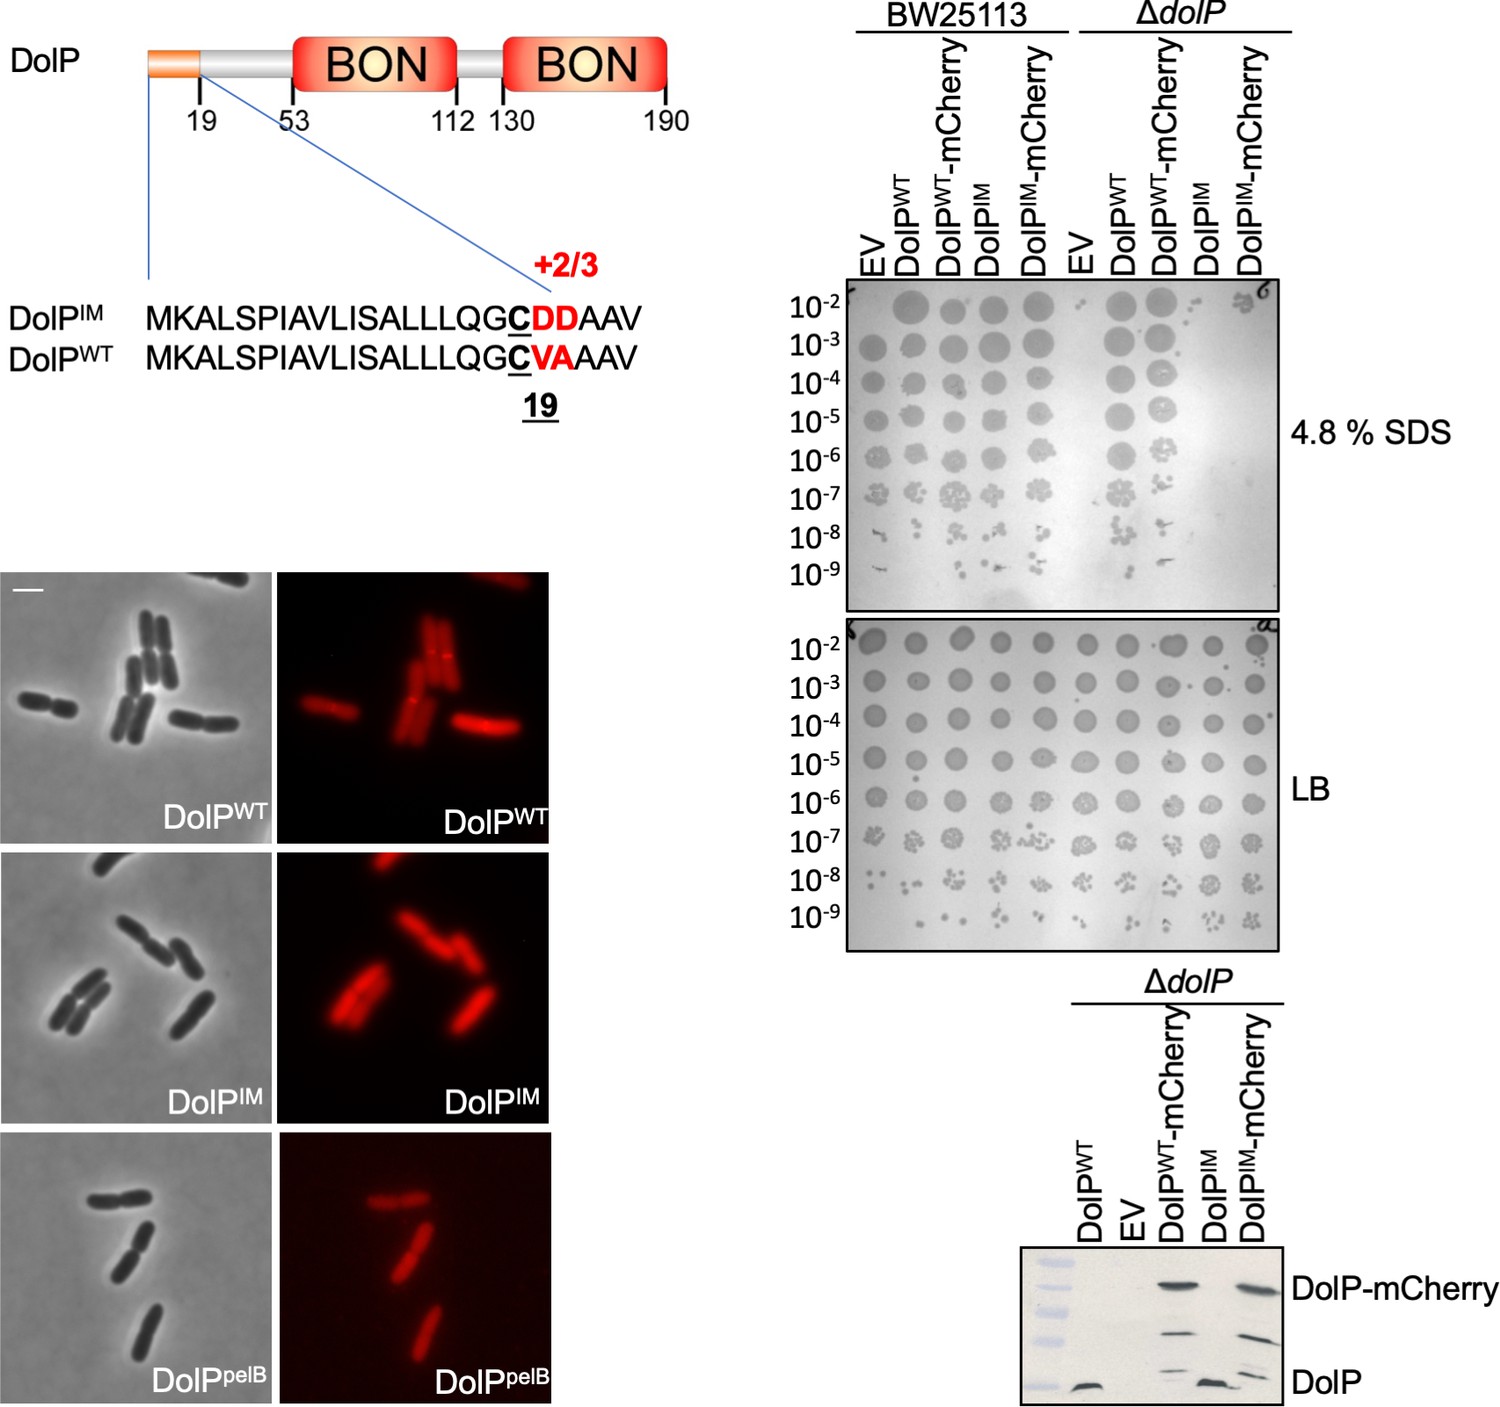
Localisation of DolP to the OM is required for function.
The signal sequence and domain architecture of DolP are shown. The sequence changes to pET17b-dolPWT to create the construct targeting DolP to the IM (pET17b-dolPIM) are shown in red. The signal sequence of dolP was also swapped for that of pelB in order to create the construct pET17b-dolPpelB in order to target DolP to the periplasmic space with no modification. Fluorescence microscopy of ΔdolP cells expressing either DolPWT-mCherry or DolPIM-mCherry or DolPpelB-mCherry from the pET17b plasmid after growth to mid-exponential phase (OD600 ~0.4–0.8). Scale bars represent 2 μM and both phase contrast and the mCherry channel are shown in greyscale and red, respectively. The capacity of DolPWT, DolPIM, DolPWT-mCherry or DolPIM-mCherry to complement the ΔdolP mutant sensitivity phenotype was screened by dilution assay on 4.8% SDS. The expression of each construct was checked by Western blotting of total protein extracts with anti-DolP antiserum.
-
Figure 1—figure supplement 5—source data 1
The influence of signal sequences on DolP localisation.
- https://cdn.elifesciences.org/articles/62614/elife-62614-fig1-figsupp5-data1-v2.pptx
Figure 2 with 6 supplements
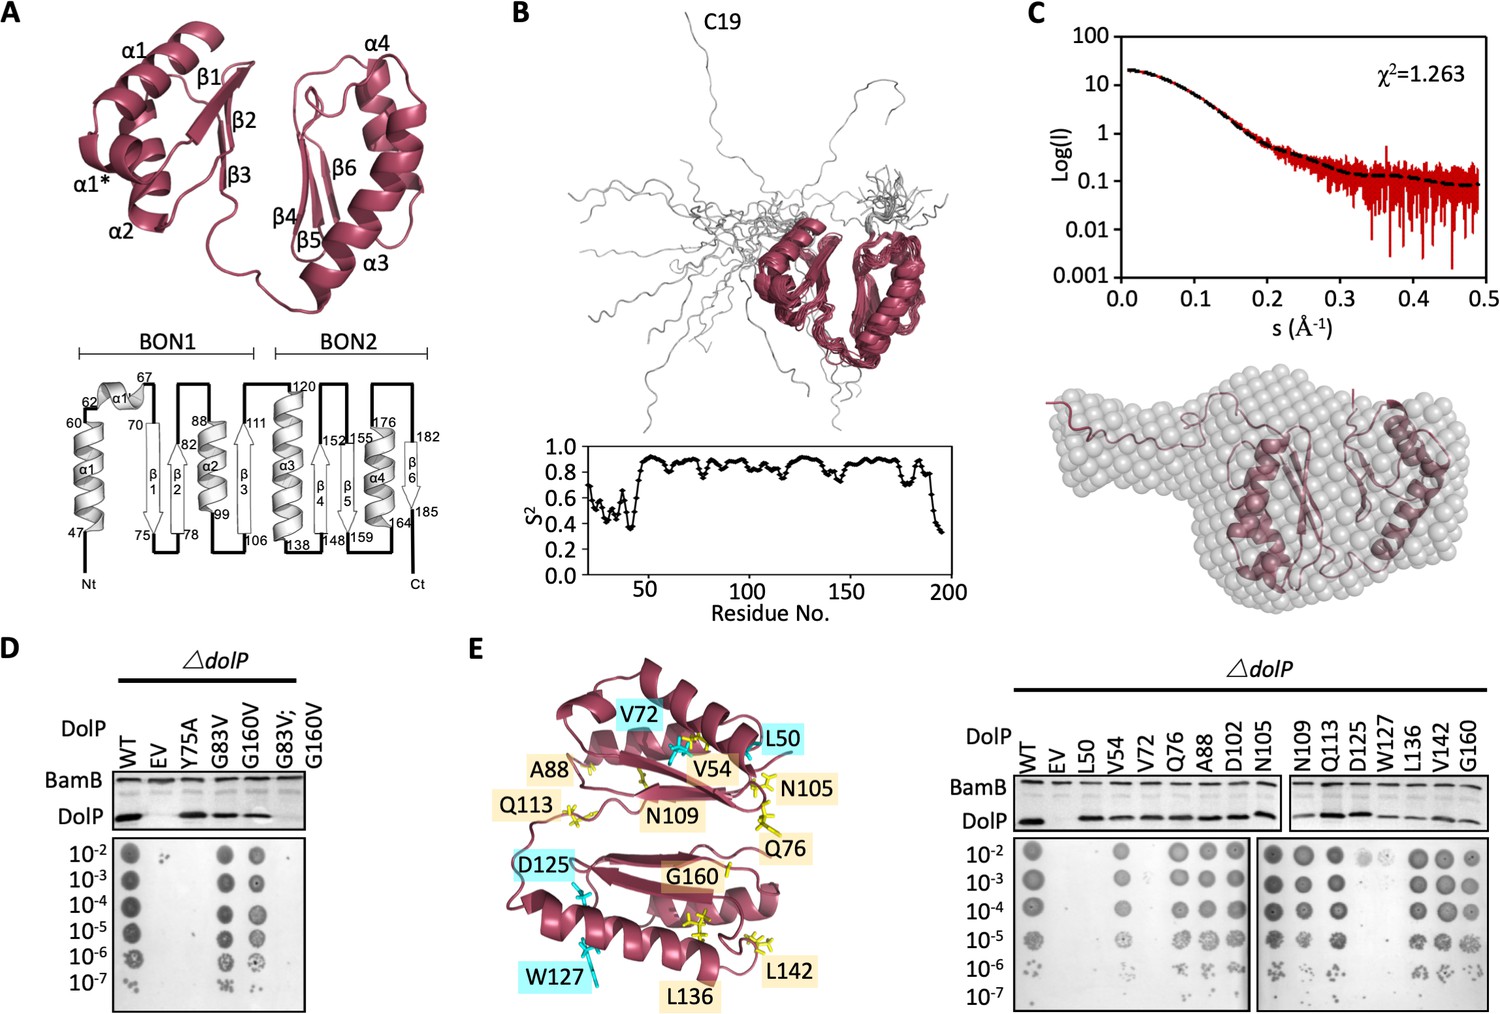
Structure of DolP.
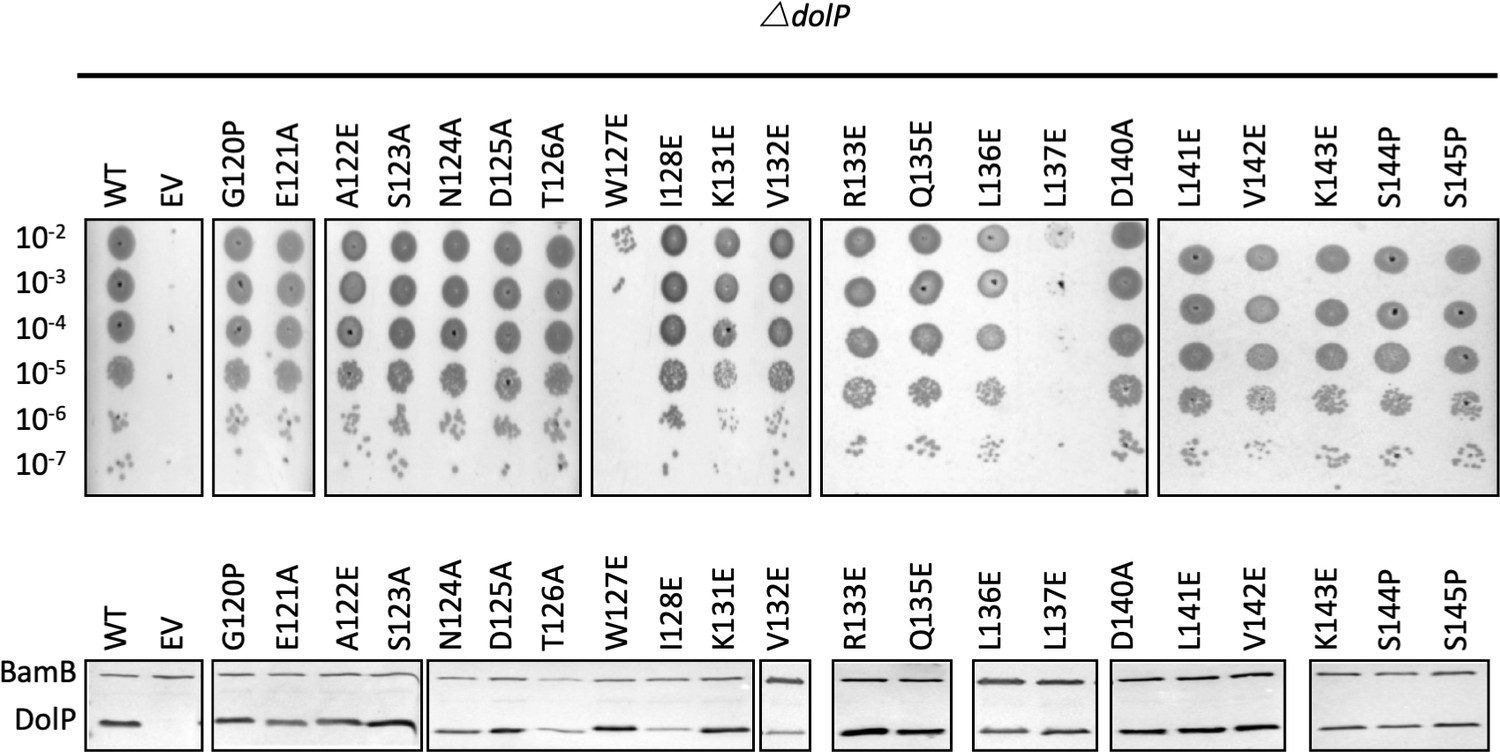
(A) Solution structure and topology of DolP, with α helices, β strands and termini labelled. (B) Backbone model of the 20 lowest-energy solution structures of DolP. The core folded domain is highlighted in red whilst the flexible N-terminal is shown in grey. The dynamic nature of the linker was demonstrated from S2 order parameter analysis calculated from chemical shift assignments using TALOS+. (C) Small-angle X-ray scattering curve of DolP with corresponding best fit of the solution structure of DolP. Best fit calculated based on the core DolP solution structure with flexibility accommodated in residues 20–46, 112–118, and 189–195. The corresponding ab-initio bead model is shown calculated using Dammif (Franke and Svergun, 2009) based solely on the scattering data. (D) Western blots of total protein extracts show plasmid-mediated expression of DolP in E. coli ΔdolP after site-directed mutation of conserved residues. The empty vector (EV) control is labelled and WT represents wild-type DolP. The presence of the OM lipoprotein BamB was used as a control. Colony growth assays by serial dilution of mutants on 4.8% SDS reveal which residues are critical for the maintenance of the OM barrier function. (E) Structure of DolP showing position of transposon-mediated insertions. Western blots of total protein extracts show plasmid-mediated expression of mutant versions of DolP in E. coli ΔdolP. The empty vector (EV) control is labelled and WT represents wild-type DolP. Colony growth assays by serial dilution of mutants on 4.8% SDS reveal which insertions abolish DolP function. Blue labels represent position of non-functional insertions. Orange labels represent position of tolerated insertions. The presence of the OM lipoprotein BamB was used as a control.
-
Figure 2—source data 1
Influence of site directed mutagenesis of DolP of protein production and stability.
- https://cdn.elifesciences.org/articles/62614/elife-62614-fig2-data1-v2.pptx
-
Figure 2—source data 2
S2 order parameter analysis.
- https://cdn.elifesciences.org/articles/62614/elife-62614-fig2-data2-v2.xlsx
Figure 2—figure supplement 1
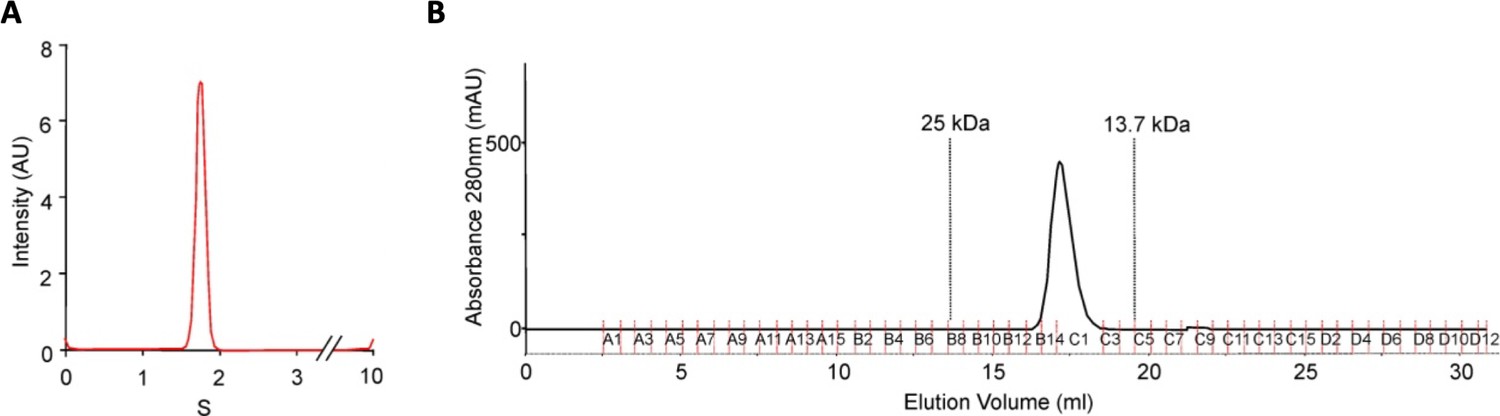
DolP is monomeric.
(A) DolP, lacking the site of acylation, was purified and subject to analytical ultracentrifugation. DolP demonstrated a uniform sedimentation velocity consistent with a monomeric species. (B) Column chromatography of purified DolP revealed that it had an elution profile consistent with a single monomeric species.
Figure 2—figure supplement 2
Structural analysis of the DolP BON domains.
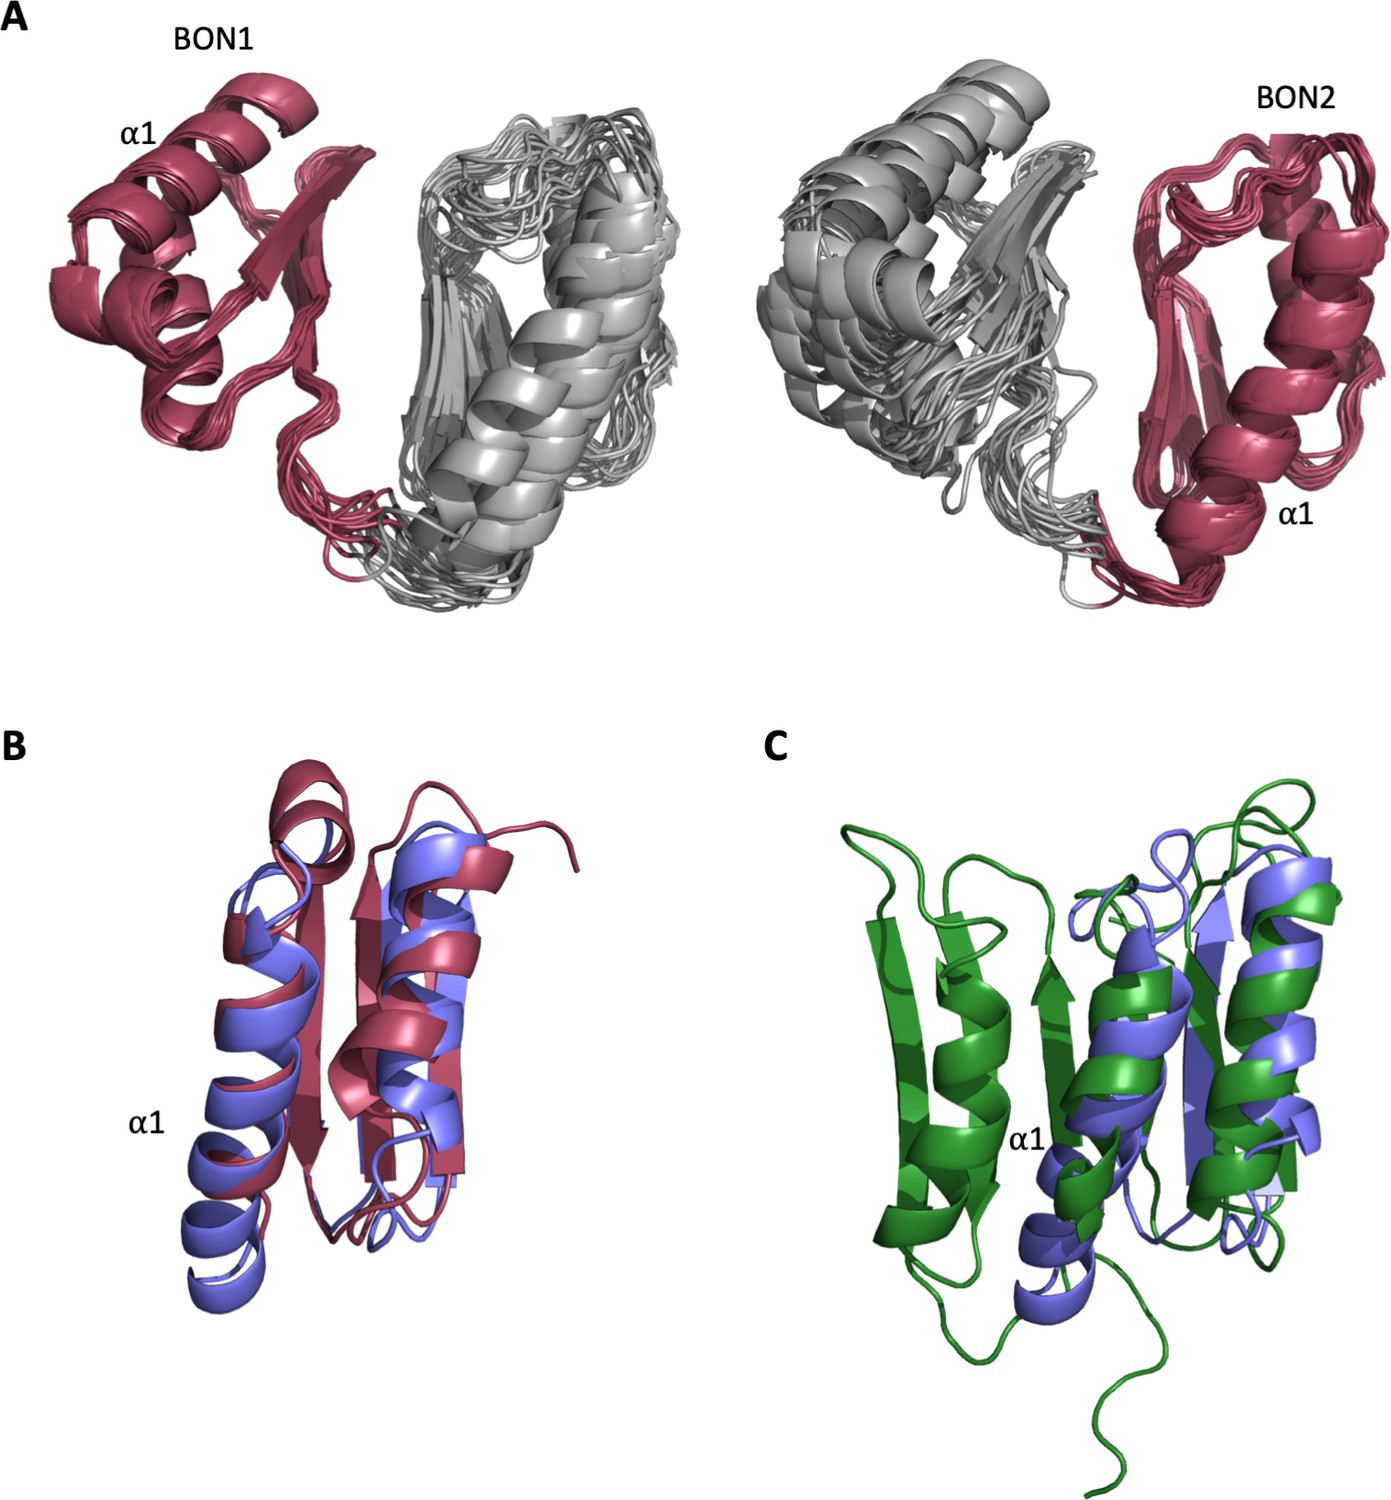
(A) The ensemble of the 20 lowest-energy structures superimposed to DolP BON1 (N47-I111) and BON2 (G120-T185) domain backbones showing how well the domains superimpose as well as the respective degrees of freedom available to each domain. (B) Dalilite superposition of DolP BON domains 1 (Red; residues 46–114) and 2 (Blue; residues 117–189). The BON domains are similar except for the double turn extension of the BON2:α1 helix and the presence of the α1’ helix present in BON1 that is absent in BON2. The pairwise RMSD for backbone heavy atoms is 1.8 Å and dalilite Z-score is 8.4. (C) Superposition of DolP BON2 (Blue) on to the BON subdomain of Rv0899 (OmpATb) (Green; accession code – 2KSM; residues 136–196). For BON2 the pairwise RMSD for backbone heavy atoms was 2.7 Å and the dalilite Z-score was 4.9. Similarly, for BON1 the pairwise RMSD was 2.6 Å and the dalilite Z-score was 5.3.
Figure 2—figure supplement 3
Alignment of DolP sequences from diverse proteobacterial species.
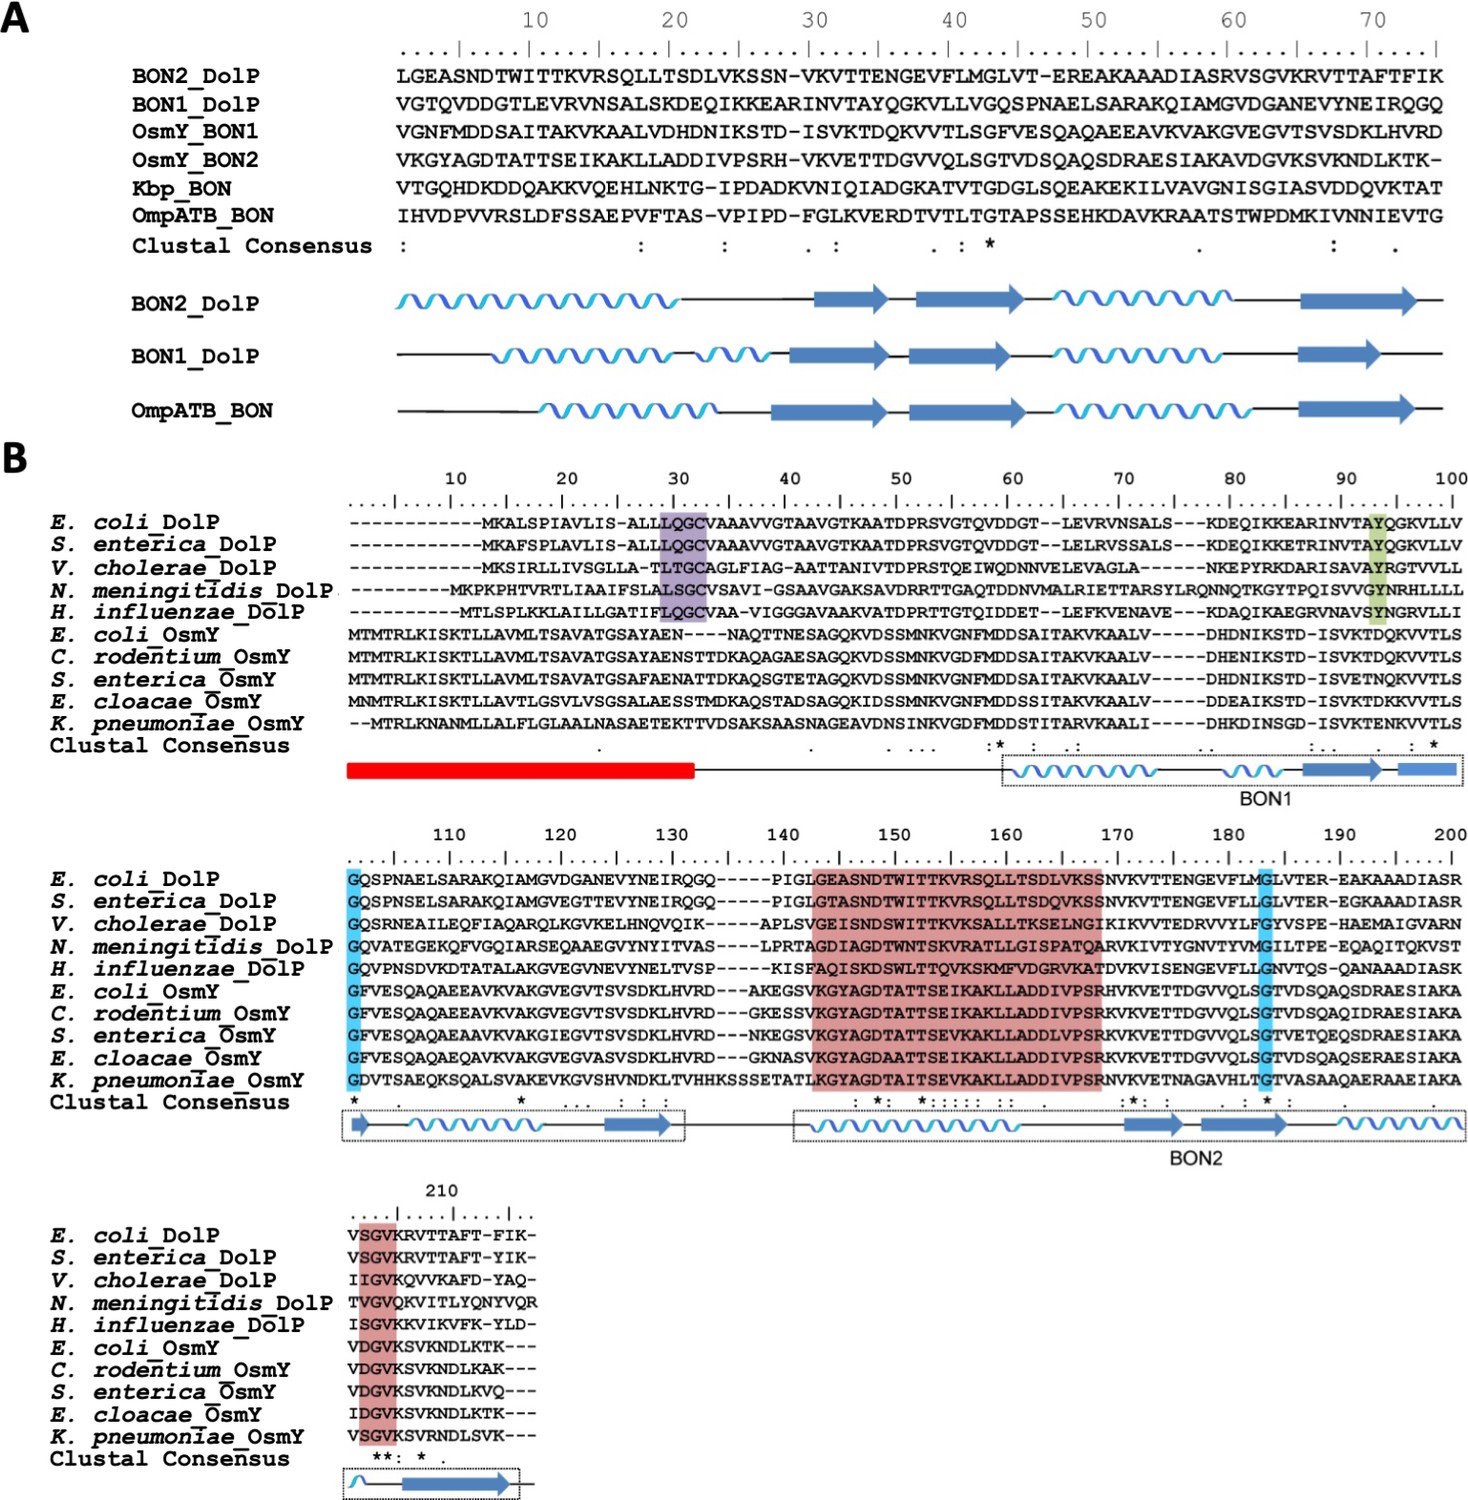
(A) The amino acid sequences of the experimentally derived BON domains of DolP and OmpATb are aligned with the predicted amino acid sequences of the BON domains from Kbp and OsmY. The position of the experimentally derived secondary structure for DolP BON1 and BON2 and OmpATb are depicted below the sequence alignment. (B) Alignments of the amino acid sequences of DolP and OsmY from various Gram-negative bacteria. The positions of the experimentally-derived secondary structural elements of E. coli DolP are depicted below the sequence alignment. The signal sequence is depicted by the red box. The Lipobox associated with recognition by LspA and acylation is highlighted in purple. The conserved glycine residues are highlighted in blue and the tyrosine residue associated with interdomain interactions is highlighted in green. Residues showing CSPs are highlighted in pink.
Figure 2—figure supplement 4
Additional SAXS analysis of DolP.
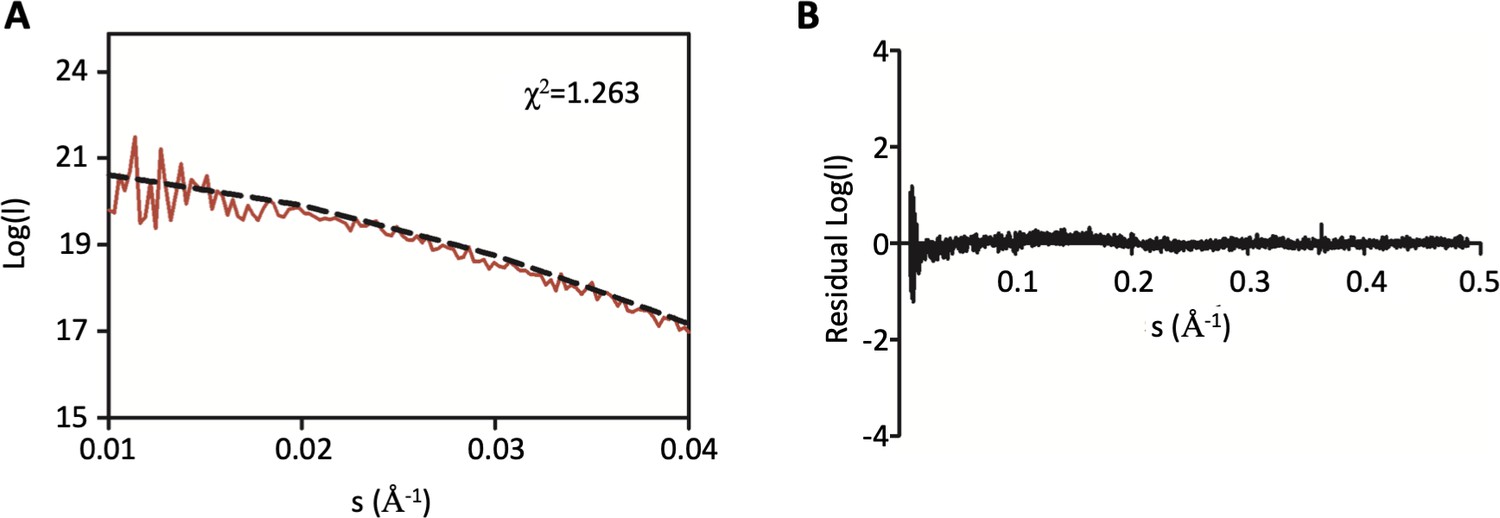
(A) Zoom in of the low s region of the small-angle X-ray scattering curve of DolP shown in Figure 2 highlighting the closeness of fit to the DolP solution structure. (B) Residuals plot between the DolP solution structure and the small-angle X-ray scattering curve highlighting the closeness of fit.
Figure 2—figure supplement 5
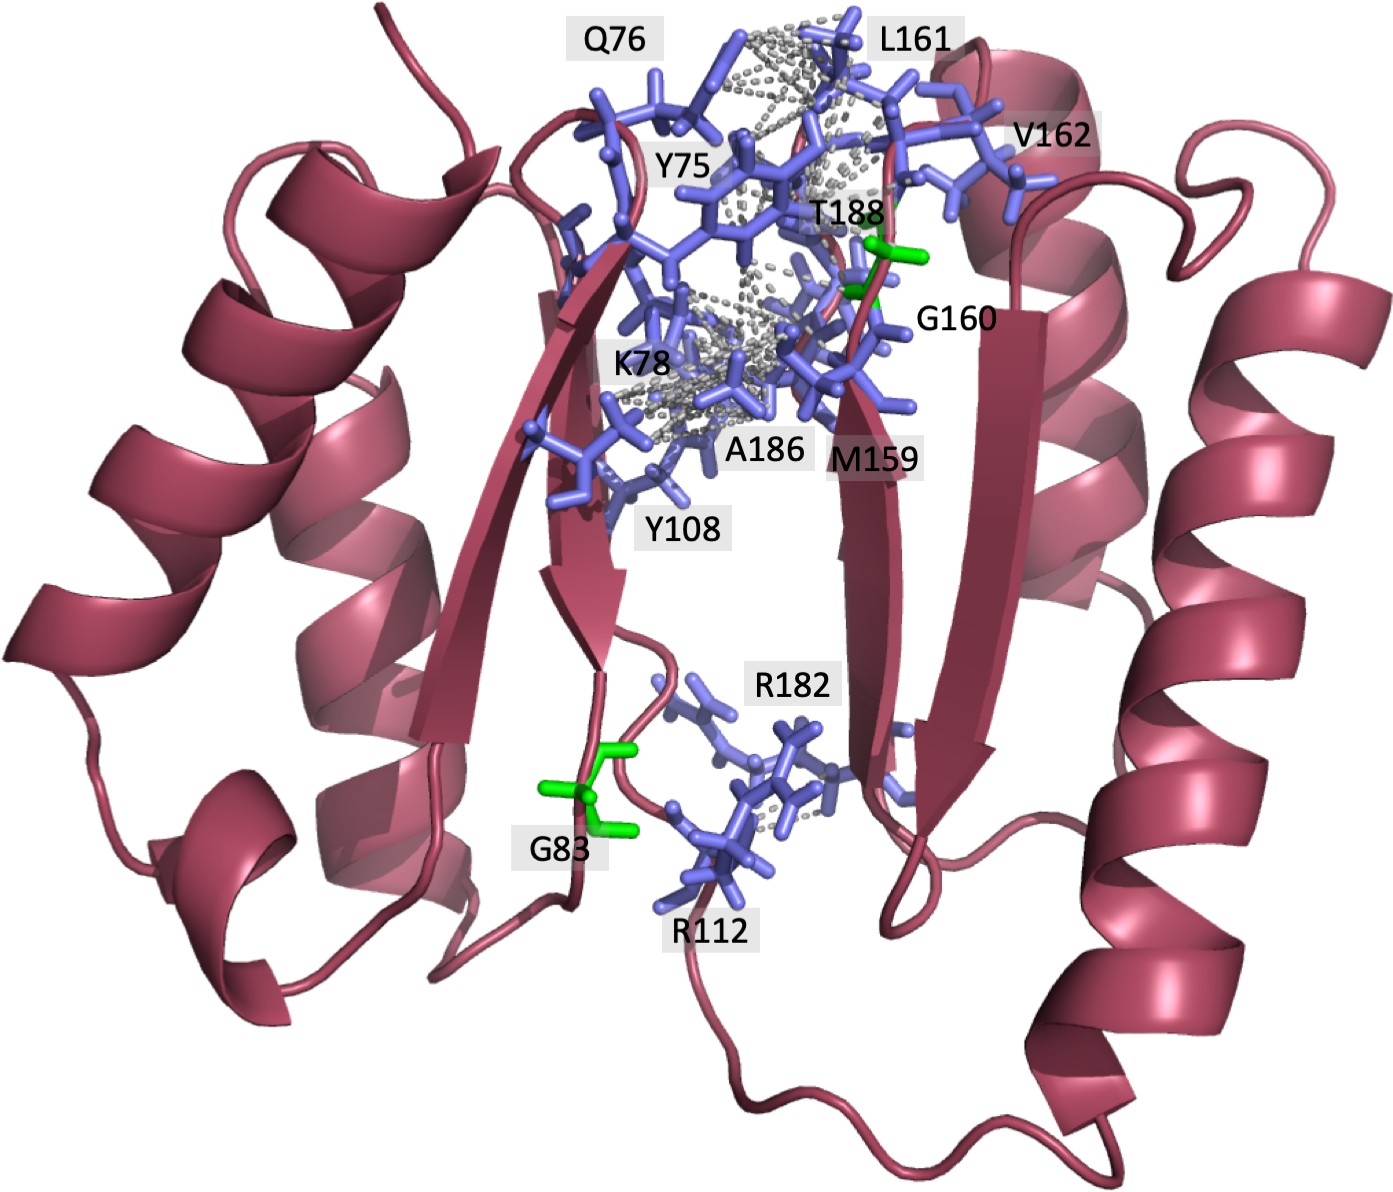
Representation of DolP interdomain interactions highlighting the location of interdomain NOEs identified.
38 interdomain NOEs were identified via Cyana (Table 3). Due to the ambiguity between chemically equivalent hydrogens within the same group, multiple NOEs are displayed to all equivalent hydrogens resulting in 83 NOEs being displayed.
Figure 2—figure supplement 6
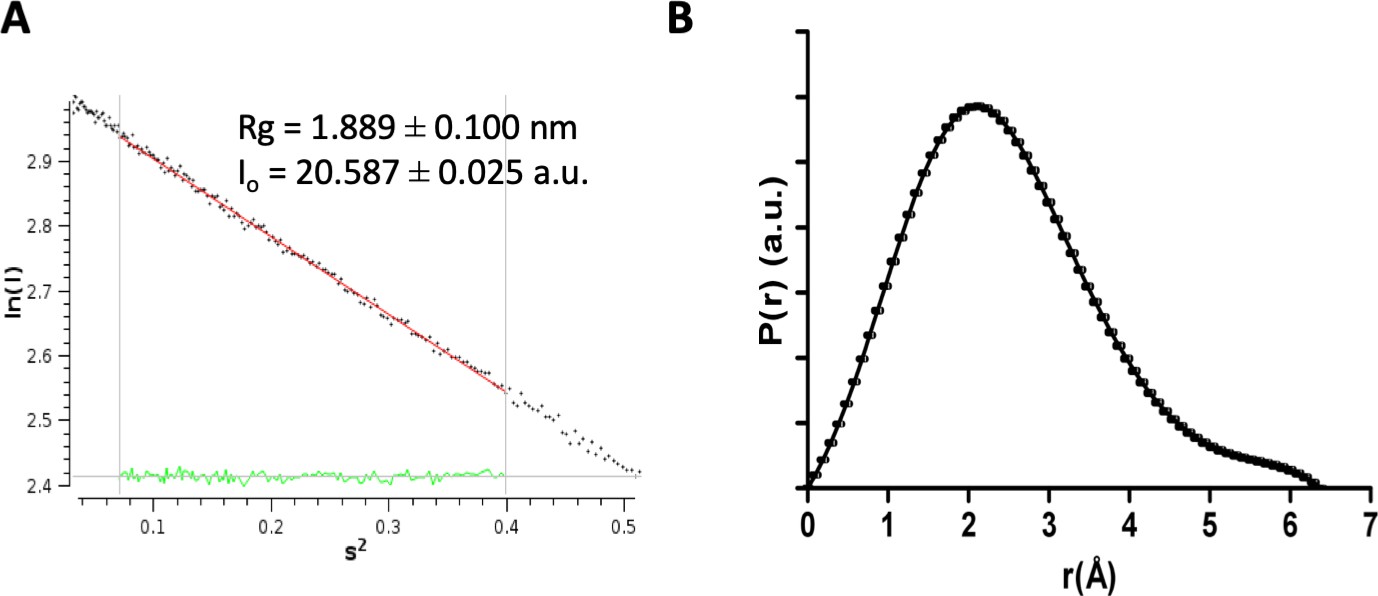
SAXS processing analysis.
(A) The linear region of the Guinier plot measured from the raw SAXS data for DolP. Values for Rg and I(0) are shown calculated using AutoRG in program Primus. (B) Pair-wise distance distribution P(r), calculated from the scattering curve of DolP, calculated using gnom arbitrary units (a.u.).
Figure 3 with 4 supplements
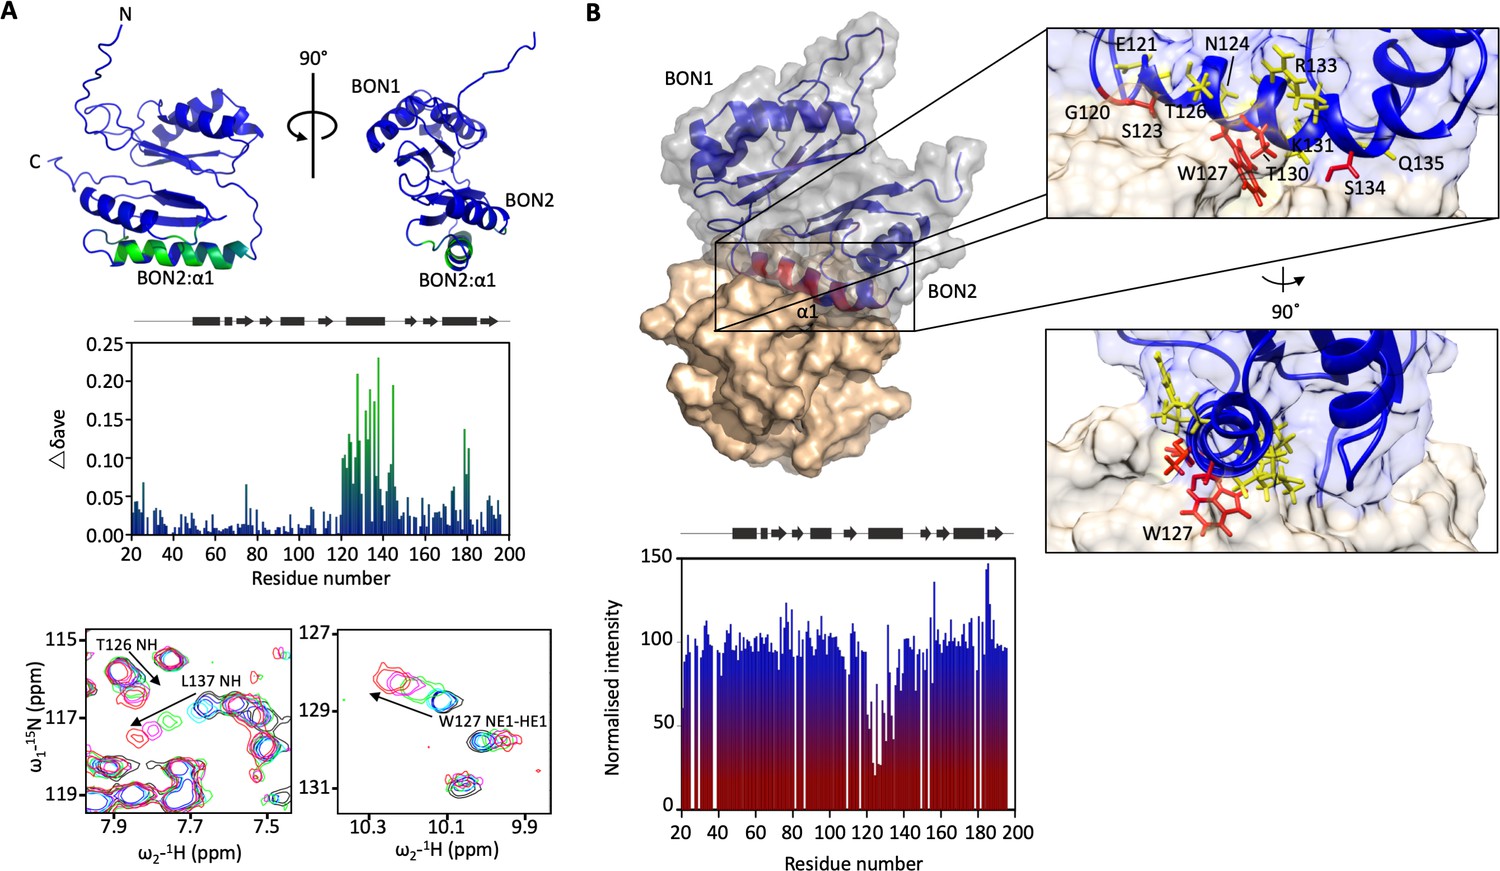
DolP BON2:α1 binds phospholipid.
(A) DolP ribbon structure highlighting residues exhibiting substantial CSPs (Δδave) upon DHPG micelle interaction. The histogram shows the normalised perturbations induced in each residue’s amide signal when DHPG (40 mM) was added to DolP (300 µM). Examples of significant CSPs are shown. (B) Histogram showing intensity reductions of HN signals of DolP induced by adding 5-doxyl PC and DMPG into DPC/CHAPs micelles and the corresponding structure of a representative DolP-micelle complex calculated using CSPs and doxyl restraints using the program HADDOCK. Only the BON2:α1 helix is observed making contact with the micelle surface. No corresponding interaction of the BON1:α1 helix is observed. Zoom panels show burial of BON2:α1 into the micelle. The side chains of DolP residues that intercalate between the acyl chains (G120, S123, W127, T130, and S134) are coloured red. The side chains of residues that buttress the interface (E121, N124, T126, I128, K131, R133, and Q135) are coloured yellow. DolP is shown in blue and the phospholipid micelle is shown in tan.
-
Figure 3—source data 1
Chemical shift perturbations for lipid titration results.
- https://cdn.elifesciences.org/articles/62614/elife-62614-fig3-data1-v2.xlsx
-
Figure 3—source data 2
Data for HADDOCK calculations of micelle-DolP interactions.
- https://cdn.elifesciences.org/articles/62614/elife-62614-fig3-data2-v2.xlsx
Figure 3—figure supplement 1
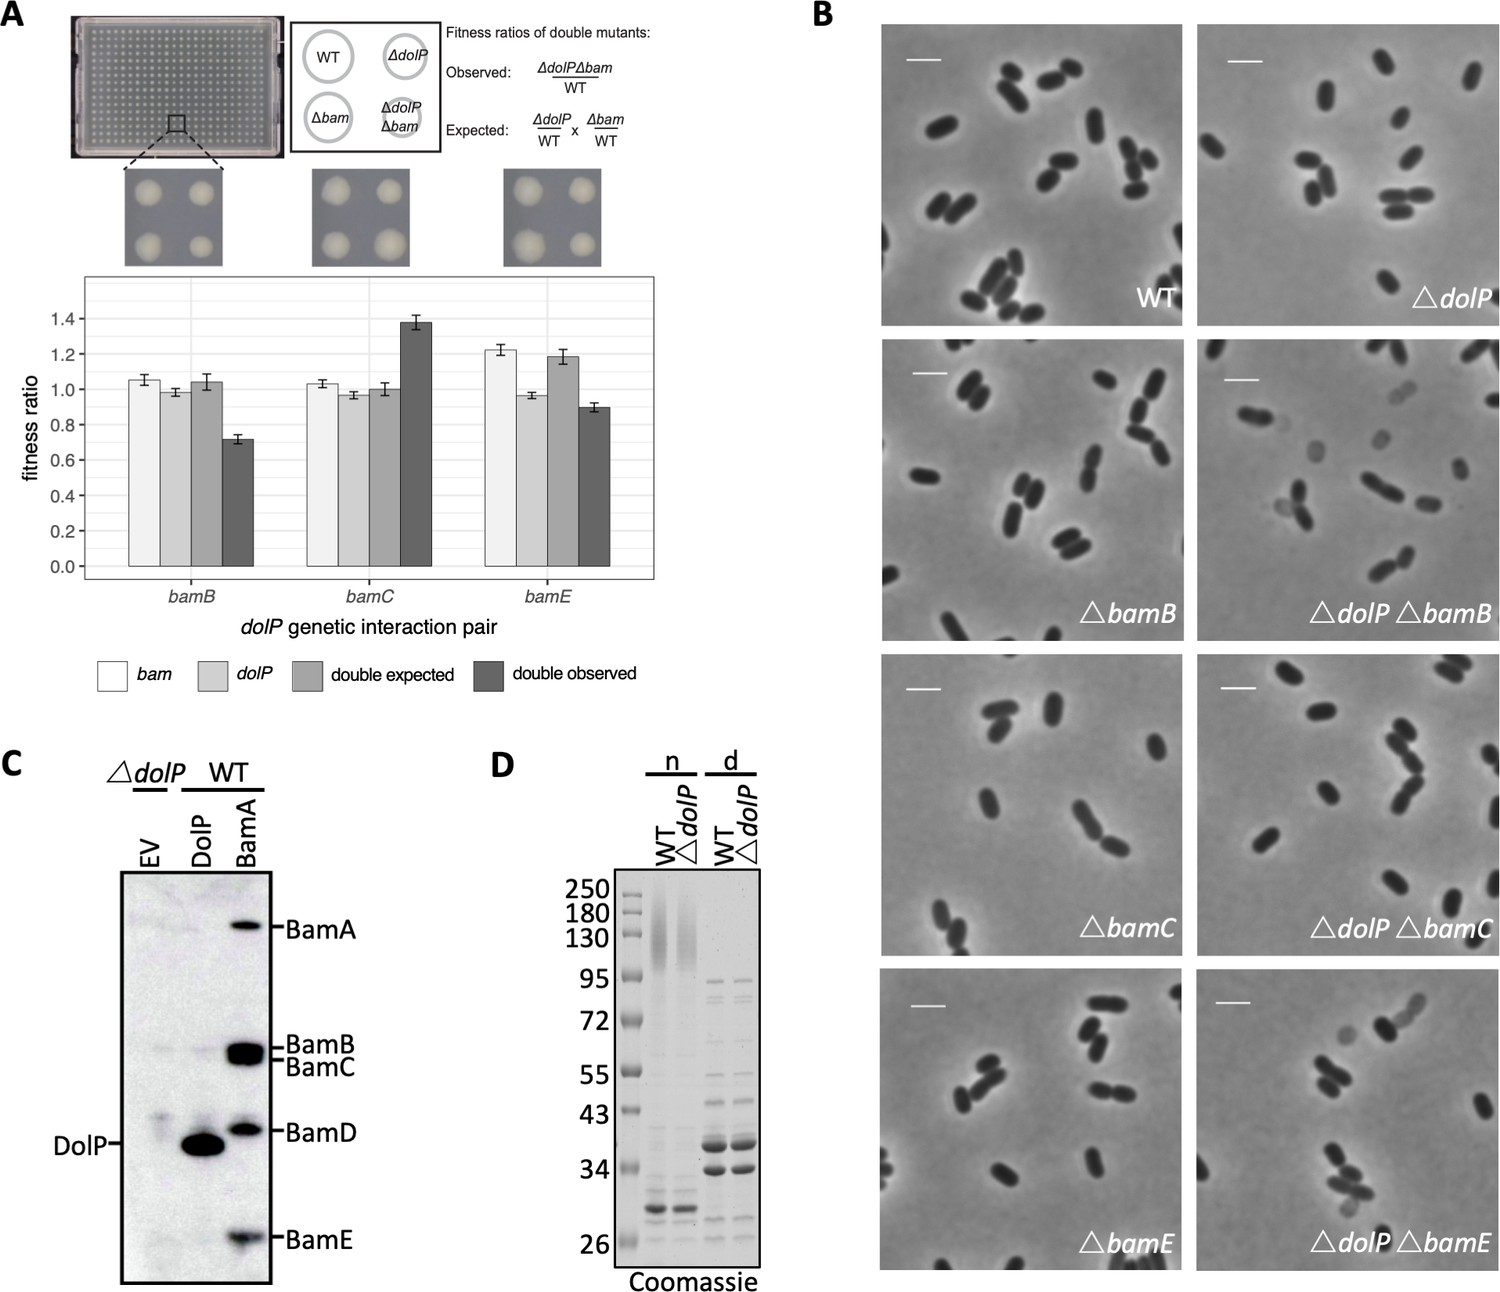
dolP has genetic interactions with bamB and bamE but no detectable physical interaction.
(A) dolP genetically interacts with the genes encoding the non-essential BAM complex accessory lipoproteins. Strains were arrayed on LB Lennox agar plates using a Biomatrix six replicator. Genetic interaction plates were incubated for 12 hr at 37°C and imaged. An example of a 384‐well plate is shown above the graph. Each plate contained a total of 384 colonies consisting of 96 wildtype, single, and double mutant clones. Fitness was measured by quantifying colony size and integral opacity, which represents colony density, using the image analysis software Iris (Kritikos et al., 2017). Bar plots show the averaged values 96 technical replicates. The error bars represent the 95% confidence interval. (B) Phase contrast microscopy of WT, ΔdolP, ΔbamB, ΔbamC, ΔbamE, ΔbamBΔdolP, ΔbamCΔdolP and ΔbamEΔdolP cells after growth to mid-exponential phase (OD600 ~0.4–0.8). Scale bars represent 2 μM. Phase light cells can be observed for the ΔbamBΔdolP and ΔbamEΔdolP cells.( C) DolP immunoprecipitation. Whole cell triton X-100 solubilised lysates of E. coli BW25113 pDolPpelB, pBamA-His, and ΔdolP, were purified by Ni-NTA affinity chromatography then detected by western blot using anti-DolP and BamA-E antibodies. (D) Purified OM samples from E. coli BW25113 parent (WT) or ΔdolP cells were separated by SDS-PAGE, with (d) and without (n) boiling before being visualised by staining with coomassie.
-
Figure 3—figure supplement 1—source data 1
Genetic interactions with DolP.
- https://cdn.elifesciences.org/articles/62614/elife-62614-fig3-figsupp1-data1-v2.pptx
Figure 3—figure supplement 2
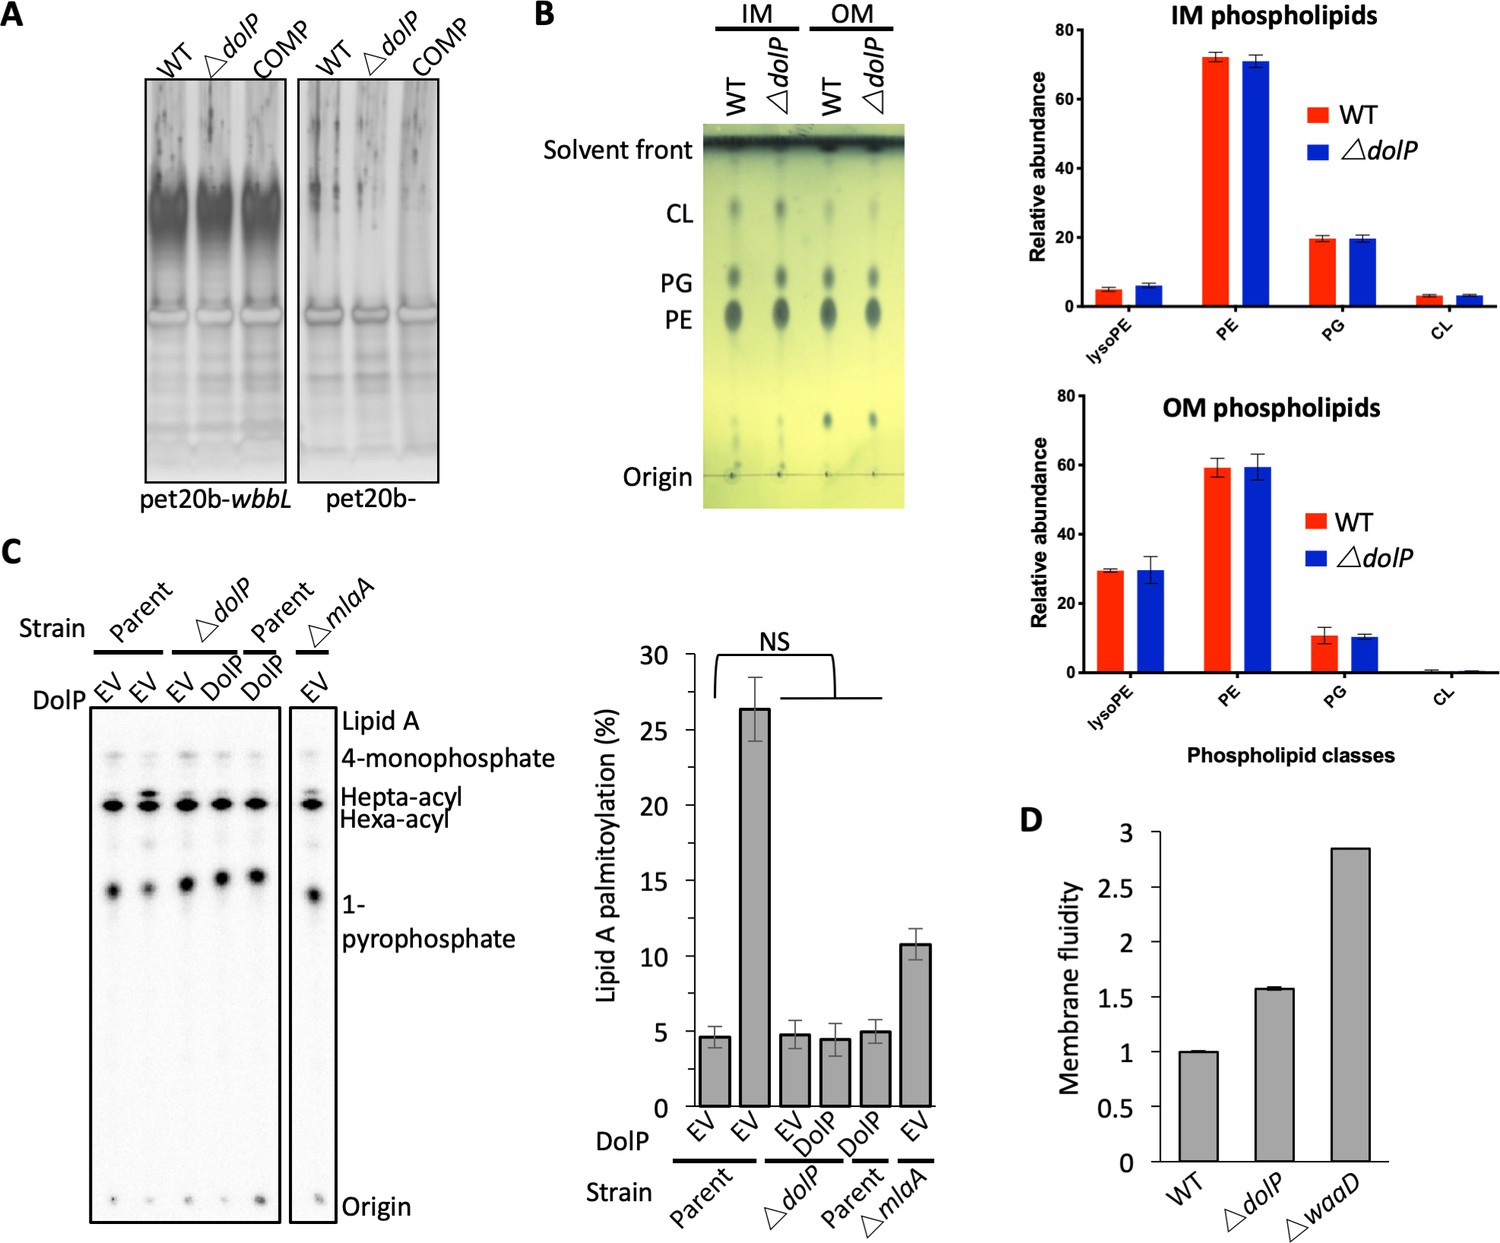
Loss of DolP affects membrane fluidity, but does not affect membrane lipid profiles.
(A) SDS-PAGE gel showing separation of LPS preparations from E. coli BW25113 and E. coli BW25113 harbouring pET20b-wbbL which restores O-antigen expression on the bacterial cell surface. (B) Analysis of phospholipid profiles from purified ∆dolP cell envelopes. Phospholipids were extracted by the Bligh-Dyer method from E. coli IM or OM samples purified by sucrose density gradient centrifugation. Phospholipids were visualised by staining with phosphomolybdic acid and charring after being separated by thin-layer chromatography with the following mobile phase: Chloroform:methanol:acetic acid (65:25:10). Phospholipid profiles were also analysed by LC/MS-MS following separation on the Luna C8(2) column under a THF/MeOH/H2O gradient. Phospholipid compositions are shown as sum for each of the four major classes observed: lyso-phophatidylethanolamines (LysoPE), phosphatidylethanolamines (PE), phosphatidylglycerols (PG) and cardiolipins (CL). Each data set is from three biological replicates generated from three separately purified membranes. Error bars represent ±S.D. (C) PagP-mediated Lipid A palmitoylation assay. PagP transfers an acyl chain from surface exposed phospholipid to hexa-acylated Lipid A to form hepta-acylated Lipid A. [32P]-labelled Lipid A was purified from cells grown to mid-exponential phase in LB broth with aeration. An equal amount of radioactive material (cpm/lane) was loaded on each spot and separated by thin-layer chromatography before quantification. As a positive control, cells were exposed to 25 mM EDTA for 10 min prior to Lipid A extraction in order to chelate Mg2+ ions and destabilise the LPS layer, leading to high levels of Lipid A palmitoylation. Hepta-acylated and hexa-acylated lipid A was quantified and hepta-acylated Lipid A represented as a percentage of total. Triplicate experiments were utilised to calculate averages and standard deviations with students t-tests used to assess significance. Student’s t-tests: NS* p>0.1 compared with Parent EV. (D) E. coli BW25113 cells were grown overnight in LB (~16 hr) before being harvested by centrifugation and washed three times in PBS. Membrane fluidity was measured for each strain in triplicate and error bars represent standard deviation. Membrane fluidity is expressed as relative to E. coli BW25113 parent cells (WT).
-
Figure 3—figure supplement 2—source data 1
LPS production in a dolP negative background.
- https://cdn.elifesciences.org/articles/62614/elife-62614-fig3-figsupp2-data1-v2.pptx
-
Figure 3—figure supplement 2—source data 2
Phospholipid content of membranes isolated from a dolP mutant.
- https://cdn.elifesciences.org/articles/62614/elife-62614-fig3-figsupp2-data2-v2.xlsx
-
Figure 3—figure supplement 2—source data 3
Comparison of hepta- and hexa-acylated LPS levels.
- https://cdn.elifesciences.org/articles/62614/elife-62614-fig3-figsupp2-data3-v2.xlsx
-
Figure 3—figure supplement 2—source data 4
Raw data for membrane fluidity assay.
- https://cdn.elifesciences.org/articles/62614/elife-62614-fig3-figsupp2-data4-v2.xlsx
Figure 3—figure supplement 3

DolP phosphatidylglycerol binding HSQC spectra.
(A) 1H,15N HSQC spectra of 15N-DolP (300 μM) in the presence (red) and absence (black) of 40 mM 1,2-dihexanoyl-sn-glycero-3-phospho-(1'-rac-glycerol) (DHPG) highlighting the large chemical shift perturbations observed on DHPG binding. (B) Histograms showing the normalised CSP values observed in 15N-labelled DolP (300 μM) amide signals in the presence of 5 mM cardiolipin, 20 mM 1,2,-dihexanoyl-sn-glycero-3-phosphethanolamine and 20 and 40 mM 1,2-dihexanoyl-sn-glycero-3-phospho-(1'-rac-glycerol).
Figure 3—figure supplement 4
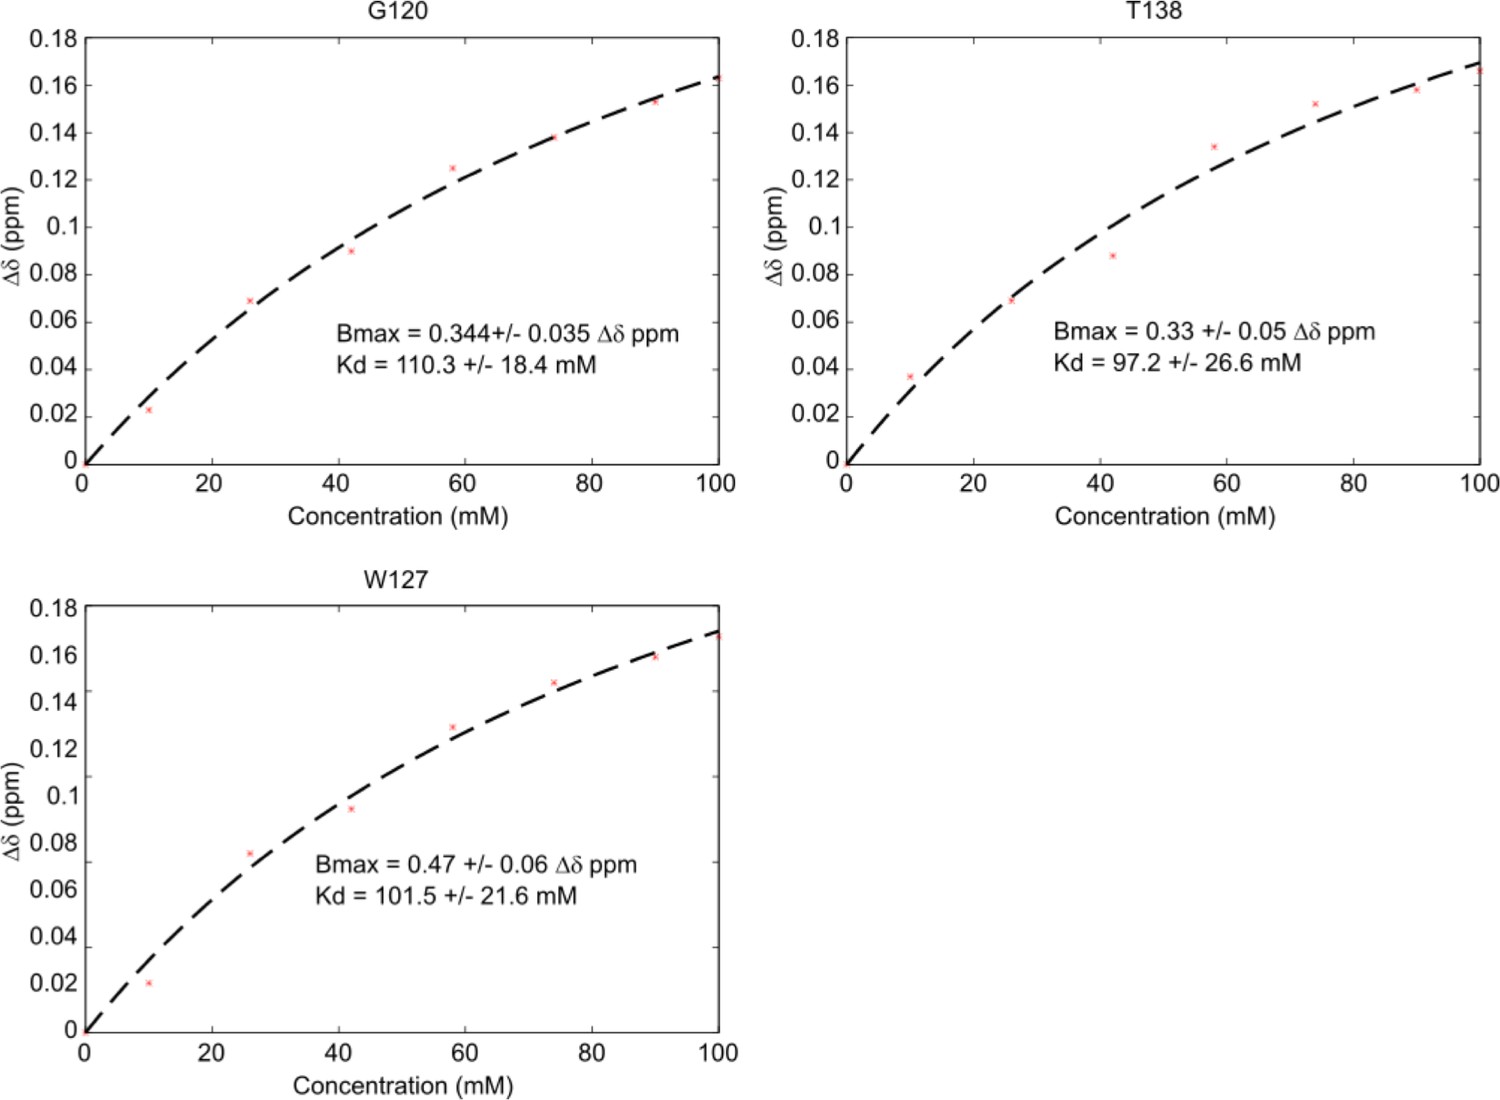
Kd estimation from HSQC titration data.
Kd estimation was performed using the sum of the average chemical shift distance plotted against ligand concentration and fit using a standard ligand binding curve. Representative fits for G120, W127, and T138 are shown with corresponding estimations for Bmax, the maximum Δδppm, and Kd highlighted.
Figure 4 with 2 supplements
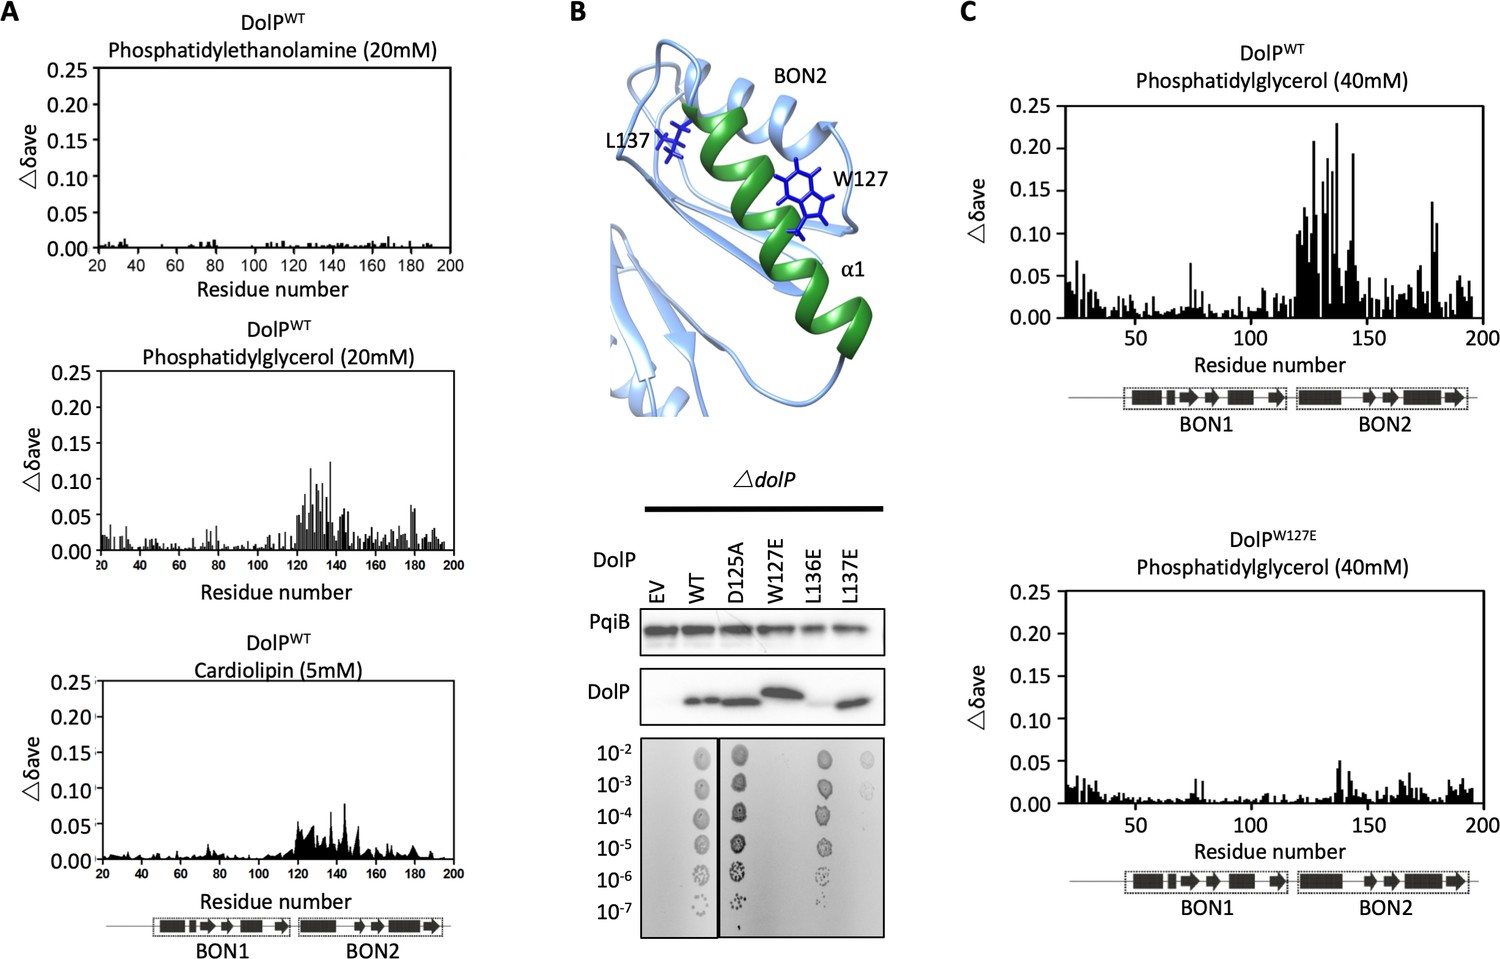
DolP specifically recognises anionic phospholipid via BON2:α1.
(A) Histograms showing the normalised CSP values observed in 15N-labelled DolP (300 μM) amide signals in the presence of 20 mM 1,2,-dihexanoyl-sn-glycero-3-phosphethanolamine, 20 mM 1,2-dihexanoyl-sn-glycero-3-phospho-(1'-rac-glycerol) and 5 mM cardiolipin.( B) Mutagenesis of the BON2:α1 helix residues identified by CSPs. The positions of W127 and L137 are indicated as sticks. Western blots of total protein extracts show plasmid-mediated expression of DolP in E. coli ΔdolP after site-directed mutation of amino acid residues. The empty vector (EV) control is labelled and WT represents wild-type DolP. Colony growth assays of E. coli ΔdolP complemented with DolP mutants reveal which residues are critical for the maintenance of OM barrier function. The presence of the protein PqiB was used as a control. (C) Histograms showing the normalised CSP values observed in 15N-labelled DolPWT or DolPW127E mutant (300 μM) amide signals in the presence of 40 mM 1,2-dihexanoyl-sn-glycero-3-phospho-(1'-rac-glycerol).
-
Figure 4—source data 1
Effect of site-directed mutations on DolP function.
- https://cdn.elifesciences.org/articles/62614/elife-62614-fig4-data1-v2.pptx
Figure 4—figure supplement 1
Electrostatic analysis of DolP.
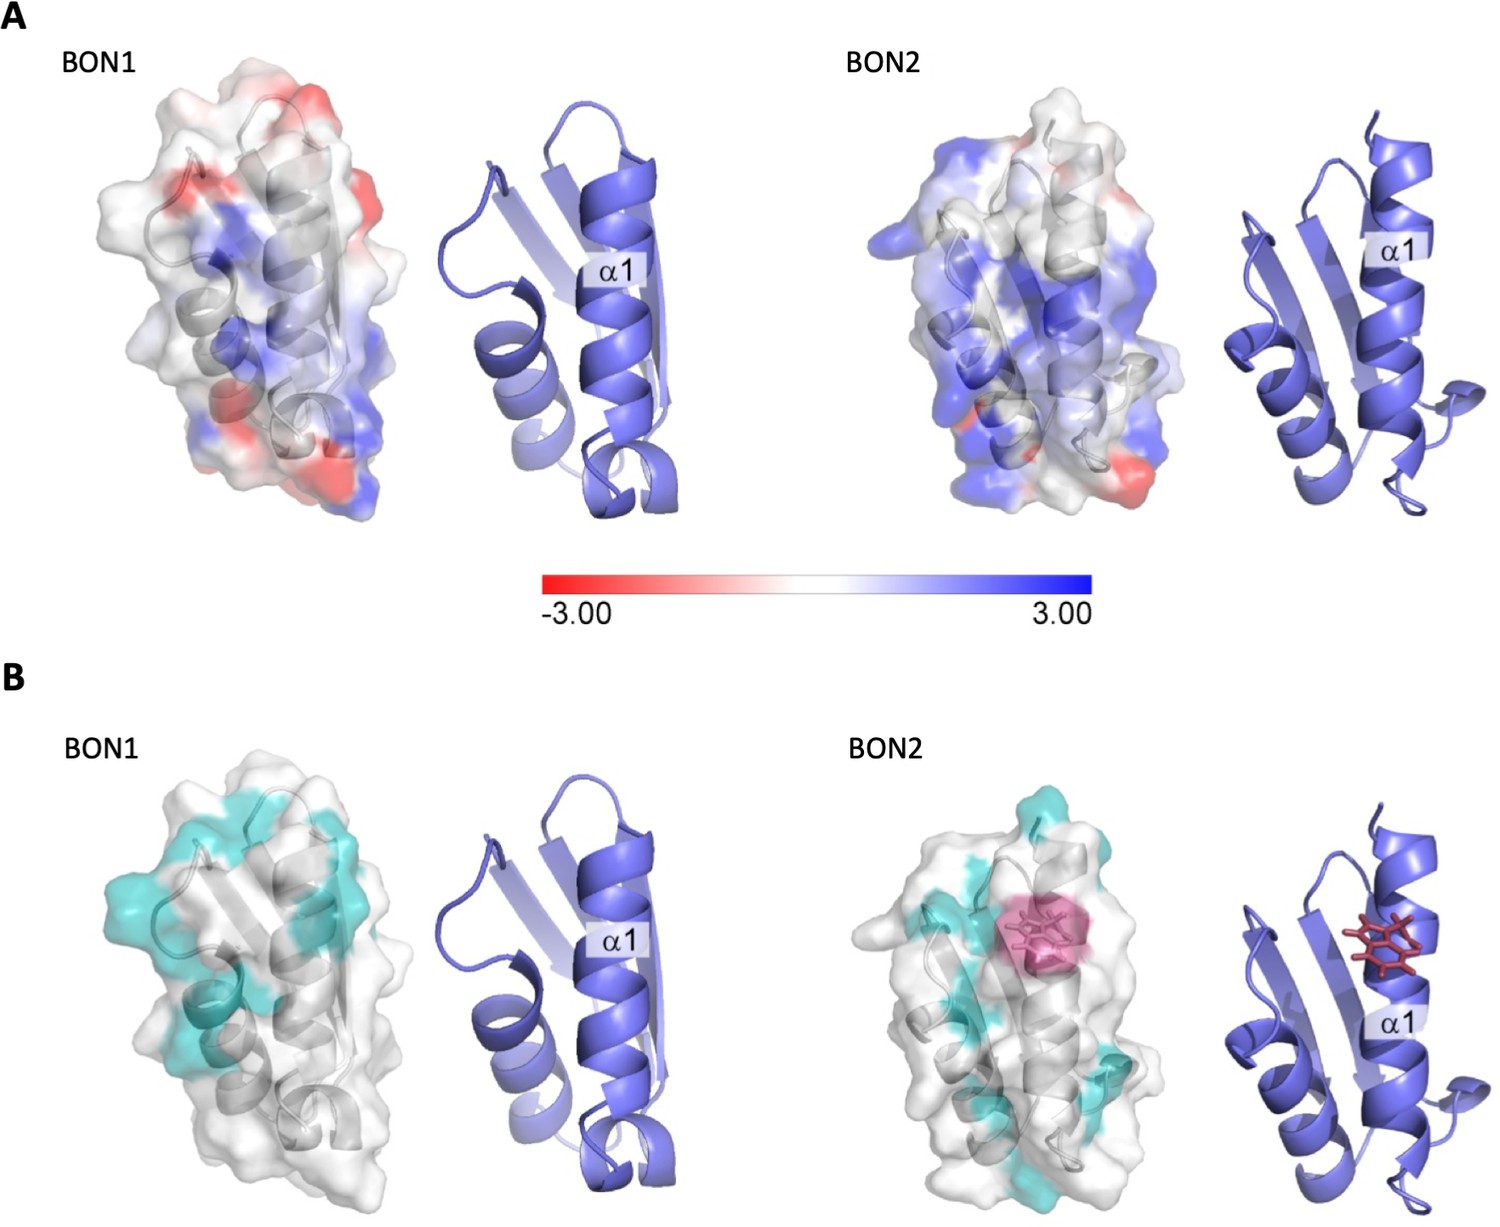
(A) Electrostatic surface map of DolP BON domains 1 and 2 calculated using DelPhi (Li et al., 2012) at a pH of 6 and 0.05M ionic strength (which approximates the experimental conditions). The −3kT/e surface is shown in red and the +3kT/e surface is shown in blue. A formal charge library was used, with a dielectric of 2 assigned to the protein interior and a dielectric of 80 assigned to the exterior. Cartoon representations of the BON structures are shown to the right of each surface to more clearly highlight the orientations of the protein. The BON1:α1 and BON2:α1 helices show clear differences, with BON1:α1 being predominantly neutral with an electronegative patch towards its N-terminus, whilst BON2:α2 shows no electronegatively at all, but rather has a large electropositive patch towards the centre of this helix presumably explaining its specificity for the electropositive surface of phosphatidylglycerol. (B) Hydrophobic surface map of DolP BON domains 1 and 2, hydrophobic residues (A, G, V, I, L, F, M) are shown in cyan, W127 (Red) is shown exposed on the surface of the BON2:α1 helix. Cartoon representations of the BON structures are shown to the right of each surface to more clearly highlight the orientations of the protein.
Figure 4—figure supplement 2
Analysis of DolP mutants.
(A) E. coli BW25113 ∆dolP mutants were complemented with plasmids expressing a wild-type copy of DolP or a mutant version. Each strain was serially diluted and plated on LB-agar containing either vancomycin (100 μg/ml) or SDS (4.8% wt/vol), and growth was observed after overnight incubation. The W127E and L137E mutants failed to grow. (B) Western immunoblotting of whole cell lysates derived from overnight cultures of mutants highlighted in the top panel. Blots were probed with antibodies to the outer-membrane lipoprotein BamB and to DolP.
Figure 5
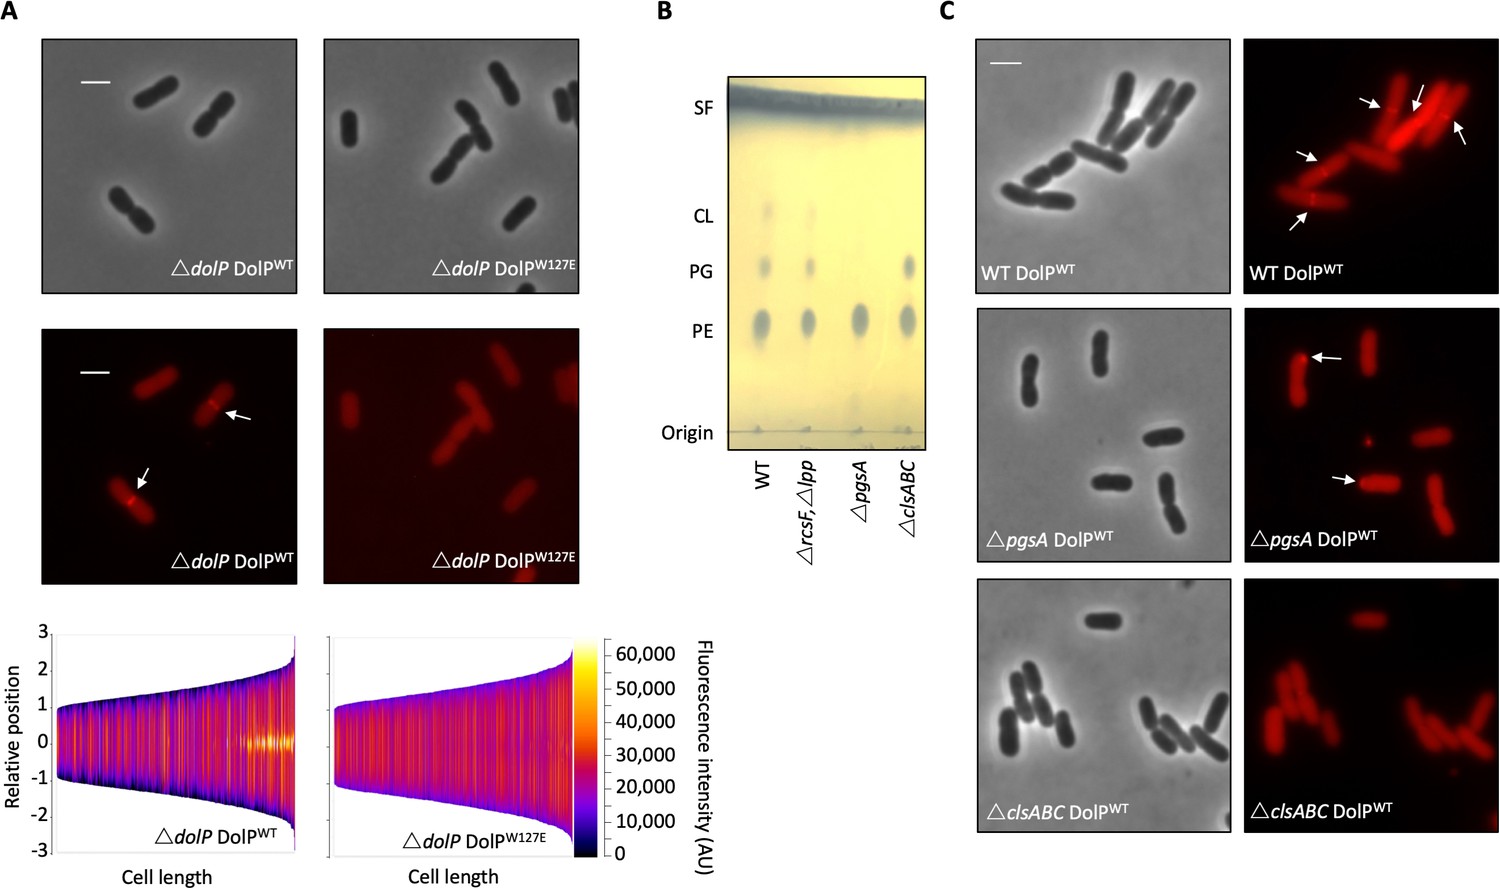
Phospholipid binding is required for DolP recruitment to division sites.
(A) Fluorescence microscopy of ΔdolP cells expressing either DolPWT::mCherry or DolPW127E::mCherry from the pET17b plasmid after growth to mid-exponential phase (OD600 ~0.4–0.8). Scale bars represent 2 μM and both phase contrast and the mCherry channel are shown in greyscale and red respectively. White arrows highlight division site localisation of DolPWT-mCherry. Demographic representations of the DolPWT-mCherry or DolPW127E-mCherry fluorescence intensities measure along the medial axis of the cells. Images of >500 cells were analysed using the MicrobeJ software and sorted according to length where the y-axis represents relative cellular position with 0 being mid-cell and 3 or −3 being the cell poles (Ducret et al., 2016). (B) Thin layer chromatography of phospholipids extracted from either E. coli BW25113 (WT), ΔrcsFΔlpp, ΔrcsFΔlppΔpgsA (referred to as ΔpgsA) or ΔclsAΔclsBΔclsC (referred to as ΔclsABC) strains. The rcsF and lpp genes must be removed in order to prevent toxic build-up of Lpp on the IM in the pgsA mutant. Phospholipids were separated using chloroform:methanol:acetic acid (65:25:10) as the mobile phase before staining with phophomolybdic acid and charring.( C) Fluorescence microscopy of ΔpgsA or ΔclsABC cells expressing DolPWTmCherry from the pET17b plasmid after growth to mid-exponential phase (OD600 ~0.4–0.8). White arrows highlight DolP-mCherry mislocalisation.
-
Figure 5—source data 1
Effect of DolP-anionic phospholipid interactions on DolP localisation.
- https://cdn.elifesciences.org/articles/62614/elife-62614-fig5-data1-v2.pptx
Tables
Table 1
Taxonomic distribution of BON family domain architectures.
| Cluster number* | UniRef100† | Total number of proteins ‡ | Major domain architecture in cluster§ | α | β | γ | δ | ε | ζ | Aci†† | Act†† | Bac†† | Chl†† | Chl†† | Chl†† | Cya†† | Dei†† | Fib†† | Fir†† | Gem†† | Nit†† | Pla†† | Spi†† | Syn†† | The†† | The†† | The†† | Ver†† |
|---|---|---|---|---|---|---|---|---|---|---|---|---|---|---|---|---|---|---|---|---|---|---|---|---|---|---|---|---|
| 1 | 1280 | 2723 | OsmY-like and 1 x BON | 41 (89)¶,** | 176 (533) | 1484 (1830) | 33 (56) | 12 (12) | 1 (1) | 6 (12) | 2 (3) | 5 (5) | 3 (11) | 3 (4) | 43 (65) | 1 (1) | 13 (13) | 1 (2) | 1 (1) | 14 (30) | 9 (9) | 1 (1) | 1 (1) | 7 (19) | ||||
| 2 | 833 | 2395 | DolP-like | 97 (103) | 330 (335) | 1892 (1919) | 15 (17) | 2 (2) | 1 (1) | 1 (2) | 1 (1) | |||||||||||||||||
| 3 | 579 | 690 | three x BON + 1 x BON | 95 (187) | 108 (255) | 35 (36) | 18 (28) | 7 (23) | 14 (25) | 14 (30) | 2 (2) | 3 (21) | 6 (10) | 5 (7) | 1 (1) | 32 (32) | 1 (2) | 12 (27) | 1 (1) | |||||||||
| 4 | 476 | 537 | BON + secretin | 207 (276) | 77 (80) | 70 (117) | 32 (34) | 4 (4) | 1 (1) | 3 (3) | 10 (11) | 1 (1) | 7 (7) | 1 (1) | ||||||||||||||
| 5 | 409 | 1570 | Kbp-like | 66 (66) | 131 (132) | 1323 (1328) | 1 (1) | 1 (1) | 31 (31) | 5 (5) | 1 (1) | 1 (1) | ||||||||||||||||
| 6 | 282 | 300 | CBS + CBS + BON | 82 (136) | 17 (29) | 4 (4) | 53 (127) | 4 (4) | ||||||||||||||||||||
| 7 | 220 | 318 | BON + BON + OmpA | 157 (161) | 55 (57) | 9 (11) | 62 (64) | 1 (1) | 19 (23) | 1 (1) | ||||||||||||||||||
| 8 | 70 | 75 | BON + Mschannel | 31 (32) | 1 (1) | 24 (25) | 2 (3) | 1 (1) | 8 (13) | |||||||||||||||||||
| 9 | 52 | 52 | one x BON | 1 (1) | 42 (51) | |||||||||||||||||||||||
| 10 | 43 | 80 | one x BON and 1 x DUF2204 | 1 (1) | 1 (1) | 77 (77) | 1 (1) | |||||||||||||||||||||
| 11 | 33 | 87 | 1–2 X Forkhead + BON | 2 (2) | 4 (4) | 2 (2) | 78 (79) | |||||||||||||||||||||
| 12 | 30 | 33 | one x BON | 26 (27) | 3 (3) | 1 (1) | 1 (1) | 1 (1) | ||||||||||||||||||||
| smaller cluster/unclustered: | ||||||||||||||||||||||||||||
| 83 | 109 | 22 (29) | 19 (19) | 25 (25) | 9 (9) | 1 (1) | 4 (12) | 2 (2) | 1 (1) | |||||||||||||||||||
-
* The main twelve clusters were analysed, all proteins falling into smaller clusters were summarised into the single category ‘smaller cluster’.
†, ‡, §, ¶ Shown are the number of UniRef100 used in the clustering approach†, the corresponding number of proteins derived from the HMMER search‡, the observed major domain architecture§ and the number of unique protein sequences (in brackets)¶ as well as the number of unique organisms mapped to the bacterial (Sub)Phyla**.
-
†† Acidobacteria, Actinobacteria, Bacteroidetes, Chlamydiae, Chlorobi, Chloroflexi, Cyanobacteria, Deinococcus-Thermus, Fibrobacteres, Firmicutes, Gemmatimonadetes, Nitrospirae, Planctomycetes, Spirochaetes, Synergistetes, Thermobaculum, Thermodesulfobacteria, Thermotogae, Verrucomicrobia.
Table 2
Structural statistics of the ensemble of 20 DolP solution structures.
| DolP | |
|---|---|
| Completeness of resonance assignments† | |
| Aromatic completeness | 74.14% |
| Backbone completeness | 98.42% |
| Sidechain completeness | 84.84% |
| Unambiguous CH2 completeness | 100% |
| Unambiguous CH3 completeness | 100% |
| Unambiguous sidechain NH2 completeness | 100% |
| Conformationally restricting restraints‡ | |
| Distance restraints | |
| Total NOEs | 2930 (2762) |
| Intra residue (i = j) | 408 (374) |
| Sequential (| i – j |=1) | 869 (783) |
| Medium range (1 < | i - j |<5) | 773 (741) |
| Long range (| i – j |≥5) | 880 (866) |
| Interdomain | 38 |
| Dihedral angle restraints | 258 |
| Hydrogen bond restraints | 128 |
| No. of restraints per residue | 16.6 (20.9) |
| No. of long range restraints per residue | 5.0 (6.5) |
| Residual restraint violations‡ | |
| Average No. of distance violations per structure | |
| 0.2 Å-0.5 Å | 3.55 |
| >0.5 Å | 0 |
| Average No. of dihedral angle violations per structure | |
| >5o | 0 (max 4.8) |
| Model quality‡ | |
| Global (residues 46–190) | |
| Rmsd backbone atoms (Å)§ | 0.5 |
| Rmsd heavy atoms (Å)§ | 0.9 |
| Domain 1 (Residues 46–112) | |
| Rmsd backbone atoms (Å) | 0.3 |
| Rmsd heavy atoms (Å) | 0.7 |
| Domain 2 (Residues 118–190) | |
| Rmsd backbone atoms (Å) | 0.3 |
| Rmsd heavy atoms (Å) | 0.8 |
| Rmsd bond lengths (Å) | 0.005 |
| Rmsd bond angles (o) | 0.6 |
| MolProbity Ramachandran statistics‡.§ | |
| Most favoured regions (%) | 95.1 |
| Allowed regions (%) | 4.3 |
| Disallowed regions (%) | 0.7 |
| Global quality scores (raw/Z score)‡ | |
| Verify 3D | 0.38 /- 1.28 |
| Prosall | 0.52 /- 0.54 |
| Procheck (phi-psi)d | −0.28 /- 0.79 |
| Procheck (all)d | −0.75 /- 4.44 |
| Molprobity clash score | 47.99 /- 6.71 |
| Model Contents | |
| Ordered residue ranges§ | 45–193 |
| Total number of residues | 178 |
| BMRB accession number | 19760 |
| PDB ID code | 7A2D |
-
* Structural statistics computed for the ensemble of 20 deposited structures.
† Computed using AVS software (Moseley et al., 2004) from the expected number of resonances, excluding highly exchangeable protons (N-terminal, Lys, amino and Arg guanido groups, hydroxyls of Ser, Thr, and Tyr), carboxyls of Asp and Glu, non-protonated aromatic carbons, and the C-terminal His6 tag.
-
‡ Calculated using PSVS version 1.5 (Bhattacharya et al., 2007). Average distance violations were calculated using the sum over r−6.
§ Based on ordered residue ranges [S(φ) + S(ψ)>1.8].
-
Values in (brackets) refer to the core structured region.
Table 3
Interdomain NOE restraints identified by Cyana during automated NOE assignment and structure calculation.
| Proton pair | Intensity | Distance (Å) |
|---|---|---|
| TYR 75 HD1 - THR 188 HA | Weak | 5.5 |
| TYR 75 HE1 - GLY 160 HA2 | Weak | 5.4 |
| TYR 108 HE1 - ALA 186 HA | Weak | 5.5 |
| TYR 108 HE2 - ALA 186 HA | Weak | 5.5 |
| TYR 108 HE1 - ALA 186 HB | Weak | 5.1 |
| TYR 75 HD1 - ALA 186 HB | Weak | 5.2 |
| TYR 75 HE1 - LEU 161 HA | Weak | 5.2 |
| TYR 75 HE1 - LEU 161 HB3 | Weak | 5.4 |
| TYR 75 HE1 - LEU 161 HG | Weak | 5.5 |
| TYR 75 HE1 - LEU 161 HD1 | Weak | 4.9 |
| TYR 75 HE1 - LEU 161 HD2 | Weak | 4.9 |
| THR 73 HG2 - ALA 186 HB | Weak | 5.5 |
| LYS 78 HD2 - PHE 187 hr | Weak | 5.5 |
| LYS 78 HD3 - PHE 187 hr | Weak | 5.5 |
| TYR 75 HD1 - HET 159 HA | Weak | 5.5 |
| TYR 108 HD1 - ALA 186 HB | Weak | 5.5 |
| GLN 76 HE22 - LEU 161 HB2 | Weak | 5.2 |
| GLN 76 HE22 - LEU 161 HG | Weak | 5.1 |
| GLN 76 HE22 - LEU 161 HD1 | Weak | 4.5 |
| GLN 76 HE22 - LEU 161 HD2 | Weak | 4.5 |
| TYR 75 HD1 - THR 188 HG2 | Weak | 4.2 |
| TYR 75 HE1 - LEU 161 hr | Weak | 4.3 |
| TYR 75 HE1 - VAL 162 hr | Weak | 5.5 |
| TYR 75 HE1 - LEU 161 HB2 | Weak | 4.1 |
| TYR 75 HE1 - THR 188 HG2 | Weak | 4.1 |
| TYR 75 HE1 - THR 188 hr | Weak | 5.5 |
| TYR 75 HE1 - GLY 160 hr | Weak | 4.8 |
| TYR 75 HD1 - GLY 160 hr | Weak | 4.7 |
| THR 73 HG2 - HET 159 HG | Weak | 4.4 |
| TYR 75 HE1 - LEU 161 HD | Weak | 4.0 |
| TYR 75 HE2 - LEU 161 HD | Weak | 5.1 |
| GLN 76 HE21 - LEU 161 HD | Medium | 3.7 |
| GLN 76 HE22 - LEU 161 HD | Medium | 3.7 |
| LYS 78 HG - PHE 187 hr | Weak | 4.9 |
| LYS 78 HD - ALA 186 HB | Weak | 5.1 |
| LYS 78 HD - PHE 187 hr | Weak | 4.7 |
| LYS 78 HE - PHE 187 hr | Weak | 5.3 |
| ARG 112 HA - ARG 182 HB | Weak | 5.3 |
Key resources table
| Reagent type (species) or resource | Designation | Source or reference | Identifiers | Additional information |
|---|---|---|---|---|
| Strain, strain background (Escherichia coli) | BL21(DE3) | Invitrogen | T7 express, protein expression strain | |
| Strain, strain background (Escherichia coli) | BW25113 | Datsenko and Wanner, 2000 | rrnB3 ΔlacZ4787 ΔphoBR580 hsdR514 Δ(araBAD)567 Δ(rhaBAD)568 galU95 ΔendA9::FRT ΔuidA3::pir(wt) recA1 rph-1 | |
| Strain, strain background (Escherichia coli) | BW25113 △dolP | This paper | BW25113 with dolP deleted | |
| Strain, strain background (Escherichia coli) | BW25113 △lpp,△rcsF | This paper | BW25113 with lpp and rcsF deleted | |
| Strain, strain background (Escherichia coli) | BW25113 △lpp,△rcsF,△pgsA | This paper | BW25113 with lpp, rcsF and pgsA genes deleted | |
| Strain, strain background (Escherichia coli) | BW25113 △clsA,△clsB,△clsC | This paper | BW25113 with clsA, clsB and clsC genes deleted | |
| genetic reagent (E. coli) | KEIO library | Datsenko and Wanner, 2000 | Nonessential genes disrupted in E. coli BW25113 | |
| Recombinant DNA reagent | pKD4 | Datsenko and Wanner, 2000 | Plasmid | Template for the amplification of a kanamycin resistance cassette flanked by FRT sites. |
| Recombinant DNA reagent | pKD46 | Datsenko and Wanner, 2000 | Plasmid | Temperature sensitive, low copy number plasmid encoding the Lambda RED recombinase genes under the control of an arabinose inducible promoter |
| Recombinant DNA reagent | pCP20 | Datsenko and Wanner, 2000 | Plasmid | Temperature sensitive plasmid encoding the FLP recombinase gene |
| Recombinant DNA reagent | pET17b | Novagen | Plasmid | T7 expression vector, AmpR |
| Recombinant DNA reagent | pET17b dolP | This paper | Plasmid | pET17b with dolP cloned between NdeI and EcoRI |
| Recombinant DNA reagent | pET17b dolP TM | This paper | Plasmid | As described above with the dolP gene randomly disrupted by Transposon mutations |
| Recombinant DNA reagent | pET17b dolP STm | This paper | Plasmid | pET17b with the S. typhimurium dolP gene cloned between NdeI and HindIII |
| Recombinant DNA reagent | pET17b dolP H.i | This paper | Plasmid | pET17b encoding a codon optimised Haemophilus influenza dolP homolog |
| Recombinant DNA reagent | pET17b dolP P.m | This paper | Plasmid | pET17b encoding a codon optimised Pasteurella multocida dolP homolog |
| Recombinant DNA reagent | pET17b dolP N.m | This paper | Plasmid | pET17b encoding a codon optimised Neisseria meningitidis dolP homolog |
| Recombinant DNA reagent | pET17b dolP V.c | This paper | Plasmid | pET17b encoding a codon optimised Vibrio cholera dolP homolog |
| Recombinant DNA reagent | pET17b osmY | This paper | Plasmid | pET17b encoding a codon optimised E. coli K12 osmY |
| Recombinant DNA reagent | p(OM)OsmY | This paper | Plasmid | pET17b encoding a codon optimised E. coli K12 osmY synthesised with the dolP signal sequence and acylation site in place of the osmY signal sequence |
| Recombinant DNA reagent | pET20b | Novagen | Plasmid | T7 expression vector, AmpR |
| Recombinant DNA reagent | pET20b dolP | This paper | Plasmid | pET20b with dolP cloned between NdeI and EcoRI |
| Recombinant DNA reagent | pET20b dolP PM | This paper | Plasmid | pET20b with dolP cloned between NdeI and EcoRI with site-directed point mutations at various sites |
| Recombinant DNA reagent | pET20b wbbL | This paper | Plasmid | pET20b with wbbL gene cloned between NdeI and HindIII |
| Recombinant DNA reagent | pET20b dolP::mCherry | This paper | Plasmid | pET20b encoding dolP fused to a codon optimised mCherry gene via a C-terminal 11-codon flexible linker (GGSSLVPSSDP) |
| Recombinant DNA reagent | pET26b dolPpelB::mCherry | This paper | Plasmid | pET26b dolP::mCherry with the dolP signal sequence replaced with that of pelB |
| Recombinant DNA reagent | pET20b dolPIM::mCherry | This paper | Plasmid | pET20b dolP::mCherry with codon 20 and 22 of dolP each mutated to aspartic acid |
| Recombinant DNA reagent | pET20b dolPW127E::mCherry | This paper | Plasmid | pET20b dolP::mCherry with codon 127 mutated to glutamic acid |
Table 4
Accession numbers for the sequences used for CLANS clustering shown in Figure 1.
| Organism | OsmY | DolP | Kbp |
|---|---|---|---|
| Escherichia coli K12 | P0AFH8 | P64596 | P0ADE6 |
| Klebsiella pneumoniae MGH 78578 | A6THZ1 | A6TEG9 | A6T985 |
| Enterobacter cloacae ENHKU01 | J7G7C8 | J7GHD1 | J7GFT3 |
| Salmonella enterica Typhimurium | Q7CP68 | Q7CPQ6 | Q8ZML9 |
| Erwinia billingiae Eb661 | D8MMS8 | D8MME2 | D8MNV6 |
| Serratia proteamaculans 568 | A8G9G9 | A8GJZ3 | A8GFP7 |
| Cronobacter sakazakii ATCC BAA-894 | A7MGB6 | A7MIQ1 | A7MEA9 |
| Pantoea sp. Sc1 | H8DPK0 | H8DQ90 | H8DIH9 |
| Hafnia alvei ATCC 51873 | G9Y3J7 | G9Y4J4 | G9YAM4 |
| Citrobacter rodentium ICC168 | D2TRY4 | D2TQ24 | D2TM58 |
| Shigella flexneri 1235–66 | I6F1Q5 | I6GLP1 | I6HD15 |
| Yersinia enterocolitica 8081 | A1JJ93 | A1JR75 | |
| Yersinia pestis KIM10+ | Q7CG58 | Q8D1R6 | |
| Dickeya dadantii 3937 | E0SJX0 | E0SHF6 |
Table 5
HADDOCK docking statistics for ensemble 20 lowest-energy DolP-DPC micelle solution structures calculated.
| Experimental parameters* | |
|---|---|
| Ambiguous distance restraints | 19 including NH of I20, G120-T130, V132-Q135, T138, S139, and NHε of W127 |
| Number of flexible residues† | 50 (I20-V45 (flexible linker as ascertained by NMR), A74, G120-I128, K131-R133, Q135-L137, V142-S145, I173,S178-V180) |
| Atomic pairwise RMSD (Å) | |
| All backbone | |
| Flexible interface backbone | |
| Intermolecular energies (kcal.mol−1) | |
| Evdw | −100.81 ± 7.74 |
| Eelec | −231.67 ± 64.14 |
| Erestraints | 22.30 ± 4.29 |
| Buried surface area (Å2) | 2186.78 ± 133.277 |
-
* deduced from intensity reductions observed in presence of 5-doxl derivative.
† according to their surface accessibility and the chemical shift perturbation in presence of DPC/CHAPS.
Additional files
-
Supplementary file 1
UniProt accession numbers for the proteins in the respective clusters as shown in Table 1.
- https://cdn.elifesciences.org/articles/62614/elife-62614-supp1-v2.xlsx
-
Supplementary file 2
Mass spectrometry of outer membrane fractions to assess presence of protein.
- https://cdn.elifesciences.org/articles/62614/elife-62614-supp2-v2.xlsx
-
Transparent reporting form
- https://cdn.elifesciences.org/articles/62614/elife-62614-transrepform-v2.docx
Download links
A two-part list of links to download the article, or parts of the article, in various formats.
Downloads (link to download the article as PDF)
Open citations (links to open the citations from this article in various online reference manager services)
Cite this article (links to download the citations from this article in formats compatible with various reference manager tools)
Structure of dual BON-domain protein DolP identifies phospholipid binding as a new mechanism for protein localisation
eLife 9:e62614.
https://doi.org/10.7554/eLife.62614


