Fine interaction profiling of VemP and mechanisms responsible for its translocation-coupled arrest-cancelation
- Institute for Frontier Life and Medical Sciences, Kyoto University, Japan
Figures
Figure 1 with 5 supplements
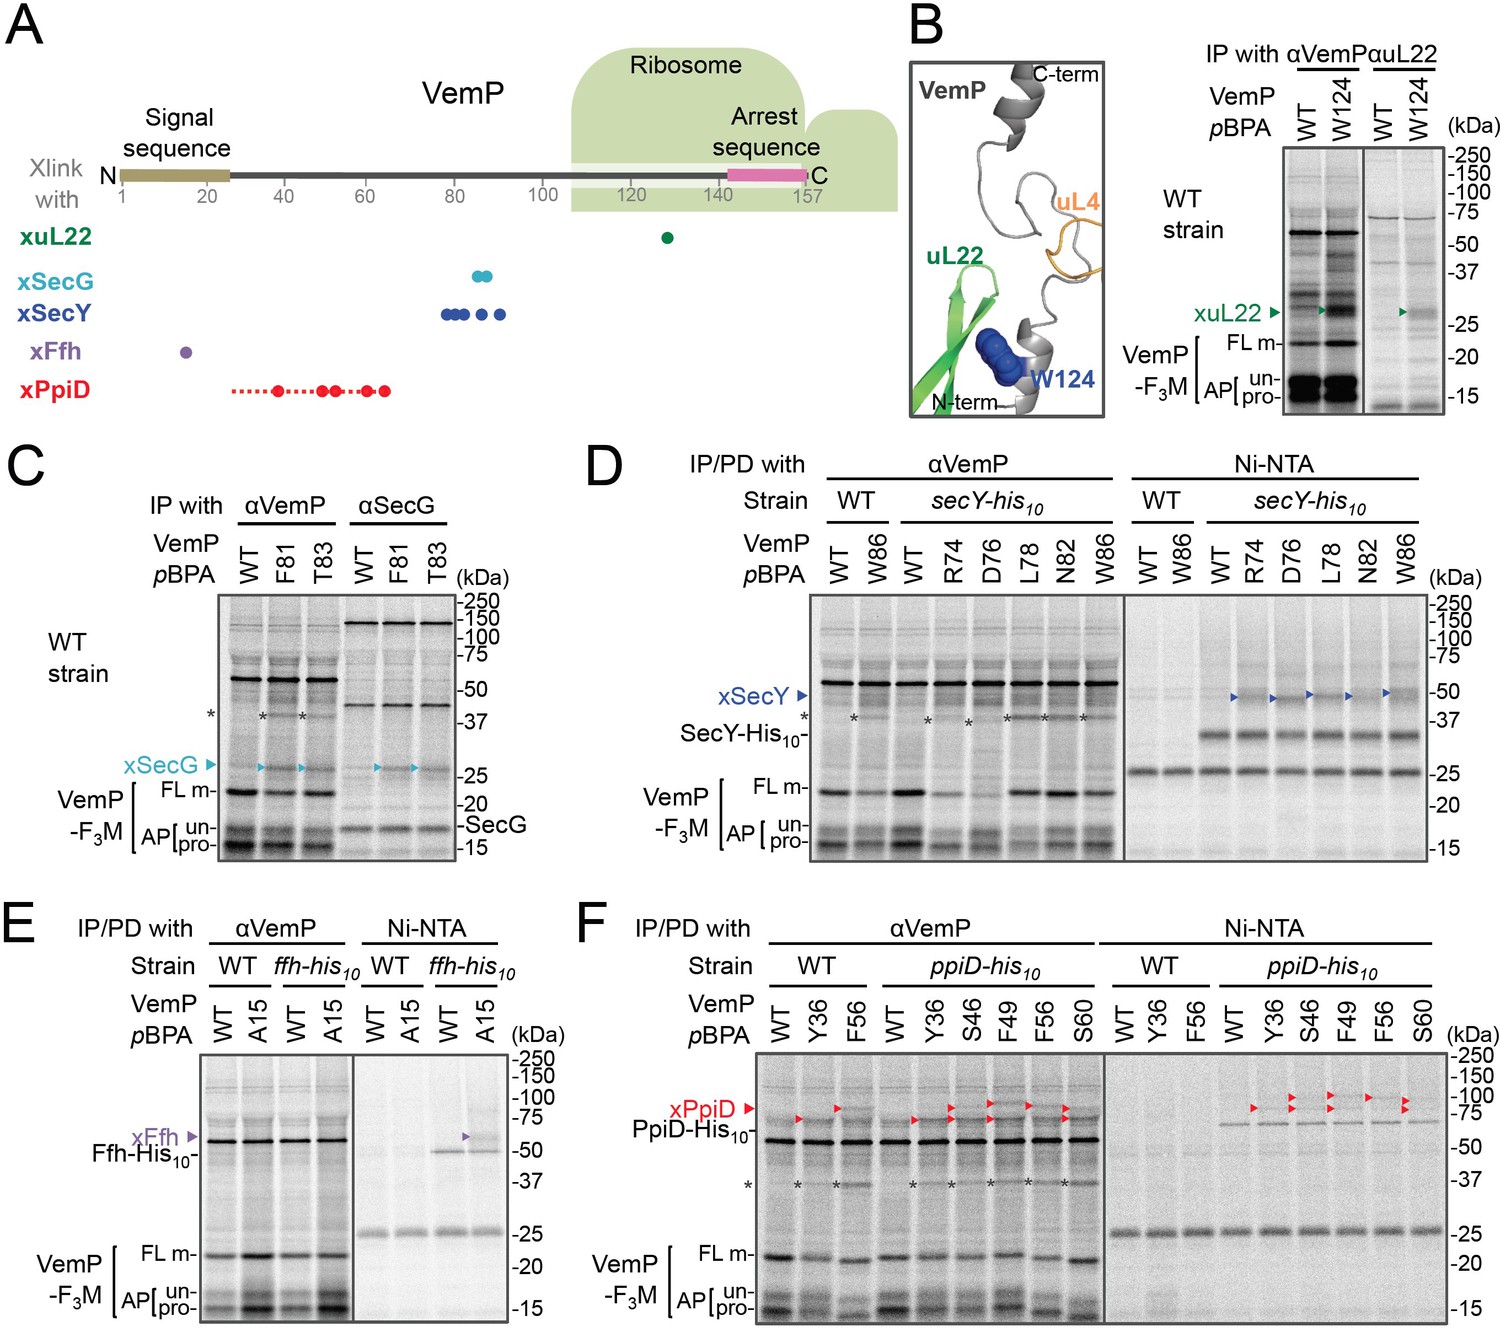
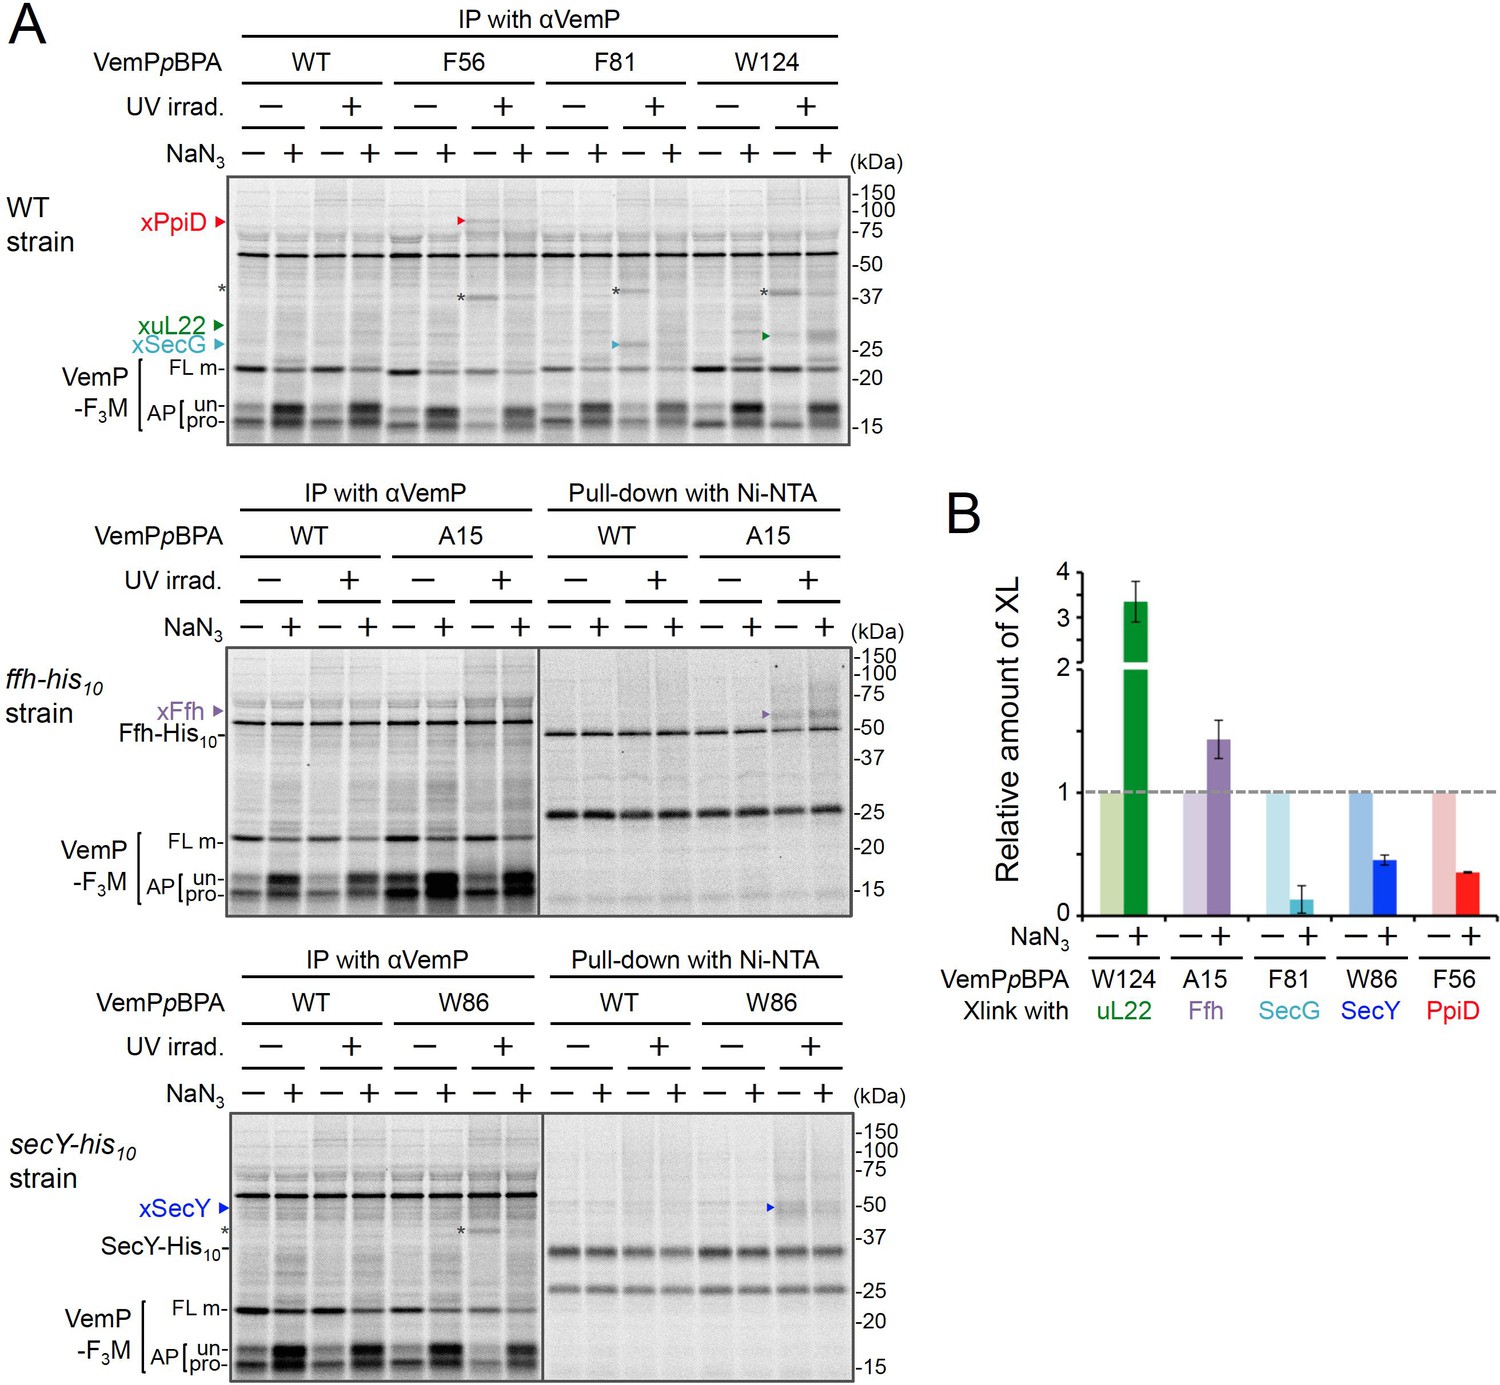
In vivo crosslinking reveals interaction of a VemP nascent polypeptide with Ffh and PpiD as well as uL22 and translocon.
(A) Summary of proteins crosslinked with VemP in the arrested state. Colored circles represent the positions at which crosslinking with the indicated proteins was observed in B–F. Dashed red line shows the positions at which cross-linking with PpiD was detected in Figure 1—figure supplement 1. (B–F) PiXie analysis of VemP. Wild type E. coli cells were used in B and C. E. coli cells expressing SecY-His10, Ffh-His10, or PpiD-His10 from the chromosome were used in D, E and F, respectively. Wild type cells were used as negative controls in D, E and F. Cells were grown, induced to express a VemP-F3M derivative and pulse-labeled with [35S]Met for 30 s, followed by 30 s-chase as described in Materials and methods. Cells were UV-irradiated for 1 s and immediately acid-treated. Labeled proteins were subjected to immunoprecipitation (IP) or pull-down (PD) with Ni-NTA agarose, separated by SDS-PAGE and analyzed by phosphorimaging. The result shown is a representative of two independent experiments that were conducted using the same transformants (i.e. two technical replicates). Asterisks represent crosslinked dimers of VemP-F3M. An enlarged view around Trp-124 of VemP in a VemP-stalled ribosome complex (PDB:5nwy; Su et al., 2017) is shown in B, left.
Figure 1—figure supplement 1
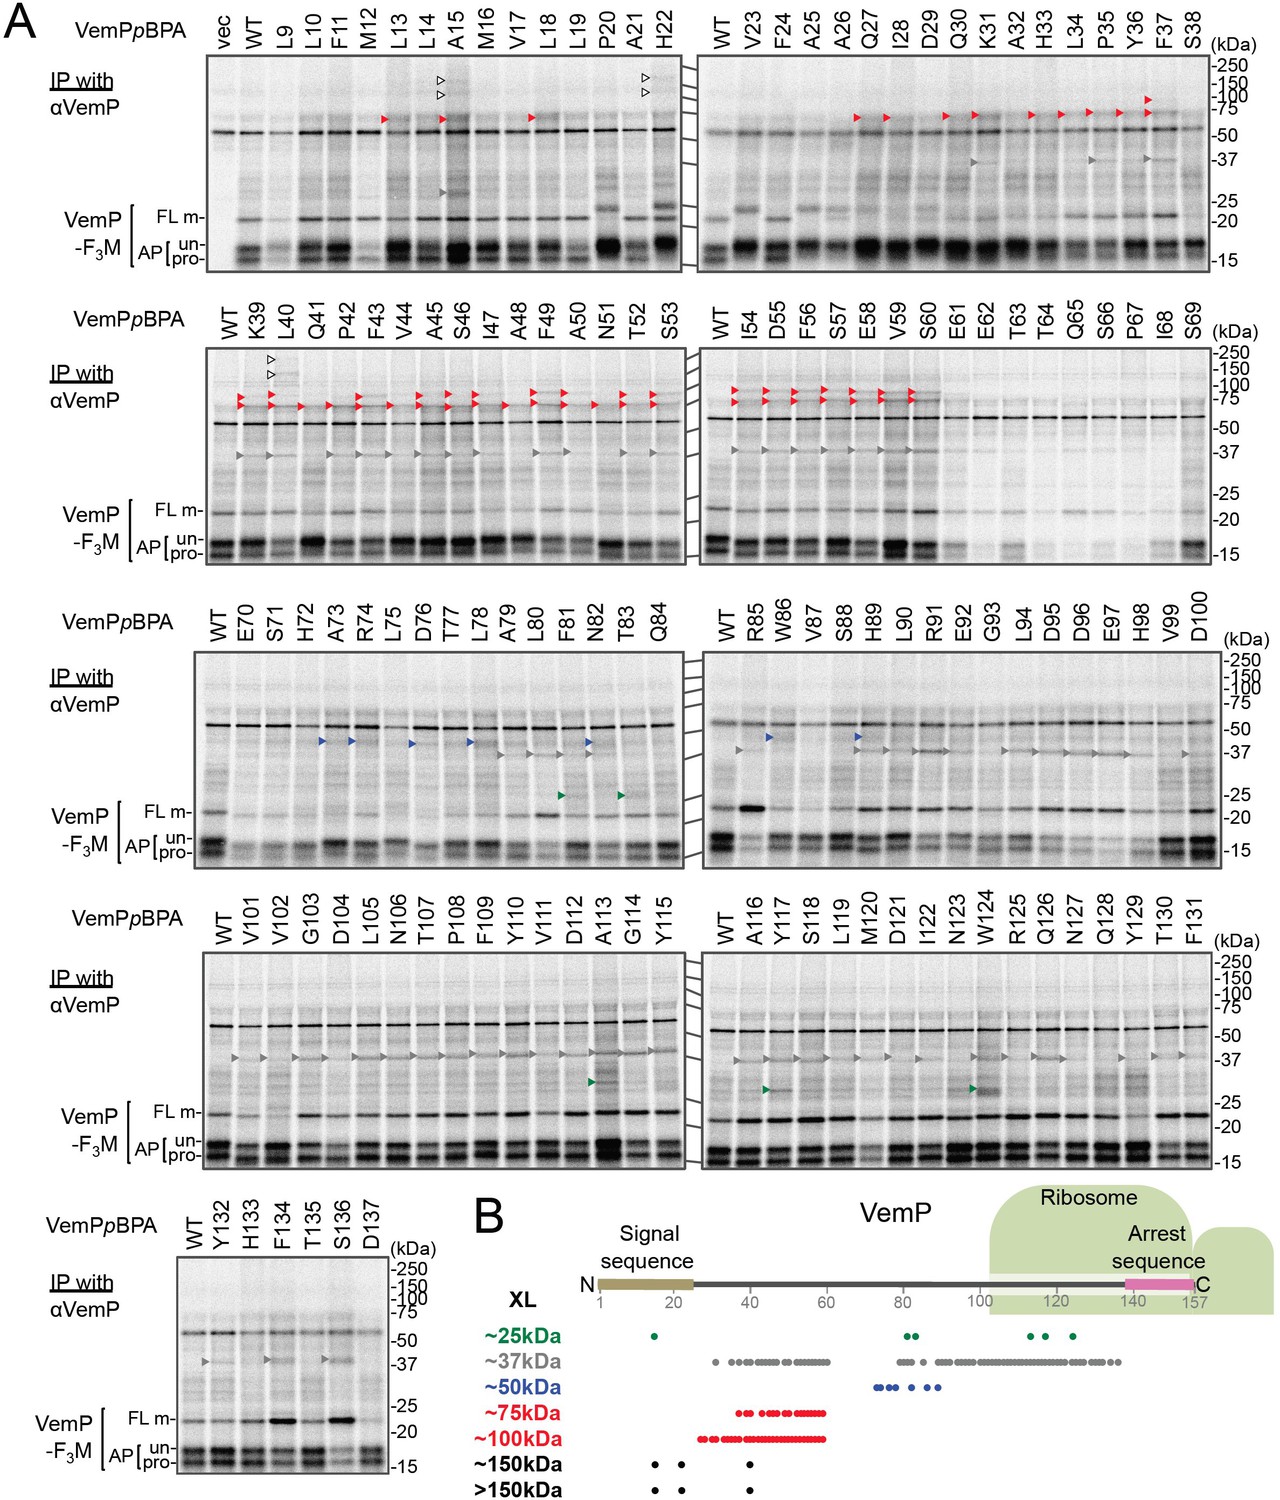
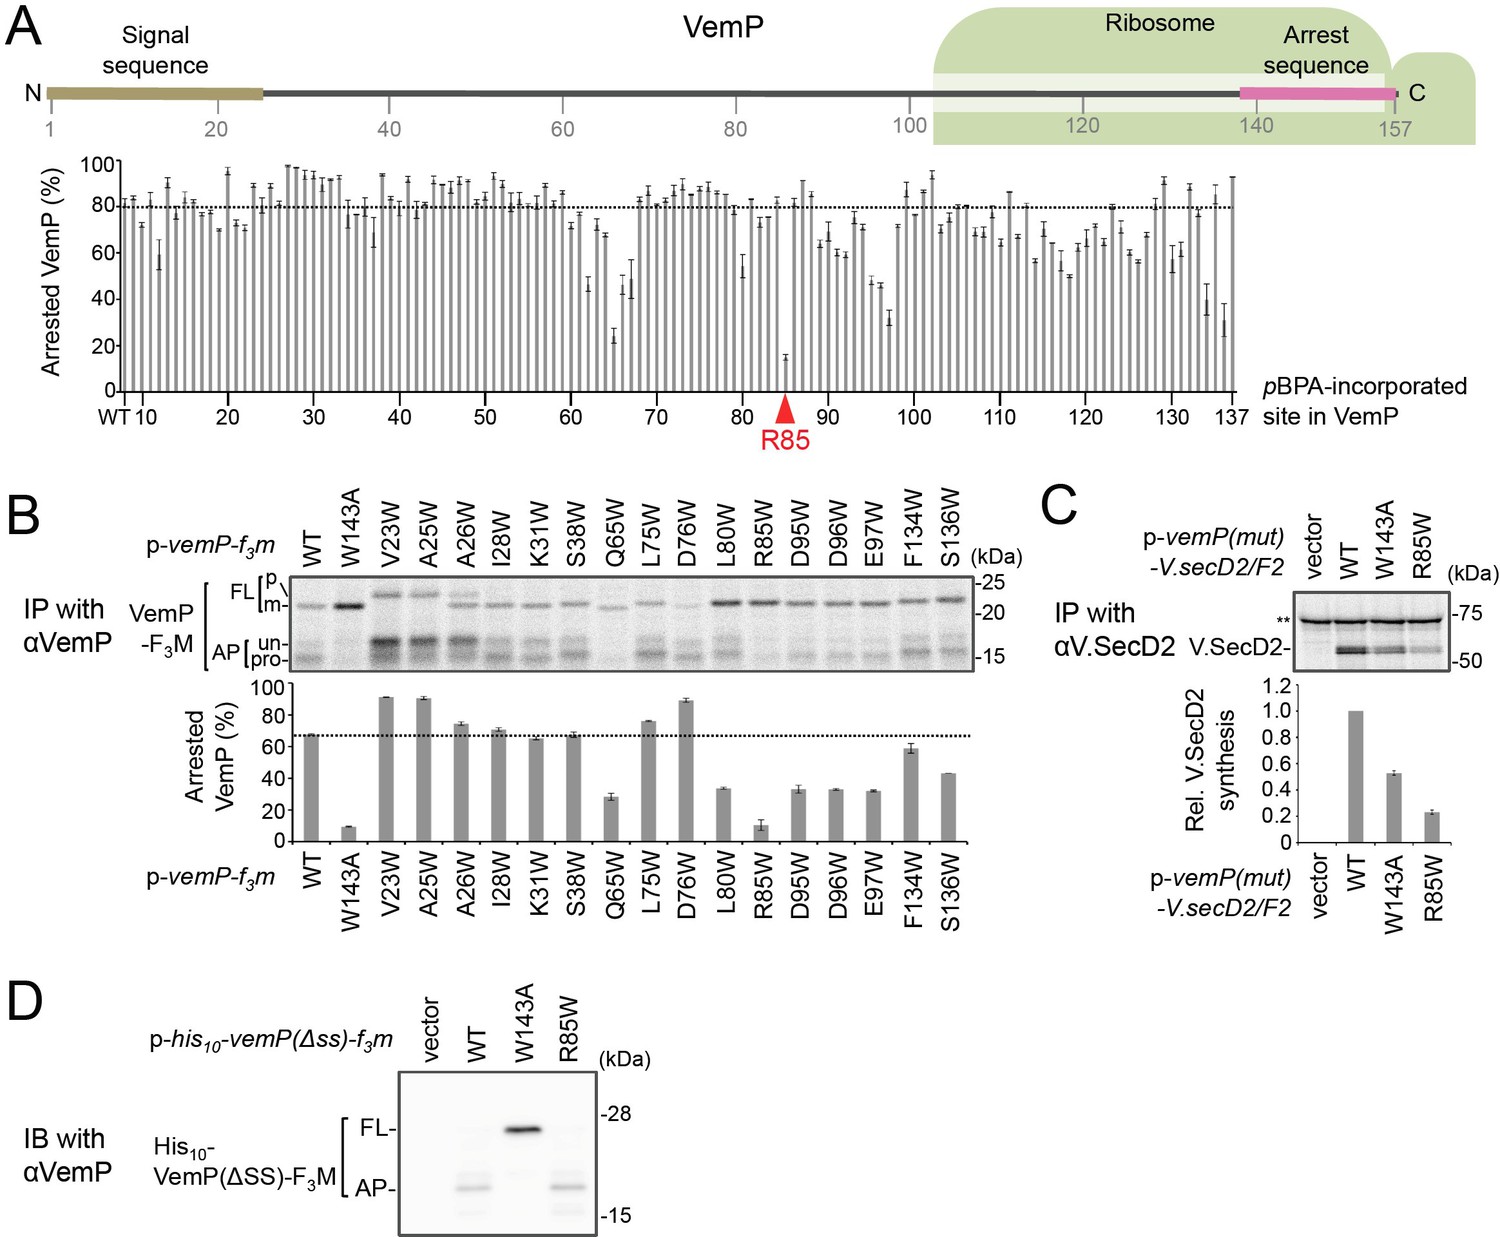
Systematic PiXie analysis of a nascent VemP.
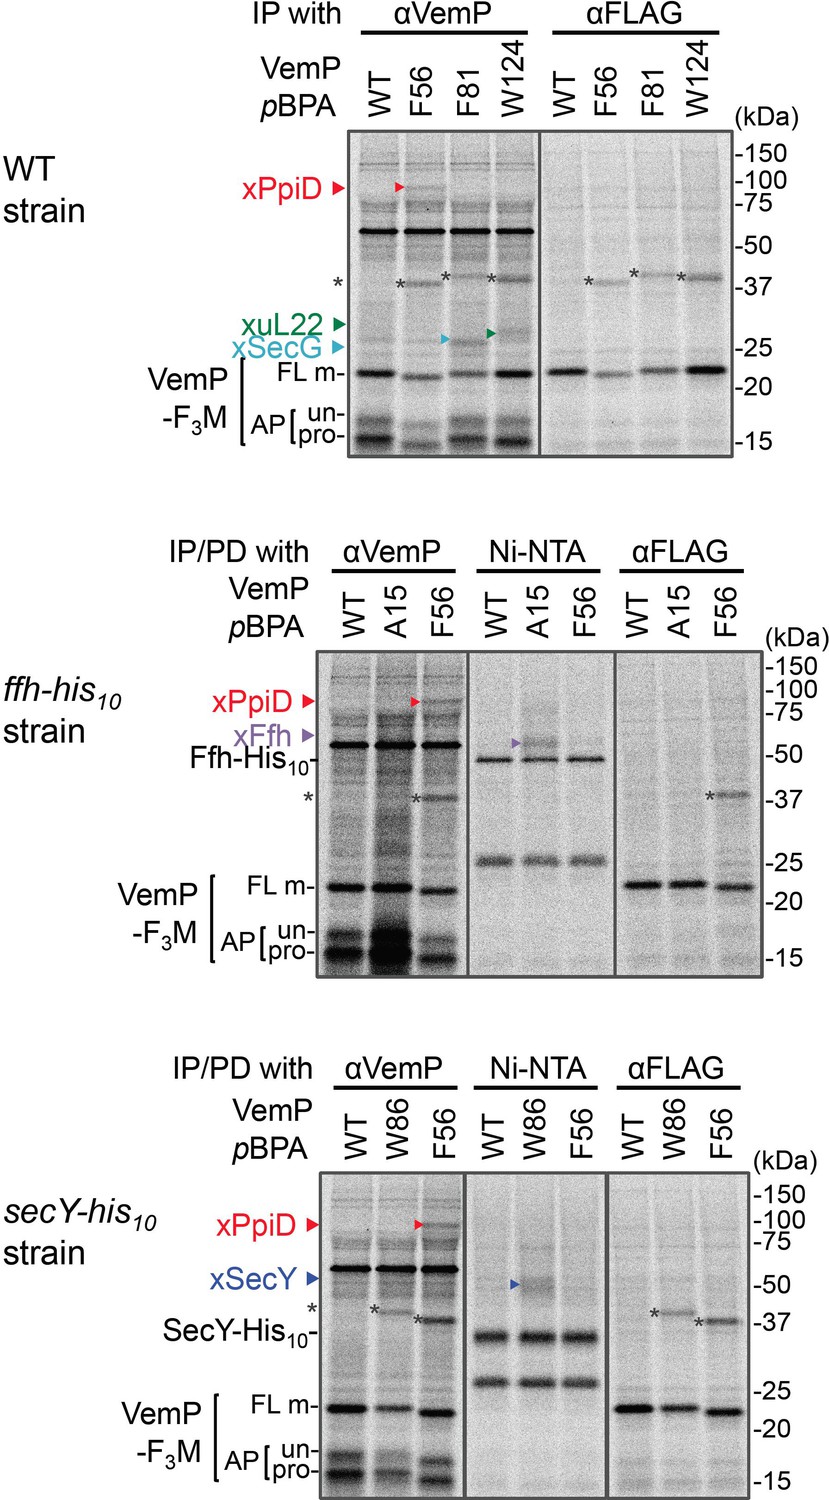
(A) Systematic PiXie analysis of VemP. Cells were grown as described in Materials and methods, induced with 1 mM IPTG for 15 min to express VemP-F3M derivatives with pBPA at the indicated position, pulse-labeled with [35S]Met for 30 s, and chased for 30 s with excess unlabeled Met. The cells were then UV-irradiated for 1 s. Total cellular proteins were acid-precipitated and subjected to immunoprecipitation (IP) with an anti-VemP antibody. Immuno-isolated proteins were separated by SDS-PAGE and analyzed by phosphorimaging. The result shown is a representative of two technical replicates. Crosslinked products (XLs) that are classified from their apparent sizes on SDS-PAGE and identified partner proteins (See Figure 1 and Figure 1—figure supplements 2–5) are marked by arrowheads with different colors. (B) Summary of the crosslinked proteins and their positions of crosslinking. A schematic picture of the VemP polypeptide in the arrested state is presented with the residue numbers. The positions of the crosslinking to each protein are represented as circles with the same colors as in A.
Figure 1—figure supplement 2
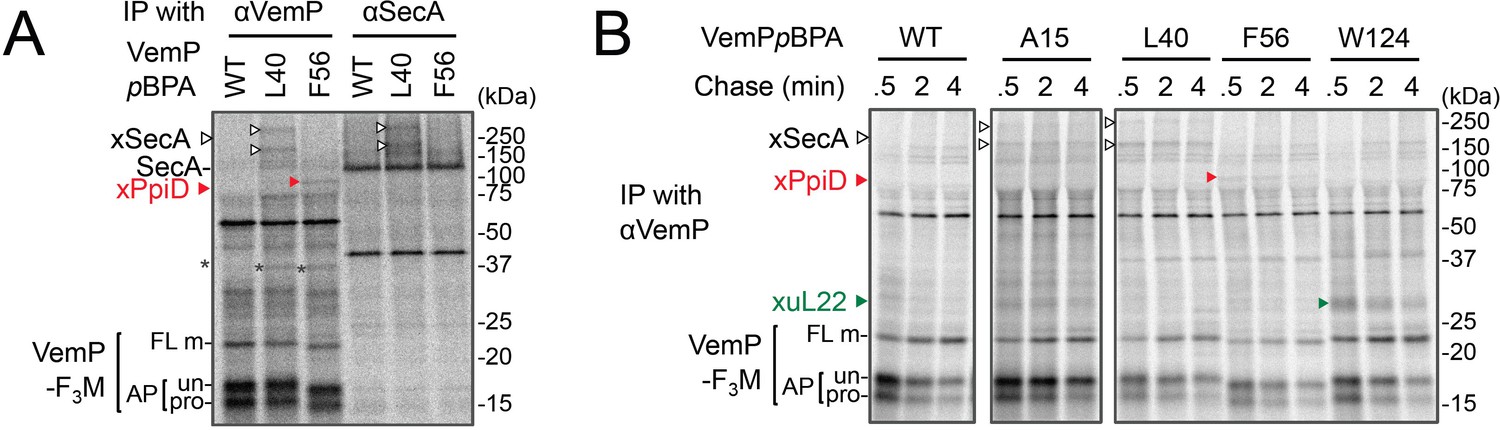
Identification and characterization of VemPxSecA crosslinked products.
(A) VemPxSecA XLs. Celle were grown, induced to express a VemP-F3M derivative with pBPA at the indicated position (WT indicates the protein with no pBPA), pulse-chased, and UV-irradiated as in Figure 1. Labeled proteins were subjected to IP with indicated antibodies and analyzed as in Figure 1. XLs with SecA and PpiD are marked by open-black and filled-red arrowheads, respectively. The result shown is a representative of two technical replicates. (B) PiXie analysis of XLs. Cells were grown, induced to express a VemP-F3M derivative with pBPA at the indicated position (WT indicates the protein with no pBPA) pulse-labeled and chased as in Figure 1. At the indicated time points in the chase period, cells were UV-irradiated for 1 s and then acid-treated. Labeled proteins were subjected to IP with the anti-VemP antibody. Isolated proteins were analyzed as in Figure 1. XLs with SecA, PpiD, and uL22 are marked by open-black, filled-red and filled-green arrowheads, respectively. The result shown is a representative of two technical replicates.
Figure 1—figure supplement 3
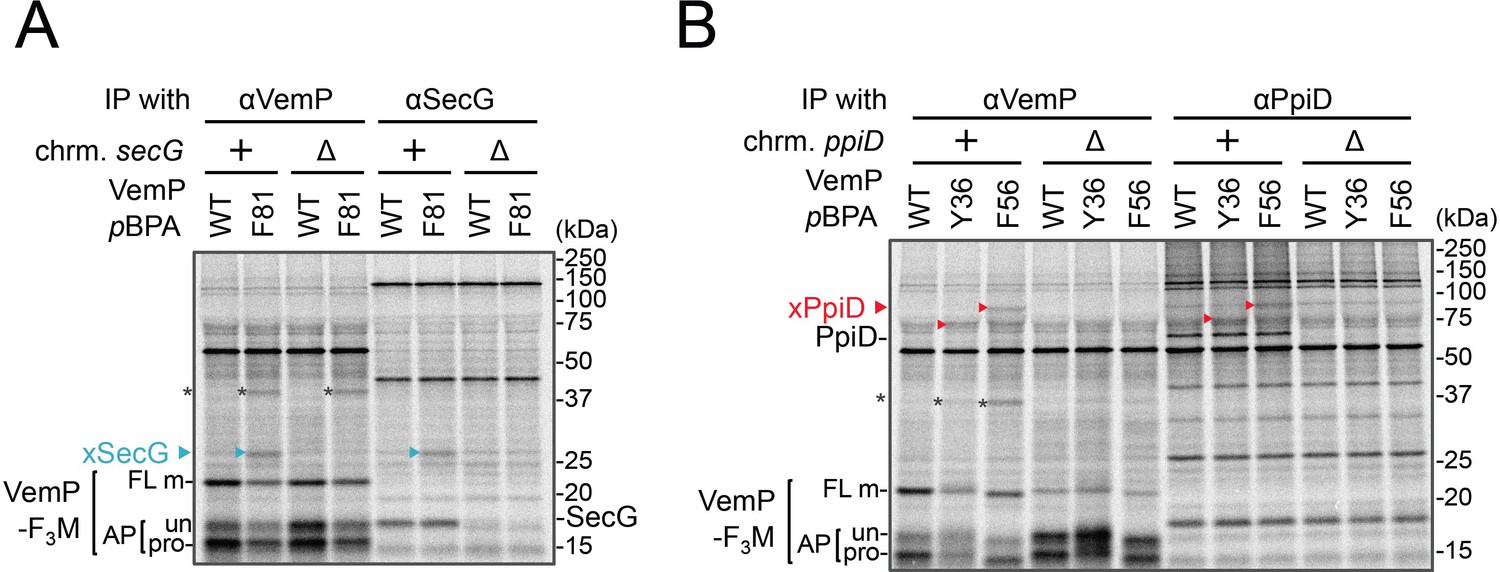
Identification of VemP crosslinked products.
(A) VemPxSecG XLs. (B) VemPxPpiD XLs. The cells of the indicated strains were grown, induced to express a VemP-F3M derivative with pBPA at the indicated position (WT indicates the protein with no pBPA), pulse-chased, and UV irradiated as in Figure 1. Labeled proteins were subjected to IP with indicated antibodies and analyzed as in Figure 1. The result shown is a representative of two technical replicates. Asterisks in A and B represent crosslinked dimer forms of VemP-F3M.
Figure 1—figure supplement 4

Identification of VemP crosslinked products using His-tagged derivatives of candidate proteins.
(A–D) VemP PiXie analysis in cells expressing His10-tagged proteins. E. coli strains, RM2834 (expressing SecY-His10 from the chromosome, A), RM2831 (Ffh-His10, B), and RM2935 (YidC-His10,C) were constructed (see Materials and methods) and used. The cells of the indicated strains were grown, induced to express a VemP-F3M derivative with pBPA at the indicated position and analyzed by the PiXie methods as described in Figure 1. Labeled proteins were subjected to IP with an anti-VemP antibody (upper gel) or pull-down with Ni-NTA agarose (lower gel). Immuno-isolated proteins were analyzed as in Figure 1. (D) secD1 mutant cells over-expressing His10-SecD/F were grown and induced to express a VemP-F3M derivative with pBPA at the indicated position and analyzed by PiXie as in Figure 1. Labeled proteins were subjected to IP with the anti-VemP antibody (upper gel) or pull-down with Ni-NTA agarose (lower gel). Immuno-isolated proteins were analyzed as in Figure 1. The result shown is a representative of two technical replicates. Asterisks in A–D represent crosslinked dimer forms of VemP-F3M.
Figure 1—figure supplement 5
Immunoprecipitation of VemP-crosslinked products using anti-FLAG antibodies.
The cells of the indicated strains were grown, induced to express a VemP-F3M derivative with pBPA at the indicated position (WT indicates the protein with no pBPA), and analyzed by PiXie as in Figure 1. Labeled proteins were subjected to IP with the indicated antibodies or pull-down with Ni-NTA agarose. Immuno-isolated proteins were analyzed as in Figure 1. The result shown is a representative of two technical replicates. The VemP XLs with PpiD, uL22, SecG, SecY-His10, and Ffh-His10 are marked by triangles colored in red, green, pale blue, blue, and violet, respectively. Asterisks presumably represent crosslinked dimer forms of full-length VemP-F3M.
Figure 2 with 4 supplements
The VemP nascent polypeptide interacts sequentially with uL22/Ffh, the translocon, and PpiD.
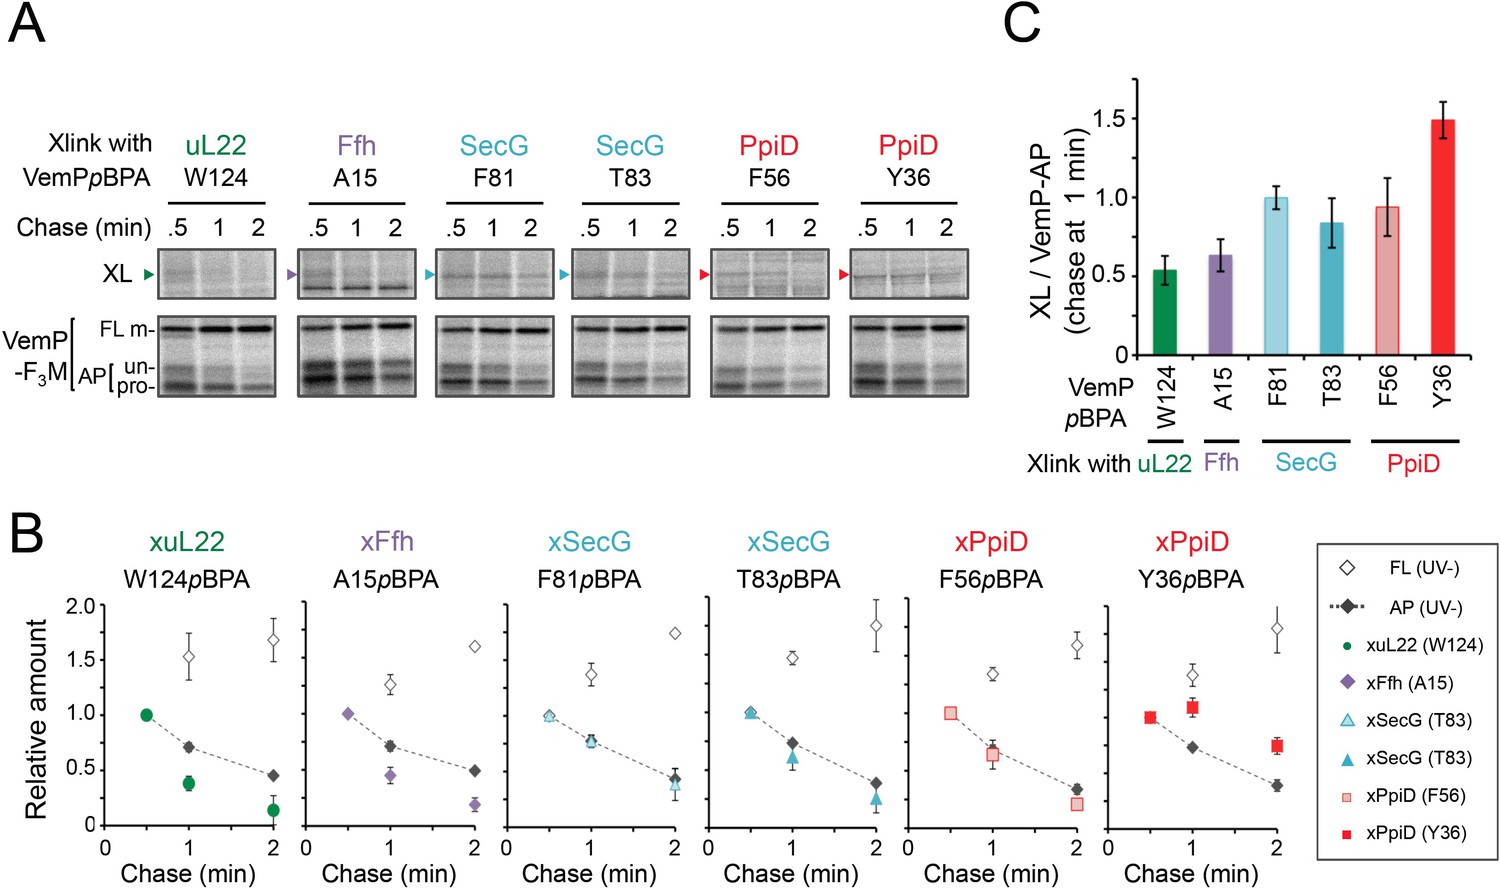
(A) PiXie analysis of VemP. Cells were grown, induced to express a VemP derivative with pBPA, pulse-labeled and chased as in Figure 1. At the indicated time points in the chase period, cells were UV-irradiated for 1 s and then acid-treated. Labeled proteins were subjected to IP with an anti-VemP antibody or pull-down with Ni-NTA agarose. The same strains were parallelly pulse-labeled, chased, and subjected to IP with the anti-VemP antibody without the UV irradiation. Isolated proteins were analyzed as in Figure 1. Portions of the gel images showing the XLs (upper gels) or showing the VemP-derived bands of the UV-unirradiated samples (lower gels) are presented. Full images of the gels for all the results are presented in Figure 2—figure supplement 1B. The result shown is a representative of three biological replicates. (B) Relative amounts of the VemP arrested forms and the VemP-XLs. The band intensity of VemP-FL (open diamonds), VemP-APs (AP-un + AP-pro) (closed diamonds), and XLs (colored symbols) in A was quantitated and the mean values of the relative values (the value at the 0.5 min was set to 1) were plotted (error bars are S.D.; (n = 3)). The detail procedure for quantification of immunoprecipitated bands in a representative result is presented in Figure 2—figure supplement 2. (C) Relative crosslinking efficiency of the arrested VemP. The values for the relative intensities of XLs at 1 min to the corresponding average intensities of VemP-APs were calculated from the results in B. The mean values are shown with S.D. (n = 3 biological replicates). See Figure 2—source data 1 for gel images and quantitated band intensities data for A–C.
-
Figure 2—source data 1
Zip file containing gel images and quantified band intensity data for the PiXie experiments.
- https://cdn.elifesciences.org/articles/62623/elife-62623-fig2-data1-v3.zip
Figure 2—figure supplement 1
PiXie analysis of VemP interactions.
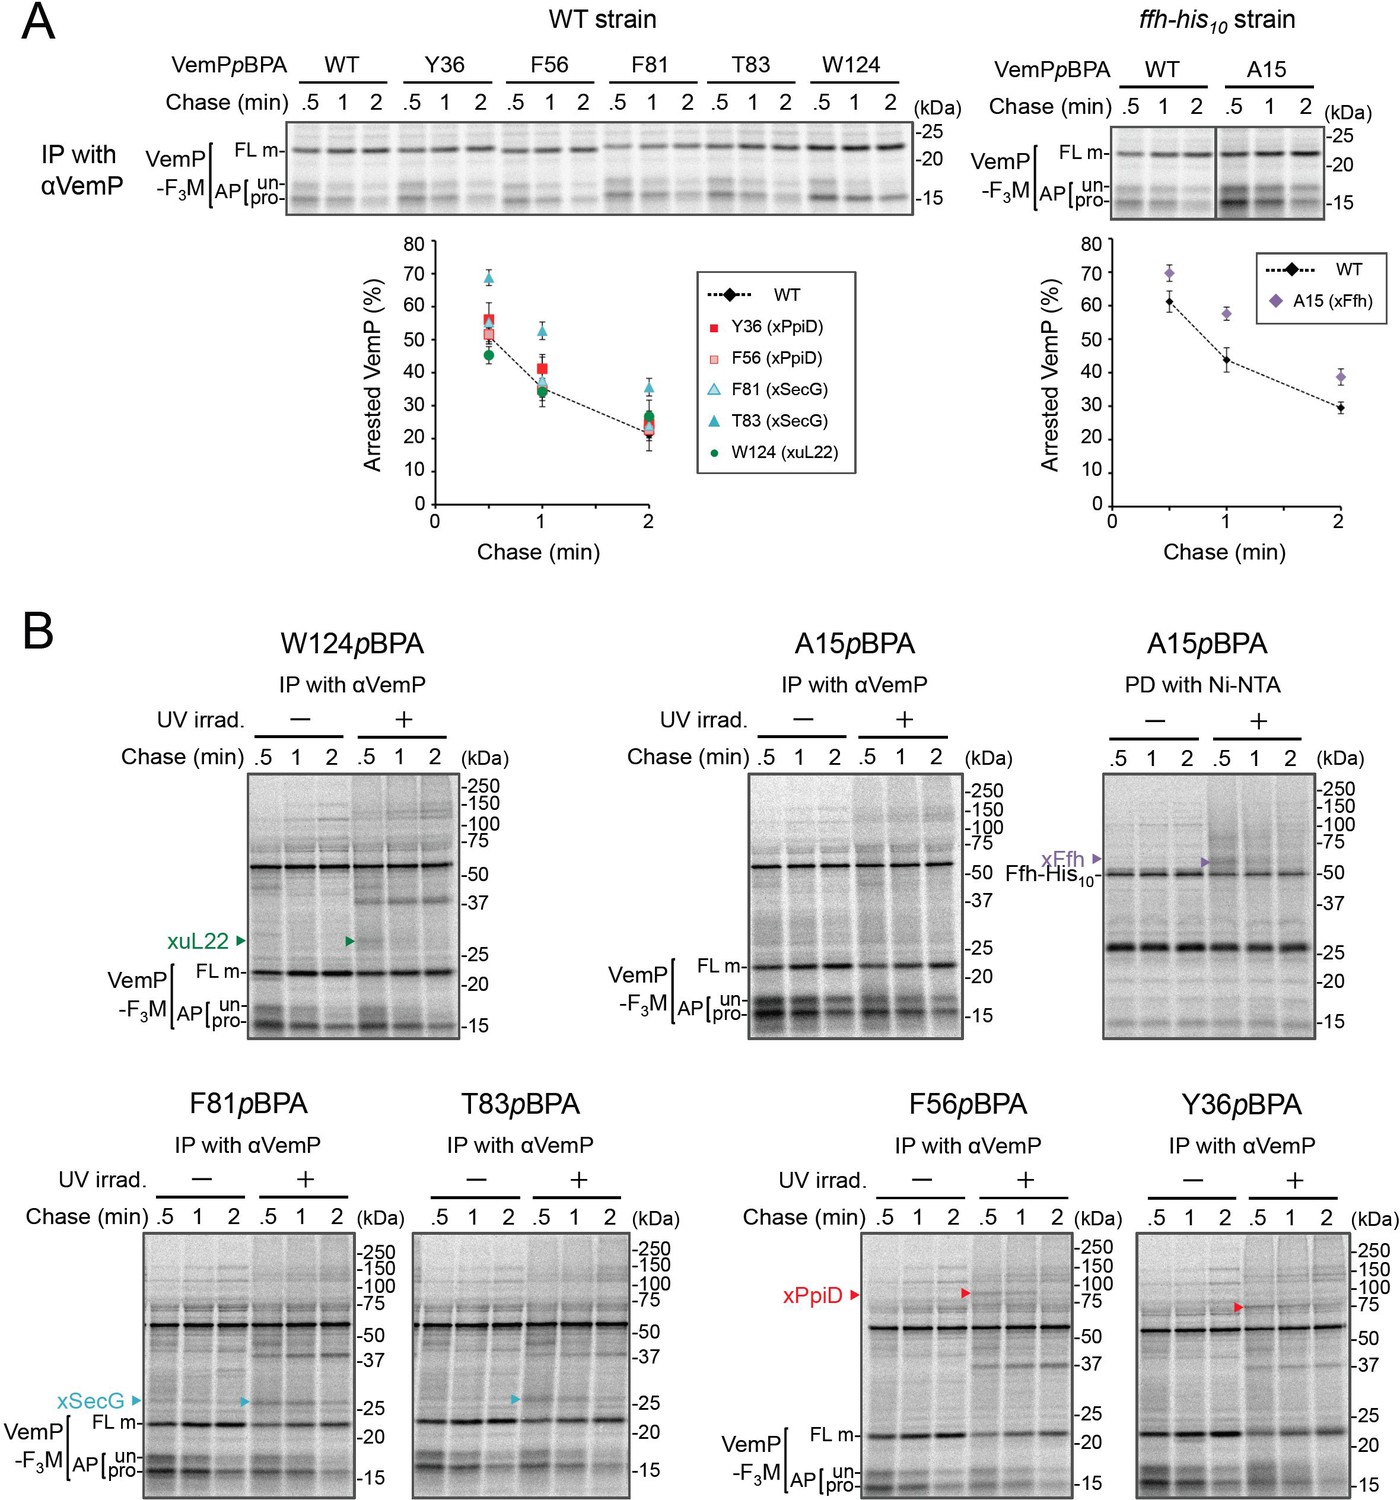
(A) Stability of the arrested form of the VemPpBPA derivatives. Cells were grown, induced to express a VemP-F3M derivative with pBPA at the indicated position (WT indicates the protein with no pBPA), pulse-labeled and chased as described in Figure 4A. Labeled proteins were subjected to IP with anti-VemP antibodies and analyzed as in Figure 1. Arrested VemP (%) was calculated as in Figure 4A. The mean values of arrested VemP (%) are shown with S.D. (n ≥ 3 technical replicates). (B) Full images of the gels for all the PiXie analyses described in Figure 2A are presented. The result shown is a representative of three biological replicates. See Figure 2—figure supplement 1—source data 1 for gel images and quantitated band intensities data for A.
-
Figure 2—figure supplement 1—source data 1
Zip file containing gel images and quantified band intensity data for the pulse-chase experiments.
- https://cdn.elifesciences.org/articles/62623/elife-62623-fig2-figsupp1-data1-v3.zip
Figure 2—figure supplement 2
The procedure of the quantification of immunoprecipitated bands.
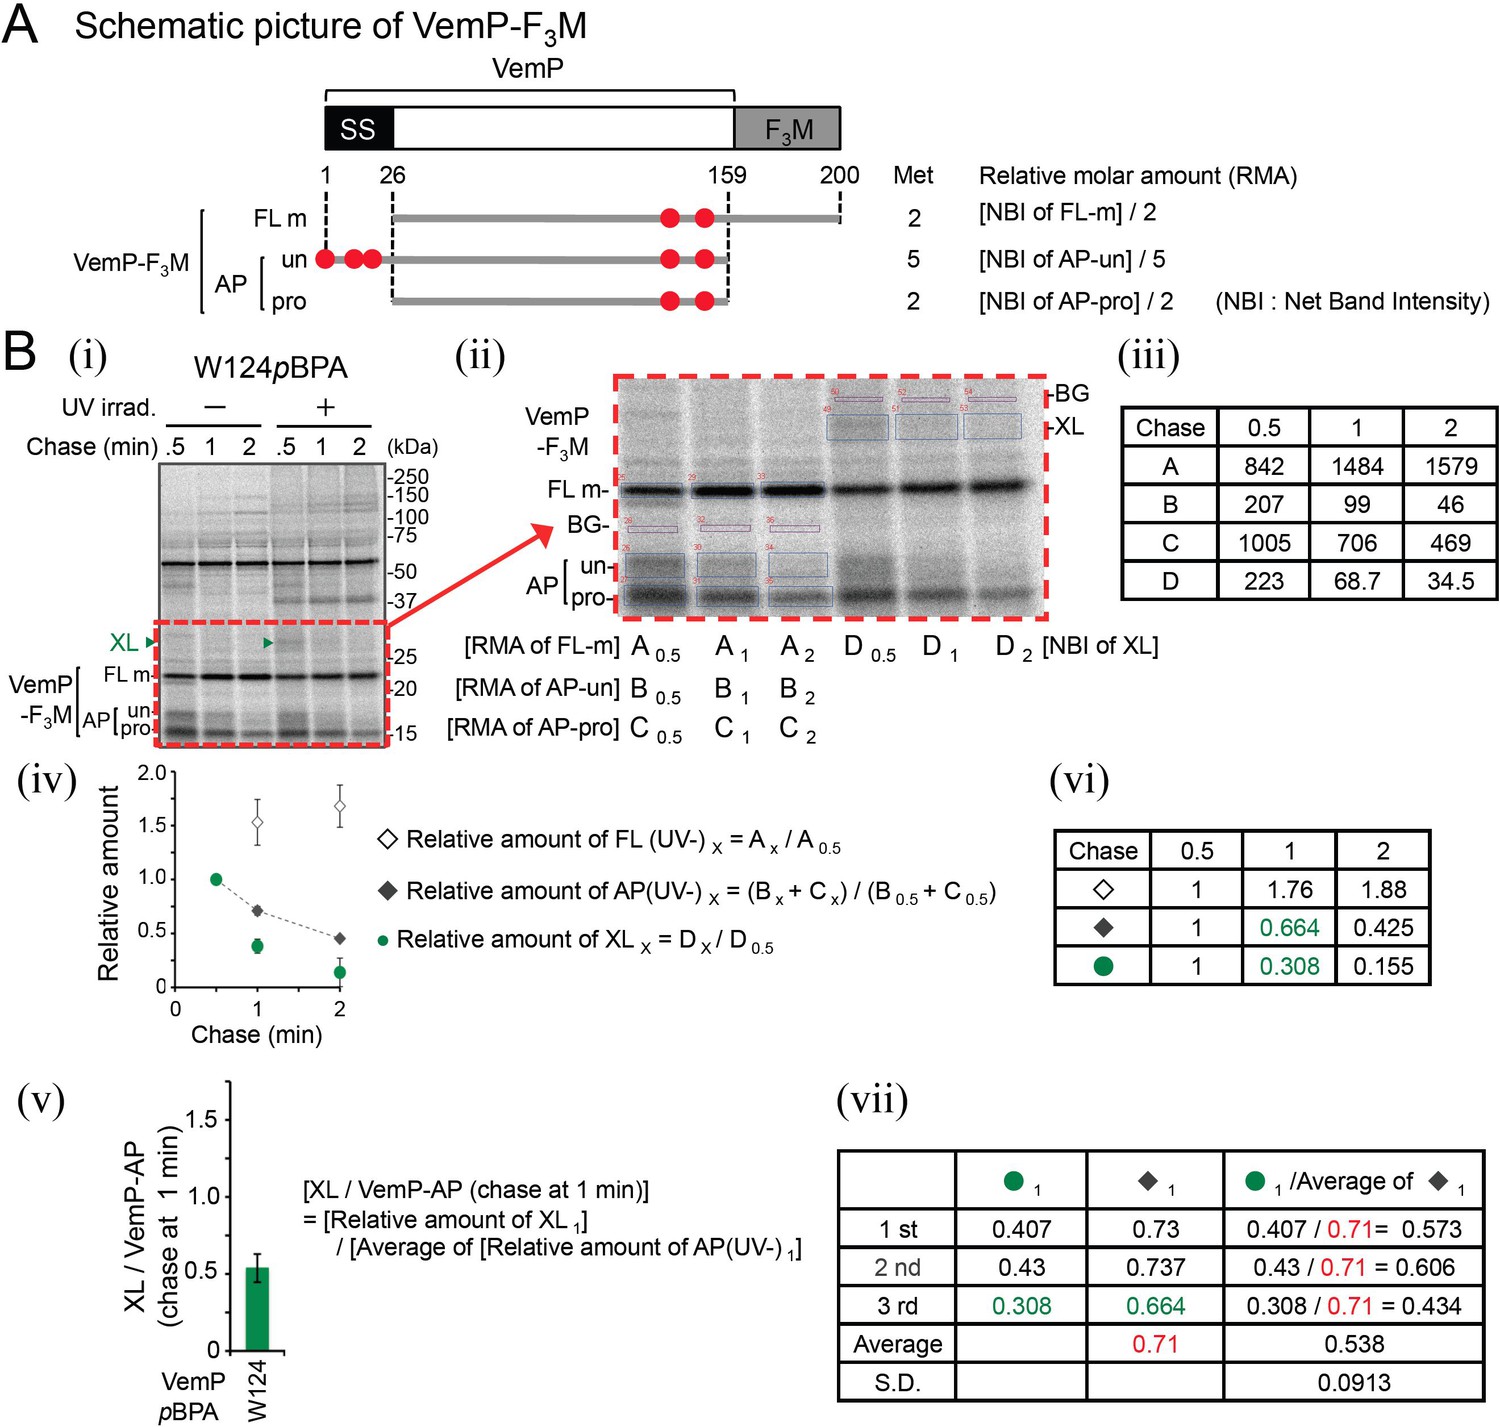
(A) A schematic picture of VemP-F3M. The regions corresponding to three VemP-F3M-derived species (FL-m, AP-un and AP-pro) observed during PiXie analysis are indicated below by gray bars. The precursor form of VemP-F3M has 3 and 2 Met residues (shown as red circles) in its signal sequence and mature region, respectively. Relative molar amounts (RMA) of these species were calculated from the signal intensities of the corresponding bands according to the formulas shown on the right (see below). (B) An example of quantification of XLs. The result of the PiXie analysis using VemP(W124pBPA) shown in Figure 2—figure supplement 1 is used as an example. The right gel image (ii) is a close-up view of the region surrounded by a dashed red line in the left gel (i). The intensities of the bands annotated as FL-m, AP-un, AP-pro and XLs as a background (BG), the intensity of an upper part of the AP-un band (for the VemP-derivative) or an upper part of the XL band (for the XL bands) were quantitated. The BG intensities were corrected based on the measurement areas, and subtracted from the intensities of the VemP-related bands (FL-m, AP-un, AP-pro and XLs). The intensity after subtraction of the BG intensity is here defined as the net band intensity (NBI). The values of the RMAs of the VemP-related bands at each chase time point shown in the upper table (iii). Each value in the two graphs ((iv) and (v), a part of Figure 2B and C, respectively) was calculated according to the formulae shown at the right side of these graphs. The values calculated from the third experimental data and all the data (n = 3) (See the Source data) are also presented in the table (vi) and (vii), respectively. In each of the three PiXie experiments, cells were grown, divided into two portions and separately induced. Then, one was subjected to the PiXie analysis of the XL, and the other was used for the pulse-chase analysis of the VemP-derivatives without UV-irradiation. We should thus deal with these two analyses as independent experiments. Therefore, to calculate the values for [XL/VemP-AP (chase at 1 min)], we used the average of the relative amounts of VemP-AP (UV-)1 from the three experiments.
Figure 2—figure supplement 3
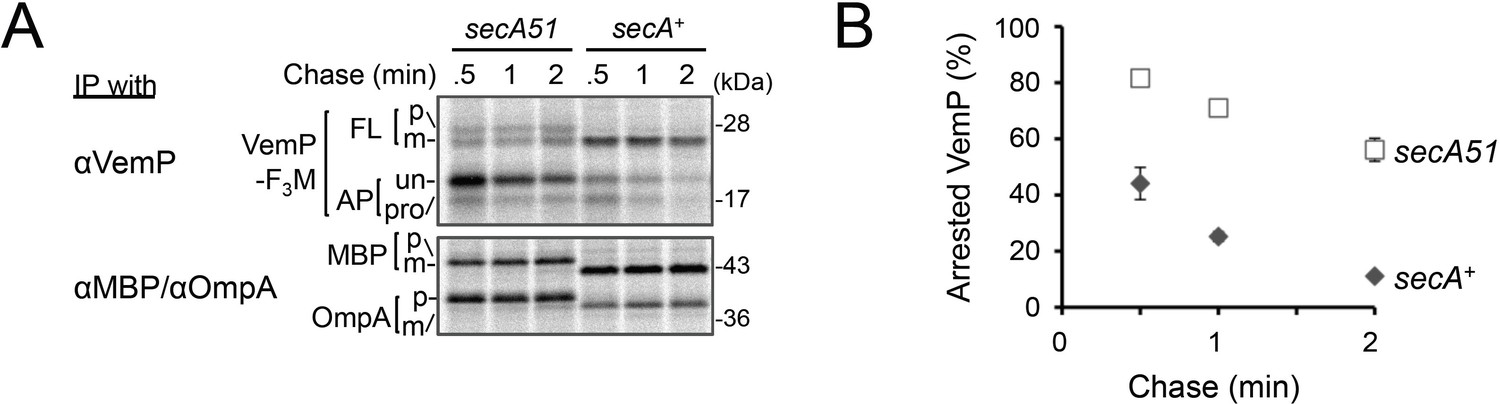
Effects of the secA51 mutation on the stability of the arrested VemP.
(A) secA+ cells or secA51 cells carrying the vemP-3xflag-myc plasmid were grown at 30 °C until early log phase. At 2 hr after the temperature shift to 42°C, cells were induced, pulse-labeled and chased as in Figure 4. At the indicated chase time points, total cellular proteins were acid-precipitated and subjected to IP with the indicated antibodies and analyzed as in Figure 1. (B) The mean values of arrested VemP (%) are plotted with S.D. (n = 2 biological replicates). See Figure 2—figure supplement 3—source data 1 for gel images and quantitated band intensities data.
-
Figure 2—figure supplement 3—source data 1
Zip file containing gel images and quantified band intensity data for the pulse-chase experiments.
- https://cdn.elifesciences.org/articles/62623/elife-62623-fig2-figsupp3-data1-v3.zip
Figure 2—figure supplement 4
Effects of NaN3 treatment on VemP crosslinking.
(A) Wild type cells (upper gel) and mutant cells expressing Ffh-His10 (middle gel), and SecY-His10 (lower gel) from the chromosome were used. The cells were grown, induced to express a VemP-F3M derivatives with pBPA at the indicated position, and analyzed by PiXie as in Figure 1. NaN3 (+) indicates that the cells received 0.02% NaN3 and [35S]Met simultaneously. Labeled proteins were subjected to IP with an anti-VemP antibody (left) or pull-down with Ni-NTA agarose (right) and analyzed as in Figure 1. Asterisks presumably represent crosslinked dimer forms of full-length VemP-F3M. (B) The intensity of these crosslinking bands was quantitated and the relative mean values (the value without NaN3 treatment was set to 1) are plotted with S.D. (n = 3 technical replicates). See Figure 2—figure supplement 4—source data 1 for gel images and quantitated band intensities data.
-
Figure 2—figure supplement 4—source data 1
Zip file containing gel images and quantified band intensity data for the PiXie experiments.
- https://cdn.elifesciences.org/articles/62623/elife-62623-fig2-figsupp4-data1-v3.zip
Figure 3 with 1 supplement
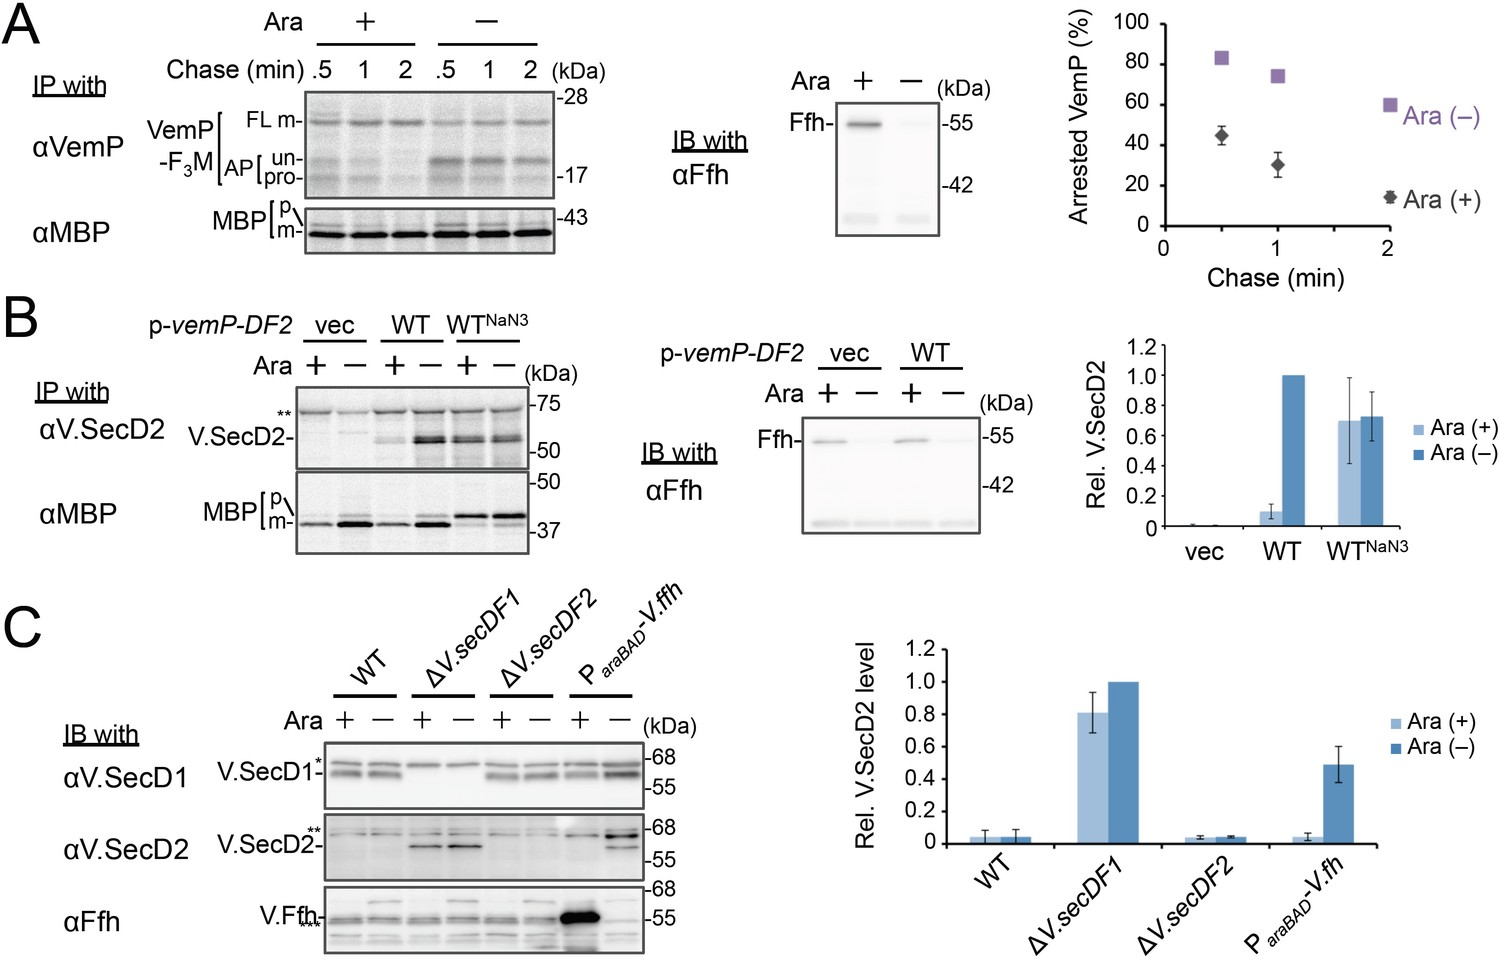
Ffh (SRP) functions in the targeting of VemP.
(A) Effects of Ffh-depletion on stability of the arrested-VemP. (left) Ffh-depletable cells carrying a vemP-f3m plasmid were grown in the M9 medium with (+) or without (–) 0.05% arabinose, induced, pulse-labeled and chased as in Figure 1. At the indicated chase time points, total cellular proteins were acid-precipitated, subjected to IP and analyzed as in Figure 1. (middle) In parallel, a portion of the cultures just before pulse-labeling was subjected to immunoblotting (IB) analysis with an anti-Ffh antibody. (right) Percentages of the arrested VemP in left were calculated by the equation described in Materials and methods. Values are means ± S.D. (n = 3 technical replicates). (B) Effects of Ffh-depletion on the expression of V.secD2. (left) The Ffh-depletable cells carrying an empty vector or a vemP-V.secD2/F2 plasmid (WT) were grown, induced, and pulse-labeled for 1 min. Total cellular proteins were acid-precipitated. For the WTNaN3 samples, the cells carrying the vemP-V.secD2/F2 plasmid were pretreated with 0.02% NaN3 for 5 min before pulse-labeling. Labeled proteins were subjected to IP, and analyzed as in Figure 1. (middle) In parallel, a portion of the cultures just before the pulse-labeling was subjected to IB with the anti-Ffh antibody. The intensity of the V.SecD2 band from each lane was quantitated. Values are means ± S.D. (n = 3 technical replicates) (the value for WT in the presence of arabinose was set to 1). (C) Effects of Ffh-depletion on the expression of V.secD2 in a Vibrio cell. (left) The Vibrio cells indicated were grown at 30°C in VC-medium with (+) or without (–) 0.2% arabinose for 3 hr. Total cellular proteins were acid-precipitated, and analyzed by IB. (right) The intensity of the V.SecD2 band from each lane was quantitated. Values are means ± S.D. (n = 3 technical replicates) (the value for the ΔV.secD1/F1 cells in the presence of arabinose was set to 1). The asterisks (*, **, ***) in B and, C represent un-related proteins recognized by the indicated antibodies. See Figure 3—source data 1 for gel images and quantitated band intensities data for A–C.
-
Figure 3—source data 1
Zip file containing gel images.
(A–C) and quantified band intensity data for the pulse-chase experiments using the anti-VemP antibody (A), pulse-labeling experiments using the anti-SecD2 antibody (B) and immunoblotting with the anti-SecD2 antibody (C).
- https://cdn.elifesciences.org/articles/62623/elife-62623-fig3-data1-v3.zip
Figure 3—figure supplement 1
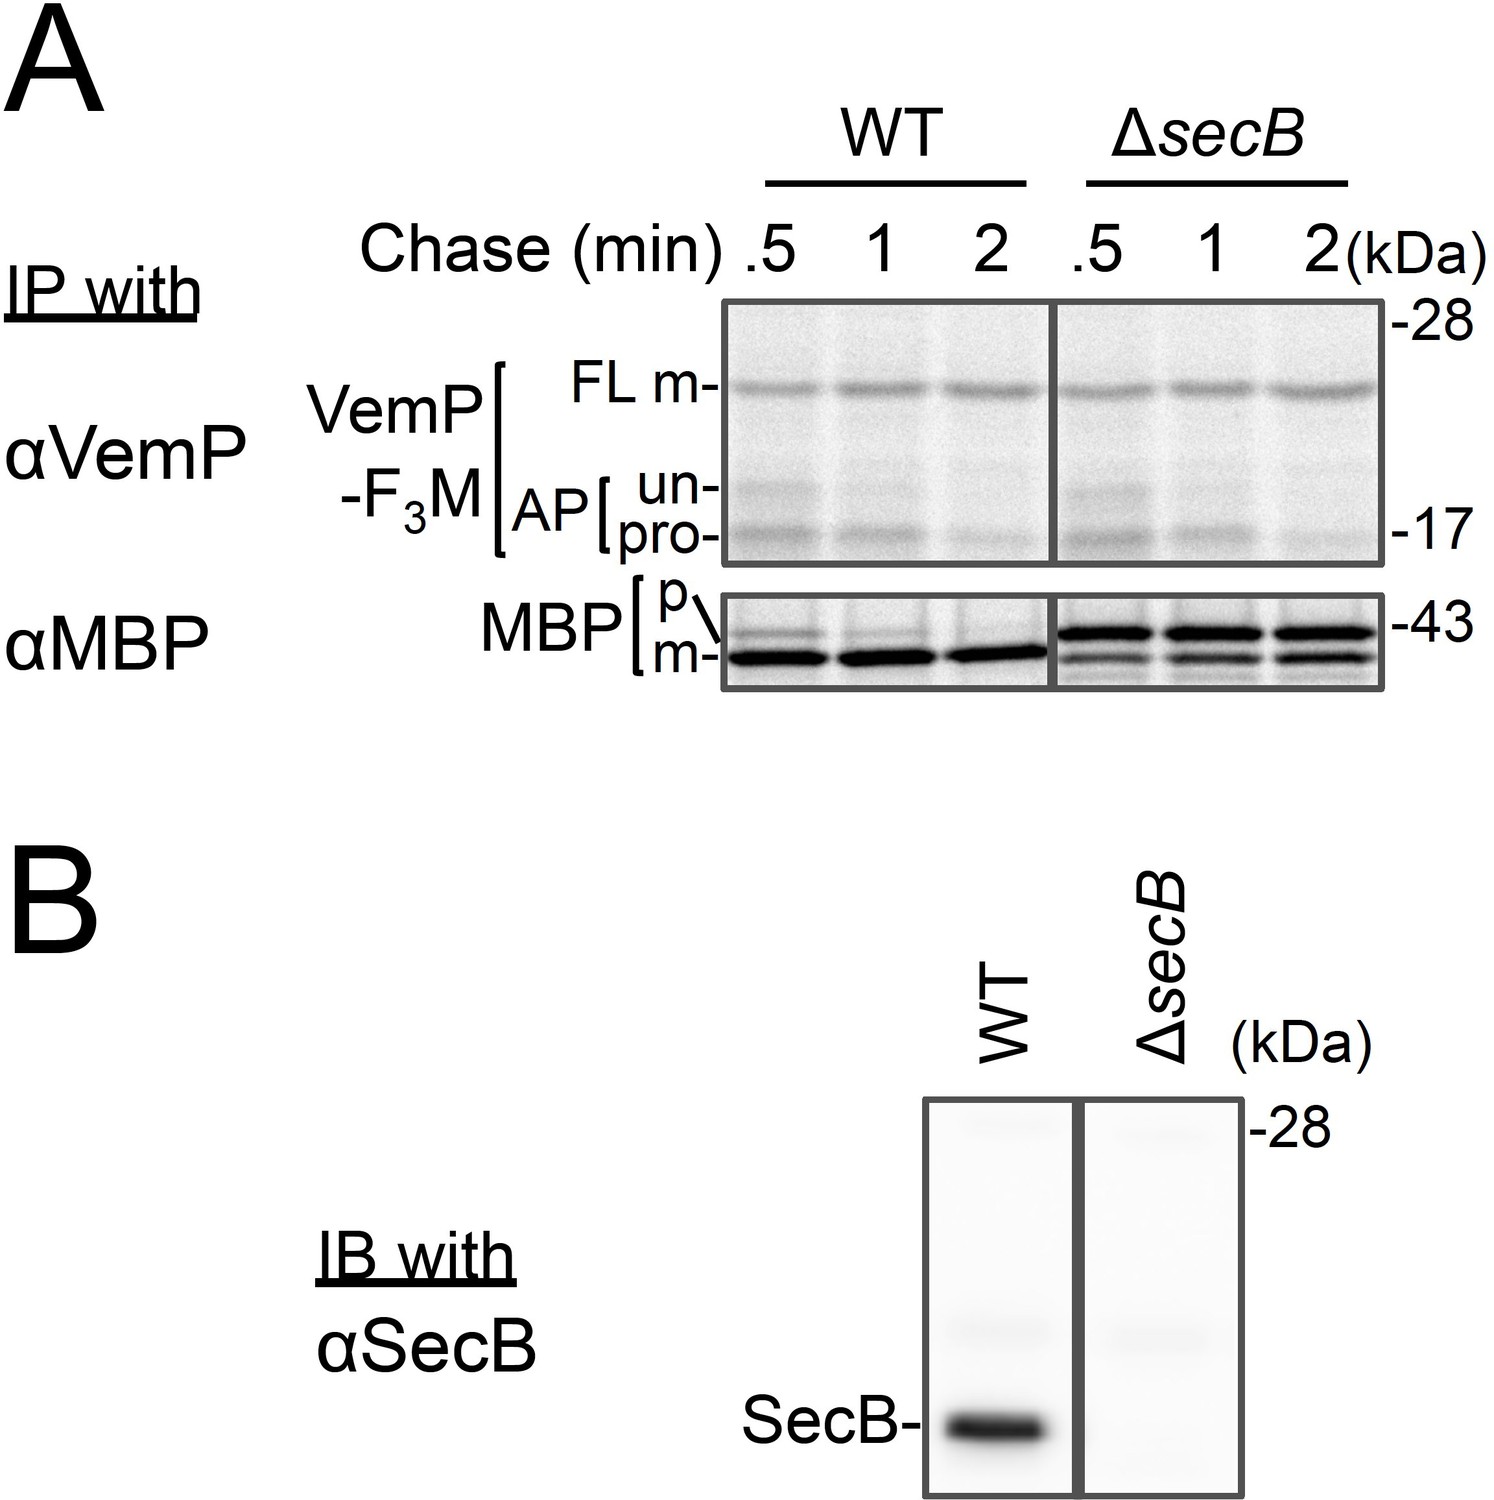
Effects of a secB-deletion on the stability of the arrested VemP.
(A) WT cells or ΔsecB cells carrying a vemP-3xflag-myc plasmid were grown at 30°C until early log phase, induced, pulse-labeled, and chased as in Figure 4. At the indicated chase time points, total cellular proteins were acid-precipitated and subjected to IP with the indicated antibodies and analyzed as in Figure 1. The result shown is a representative of two biological replicates. (B) Separately, the cells were acid-precipitated at the time just before the pulse-labeling. After SDS-solubilization, proteins were subjected to immunoblotting with an anti-SecB antibody.
Figure 4
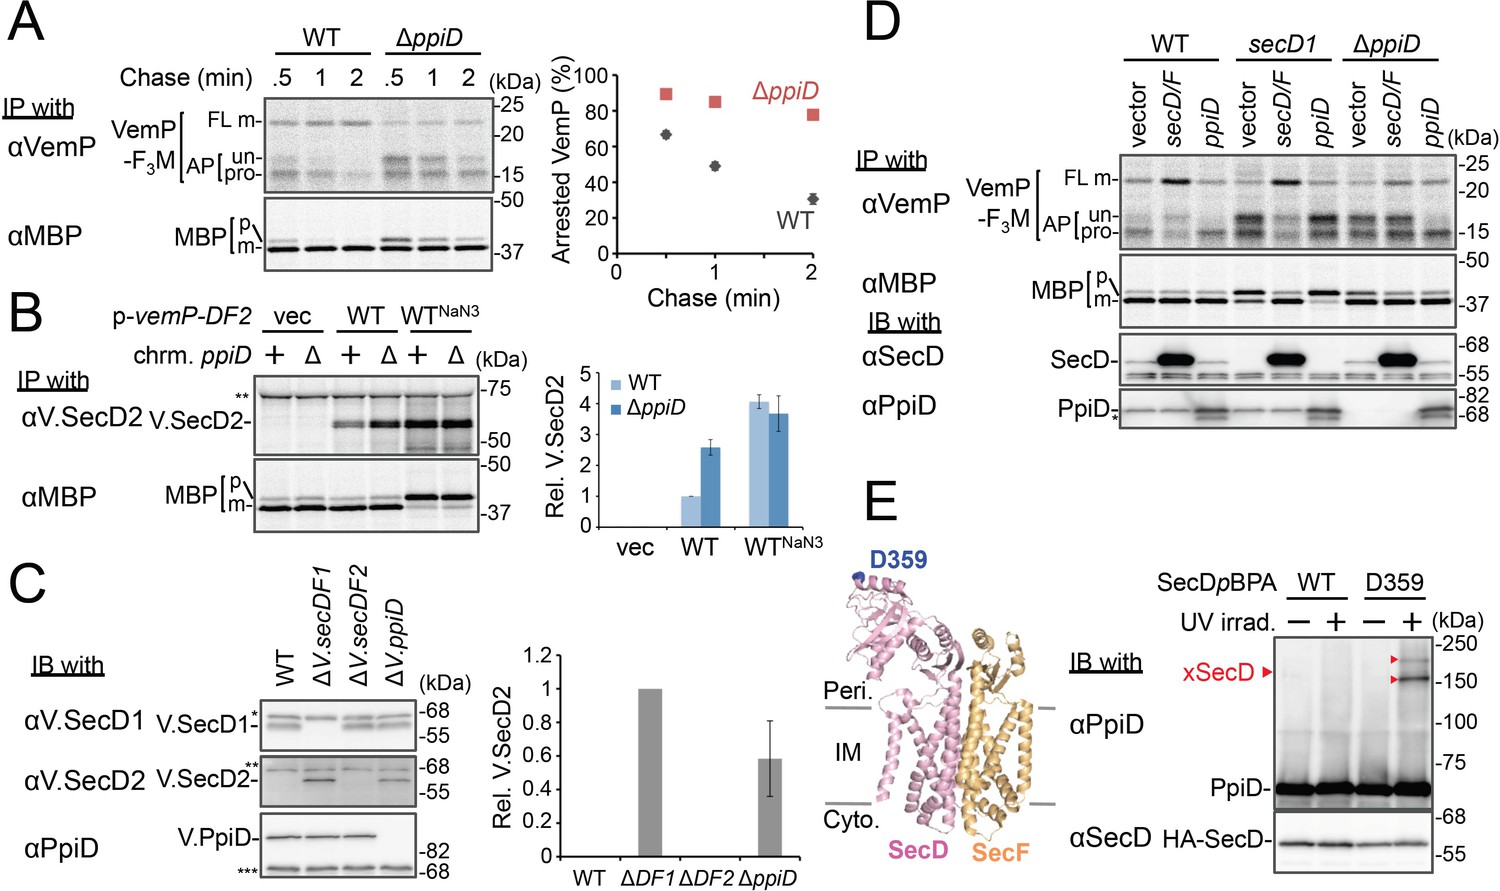
PpiD and SecD/F cooperate to facilitate the translocation and the arrest cancelation of VemP.
(A) Effects of the ppiD disruption on the stability of the arrested-VemP. (left) WT cells or ΔppiD cells carrying the vemP-f3m plasmid were grown, induced, pulse-labeled, and chased as in Figure 1. At the indicated chase time points, total cellular proteins were acid-precipitated and subjected to IP and analyzed as in Figure 1. (right) The mean values of arrested VemP (%) are plotted with S.D. (n = 3 technical replicates). (B) Effects of the ppiD disruption on the expression of V.secD2. (left) WT cells or ΔppiD cells carrying either an empty vector or a vemP-V.secD2/F2 plasmid (WT) were grown, induced as in A and pulse-labeled for 1 min. For the WTNaN3 samples, the cells carrying the vemP-V.secD2/F2 plasmid were pretreated with 0.02% NaN3 for 5 min before pulse-labeling. Labeled proteins were subjected to IP and analyzed as in Figure 1. The intensities of the V.SecD2 bands were quantitated. Values are means ± S.D. (n = 3 technical replicates) (the value for the WT cells was set to 1). (C) Effects of the ppiD disruption on the expression of V.secD2 in Vibrio cells. (left) The indicated Vibrio cells were grown at 30°C in the VC-medium for 2 hr. Total cellular proteins were acid-precipitated and subjected to IB. (right) The intensities of the V.SecD2 bands were quantitated. Values are means ± S.D. (n = 3 technical replicates) (the value for the ΔV.secD1/F1 cells was set to 1). The asterisks (*, **, ***) in B and C represent un-related proteins recognized by the indicated antibodies. (D) Roles of SecD/F and PpiD in the arrest-release of VemP. A pRM83c-based plasmid carrying either his10-secD/F or ppiD, or the empty vector was introduced, in addition to pHM1021-vemP-f3m, into wild type cells and cells having either the secD1 or the ΔppiD mutation. These cells were grown at 37°C for 2.5 hr as in Figure 1. A half of the cell cultures were removed and acid-treated. Precipitated proteins were subjected to IB (lower two panels). The remaining cells were induced with 1 mM IPTG for 15 min, pulse-labeled for 30 s and chased for 30 s. Acid-precipitated proteins were subjected to IP and analyzed as in Figure 1 (upper two panels). The result shown is a representative of two technical replicates. The asterisk in the lowest gel represents a degradation product of PpiD. (E) In vivo photo-crosslinking of SecD with PpiD. Cells were grown in L medium containing 0.5 mM pBPA until early log phase at 37°C and induced with 0.02% arabinose for 1 hr to express the indicated SecD/F variants. The cultures were divided into two portions, each of which was treated with or without UV-irradiation for 10 min at 4°C. Total cellular proteins were acid-precipitated and subjected to IB. The result shown is a representative of two technical replicates. A crystal structure of SecD/F (PDB:3aqp; Tsukazaki et al., 2011) is shown in the left. See Figure 4—source data 1 for gel images and quantitated band intensities data for A–C.
-
Figure 4—source data 1
Zip file containing gel images.
(A–C) and quantified band intensity data for the pulse-chase experiments using the anti-VemP antibody (A), pulse-labeling experiments using the anti-SecD2 antibody (B) and immunoblotting with the anti-SecD2 antibody (C).
- https://cdn.elifesciences.org/articles/62623/elife-62623-fig4-data1-v3.zip
Figure 5 with 3 supplements

Conserved Arg-85 has a role in the regulation of secretion-coupling of the VemP arrest cancelation.
(A) Effects of Arg-85 mutations on the stability of the arrested VemP in vivo. Cells were grown, induced to express the indicated VemP-F3M derivatives, and used for the pulse-chase experiments as in Figure 4A. Labeled proteins were subjected to IP with an anti-VemP antibody and analyzed as in Figure 1. The result shown is a representative of three technical replicates. (B) Behavior of the VemP(R85W) mutant under Sec-deficient conditions. Cells defective in protein translocation (secY24/pSTV28-syd) expressing the indicated VemP-F3M derivatives were examined by the pulse-chase experiment as described in Figure 4A except that the export of MBP was also examined by IP with an anti-MBP antibody. The result shown is a representative of two technical replicates. (C) Effects of the R85W mutation on translocation of the VemP(F.S.) derivative that undergoes no translation arrest. WT cells or ΔppiD cells were grown, induced to express the indicated VemP(F.S.)-F3M derivatives, and used for the pulse-chase experiments as in Figure 4A. Labeled proteins were subjected to IP with an anti-VemP antibody and analyzed as in Figure 1. The result shown is a representative of three biological replicates.
Figure 5—figure supplement 1
The conserved Arg-85 residue is important for the stability of the arrested VemP in vivo.
(A) Stability of the arrested state of the VemPpBPA variants. A schematic picture of the VemP polypeptide in the arrested state is presented with residue numbers. Arrested VemP (%) was calculated from the results in Figure 1. The mean values of arrested VemP (%) are shown with S.D. (n = 2 technical replicates). (B) Effects of Trp mutations on the VemP translation arrest. Cells were grown, induced to express the indicated VemP-F3M derivative, and pulse-labeled as in Figure 1. After 30 s of chase, total cellular proteins were acid-precipitated, subjected to IP with an anti-VemP antibody and analyzed as in Figure 1. Arrested VemP (%) was calculated and the mean values are shown with S.D. (n = 2 technical replicates). (C) WT cells carrying an empty vector or a vemP-V.secD2/F2 plasmid (the indicated mutation was introduced into the vemP gene on the plasmids), were grown and induced as in Figure 1 and pulse-labeled for 1 min. Labeled proteins were then subjected to IP with an anti-V.SecD2 antibody and analyzed as in Figure 1. Double asterisks indicate an un-related protein precipitated with the anti-V.SecD2 antibody. The intensity of V.SecD2 band was quantitated and the relative mean values (the value for WT cells carrying p-vemP-V.secD2/F2 was set to 1) are shown with S.D. (n = 3 technical replicates). (D) Effect of an Arg85 mutation on the translation arrest of a VemP variant lacking its signal sequence. Cells of HM1742 carrying a plasmid, pTV118N-his10-vemP(Δsignal sequence)−3xflag-myc, into which the indicated mutation had been introduced, were grown, induced with 1 mM IPTG for 60 min, and acid-precipitated. Proteins were analyzed by immunoblotting using the anti-VemP antibody. See Figure 5—figure supplement 1—source data 1 for gel images and quantitated band intensities data for A-C.
-
Figure 5—figure supplement 1—source data 1
Zip file containing gel images and quantified band intensity data for the pulse-labeling experiments.
- https://cdn.elifesciences.org/articles/62623/elife-62623-fig5-figsupp1-data1-v3.zip
Figure 5—figure supplement 2
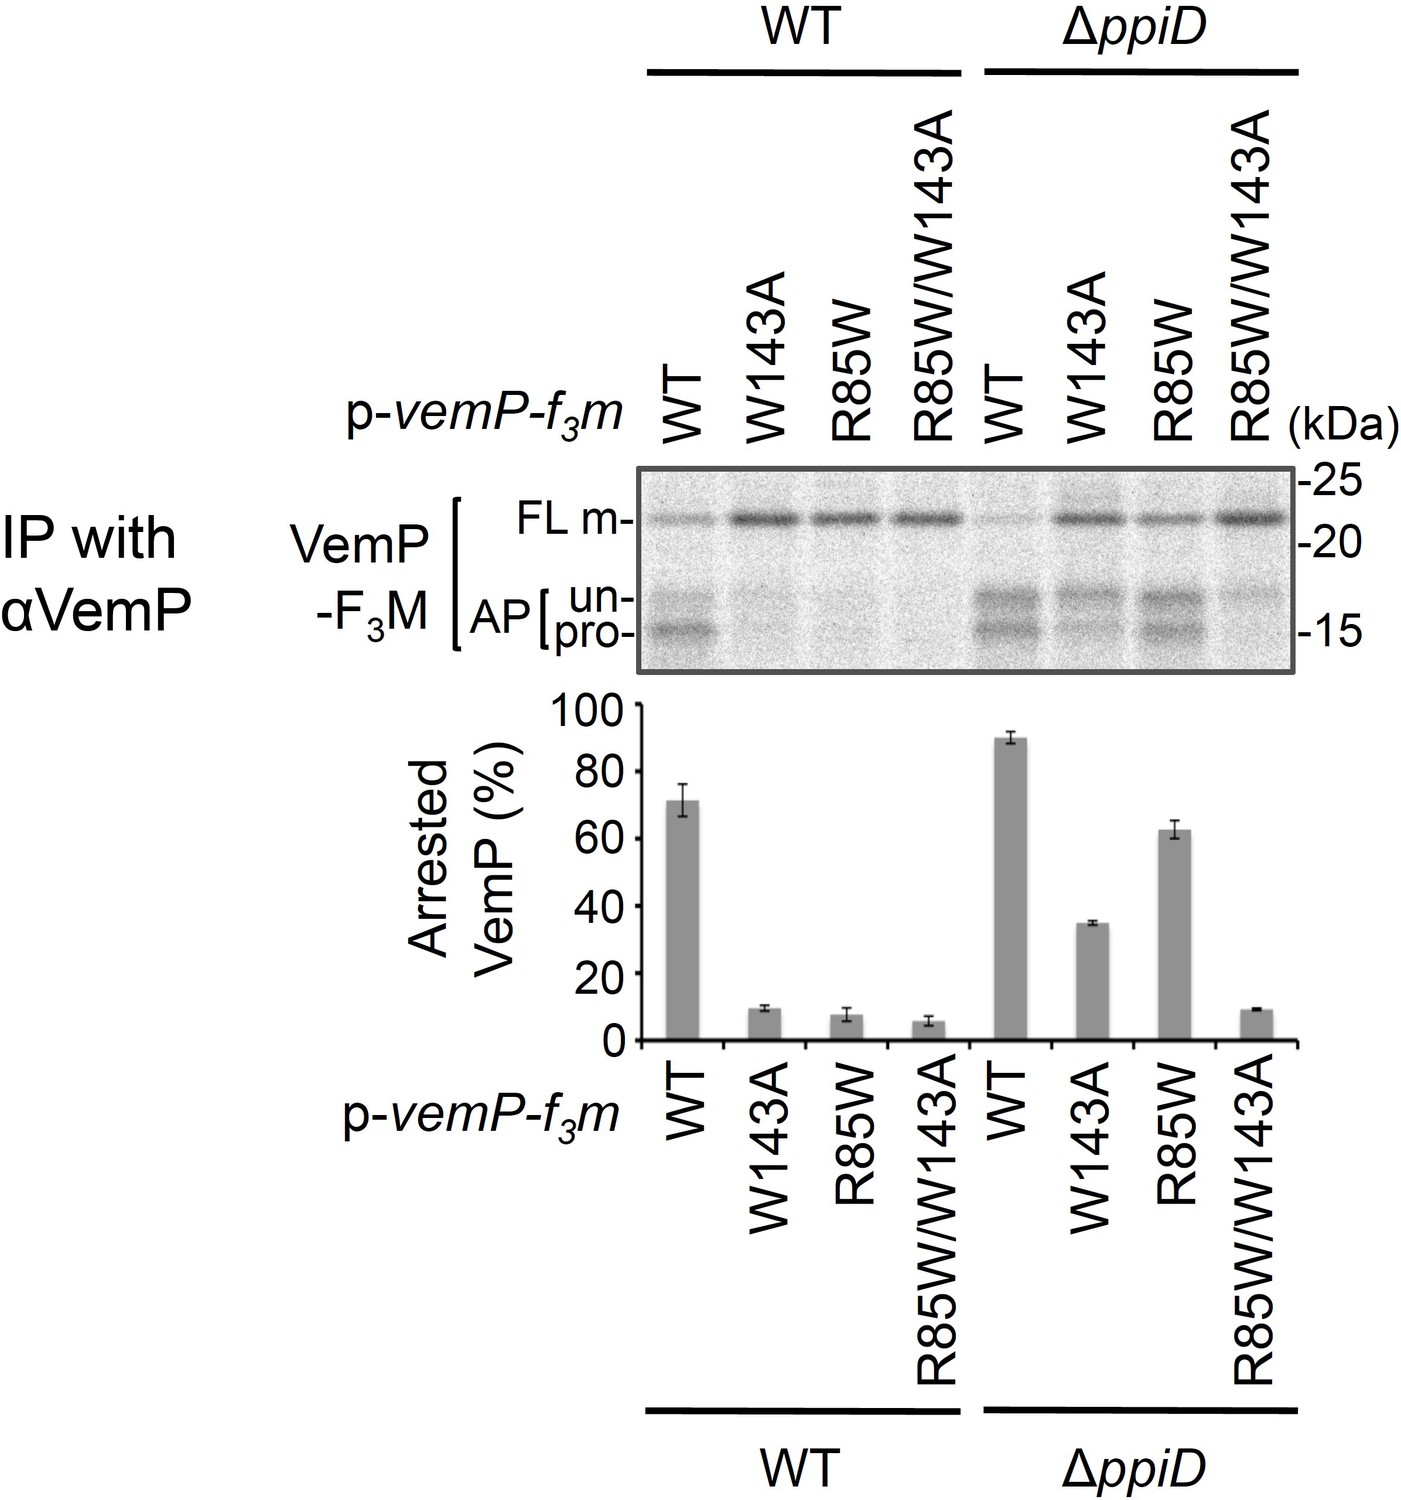
Effects of a ppiD deletion on translocation and arrest cancelation of the VemP variant Cells were grown, induced to express the indicated VemP-F3M derivative, and pulse-labeled as in Figure 4.
After 30 s of chase, total cellular proteins were acid-precipitated, subjected to IP with the anti-VemP antibody and analyzed as in Figure 1. Arrested VemP (%) was calculated and the mean values are shown with S.D. (n = 2 technical replicates). See Figure 5—figure supplement 2—source data 1 for gel images and quantitated band intensities data.
-
Figure 5—figure supplement 2—source data 1
Zip file containing gel images and quantified band intensity data for the pulse- labeling experiments.
- https://cdn.elifesciences.org/articles/62623/elife-62623-fig5-figsupp2-data1-v3.zip
Figure 5—figure supplement 3
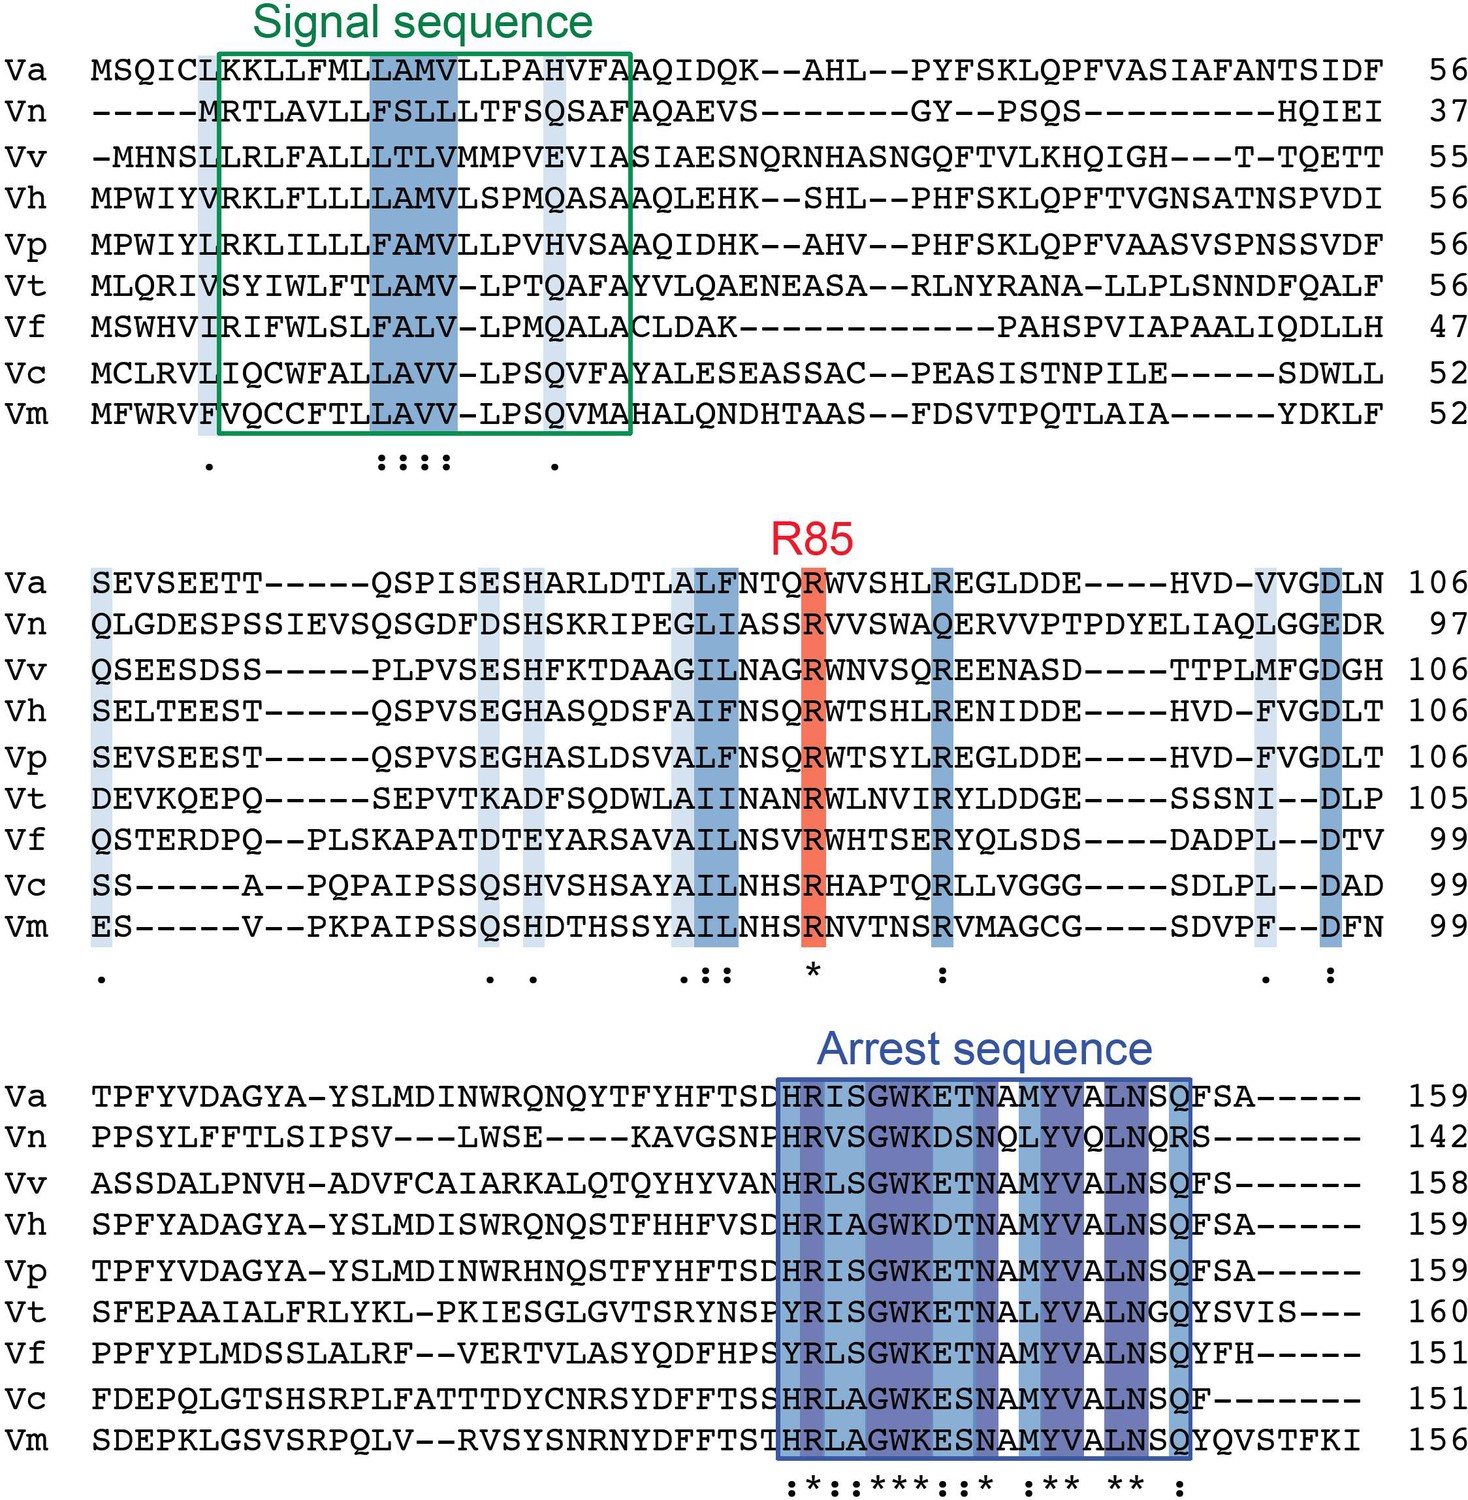
Sequence alignment of VemP orthologues.
Amino acids sequence of VemP orthologues were aligned using Clustal omega program (https://www.ebi.ac.uk/Tools/msa/clustalo/); Vibrio alginolyticus (Va), Vibrio nigripulchritudo (Vn), Vibrio vulnificus (Vv), Vibrio harveyi (Vh), Vibrio parahaemolyticus (Vp), Vibrio tubiashii (Vt), Vibrio furnissii (Vf), Vibrio cholerae (Vc), Vibrio mimicus (Vm). Well-conserved residues, completely conserved residues and the Arg-85 residue are colored in pale blue, blue, and red, respectively. The signal sequence and the arrest motif of VemP are boxed with green and blue lines, respectively.
Figure 6

A model of the arrest-cancelation of a VemP nascent polypeptide.
(A) Schematic interaction maps of VemP during its translocation processes. The positions of the crosslinking with other factors and Arg-85 are mapped on the schematic picture of the arrested VemP-ribosome complex (left). Hypothetical models of the nascent VemP-ribosome complex on the Sec machinery (right). See the text for details. (B) An overview of the translocation processes of the arrested VemP including the arrest-cancelation steps. See the text for details.
Tables
Key resources table
| Reagent type (species) or resource | Designation | Source or reference | Identifiers | Additional information |
|---|---|---|---|---|
| Strain (E. coli) | MC4100 | This paper | Supplementary file 1 | |
| Strain (V. alginolyticus) | 138–2 | This paper | Supplementary file 1 | |
| Strain (P1 bacteriophage) | Laboratory stock | CGSC12133 | ||
| Recombinant DNA reagent | Plasmids | This paper | Supplementary file 2 | |
| Sequence-based reagent | This paper | PCR primers | Supplementary file 3 | |
| Antibodies | 1st antibodies | This paper | listed in the below | |
| Antibody | Goat Anti-Rabbit IgG (H + L)-HRP Conjugate | Bio-Rad Laboratories | 1706515 | |
| Chemical compound | H-p-Bz-Phe-OH | Bachem | F2800 | |
| Chemical compound | Methionine, L-[35S] Translation Grade | American Radiolabeled Chemicals | ARS 01014 | |
| Chemical compound | ANTI-FLAG M2 Affinity Gel | Sigma-Aldrich | A2220 | |
| Chemical compound | nProtein A Sepharose4 Fast Flow | GE Healthcare | 17528004 | |
| Chemical compound | Ni-NTA Agarose | QIAGEN | 30250 | |
| Commercial kit | ECL Western Blotting Detection Reagents | GE Healthcare | RPN2106 | |
| Commercial kit | ECL Prime Western Blotting Detection Reagents | GE Healthcare | RPN2232 | |
| Software, Algorithm | Microsoft Excel | Microsoft | ||
| Software, Algorithm | Bio-imaging Analyzer BAS-1800, BAS-5000 | Fujifilm/GE Healthcare | ||
| Software, Algorithm | Image Qaunt LAS 4000 mini | Fujifilm/GE Healthcare | ||
| Software, Algorithm | Multi Gauge | Fujifilm/GE Healthcare |
Additional files
-
Supplementary file 1
Table S1.
Strains used in this study
- https://cdn.elifesciences.org/articles/62623/elife-62623-supp1-v3.docx
-
Supplementary file 2
Table S2.
Plasmids used in this study
- https://cdn.elifesciences.org/articles/62623/elife-62623-supp2-v3.docx
-
Supplementary file 3
Table S3.
Primers used in this study
- https://cdn.elifesciences.org/articles/62623/elife-62623-supp3-v3.docx
-
Transparent reporting form
- https://cdn.elifesciences.org/articles/62623/elife-62623-transrepform-v3.docx
Download links
A two-part list of links to download the article, or parts of the article, in various formats.
Downloads (link to download the article as PDF)
Open citations (links to open the citations from this article in various online reference manager services)
Cite this article (links to download the citations from this article in formats compatible with various reference manager tools)
Fine interaction profiling of VemP and mechanisms responsible for its translocation-coupled arrest-cancelation
eLife 9:e62623.
https://doi.org/10.7554/eLife.62623


