Two opposite voltage-dependent currents control the unusual early development pattern of embryonic Renshaw cell electrical activity
- INSERM, UMR_S 1130, CNRS, UMR 8246, Neuroscience Paris Seine, Institute of Biology Paris Seine, Sorbonne Univ, France
- Centre de Neurosciences Intégratives et Cognition, CNRS UMR 8002, Institut Neurosciences et Cognition, Université de Paris, France
- Univ Angers, France
- Univ. Bordeaux, CNRS, EPHE, INCIA, France
- Department of Computer Science and Centre for Complexity Science, University of Warwick, United Kingdom
- Department of Clinical and Experimental Epilepsy, UCL Queen Square Institute of Neurology, University College London, United Kingdom
- Institut du Cerveau et de la Moelle Epinière, Centre de Recherche CHU Pitié-Salpétrière, INSERM, U975, CNRS, UMR 7225, Sorbonne Univ, France
Figures
Figure 1
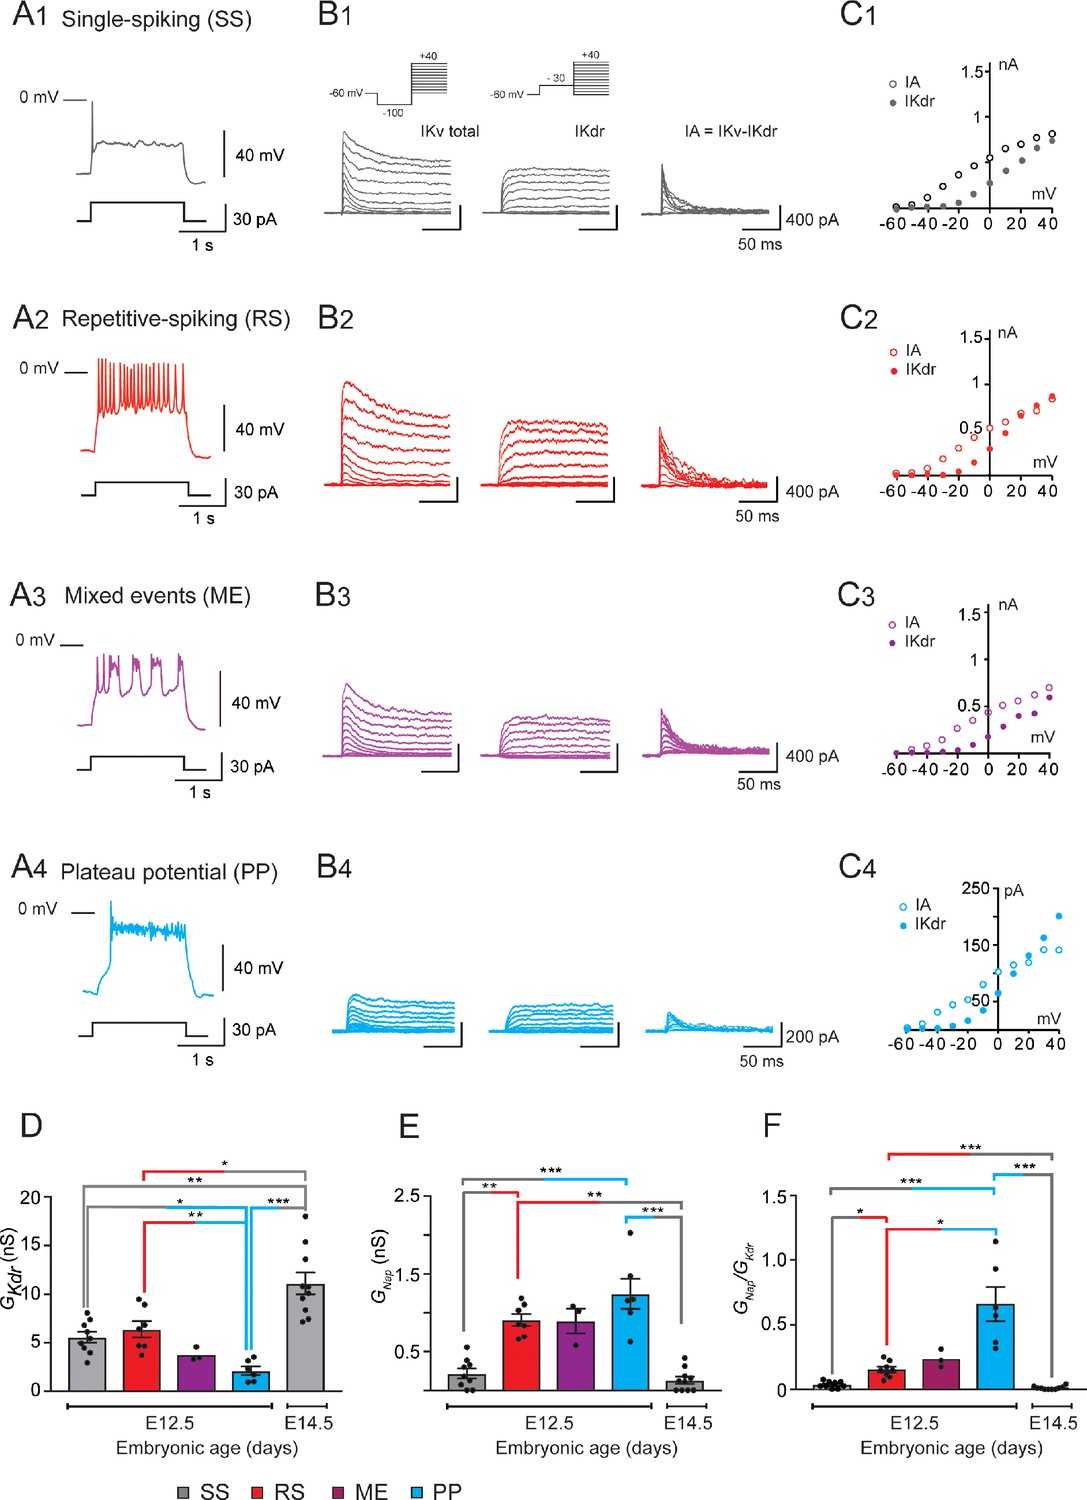
GKdr and GNap in embryonic V1R at E12.5 and E14.5.
(A) Representative traces of voltage responses showing single spiking (SS) activity in E12.5 SS V1R (A1), repetitive action potential firing in repetitive spiking (RS) V1R (A2), mixed plateau potential activity (PP) and repetitive action potential firing in mixed event (ME) V1R (A3), and PP activity in PP V1R (A4). (B) Representative examples of the total outward K+ currents (IKV total) obtained from = –100 mV (left traces), of ( = –30 mV, middle traces), and of isolated (left traces) recorded at E12.5 in SS V1R (B1), RS V1R (B2), ME V1R (B3), and PP V1R (B4). Voltage-dependent potassium currents were evoked in response to 10 mV membrane potential steps (200 ms) from –100 or from –30 mV to +40 mV (10 s interval between pulses). V1R were voltage clamped at = –60 mV. A prepulse of –40 mV (300 ms) was applied to activate both and . was isolated by applying a prepulse of -30 mV (300 ms) to inactivate (B1 inset). was isolated by subtracting step-by-step the currents obtained using a prepulse of -30 mV ( = –30 mV) from the currents obtained using a prepulse of –40 mV ( = –100 mV). (C) Current-voltage relationship ( curves) of (filled circles) and of (open circles) recorded in SS V1R (C1), RS V1R (C2), ME V1R (C3), and PP V1R (C4). curves were obtained from currents shown in (B1), (B2), (B3), and (B4). Note that curves are similar between SS V1R, RS V1R, ME V1R, and PP V1R. (D) Bar graph showing maximal value (Max ) in SS V1R at E12.5 (n = 9; N = 9; gray bar) and at E14.5 (n = 10; N = 10 gray bar), and in RS V1R (n = 7; N = 7; red bar), ME V1R (n = 3; N = 3 purple bar), and PP V1R at E12.5 (n = 7; N = 7 blue bar) was calculated from at = + 20 mV, assuming a K+ equilibrium potential of –96 mV. There is no significant difference in between SS V1R and RS V1R, while is significantly smaller in PP V1R as compared to SS V1R and RS V1R was significantly higher in SS V1R at E14.5 than in SS V1R, RS V1R, and PP V1R at E12.5 (Kruskal–Wallis test p<0.0001; SS V1R versus RS V1R at E12.5, p=0.5864; SS V1R versus PP V1R at E12.5, p=0.0243; RS V1R versus PP V1R at E12.5, p=0.0086; E14.5 SS V1R versus E12.5 SS V1R, p=0.0048; E14.5 SS V1R versus E12.5 RS V1R, p=0.0384, E14.5 SS V1R versus E12.5 PP V1R, p<0.0001). The increase in density between E12.5 and E14.5 is likely to be due to the increase in neuronal size (input capacitance; Figure 2A). Indeed, there was no significant difference (Mann–Whitney test, p=0.133) in between SS V1R at E12.5 (n = 9; N = 9 gray bar) and at E14.5 (n = 10; N = 10 gray bar). (E) Bar graph showing the maximal Max value () in SS V1R at E12.5 (n = 9; N = 9 gray bar) and E14.5 (n = 10; N = 10 gray bar), and in RS V1R (n = 8; N = 8 red bar), ME V1R (n = 3; N = 3 purple bar), and PP V1R (n = 6; N = 6 blue bar) at E12.5. Max was calculated from maximal value measured on current evoked by assuming a Na+ equilibrium potential of +60 mV. There was no difference in between RS V1R and PP V1R. On the contrary, measured in SS V1R at E12.5 or at E14.5 was significantly smaller as compared to measured at E12.5 in RS V1R or in PP V1R measured at E12.5 and E14.5 in SS V1R were not significantly different (Kruskal–Wallis test p<0.0001; E12.5 SS V1R versus E12.5 RS V1R, p=0.0034; E12.5 SS V1R versus E12.5 PP V1R, p=0.0006; E12.5 RS V1R versus E12.5 PP V1R, p=0.5494; E14.5 SS V1R versus E12.5 SS V1R, p=0.5896; E14.5 SS V1R versus E12.5 RS V1R, p=0.0005; E14.5 SS V1R versus E12.5 PP V1R, p<0.0001). (F) Histograms showing the / ratio in SS V1R at E12.5 (n = 9; gray bar) and E14.5 (n = 10; green bar) and in RS V1R (n = 8; red bar), ME V1R (n = 3; purple bar), and PP V1R (n = 6; blue bar) at E12.5. Note that the / ratio differs significantly between SS V1R, RS V1R, and PP V1R at E12.5, while it is not different between SS V1R recorded at E12.5 and at E14.5 (Kruskal–Wallis test p<0.0001; SS V1R versus RS V1R at E12.5, p=0.0367; SS V1R versus PP V1R at E12.5, p<0.0001; RS V1R versus PP V1R at E12.5, p=0.0159; E14.5 SS V1R versus E12.5 SS V1R, p=0.2319; E14.5 SS V1R versus E12.5 RS V1R, p=0.0017; E14.5 SS V1R versus E12.5 PP V1Rp<0.0001). Data shown in (A) and (B) were used to calculate / ratio shown in (C) (*p<0.05, **p<0.01, ***p<0.001).
Figure 2 with 2 supplements
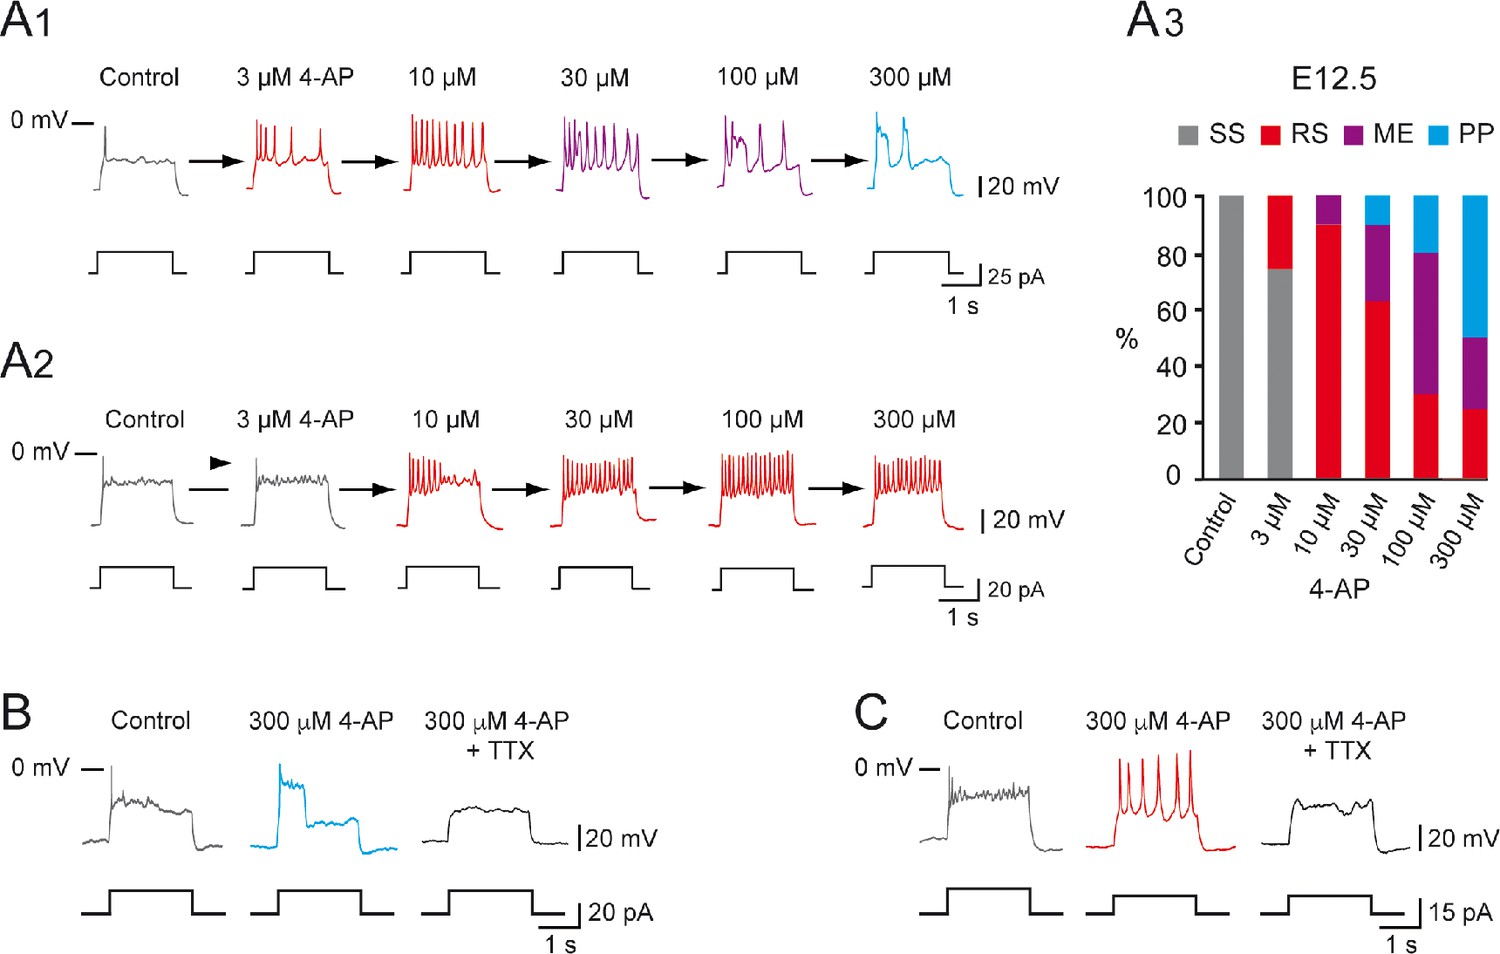
Increasing 4-aminopiridine (4-AP) concentration changed the firing pattern of single spiking (SS) embryonic V1R recorded at E12.5.
The firing pattern of embryonic V1R was evoked by 2 s suprathreshold depolarizing current steps. (A) Representative traces showing examples of the effect of increasing concentration of 4-AP (from 3 to 300 μM) on the firing pattern of a SS V1R recorded at E12.5. Note that in (A1) increasing 4-AP concentration converted SS (gray trace) to repetitive spiking (red trace), repetitive spiking to a mixed event pattern (purple trace), and mixed events to plateau potential (blue trace). (A2) Example of SS V1R in which increasing 4-AP concentration converted SS to repetitive spiking only. (A3) Bar plots showing the change in the firing pattern of SS V1R according to 4-AP concentrations (control n = 10; N = 10, 3 μM 4-AP n = 8; N = 8, 10 μM 4-AP n = 10; N = 10, 30 μM 4-AP n = 10; N = 10, 100 μM 4-AP n = 10; N = 10, 300 μM 4-AP n = 8; N = 8). (B) Representative traces showing the effect of 0.5 μM tetrodotoxin (TTX) on a plateau potential evoked in a SS V1R in the presence of 300 μM 4-AP. (C) Representative traces showing the effect of 0.5 μM TTX on repetitive action potential firing evoked in a SS V1R in the presence of 300 μM 4-AP. In both cases, the application of TTX fully blocked the responses evoked in the presence of 4-AP, indicating that they were underlain by the activation of voltage-gated Na+ channels.
Figure 2—figure supplement 1
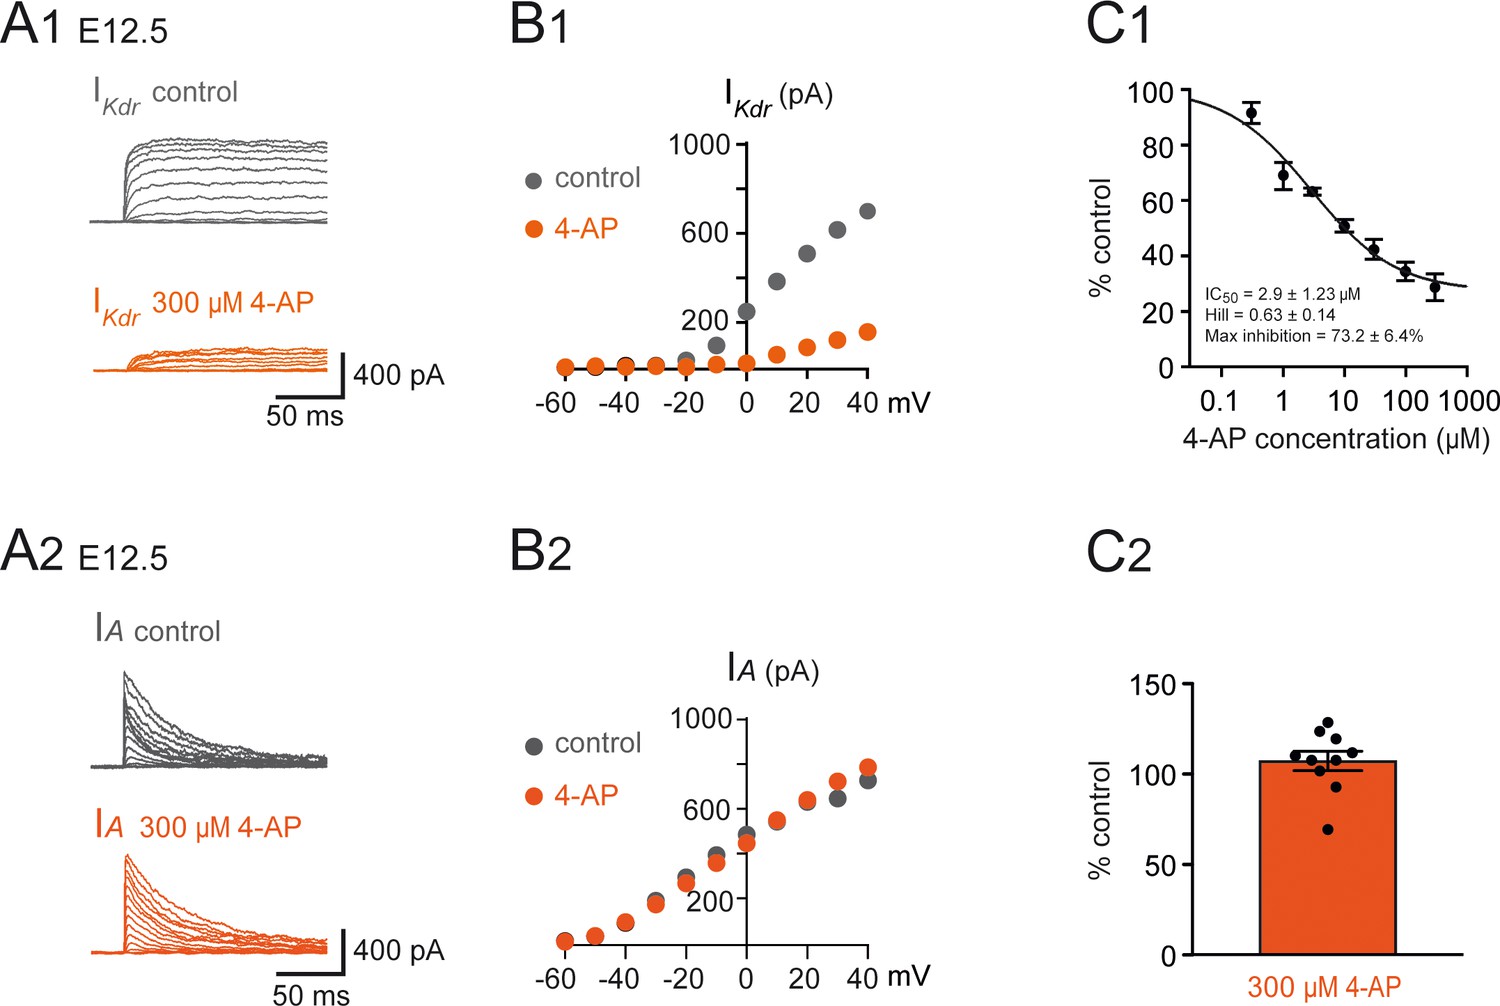
Effect of 4-aminopiridine (4-AP) on and in embryonic V1R.
(A1) Example of voltage-dependent potassium currents evoked in response to 10 mV membrane potential steps (200 ms) from –100 mV or from –30 mV to +40 mV (10 s interval between pulses). V1R were voltage clamped at = –60 mV. A prepulse of –40 mV (300 ms) was applied to activate both and . was evoked in response to 10 mV membrane potential steps (200 ms) from –100 mV to +40 mV. V1R were voltage clamped at = –60 mV. A prepulse of 30 mV ( = –30 mV) was applied to isolate . (A1) Representative example of the effect of 300 μM 4-AP application on recorded from embryonic V1R at E12.5. (B1) Curves showing current-voltage relationships of in control and in the presence of 300 μM 4-AP. Measurements were performed on traces shown in (A1). (C1) Dose-response relationship of 4-AP-evoked inhibition (mean + SE). Data were normalized to amplitude measured in the absence of 4-AP ( = 40mV) and fitted as explained in Materials and methods. Note that 4-AP IC50 is in μM range (2.9 μM). 0.3 μM 4-AP n = 3; N = 3, 1 μM 4-AP n = 3; N = 3, 3 μM 4-AP n = 9; N = 9, 10 μM 4-AP n = 13; N = 13, 30 μM 4-AP n = 7; N = 7, 100 μM 4-AP n = 7; N = 7, 300 μM 4-AP n = 7; N = 7. (A2) IA was obtained as the difference between currents evoked from = –100 mV and currents evoked from = –30 mV (10 mV voltage step). (A2) Representative example of the effect of 300 μM 4-AP on in V1R recorded at E12.5. (B2) Current-voltage () relationship in control conditions and in the presence of 300 μM 4-AP. The curves were obtained from the traces shown in (A1). (C2) Bar graph showing the percentage of block elicited by 4-AP. Note that 4-AP did not significantly block (Wilcoxon test p=0.065, n = 10).
Figure 2—figure supplement 2

Effect of 4-aminopiridine (4-AP) application in repetitively spiking (RS).
V1R at E12.5. (A) Representative traces showing the effect of 4-AP application (300 μM) on RS V1R at E12.5. Note that plateau potential (PP) activity evoked in the presence of 4-AP (middle trace) was blocked by 0.5 μM tetrodotoxin (TTX) (right trace). (B) Bar plots showing the changes in the firing pattern of RS V1R evoked by 300 μM 4-AP application (n = 14). 4-AP application evoked a PP in 71.4% of the recorded neurons (10/14) and mixed events (ME) in 14.3% of the recorded neurons (2/14). The excitability pattern was not modified in two neurons. RS V1R (red), ME V1R (purple), and PP V1R (blue).
Figure 3 with 1 supplement

Cluster analysis of V1R firing pattern at E12.5.
(A, insets) Cluster analysis of embryonic V1R firing pattern was performed using three parameters that describe the firing pattern during a 2 s suprathreshold depolarizing pulses: the mean of the half-amplitude event duration (mean ½Ad), the coefficient of variation of ½ Ad (CV ½Ad) allowing to quantify the action potential variation within a train (CV was set to 0 when the number of spikes evoked by a depolarizing pulse was ≤3) and the duration ratio ddr = Σ½ Ad/Pw, obtained by dividing the sum of ½ Ad by the pulse duration Pw, that indicates the total time spent in the depolarized state. For example, ddr = 1 when a plateau potential (PP) lasts as long as the depolarizing pulse. Conversely, its value is low when the depolarizing pulse evokes a single AP only. (A) Dendrogram for complete linkage hierarchical clustering of 164 embryonic V1R (N = 140) according to the values of log mean ½Ad, CV ½Ad, and log ddr. The colored matrix below the dendrogram shows the variations of these three parameters for all the cells in the clusters (colored trees) extracted from the dendrogram. (B) The number of clusters was determined by analyzing the distribution of silhouette width values (see Materials and methods). The box plots show the distribution of silhouette width values when the number of clusters k varies from 2 to 12. The mean silhouette width values (red diamond-shaped points) attained their maximum when the estimated cluster number was 5. (C) 3D plot showing cluster distribution of embryonic V1R according to log mean ½Ad, CV ½Ad, and log ddr. Each cluster corresponds to a particular firing pattern as illustrated in (D). V1R that cannot sustain repetitive firing of APs (1–3 AP/pulse only, gray, single spiking [SS]), V1R that can fire tonically (red, repetitive spiking [RS]), V1R with a firing pattern characterized by a mix of APs and relatively short PPs (dark purple, mixed event short PP [ME short PP]), V1R with a firing pattern characterized by a mix of APs and relatively long plateau potentials (light purple, mixed event long PP [ME long PP]), and V1R with evoked PPs only (blue, PP). The arrow in (C) indicates three misclassified V1R that could not sustain repetitive firing although they were assigned to the cluster of repetitively firing V1R (see text).
-
Figure 3—source data 1
Numerical data used to perform cluster analysis shown in Figure 3.
- https://cdn.elifesciences.org/articles/62639/elife-62639-fig3-data1-v3.docx
Figure 3—figure supplement 1
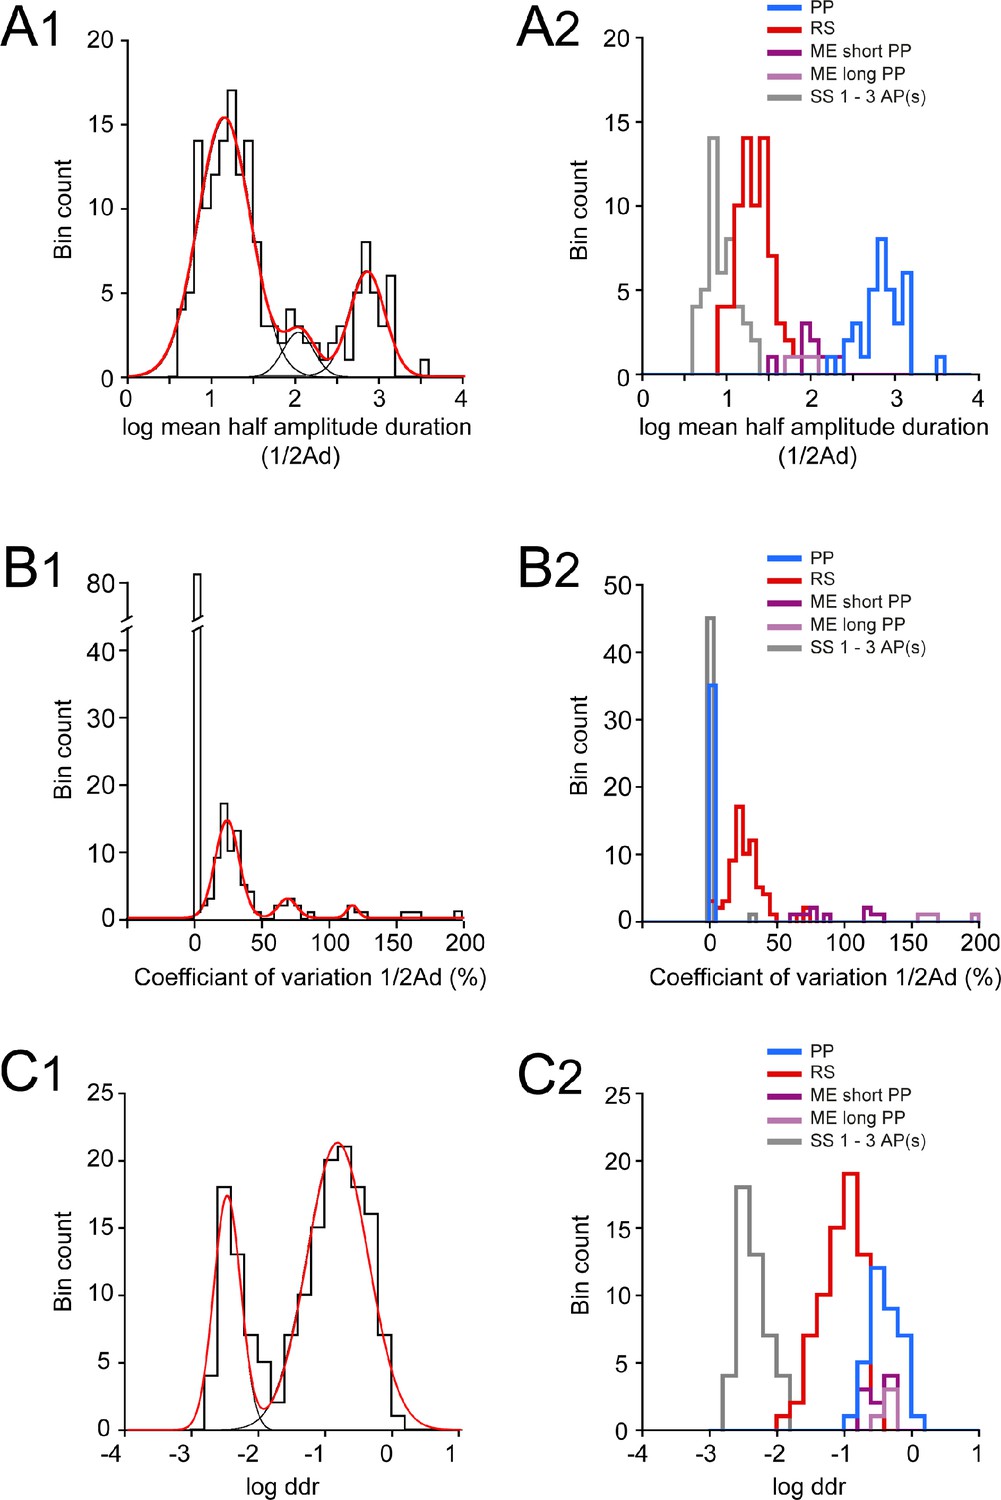
Distributions of log half-amplitude event duration (log ½Ad), coefficient of variation of ½ Ad (CV ½Ad), and log depolarizing duration ratio (log ddr) values related to the cluster analysis of embryonic V1R firing patterns.
(A1) Histogram of log mean ½Ad for the whole V1R population at E12.5 (n = 164; bin width 0.1). The histogram was well fitted by the sum of three Gaussian curves with means and SDs of 1.135, 2.046, and 2.84, and 0.316, 0.181, and 0.21, respectively. (A2) Histogram of the values of log mean ½Ad sorted after cluster analysis showing single spiking (SS) V1R (gray), repetitive spiking (RS) V1R (red), mixed events (ME) V1R with short plateau potentials (ME short PP V1R, light purple), ME V1R with long plateau potentials (ME long PP V1R, dark purple), and PP V1R (blue). log mean ½Ad was significantly different between SS V1R, PP V1R, the whole ME V1R population (MEs and MEl V1R), and PP V1R (Kruskal–Wallis test p<0.0001; SS V1R versus RS V1R, p<0.0001; SS V1R versus ME V1R, p<0.0001; SS V1R versus PP V1R, p<0.0001; RS V1R versus ME V1R, p=0.0004; RS V1R versus PP V1R, p<0.0001; ME V1R versus PP V1R, p=0.018; SS V1R n = 46, RS V1R n = 69, MEs V1R n = 9, MEl V1R n = 4, PP V1R n = 35). (B1) Histogram of CV ½Ad for the whole V1R population at E12.5 (n = 164; bin width 5%). Note that a large population of V1R had zero CV ½Ad (n = 83). The histogram for CV ½Ad ≠ 0 was fitted by the sum of three Gaussian curves with means and SDs of 23.4, 68.4, and 117 (%) and 8.9, 6.8, and 4.1, respectively. (B2) Histograms of the values of CV ½Ad sorted after cluster analysis showing SS V1R (black), RS V1R (red), MEs V1R (light purple), MEl V1R (dark purple), and PP V1R. CV ½Ad was not significantly different between SS V1R and PP V1R (CV ½Ad of SS V1R and PP V1R = 0.682% and 0%, respectively: only one of the 46 SS V1R displayed 3 PA and had a CV ½Ad of 31.37). CV ½Ad was significantly different between RS V1R and the whole ME V1R population and also between SS V1R or PP V1R and RS V1R or ME V1R (Kruskal–Wallis test p<0.0001; SS V1R versus RS V1R, p<0.0001; SS V1R versus ME V1R, p<0.0001; SS V1R versus PP V1R, p=0.846; RS V1R versus ME V1R, p=0.0003; RS V1R versus PP V1R, p<0.0001; ME V1R versus PP V1R, p<0.0001). (C1) Histogram of log ddr (sum of ½Ad divided by pulse duration) for the whole V1R population at E12.5 (n = 164; bin width 0.2). The histogram was fitted by the sum of two Gaussian curves with means and SDs of −2.51 and −0.851, and 0.2 and 0.46, respectively. (C2) Histograms of the values of log ddr sorted after cluster analysis showing SS V1R (black), RS V1R (red), MEs V1R (light purple), MEl V1R (dark purple), and PP V1R. log (ddr) was not significantly different between ME V1R and PP V1R, while it was significantly different between SS V1R and RS V1R, SS V1R and the whole ME V1R population, SS V1R and PP V1R, RS V1R and the whole ME V1R population, RS V1R and PP V1R (Kruskal–Wallis test p<0.0001; SS V1R versus RS V1R, p<0.0001; SS V1R versus ME V1R, p<0.0001; SS V1R versus PP V1R, p<0.0001; RS V1R versus ME V1R, p<0.0001; RS V1R versus PP V1R, p<0.0001; ME V1R versus PP V1R, p=0.977). MEs V1R and MEl V1R differed only by their CV ½Ad (Mann–Whitney test, log mean ½Ad for MEs V1R versus log mean ½Ad for MEl V1R, p=0.26; CV ½Ad for MEs V1R versus CV ½Ad MEl V1R, p=0.0028 and log ddr for MEs V1R versus log ddr for MEl V1R, p=0.1483). It is noteworthy that the distribution of the values of each metric was multimodal, thus indicating that each of them could partially discriminate different groups of embryonic V1R according to their firing pattern.
Figure 4
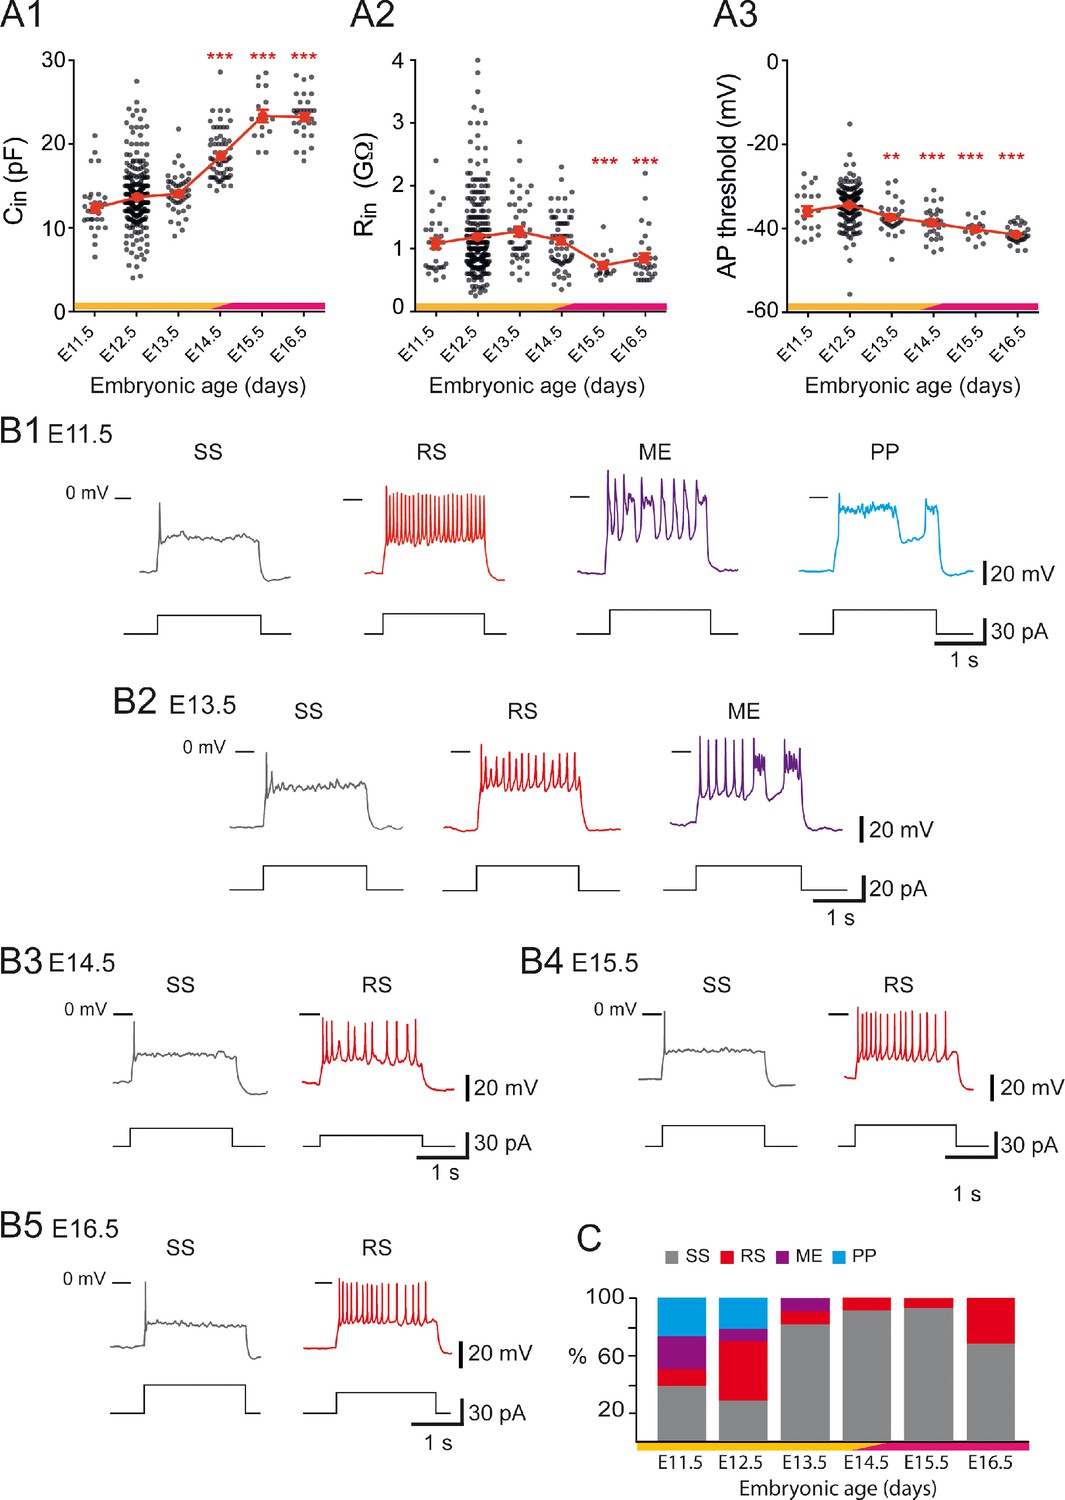
Developmental changes of embryonic V1R firing patterns from E11.5 to E16.5.
(A1) Graph showing how the input capacitance of V1R changes with embryonic age. significantly increased between E12.5 or E13.5 and E14.5 (Kruskal–Wallis test p<0.0001; E12.5 versus E11.5 p=0.258, E12.5 versus E13.5 p=0.904, E12.5 versus E14.5 p<0.0001, E12.5 versus E15.5 p<0.0001, E12.5 versus E16.5 p<0.0001, E13.5 versus E14.5 p<0.0001, E13.5 versus E15.5 p<0.0001, E13.5 versus E16.5 p<0.0001; E11.5 n = 31; N = 27, E12.5 n = 267; N = 152, E13.5 n = 43; N = 40, E14.5 n = 61; N = 49, E15.5 n = 16; N = 4, E16.5 n = 30; N = 9). (A2) Graph showing how the input resistance of V1R changes with embryonic age. significantly decreased between E12.5 or E14.5 and E15.5 (Kruskal–Wallis test p<0.0001; E12.5 versus E11.5 p>0.999, E12.5 versus E13.5 p=0.724, E12.5 versus E14.5 p>0.999, E12.5 versus E15.5 p=0.0004, E12.5 versus E16.5 p=0.0005, E14.5 versus E15.5 p=0.0019, E14.5 versus E16.5 p<0.0058; E11.5 n = 31, E12.5 n = 261; N = 146, E13.5 n = 43; N = 40, E14.5 n = 60; N = 48, E15.5 n = 16; N = 4, E16.5 n = 30; N = 9). (A3) Graph showing how the threshold of regenerative events (action potentials [APs] and plateau potentials [PP]) of V1R changes with embryonic age. The average threshold became significantly more hyperpolarized after E12.5 (Kruskal–Wallis test p<0.0001; E12.5 versus E11.5 p=0.676, E12.5 versus E13.5 p=0.0039, E12.5 versus E14.5 p<0.0001, E12.5 versus E15.5 p<0.0001, E12.5 versus E16.5 p<0.0001, E13.5 versus E14.5 p>0.999, E13.5 versus E15.5 p=0.1398, E13.5 versus E16.5 p=0.0013; E14.5 versus E15.5 p>0.999, E14.5 versus E16.5 p=0.0634, E15.5 versus E16.5 p>0.999; E11.5 n = 20; N = 16, E12.5 n = 162; N = 139, E13.5 n = 31; N = 28, E14.5 n = 30; N = 26, E15.5 n = 16; N = 4, E16.5 n = 30; N = 9). Yellow and purple bars below the graphs indicate the two important phases of the functional development of spinal cord networks. The first one is characterized by synchronized neuronal activity (SNA), and the second one is characterized by the emergence of a locomotor-like activity (see text). Note that changes in and occurred at the end of the first developmental phase (*p<0.05, **p<0.01, ***p<0.001; control, E12.5). The intrinsic activation properties were analyzed using 2 s suprathreshold depolarizing current steps. (B) Representative traces of voltage responses showing single spiking (SS) V1R (gray), repetitive spiking (RS) V1R (red), mixed events (ME) V1R (purple), and PP V1R (blue) at E11.5 (B1), E13.5 (B2), E14.5 (B3) E15.5 (B4), and E16.5 (B5). (C) Bar graph showing how the proportions of the different firing patterns change from E11.5 to E16.5 (E11.5 n = 22; N = 18, E12.5 n = 163; N = 140, E13.5 n = 32; N = 29, E14.5 n = 57; N = 45, E15.5 n = 15; N = 4, E16.5 n = 28; N = 9). Yellow and purple bars below the graphs indicate the first and the second phase of functional embryonic spinal cord networks. The proportions of the different firing patterns significantly changed between E11.5 to E12.5 (Fisher's exact test, p=0.0052) with a significant increase in the proportion of RS V1R (Fisher's exact test, p=0.0336) and a significant decrease in the proportion of ME V1R (Fisher's exact test, p=0.01071) at E12.5. Only two firing patterns (SS and RS) were observed after E13.5 and most embryonic V1R lost their ability to sustain tonic firing after E13.5. However, at E16.5 the proportion of RS V1R significantly increased at the expense of SS V1R when compared to E14.5 (Fisher's exact test, p=0.0112), indicating that embryonic V1R began to recover the ability to sustain tonic firing after E15.5.
Figure 5
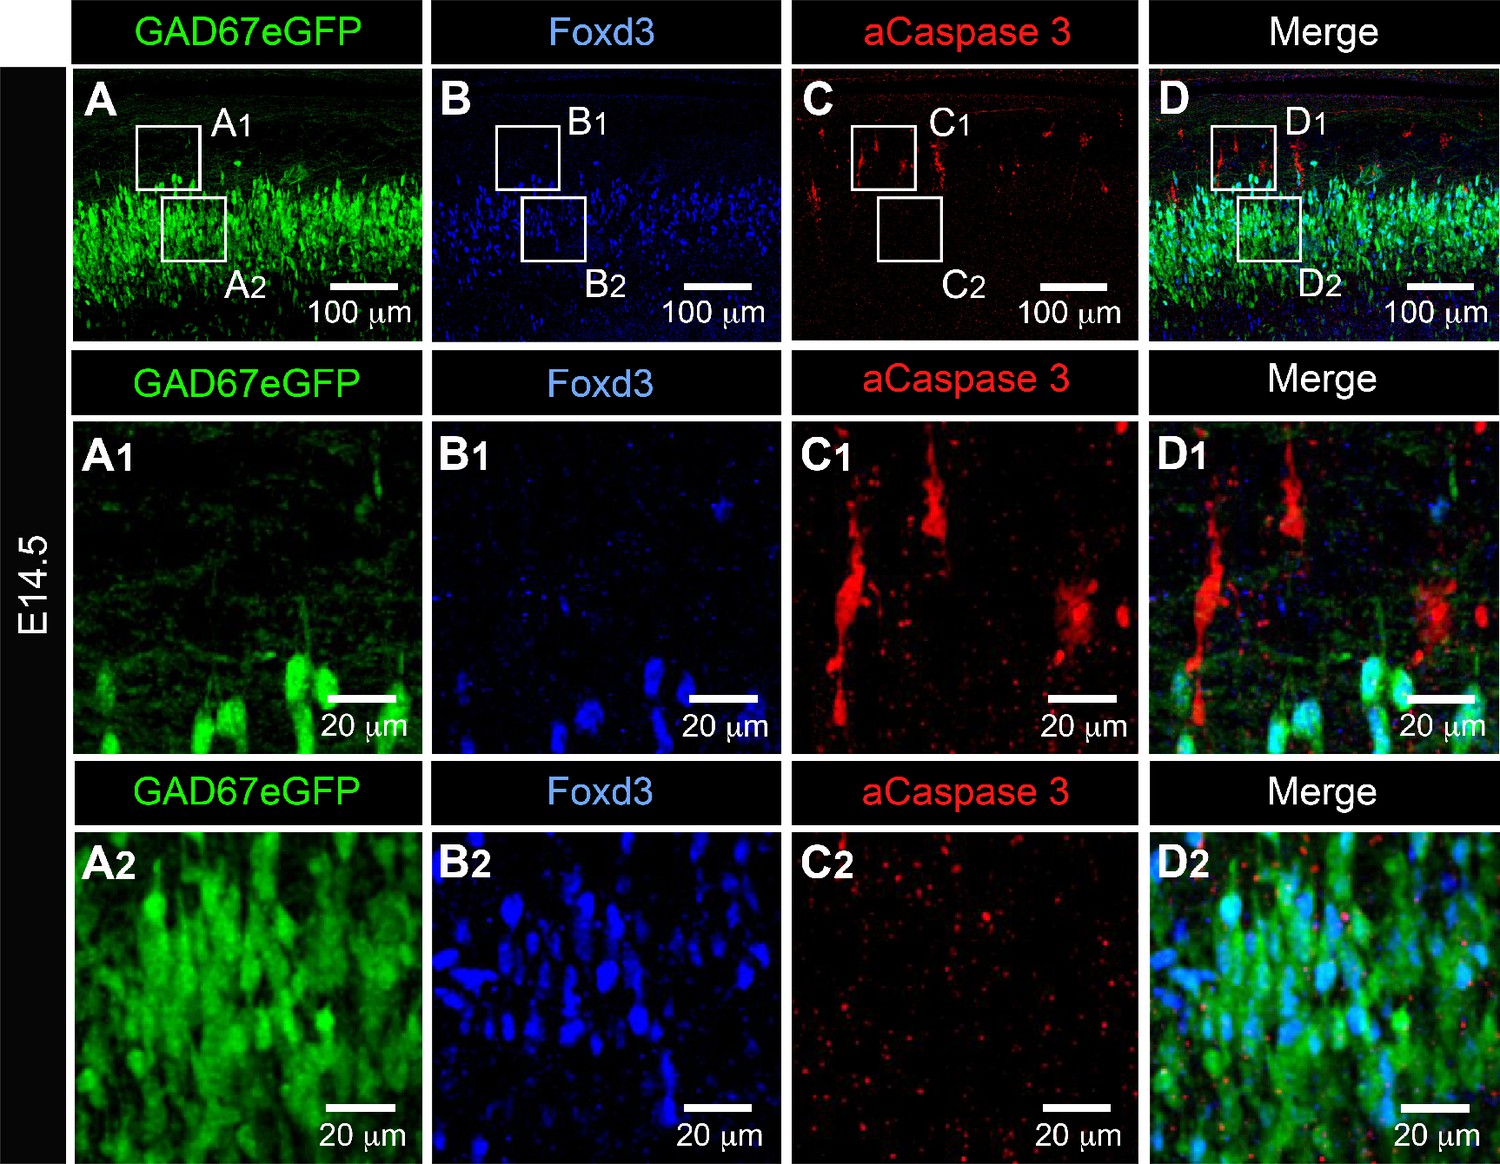
Activated caspase3 (aCaspase3) is not observed in embryonic V1R at E14.5.
Representative confocal image of the ventral part of an isolated lumbar spinal cord of E14.5 GAD67-eGFP mouse embryo showing immunostainings using antibodies against eGFP (A), FoxD3 (B), and aCaspase3 (C). (D) Superimposition of the three stainings shows that embryonic V1R (eGFP+ and FoxD3+) were not aCaspase three immunoreactive. (A1, B1, C1, and D1). Enlarged images from (A), (B), and (C) showing that aCaspase3 staining is localized in areas where eGFP and Foxd3 staining were absent. (A2, B2, C2, and D2) Enlarged images from (A), (B), and (C) showing that aCaspase3 staining is absent in the area where V1R (eGFP+ and FoxD3+) are located. aCaspase3 staining that did not co-localize with GAD67eGFP likely indicates motoneuron developmental cell death.
Figure 6 with 2 supplements
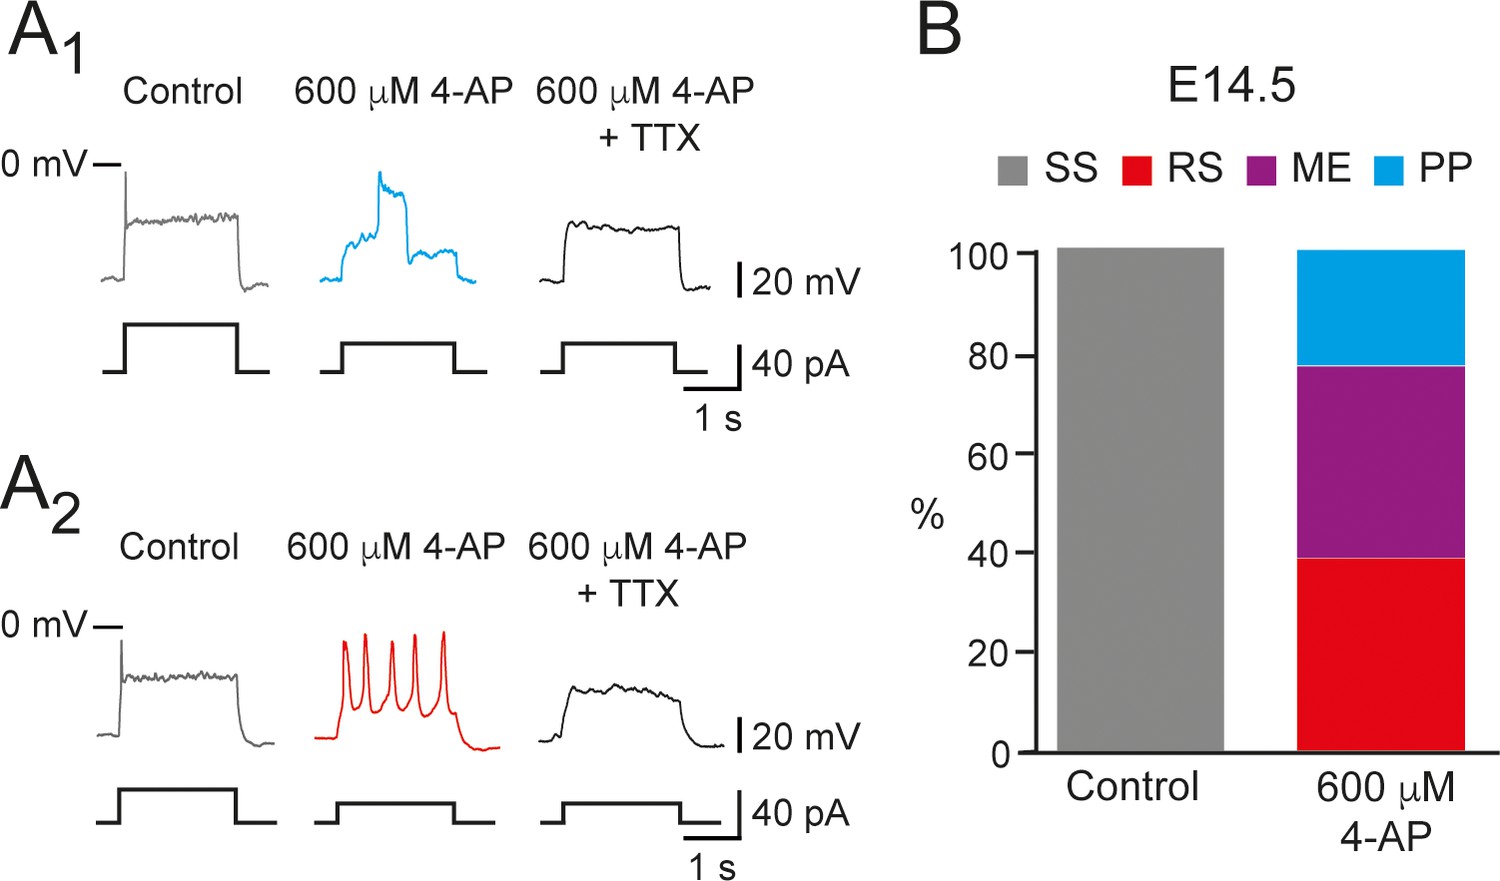
600 μM 4-aminopiridine (4-AP) changed the firing pattern of single spiking (SS) embryonic V1R recorded at E14.5.
The firing pattern of embryonic V1R was evoked by 2 s suprathreshold depolarizing current steps. (A) Representative traces showing the effect of 4-AP application (600 μM) on the firing pattern of SS V1R recorded at E14.5. Note that the applications of 600 μM 4-AP evoked either a plateau potential (PP, A1) or repetitive spiking (RS, A2), both fully blocked by tetrodotoxin. (B) Bar plots showing the proportions of the different firing patterns observed in the presence of 600 μM 4-AP versus control recorded in SS V1R at E14.5 (n = 14; N = 14). SS V1R (gray), RS V1R (red), mixed Events (ME) V1R (purple), and PP V1R (blue).
Figure 6—figure supplement 1

is present in embryonic V1R recorded at E14.5.
(A) Representative trace of evoked by a slow depolarizing voltage ramp (70 mV/s, upper inset) in single spiking (SS) embryonic V1R (lower inset). was isolated by subtracting currents evoked by depolarizing ramps in the presence of 1 μM tetrodotoxin (TTX) to the control current evoked in the absence of TTX (upper inset). (B) Voltage dependence of GNap conductance calculated from the trace shown in (A). The activation curve was obtained by transforming the current evoked by a depolarizing voltage ramp from –100 mV to 20 mV (70 mV/s) using the following equation: GNaP = –INap/((–Vh) + ENa), where Vh is the holding potential at time t during a depolarizing voltage ramp and ENa is the equilibrium potential for sodium (ENa = 60 mV). The GNaP/Vh curve was fitted with the following Boltzmann function: G = GMAX/(1 + exp(–(V–VHALF)/k)) (Boeri et al., 2018), where Vhalf is the Vh value for GNap half activation, k the slope factor of the curve, and Gmax the maximum conductance. We found no significant difference between the values of Vhalf (Mann–Whitney test: p=0.8518) and of k (Mann–Whitney test: p=0.7546) obtained at E12.5 (Boeri et al., 2018) and those obtained at E14.5. At E14.5, Vhalf = –27 ± 5.1 mV and k = 7.73 ± 0.78 (n = 6).
Figure 6—figure supplement 2
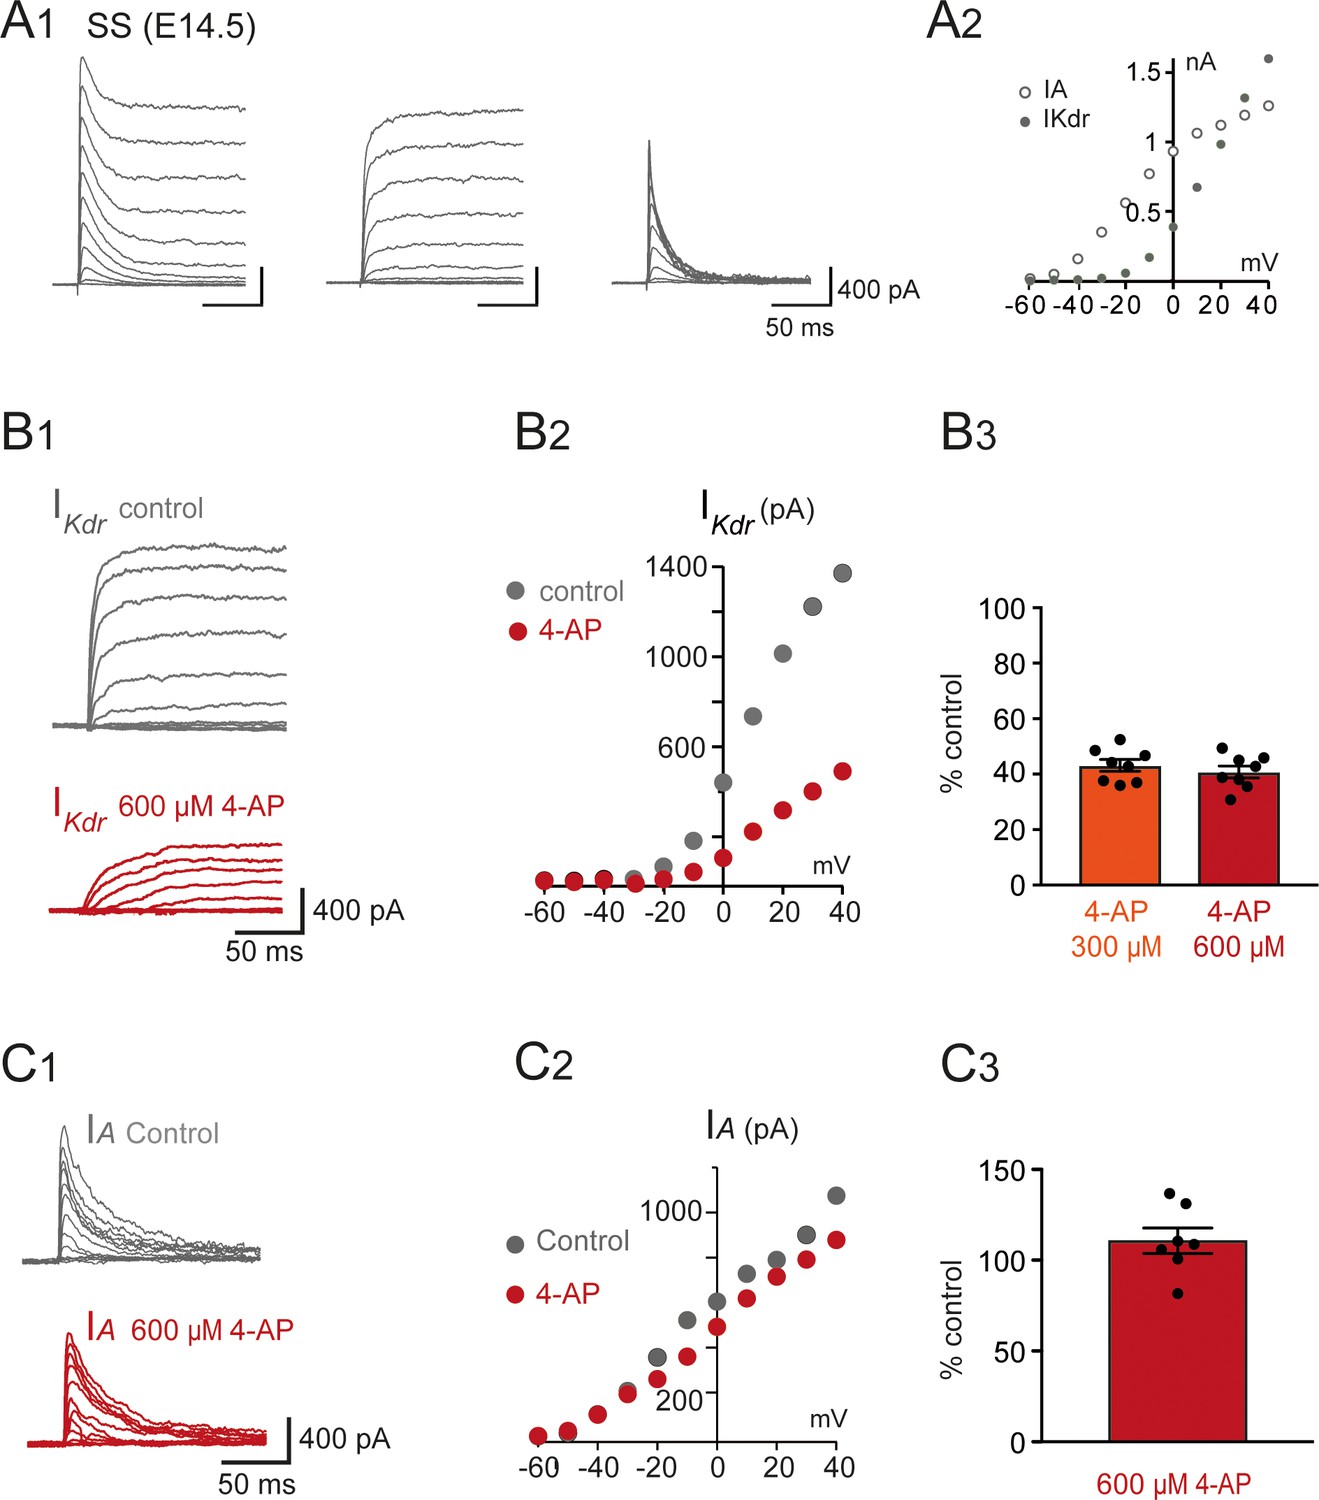
was inhibited by 4-aminopiridine (4-AP) in V1R recorded at E14.5.
(A1) Representative examples of the total outward K+ currents obtained from = –100 mV (left traces), ( = –30 mV, middle traces), and isolated (left traces) recorded in single spiking (SS) V1R at E14.5. (A2) Current-voltage relationship of (filled circle) and (open circle) in SS V1R at E14.5. curves were obtained from currents shown in (A1). (B1) Representative example of the effect of 4-AP at 600 μM in V1R at E14.5. (B2) Current-voltage curves in control condition and in the presence of 600 μM 4-AP. (B3) Bar plots showing the percentage of inhibition evoked by 300 μM 4-AP application (n = 8) and 600 μM 4-AP application (n = 7). The percentages of inhibition evoked by 300 μM 4-AP and 600 μM 4-AP applications were not significantly different (p=0.574). (C1) Representative example of the effect of 600 μM 4-AP on in V1R recorded at E14.5. (C2) curves in control conditions and in the presence of 600 μM 4-AP. These curves were obtained from the traces shown in (B1). (C3) Bar graph showing the percentage of block elicited by 4-AP. 4-AP did not significantly block (Wilcoxon test p=0.11, n = 6).
Figure 7 with 2 supplements
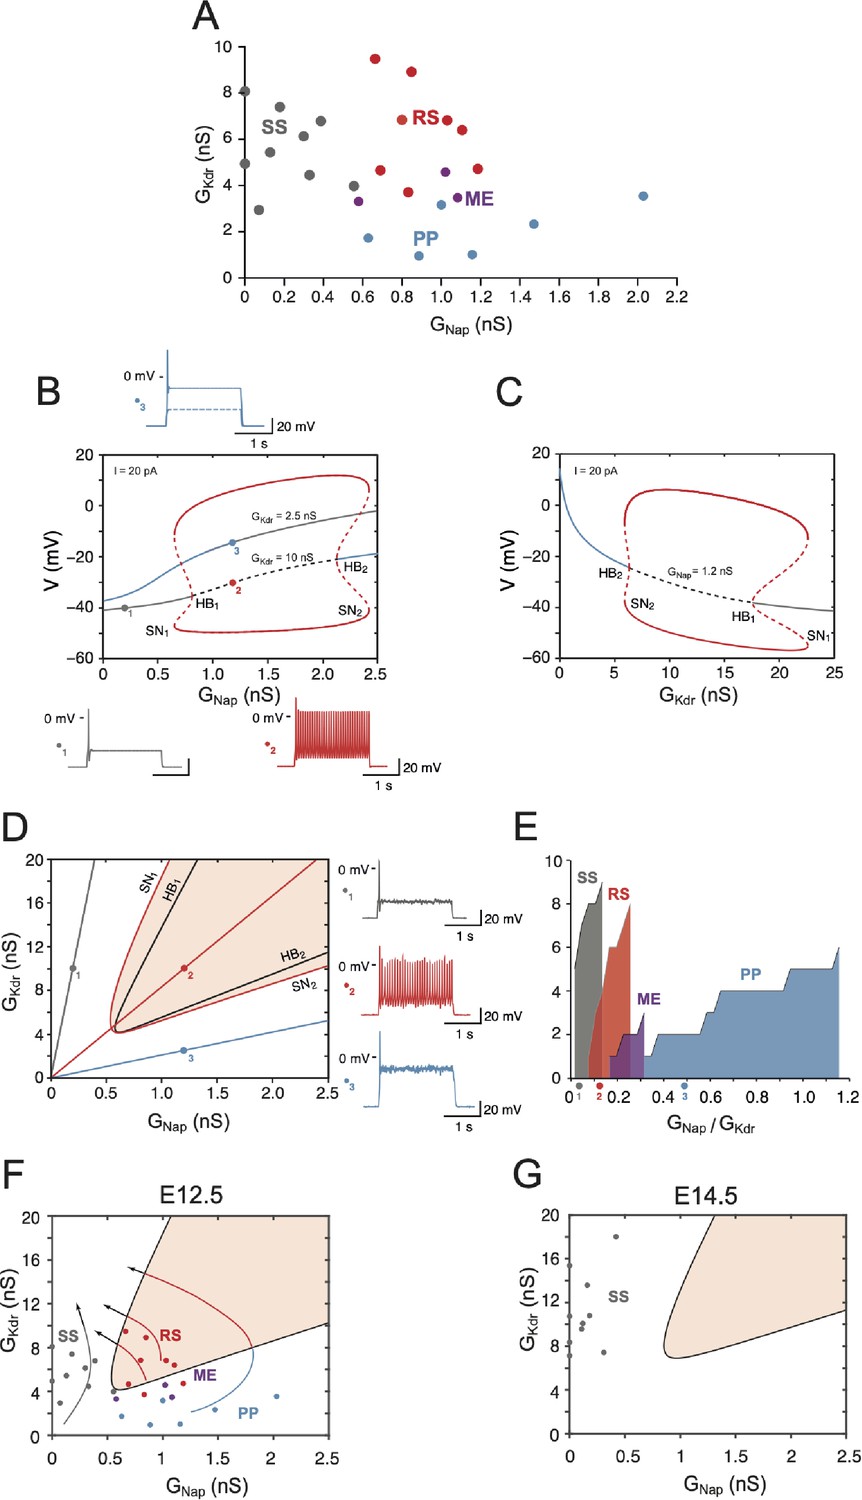
Embryonic V1R firing patterns predicted by computational modeling.
(A) Firing patterns of 26 recorded cells, in which both and were measured. Gray: single spiking (SS); red: repetitive spiking (RS); blue: plateau potential (PP). The three purple points located at the boundary between the RS and PP regions correspond to mixed events (ME), where plateau potentials alternate with spiking episodes. Note that no cell exhibited low values of both and (lower left) or large values of both conductances (upper right). (B) Bifurcation diagram of the deterministic model when is kept fixed to 2.5 nS or 10 nS while is varied between 0 and 2.5 nS. = 1 nS and = 20 pA. For = 10 nS (i.e., in the top experimental range), the red curves indicate the maximal and minimal voltages achieved on the stable limit cycle associated with repetitive firing (solid lines) and on the unstable limit cycle (dashed lines). The fixed point of the model is indicated by a gray solid line when it corresponds to the stable quiescent state, a gray dashed line when it is unstable, and a solid blue line when it corresponds to a stable plateau potential. The two Hopf bifurcations (HB) corresponding to the change of stability of the quiescence state (HB1, = 0.81 nS) and the voltage plateau (HB2, = 2.13 nS) are indicated, as well as the two saddle node (SN) bifurcations of limit cycles associated with the onset (SN1, 0.65 nS) and offset (SN2, = 2.42 nS) of repetitive spiking as is increased. For = 2.5 nS, the model does not display repetitive firing; it possesses a unique fixed point, which is always stable (blue-gray curve). The transition from quiescence to plateau is gradual with no intervening bifurcation. Representative voltage traces of the three different activity patterns are shown: SS in response to a 2 s current pulse (gray, = 0.2 nS, = 10 nS), RS (red, = 1.2 nS, = 10 nS), and PP (blue, = 1.2 nS, = 2.5 nS). Note that the plateau never outlasts the current pulse. (C) Bifurcation diagram when is kept fixed at 1.2 nS and is varied between 0 and 25 nS ( = 20 pA). Same conventions as in (B). PP is stable until the subcritical HB2 ( = 6.34 nS) is reached, repetitive firing can be observed between SN2 ( = 5.93 nS) and SN1 ( = 22.65 nS). The quiescent state is stable from point HB1 (= 17.59 nS) onward. (D) Two-parameter bifurcation diagram of the model in the - plane ( = 20 pA). The black curves indicate the bifurcations HB1 and HB2. The red curves indicate the SN bifurcations of limit cycles SN1 and SN2. The shaded area indicates the region where repetitive firing can occur. The oblique lines through the points labeled 1, 2, and 3, the same as in (B), correspond to three different values of the ratio of / : 0.02 (gray), 0.12 (red), and 0.48 (blue). Voltage traces on the right display the response to a 2 s current pulse when channel noise is taken into account for the three regimes: SS (top, gray trace and dot in the diagram), RS (middle, red), and PP (bottom, blue). They correspond to the three deterministic voltage traces shown in (B). Note that the one-parameter bifurcation diagrams shown in (B) correspond to horizontal lines through points 1 and 2 ( = 10 nS) and through point 3 ( = 2.5 nS), respectively. The bifurcation diagram in (C) corresponds to a vertical line through points 2 and 3 ( = 1.2 nS). (E) Cumulative distribution function of the ratio for the four clusters in (A), showing the sequencing SS (gray) → RS (red) → ME (purple, three cells only) → PP (blue) predicted by the two-parameter bifurcation diagram in (D). The wide PP range, as compared to SS and RS, merely comes from the fact that is small for cells in this cluster. The three colored points indicate the slopes of the oblique lines displayed in (D) . (F) The data points in (A) are superimposed on the two-parameter bifurcation diagram shown in (D), demonstrating a good agreement between our basic model and experimental data (same color code as in A for the different clusters). The bifurcation diagram is simplified compared to (A), only the region where repetitive spiking is possible (i.e., between the lines SN1 and SN2 in A) being displayed (shaded area). Notice that three ME cells (purple dots) are located close to the transition between the RS and PP regions. The four arrows indicate the presumable evolution of and for SS, RS, ME, and PP cells between E12.5 and E14.5–15.5. eventually decreases while keeps on increasing. (G) Distribution of a sample of cells in the - plane at E14.5. All the cells are located well within the SS region far from bifurcation lines because of the decreased compared to E12.5, the increased , and the shift of the RS region (shaded) due to capacitance increase (18 versus 13 pF).
Figure 7—figure supplement 1
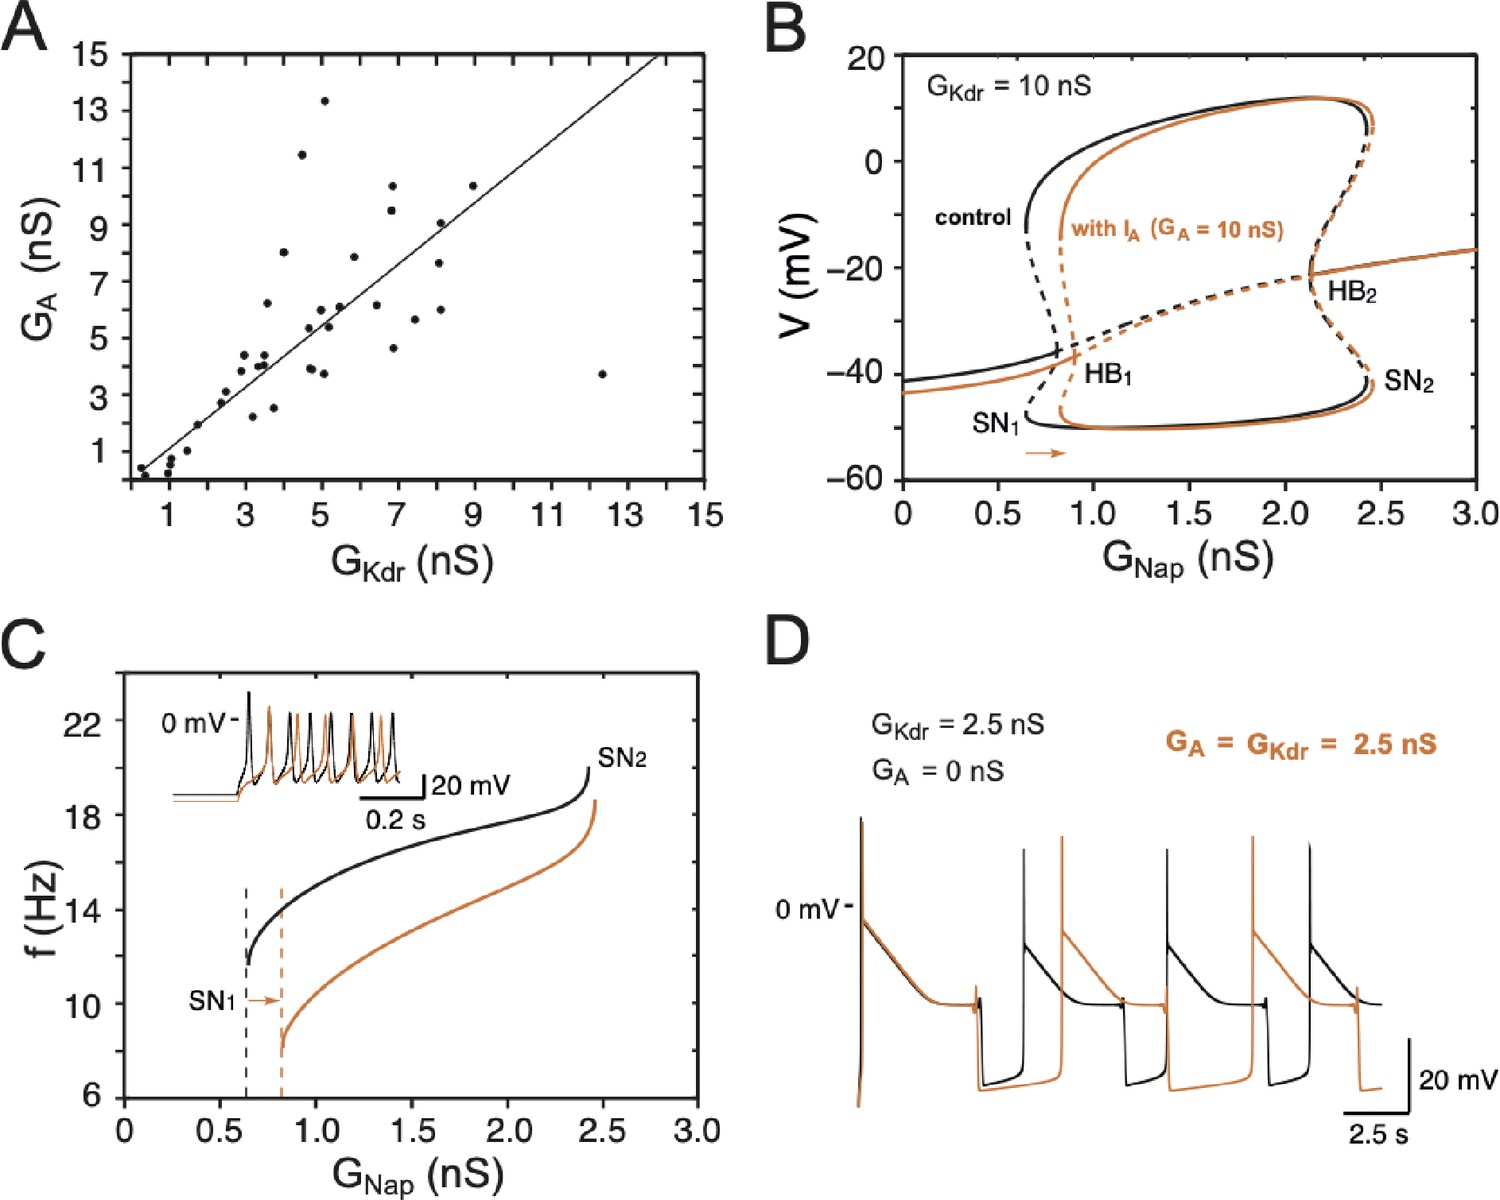
Effect of on embryonic V1R firing patterns predicted by computational modeling.
(A) The maximal conductances of and at E12.5 are linearly correlated. Best fit: = 1.09 (R2 = 0.81, N = 44). (B) Effect of on the dynamics of the basic model. The one-parameter bifurcation diagrams in control condition (black, = 20 pA, = 10 nS, no same as in Figure 7B) and with added (orange, = 10 nS) are superimposed. The current shifts the firing threshold SN1 to the right by 0.18 nS (see also C) as indicated by the orange arrow, with little effect on the amplitude of action potentials (see also inset in C). In contrast, shifts SN2 by only 0.03 nS because it is inactivated by depolarization. (C) also slows down the discharge frequency, as shown by comparing the curves without (black) and with (orange). For = 1 nS, for instance, the firing frequency is reduced by 31%, from 15 to 10.4 Hz. Here again, the effect of progressively decreases as increases because of the membrane depolarization elicited by . For = 2.4 nS, for instance, the firing frequency is reduced by 11% only, from 19.1 to 17 Hz. This frequency reduction elicited by does not merely result from the increased firing threshold. Note also that the latency of the first spike is increased (see voltage trace in inset), which is a classical effect of . (D) reduces the frequency of pseudo-plateau bursting by lengthening quiescent episodes (doubling their duration in the example shown) without affecting the duration of plateaus much (here a mere 5% increase), as shown by the comparison of the voltage traces obtained without (control, = 2.5 nS, black) and with ( 2.5 nS, orange). This is because is activated near rest but inactivated during voltage plateaus. Note that increasing in the absence of has not the same effect; it shortens both plateaus and quiescent episodes (see Figure 8C, where = 5 nS). This is because does not inactivate (or does it only very slowly) in contrast to .
Figure 7—figure supplement 2
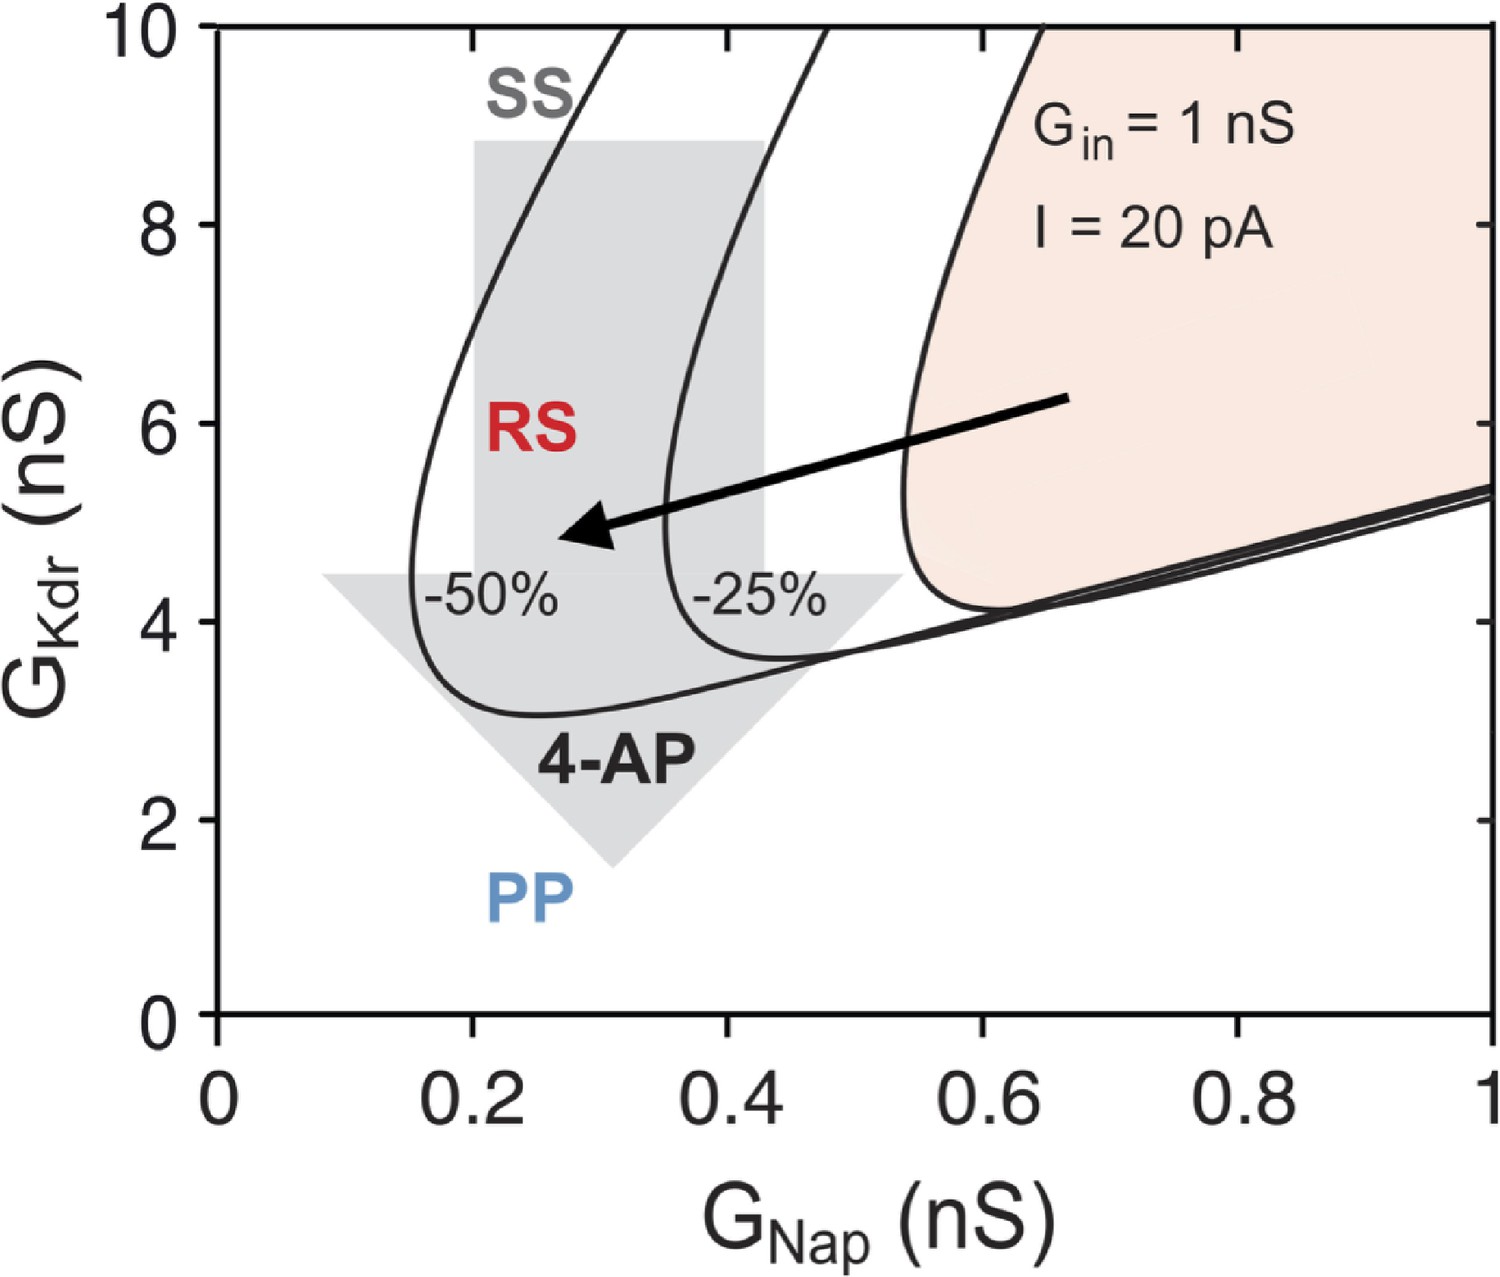
Explaining the effect of 4-aminopiridine (4-AP) on the firing pattern.
The R region of the basic model, where repetitive firing may occur, is displayed in the plane in control condition for E12.5 V1R ( = 13 pF, = 1 nS, = 20 pA, shaded area) and when and were both reduced by 25% (middle curve) or 50% (left curve). The reduced accounts for the decrease in rheobase, and thus in the current injected in the experiments, following the decrease in . If 4-AP reduced only (as indicated by the downward arrow), the firing pattern of SS V1R would not change, the RS region being too far to the right to be visited. In contrast, when the effects of 4-AP on the input conductance and rheobase are taken into account, the bifurcation diagram moves leftward and downward, as indicated by the oblique black arrow, and the RS and PP regions are then successively entered as is reduced. The same explanation holds at E14.5.
Figure 8
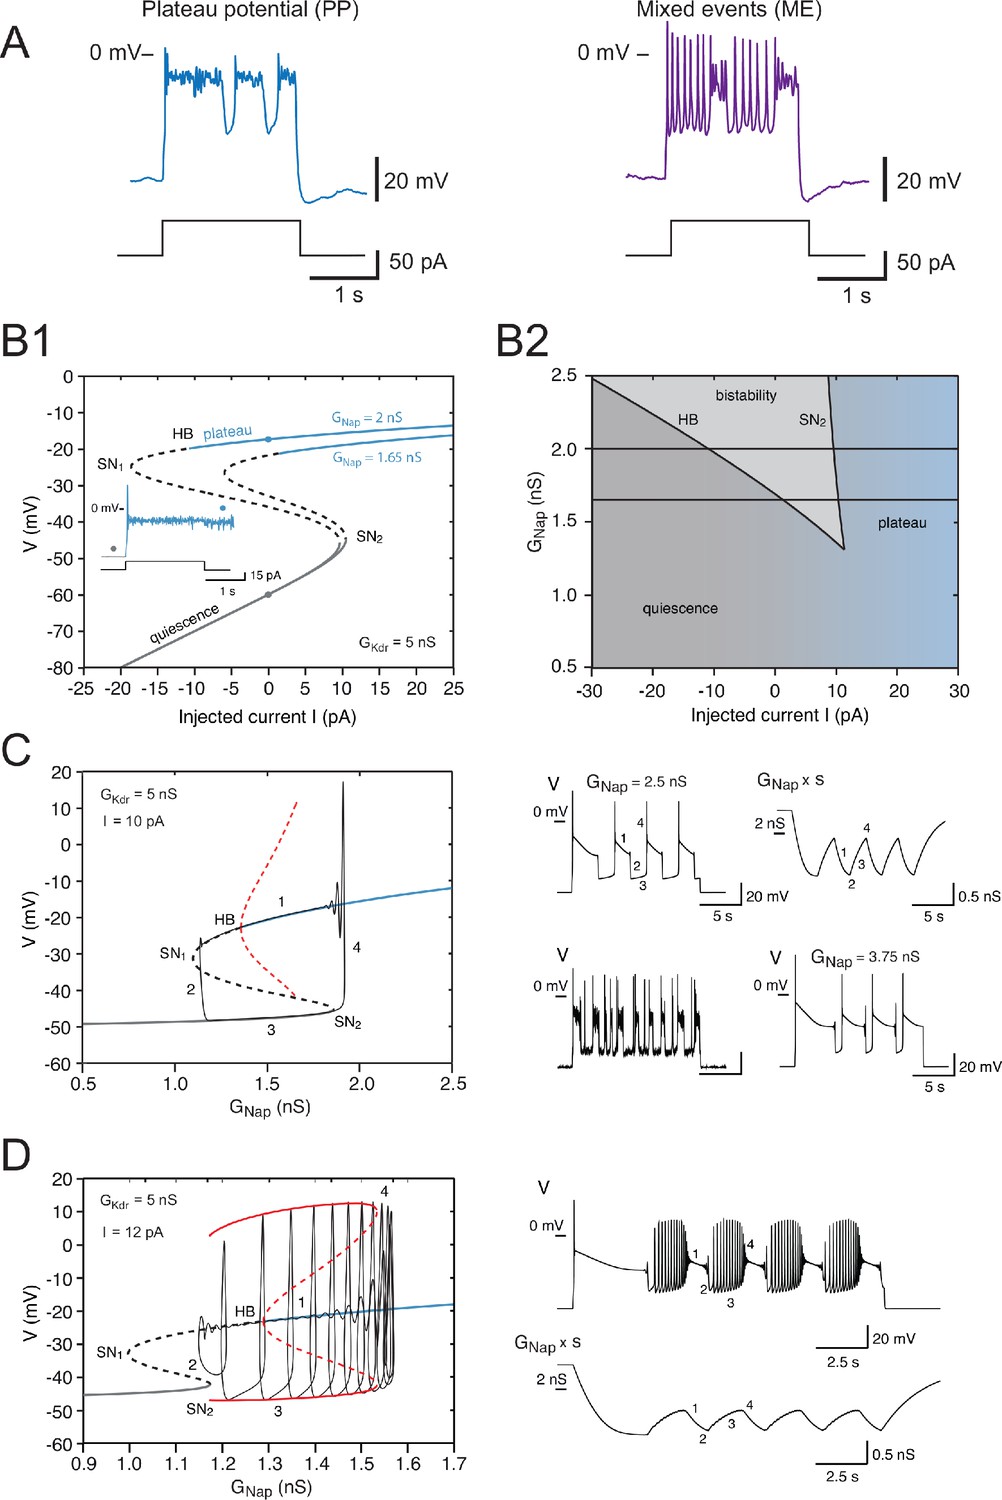
Effects of the slow inactivation of on firing patterns predicted by computational modeling.
(A) Examples of repetitive plateaus (left) and mixed events (right) recorded in V1R at E12.5 during a 2 s current pulse. (B1) Current-voltage curve of the basic model (without slow inactivation of and without or channel noise) for = 5 nS and for = 1.65 nS (lower curve) and 2 nS (upper curve). Solid lines denote stable fixed points and dashed lines unstable ones. For = 1.65 nS, bistability between quiescence and plateau occurs between 1.39 and 10.48 pA. When is increased to 2 nS, the bistability region ranges from –10.84 to 9.70 pA, thus extending into the negative current range. This implies that once a plateau has been elicited, the model will stay in that stable state and not return to the resting state, even though current injection is switched off (see inset). (B1 inset) Voltage response to a 2 s current pulse of 15 pA for = 2 nS. The resting state (gray dot on the lower curve in B1) is destabilized at pulse onset and a plateau is elicited (blue dot on the upper curve in B1). At pulse offset, the plateau is maintained, even though the injected current is brought back to zero, and channel noise is not sufficient to go back to the resting state. (B2) Domain of bistability between quiescence and plateau (shaded) in the plane for = 5 nS. It is delimited by the line SN2 where a SN bifurcation of fixed points occurs and by the subcritical Hopf bifurcation line HB where the plateau becomes unstable. Bistability requires that exceeds 1.35 nS, and the domain of bistability enlarges as is increased further. The two horizontal lines correspond to the two cases shown in (B1) = 1.65 nS and 2 nS. (C) Behavior of the model when slow inactivation is incorporated. The bifurcation diagram of the basic model (without slow inactivation) for = 10 pA and = 5 nS (same conventions as in Figure 7B) and the stable limit cycle (black solid curve) obtained when slow inactivation is added are superimposed. The limit cycle is comprised of four successive phases (see labels): (1) long plateau during which slowly inactivates, (2) fast transition to the quiescent state, (3) repolarization episode during which slowly de-inactivates, and (4) fast transition back to the plateau. Each plateau starts with a full-blown action potential followed by rapidly decaying spikelets. Note that the bifurcation HB is subcritical here (unstable limit cycle shown by dashed red curve), at variance with square wave bursting (supercritical bifurcation and stable limit cycle); this is a characteristic feature of pseudo-plateau bursting. Note also that the plateau extends beyond the bifurcation HB because it is only weakly unstable then. Responses to a 15 s current pulse are shown on the right side. Top left: voltage response ( = 2.5 nS); top right: behavior of the 'effective' conductance of the channels, that is, the maximal conductance multiplied by the slow inactivation variable . Bottom left: voltage trace when channel noise is added to fast and slow gating variables; bottom right: voltage trace when is increased by 50% to 3.75 nS. (D) Mixed events. The bifurcation diagram of the basic model for = 5 nS and = 12 pA and the stable limit cycle obtained in the presence of slow inactivation ( = 2.5 nS) are superimposed. Here again, the limit cycle comprises four successive phases (see labels): (1) slow inactivation of that leads to the crossing of the bifurcation point HB2 and then to the destabilization of the plateau potential; (2) fast transition to the spiking regime; (3) repetitive spiking during which slowly de-inactivates, which leads to the crossing of the bifurcation point SN2 and terminates the spiking episode; and (4) fast transition back to the stable plateau potential. Response to a 15 s current pulse of 12 pA is shown on the right in the absence of any channel noise. Top: voltage trace (same labels as in the bifurcation diagram on the left); bottom: variations of the 'effective' conductance (same labels as in the voltage trace). Note that de-inactivation sufficient to trigger a new plateau occurs over a series of successive spikes, hence the small oscillations visible on the trace. Note also that in (C) and (D) the first plateau lasts longer than the following ones, as in electrophysiological recordings of embryonic V1R cells displaying repetitive plateaus. This form of adaptation is caused by the slow inactivation of the persistent sodium current.
Tables
Key resources table
| Reagent type (species) or resource | Designation | Source or reference | Identifiers | Additional information |
|---|---|---|---|---|
| Genetic reagent (Mus musculus Swiss) male and female | GAD1GFP | PMID:14574680 | A cDNA encoding enhanced GFP (eGFP) was targeted to the locus encoding the gene Gad1 | |
| Antibody | Anti-FoxD3 (Guinea pig polyclonal) | PMID:19088088 | IF(1:5000) | |
| Antibody | Anti-cleaved Caspase-3 (Asp175) (Rabbit polyclonal) | Cell Signaling Technology | Cat# 9661, RRID:AB_2341188 | IF(1:1000) |
| Chemical compound, drug | Tetrodotoxin | Alomone Labs | Cat# T550, CAS No.: 18660-81-6 | 1 µM |
| Chemical compound, drug | 4-Aminopyridine | Sigma-Aldrich | Cat# A78403, CAS No.: 504-24-5 | 0.3–600 µM |
| Software, algorithm | pCLAMP 10.5 | Molecular Devices | RRID:SCR_014284 | |
| Software, algorithm | Axograph 1.7.2 | AxoGraph | RRID:SCR_014284 | |
| Software, algorithm | PRISM 7.0e | GraphPad Software | RRID:SCR_002798 | |
| Software, algorithm | ImageJ 1.5 | N.I.H. (USA) | RRID:SCR_003070 | |
| Software, algorithm | Adobe Photoshop CS6 | Adobe, USA | RRID:SCR_014199 | |
| Software, algorithm | R software 3.3.2 | Cran project (https://cran.r-project.org/) | RRID:SCR_001905 | |
| Software, algorithm | XPP-Aut 8.0 | University of Pittsburgh; Pennsylvania; USA | RRID:SCR_001996 |
Table 1
Model parameters.
| Parameter | Basic model | Model with slow inactivation of INap |
|---|---|---|
| Passive parameters | ||
| Input conductance Gin | 1 nS | Same |
| Input capacitance Cin | 13 pF (E12.5, Figures 7B, C, D, F and 8B– D) or 18 pF (E14.5, Figure 7G) | 13 pF |
| Resting potential Vr | −60 mV | Same |
| Injected current I | 20 pA (Figure 7B–G) | 10 pA (Figure 8C) or 12 pA (Figure 8D) variable in Figure 8B |
| Transient sodium current Inat | ||
| Maximal conductance GNat | 20 nS | Same |
| Reversal potential ENa | 60 mV | |
| Activation exponent | 3 | |
| Mid-activation Vm | −26 mV | |
| Steepness of activation km | 9.5 mV | |
| Activation time constant | 1.5 ms | |
| Mid-inactivation Vh | −45 mV | |
| Steepness of inactivation Kh | −5 mV | |
| Inactivation time constant τm | Voltage-dependent (see Material s and methods) | |
| Persistent sodium current INap | ||
| Maximal conductance | Variable (see text and figure captions) | Same |
| Mid-activation voltage | −36 mV | Same |
| Mid-inactivation Vs | −30 mV | |
| Steepness of inactivation ks | −5 mV | |
| Inactivation time constant | Slow inactivation not included | 2 s |
| Delayed rectifier potassium current IKdr | ||
| Maximal conductance GKdr | Variable (see text and figure captions) | Same |
| Reversal potential EK | −96 mV | |
| Activation exponent | 3 | |
| Mid-activation Vn | −20 mV | |
| Steepness of activation kn | 15 mV | |
| Activation time constant τm | 10 ms | |
| Potassium A current IA (when included in the basic model) | ||
| Maximal conductance GA | Equal to GKdr | Never included |
| Mid-activation VmA | −30 mV | |
| Steepness of activation kmA | 12 mV | |
| Activation time constant | Instantaneous activation | |
| Mid-inactivation VhA | −70 mV | |
| Steepness of inactivation khA | −7 mV | |
| Inactivation time constant τhA | 23 ms | |
Additional files
Download links
A two-part list of links to download the article, or parts of the article, in various formats.
Downloads (link to download the article as PDF)
Open citations (links to open the citations from this article in various online reference manager services)
Cite this article (links to download the citations from this article in formats compatible with various reference manager tools)
Two opposite voltage-dependent currents control the unusual early development pattern of embryonic Renshaw cell electrical activity
eLife 10:e62639.
https://doi.org/10.7554/eLife.62639


