Hyaluronic acid fuels pancreatic cancer cell growth
- Doctoral Program in Cancer Biology, University of Michigan, United States
- Department of Molecular & Integrative Physiology, University of Michigan, United States
- Program in Chemical Biology, University of Michigan, United States
- Department of Molecular and Cellular Oncology, University of Texas MD Anderson Cancer Center, United States
- Department of Radiology, Memorial Sloan Kettering Cancer Center, United States
- Department of Chemistry, University of Southern California, United States
- Department of Biological Sciences, University of Southern California, United States
- Molecular Pharmacology Program, Memorial Sloan Kettering Cancer Center, United States
- Department of Internal Medicine, Division of Gastroenterology and Hepatology, University of Michigan, United States
- Rogel Cancer Center, University of Michigan, United States
Figures
Figure 1 with 1 supplement
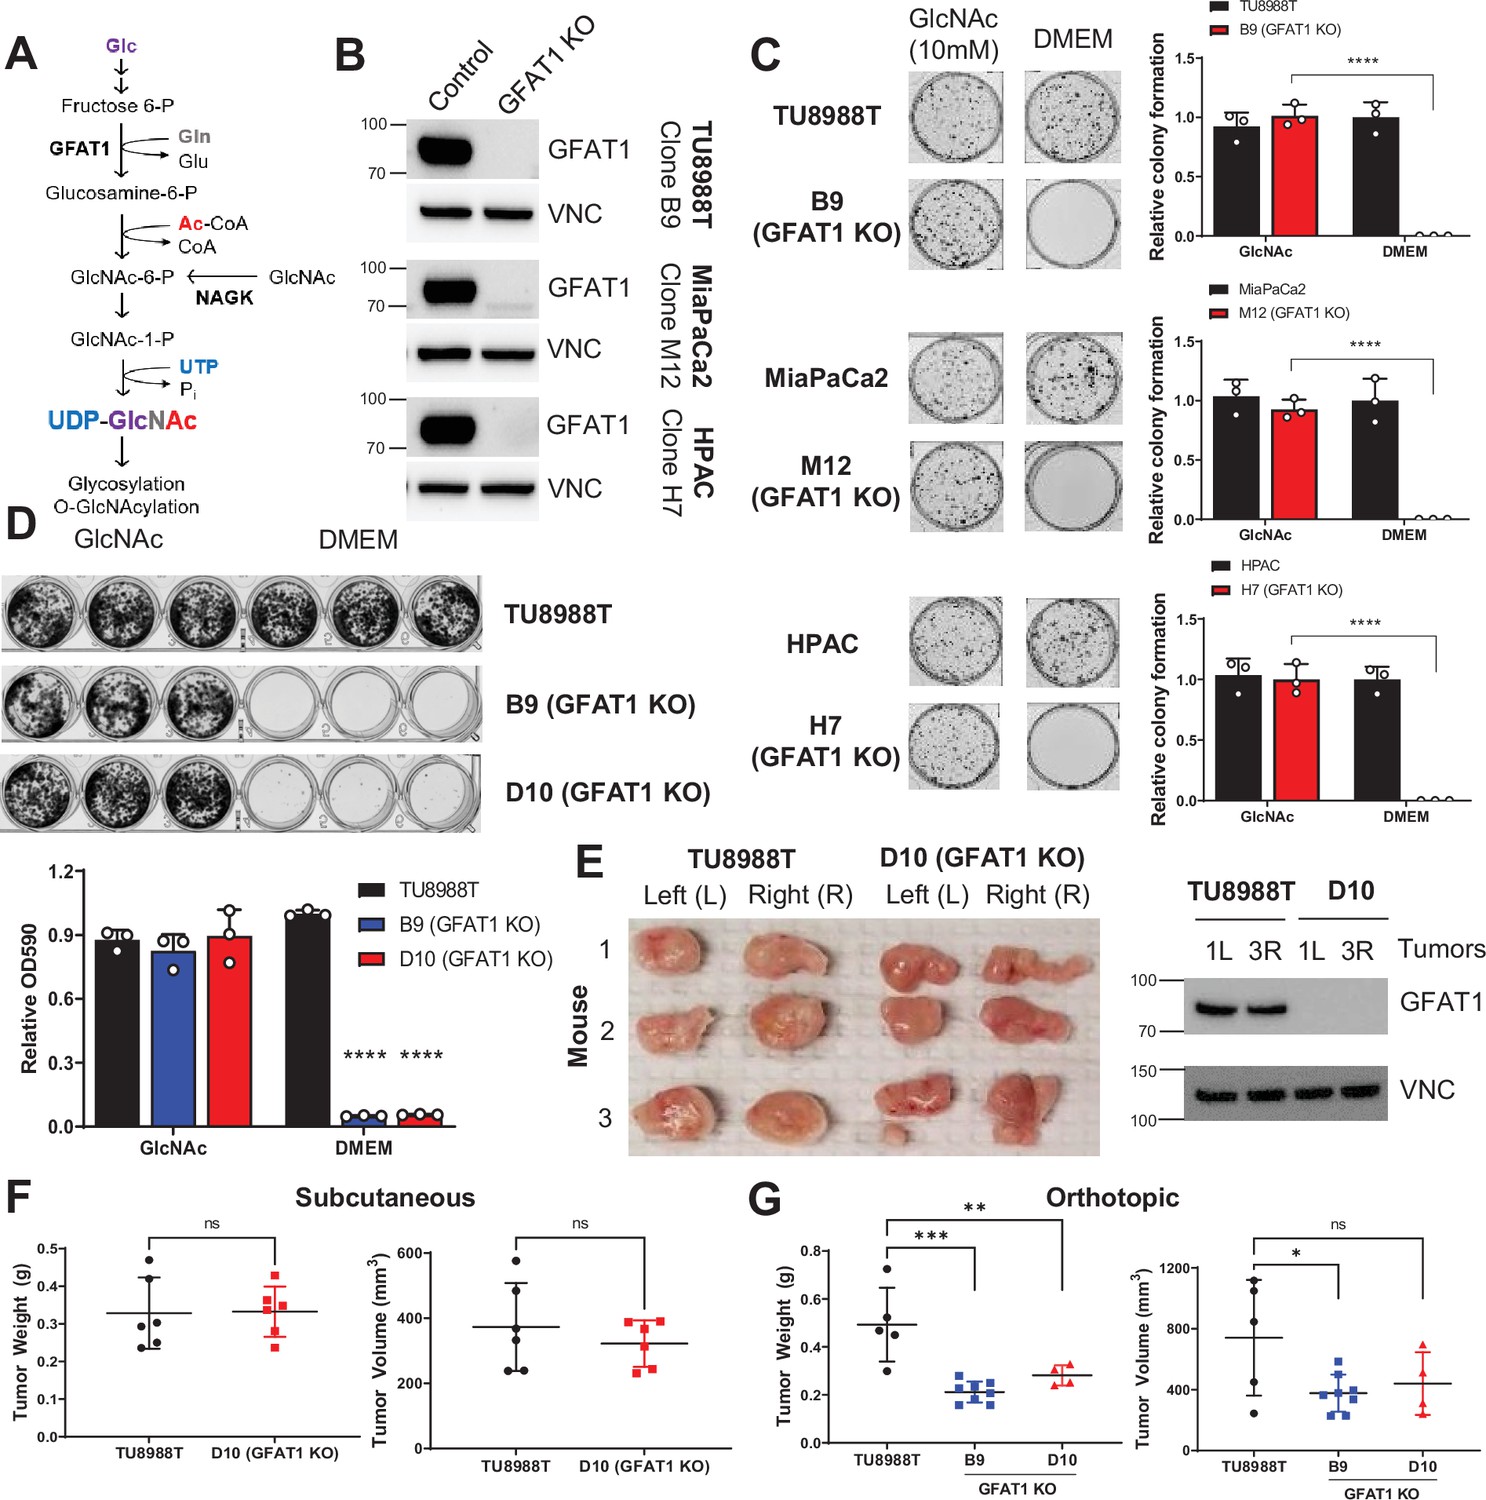
Pancreatic ductal adenocarcinoma (PDA) requires de novo hexosamine biosynthetic pathway (HBP) fidelity in vitro but not in vivo.
(A) Schematic overview of the HBP and the nutrient inputs. Ac-CoA, acetyl-coenzyme A; GFAT1, glutamine fructose 6-phosphate amidotransferase 1; Glc, glucose; GlcNAc, N-acetyl-glucosamine; Gln, glutamine; Glu, glutamate; NAGK, N-acetyl-glucosamine kinase; Pi, inorganic phosphorus; UTP, uridine-triphosphate. (B) Western blot of GFAT1 and loading control VINCULIN (VNC) from validated CRISPR/Cas9 knockout TU8988T, MiaPaca2, and HPAC clones and their control (non-targeted sgRNA). (C) Representative wells from a colony-forming assay in parental and clonally derived GFAT1 knockout cell lines grown in base media (DMEM) or base media supplemented with 10 mM GlcNAc. Data quantitated at right, n = 3. (D) Proliferation assay in parental and two GFAT1 knockout clonal TU8988T cell lines. Representative wells are presented above data quantitated by crystal violet extraction and measured by optical density (OD) at 590 nm, n = 3. (E) Tumors from parental TU8988T (n = 6) and GFAT1 knockout clone D10 (n = 6) grown subcutaneously in immunocompromised mice. Accompanying western blot for GFAT1 and VNC loading control from representative tumor lysates. (F) Tumor volume and tumor weight from samples in E. (G) Tumor volume and tumor weight from parental TU8988T (n = 5) and GFAT1 knockout clones B9 (n = 8) and D10 (n = 4) implanted and grown orthotopically in the pancreas of immunocompromised mice. Error bars represent mean ± SD. n.s., non-significant; *p < 0.05; **p < 0.01; ***p < 0.001; ****p < 0.0001.
Figure 1—figure supplement 1
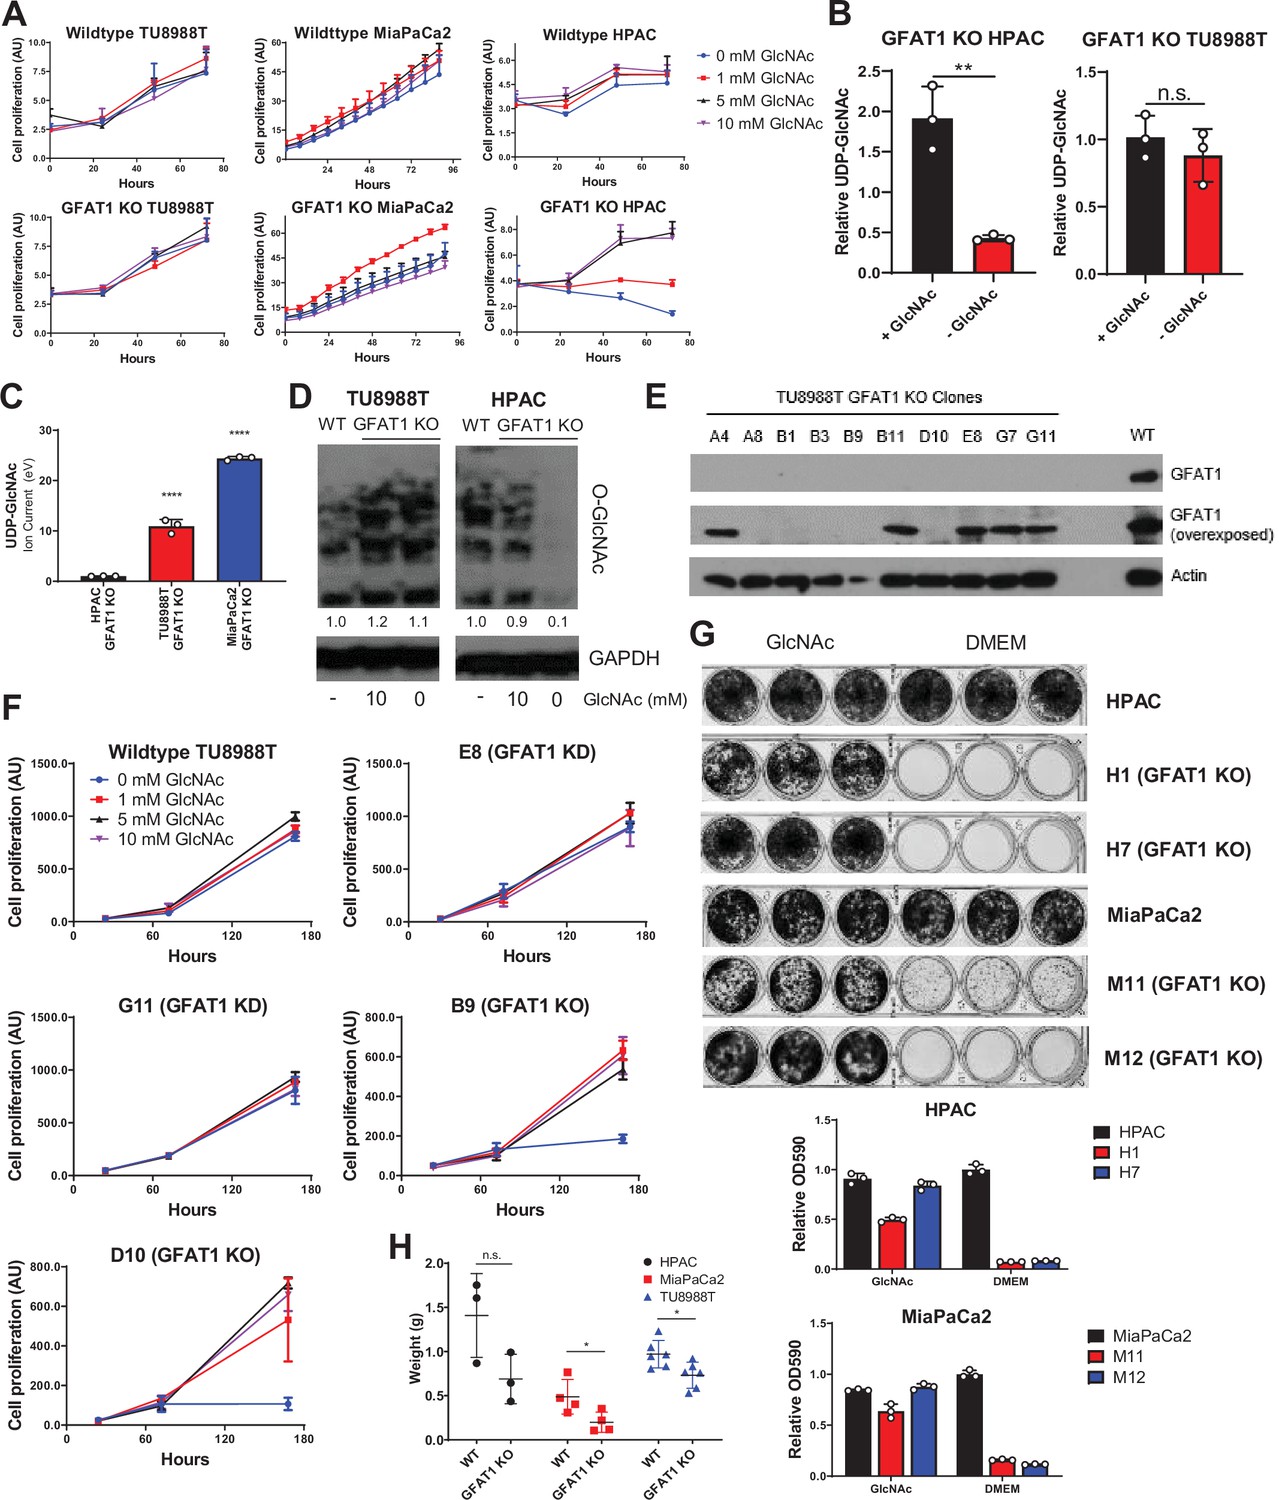
Additional characterization of GFAT1 knockout pancreatic ductal adenocarcinoma (PDA) populations and clonal lines.
(A) Proliferation kinetics of parental PDA cell lines and corresponding pooled populations of GFAT1 knockout cells supplemented with varying concentrations of N-acetyl-glucosamine (GlcNAc) (n = 3). Cell quantity was assessed by Cyquant (DNA intercalating dye) and plotted in absorbance units (AU). (B,C) UDP-GlcNAc levels measured by liquid chromatography-coupled tandem mass spectrometry (LC-MS/MS) in (B) TU8988T and HPAC GFAT1 knockout lines in the presence or absence of 10 mM GlcNAc for 3 days, presented as relative abundance (n = 3), and (C) TU8988T, HPAC, and MiaPaCa2 GFAT1 knockout cells grown without GlcNAc for 3 days (n = 3), presented as relative ion abundance. (D) Western blot of proteome O-GlcNAc and loading control GAPDH in parental and GFAT1 knockout TU8988T and HPAC. GFAT1 knockout lines were grown in the presence or absence of 10 mM GlcNAc for 3 days. (E) Western blot for GFAT1, at short and long exposure, and ACTIN loading control in a panel of clonal cell lines selected from the pooled population of GFAT1 knockout TU8988T cells. (F) Proliferation kinetics of parental TU8988T (GFAT1 WT) and clonal cell lines E8, G11, B9, and D10 selected from the pooled GFAT1 knockout population supplemented with varying concentrations of GlcNAc (n = 3). Clones correspond to those in the western blot in E. Cell quantity was assessed by cell titer glo and plotted in relative fluorescent units (RFU). (G) Representative wells from proliferation assay in parental and two GFAT1 knockout clonal HPAC and MiaPaCa2 cell lines. At bottom, data are quantitated by crystal violet extraction and measurement of optical density (OD) at 590 nm, n = 3. (H) Tumors from parental (n = 3) and GFAT1 knockout (n = 3) HPAC; parental (n = 4) and GFAT1 knockout (n = 4) MiaPaCa2; and parental (n = 6) and GFAT1 knockout (n = 6) TU8988T cell lines grown subcutaneously in immunocompromised mice. Error bars represent mean ± SD. n.s., non-significant; *p < 0.05; **p < 0.01; ****p < 0.0001.
Figure 2 with 1 supplement
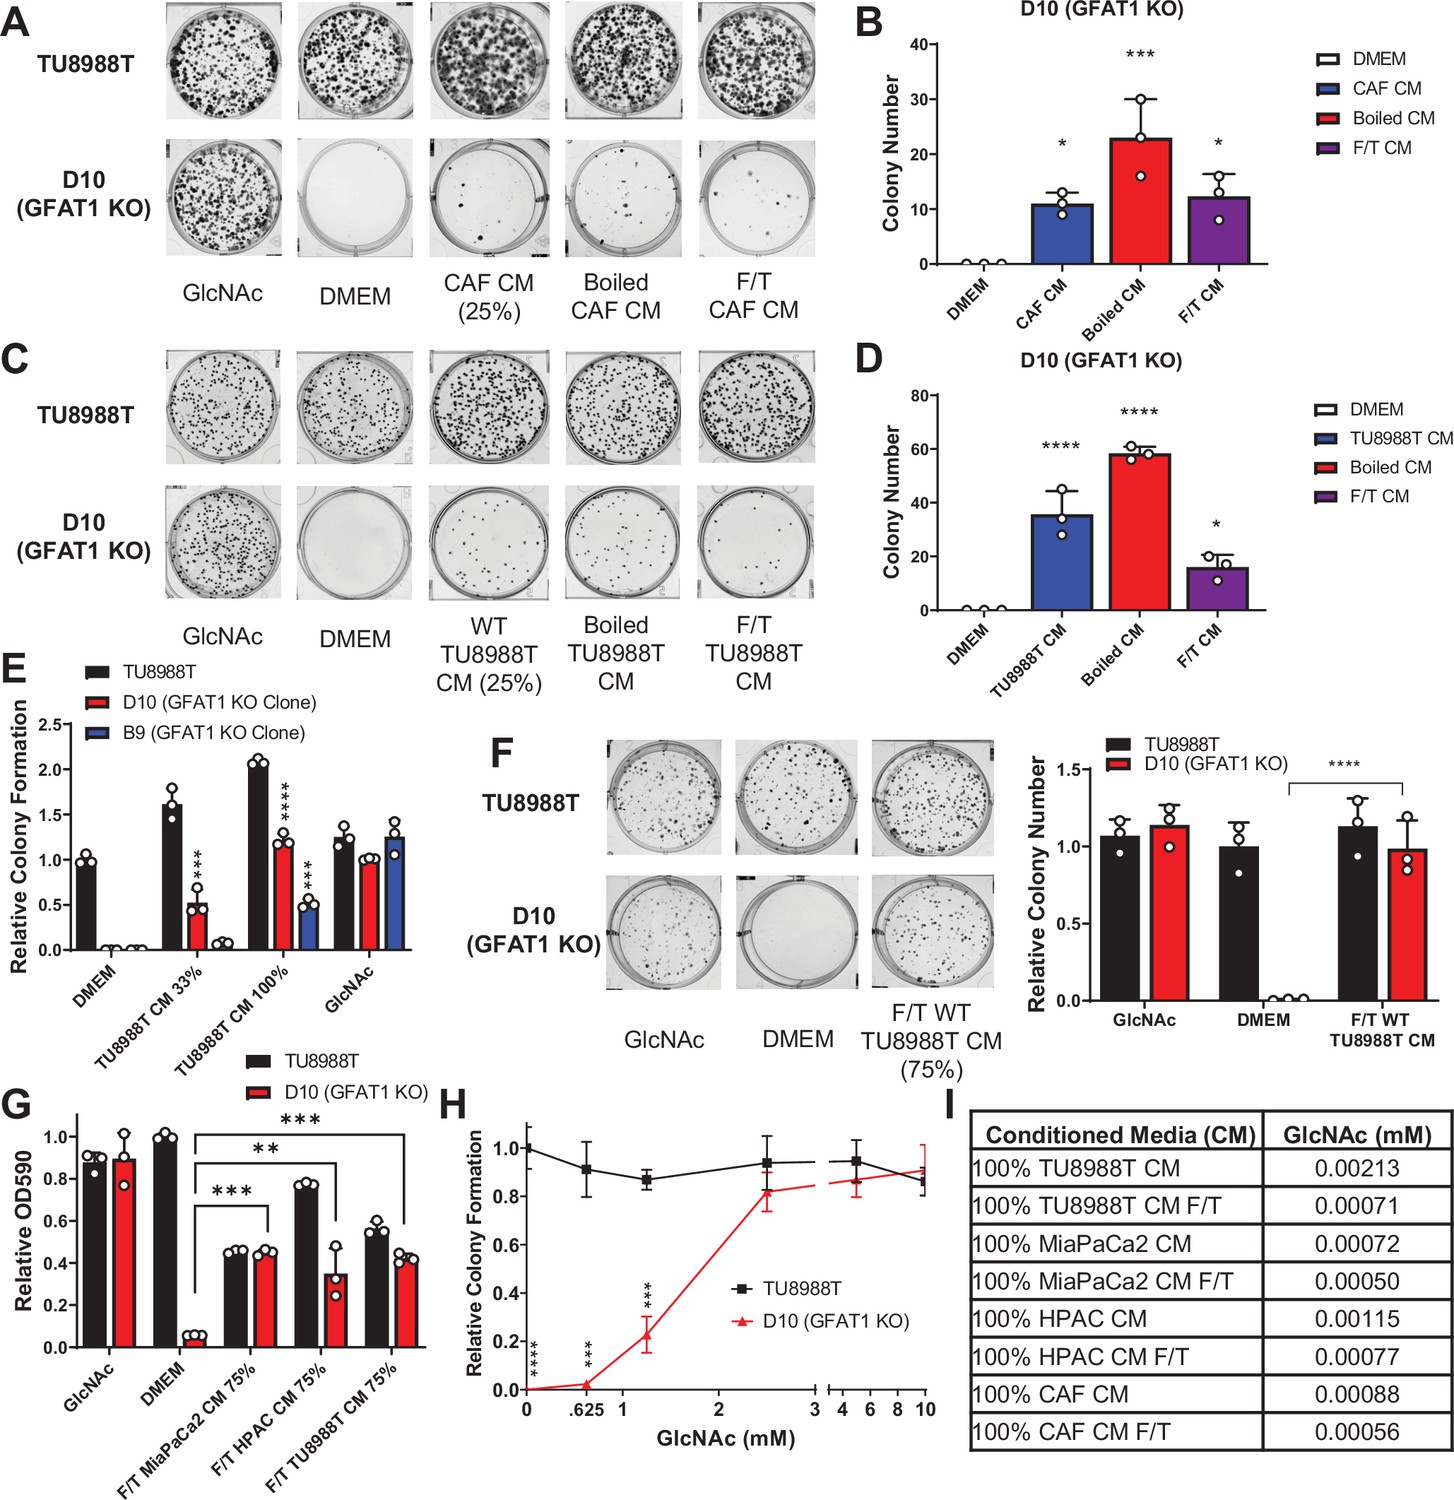
Conditioned media (CM) from cancer-associated fibroblasts (CAFs) and wild-type pancreatic ductal adenocarcinoma (PDA) cells support proliferation of GFAT1 knockout cells.
(A) Representative wells from a colony-forming assay in parental TU8988T and GFAT1 knockout clonal line D10 in 10 mM N-acetyl-glucosamine (GlcNAc), base media (DMEM), or base media supplemented 1:3 (25%) with CAF CM, boiled CAF CM, or CAF CM subject to freeze-thaw (F/T). (B) Quantitation of colonies from data in A (n = 3). (C) Representative wells from a colony-forming assay in parental TU8988T and GFAT1 knockout clonal line D10 in 10 mM GlcNAc, DMEM, or base media supplemented 1:3 (25%) with CM from wildtype TU8988T cells, boiled TU8988T CM, or TU8988T CM subject to F/T. (D) Quantitation of colonies from data in C (n = 3). (E) Quantitation of colony-forming assay data of parental and GFAT1 knockout clonal TU8988T lines in base media, positive control GlcNAc, wildtype TU8988T CM diluted 1:2 (33%) or used directly (100%) (n = 3). (F) Representative wells and quantitation of colony-forming assay data of parental and GFAT1 knockout clonal TU8988T lines in base media, positive control GlcNAc, and wildtype TU8988T CM subject to F/T and diluted 3:1 (75%) (n = 3). (G) Quantitation of colony-forming assay data of parental and GFAT1 knockout clonal TU8988T lines in base media, positive control GlcNAc, or wildtype TU8988T, HPAC, or MiaPaCa2 CM subject to F/T and diluted 3:1 (75%) (n = 3). (H) GlcNAc dose response curve presented as relative colony number for parental and GFAT1 knockout TU8988T cells (n = 3). (I) Mean of absolute quantitation of GlcNAc in various CM by liquid chromatography-coupled tandem mass spectrometry (LC-MS/MS) (n = 3). Error bars represent mean ± SD. *p < 0.05; **p < 0.01; ***p < 0.001; ****p < 0.0001.
Figure 2—figure supplement 1
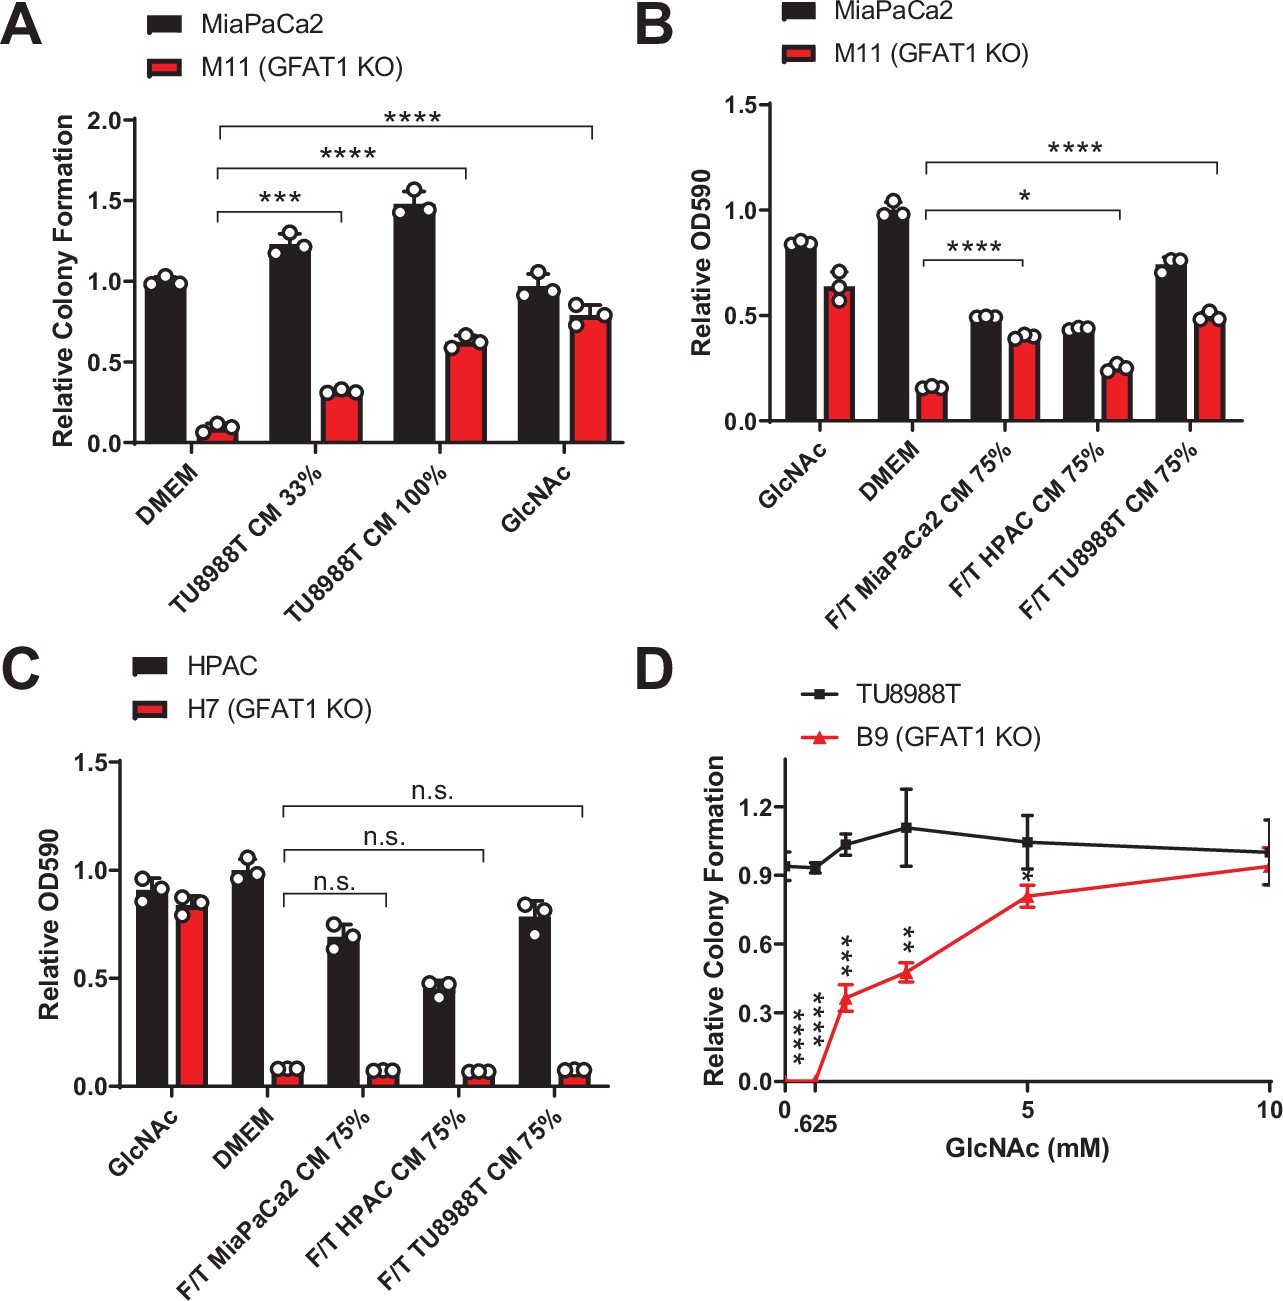
Rescue activity of conditioned media (CM) and N-acetyl-glucosamine (GlcNAc) in GFAT1 knockout cells.
(A) Quantitation of colony-forming assay data of parental MiaPaCa2 and GFAT1 knockout clonal line M11 in base media (DMEM), positive control GlcNAc, wildtype TU8988T CM diluted 1:2 (33%) or used directly (100%) (n = 3). (B,C) Quantitation of proliferation assay data of (B) parental MiaPaCa2 and GFAT1 knockout clonal line M11 and (C) parental HPAC and GFAT1 knockout clonal line H7 in base media (DMEM), positive control GlcNAc, or wildtype TU8988T, HPAC, or MiaPaCa2 CM diluted 3:1 (75%) that was subjected to freeze-thaw (F/T) (n = 3). Data represent crystal violet extracted from cells at endpoint and measured by optical density (OD) at 590 nm. (D) GlcNAc dose response curve presented as relative colony number for parental TU8988T cells and GFAT1 knockout clonal line B9 (n = 3). Error bars represent mean ± SD. n.s., non-significant; *p < 0.05; **p < 0.01; ***p < 0.001; ****p < 0.0001.
Figure 3 with 2 supplements
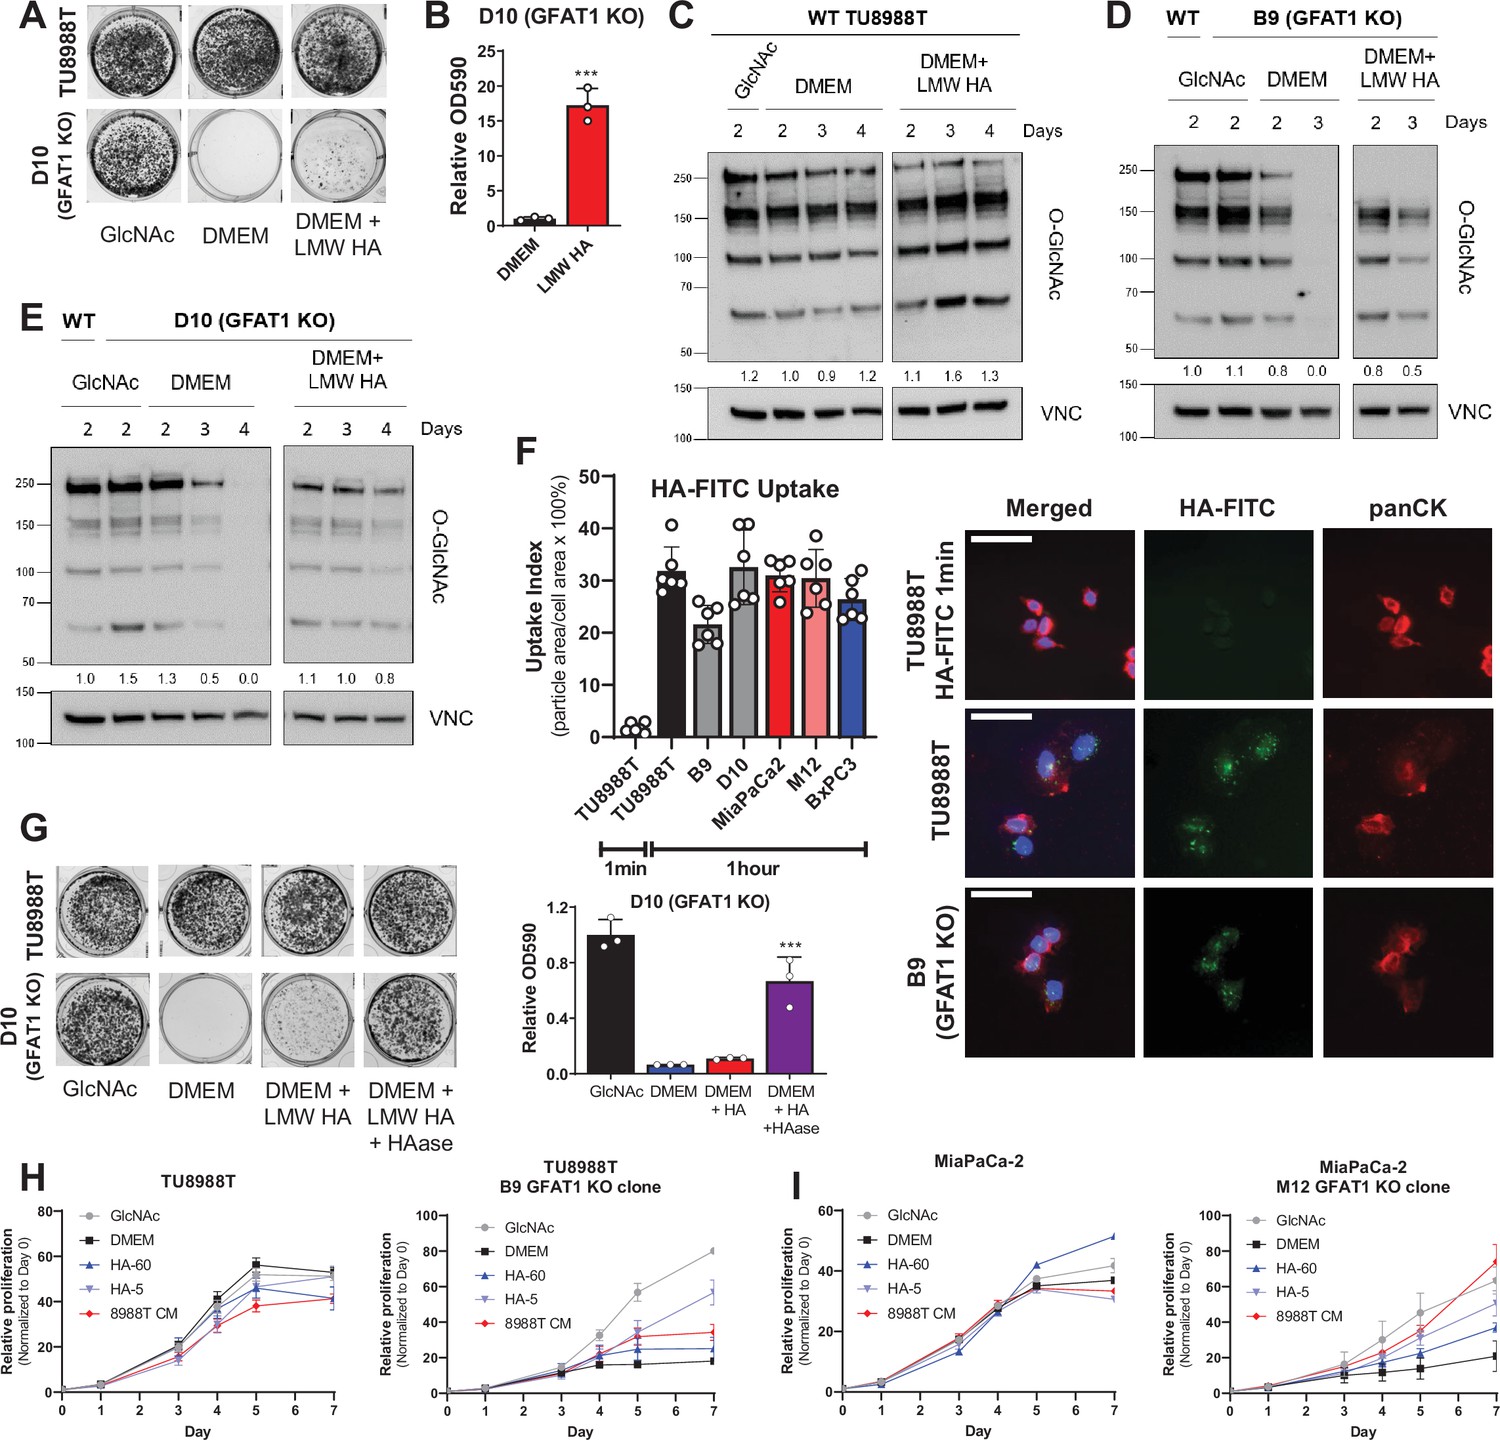
Hyaluronic acid rescues GFAT1 knockout pancreatic ductal adenocarcinoma (PDA) cells.
(A) Representative wells from a colony-forming assay in parental and clonally derived GFAT1 knockout TU8988T cell lines grown in base media (DMEM), positive control N-acetyl-glucosamine (GlcNAc) (10 mM), or low molecular weight (LMW) hyaluronic acid (78 kDa HA, 10 mM). (B) Quantitation of data from A (n = 3). (C) Western blot of proteome O-GlcNAc and loading control VINCULIN (VNC) in parental TU8988T cells grown in base media (DMEM) plus GlcNAc or LMW HA for the indicated time points. Band density was quantitated, normalized to control, and presented below the blot. (D,E) Western blot of proteome O-GlcNAc and loading control VNC in GFAT1 knockout clonal lines (D) B9 and (E) D10 in base media (DMEM) plus GlcNAc or LMW HA for the indicated time points. Wildtype (WT) TU8988T included as control. Band density was quantitated, normalized to control, and presented below the blot. (F) Quantitation of HA-FITC uptake in wildtype (TU8988T, MiaPaCa2, BxPC3) and GFAT1 knockout clones (B9, D10, M12) presented as percent total particle area over total cell area at 1 min or 1 hr; n = 6 frames per condition. Cell area was calculated by staining for pan-cytokeratin (panCK). At right, representative images. Scale bar, 50 µm. (G) Representative wells of a proliferation assay in parental TU8988T and GFAT1 knockout clonal line D10 grown in base media (DMEM), positive control GlcNAc (10 mM), or base media supplemented 1:1 with boiled LMW HA (10 mM) with and without pre-digestion with hyaluronidase (HAase). At endpoint, cells are stained with crystal violet, and the stain was then extracted and quantitated by OD at 590 nm (n = 3). (H,I) Proliferation time course, as measured on the Incucyte, of (H) TU8988T and (I) MiaPaCa parental and GFAT1 knockout cells in base media (DMEM), positive control (GlcNAc), 60 kDa HA (LMW HA), 5 kDa HA (o-HA), or wildtype TU8988T CM (n = 3). Error bars represent mean ± SD. ***p < 0.001.
Figure 3—figure supplement 1
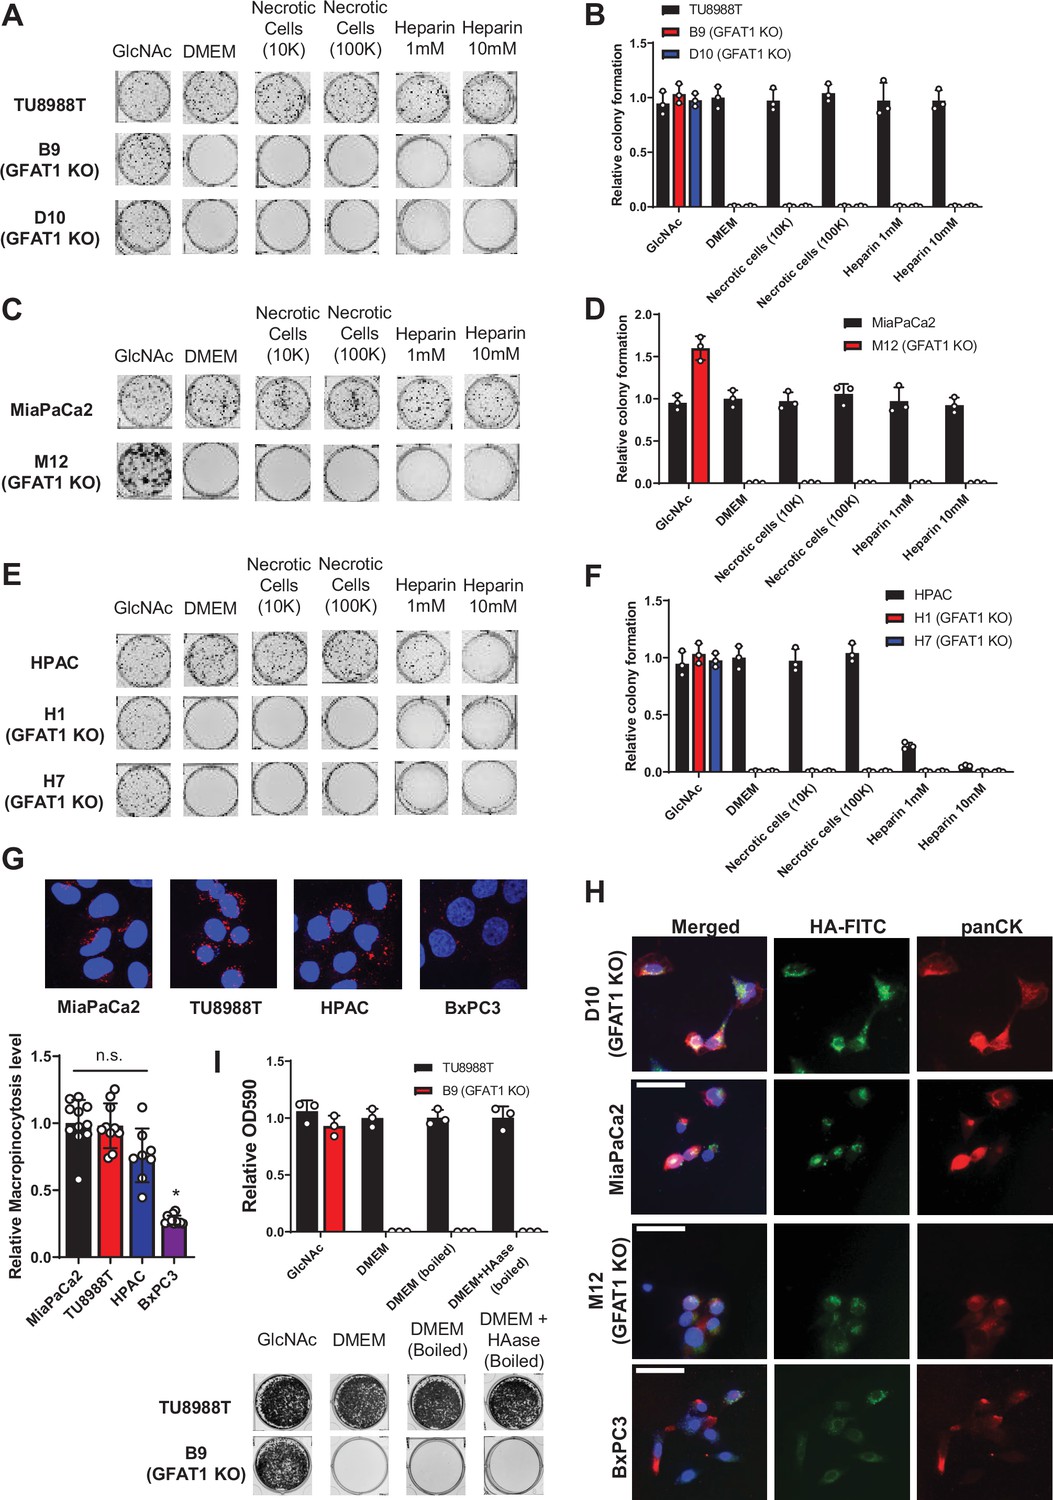
Characterization of macropinocytosis and glycosaminoglycan rescue activity in pancreatic ductal adenocarcinoma (PDA) and GFAT1 knockout cells.
(A–F) Representative colony formation assays and their quantitation following treatment with two concentrations of heparin or necrotic cell debris that contain complete cellular contents, relative to base media (DMEM) and positive control N-acetyl-glucosamine (GlcNAc) in (A,B) parental and GFAT1 knockout TU8988T, (C,D) parental and GFAT1 knockout MiaPaCa2, and (E,F) parental and GFAT1 knockout HPAC. (G) Immunostaining images of intracellular fluorescently tagged dextran (red) engulfed by macropinocytosis in PDA cell lines. Nuclear DAPI staining in blue. Quantitation of macropinocytotic index presented at bottom for n = 6 wells per biological replicate (n = 3). (H) Representative images for the data presented in Figure 3F. HA-FITC is presented in green with pan-cytokeratin (panCK) in red. Nuclear staining with DAPI in blue. Scale bar, 50 µm. (I) Quantitated data are presented above representative wells from a proliferation assay in parental TU8988T and GFAT1 knockout clone B9 in 10 mM GlcNAc, base media (DMEM), base media supplemented 1:1 with boiled DMEM, or base media supplemented 1:1 with boiled HAase-treated DMEM. Quantitated data represent crystal violet extracted from cells at endpoint and measured by optical density (OD) at 590 nm (n = 3). Error bars represent mean ± SD. n.s., non-significant; *p < 0.05.
Figure 3—figure supplement 2
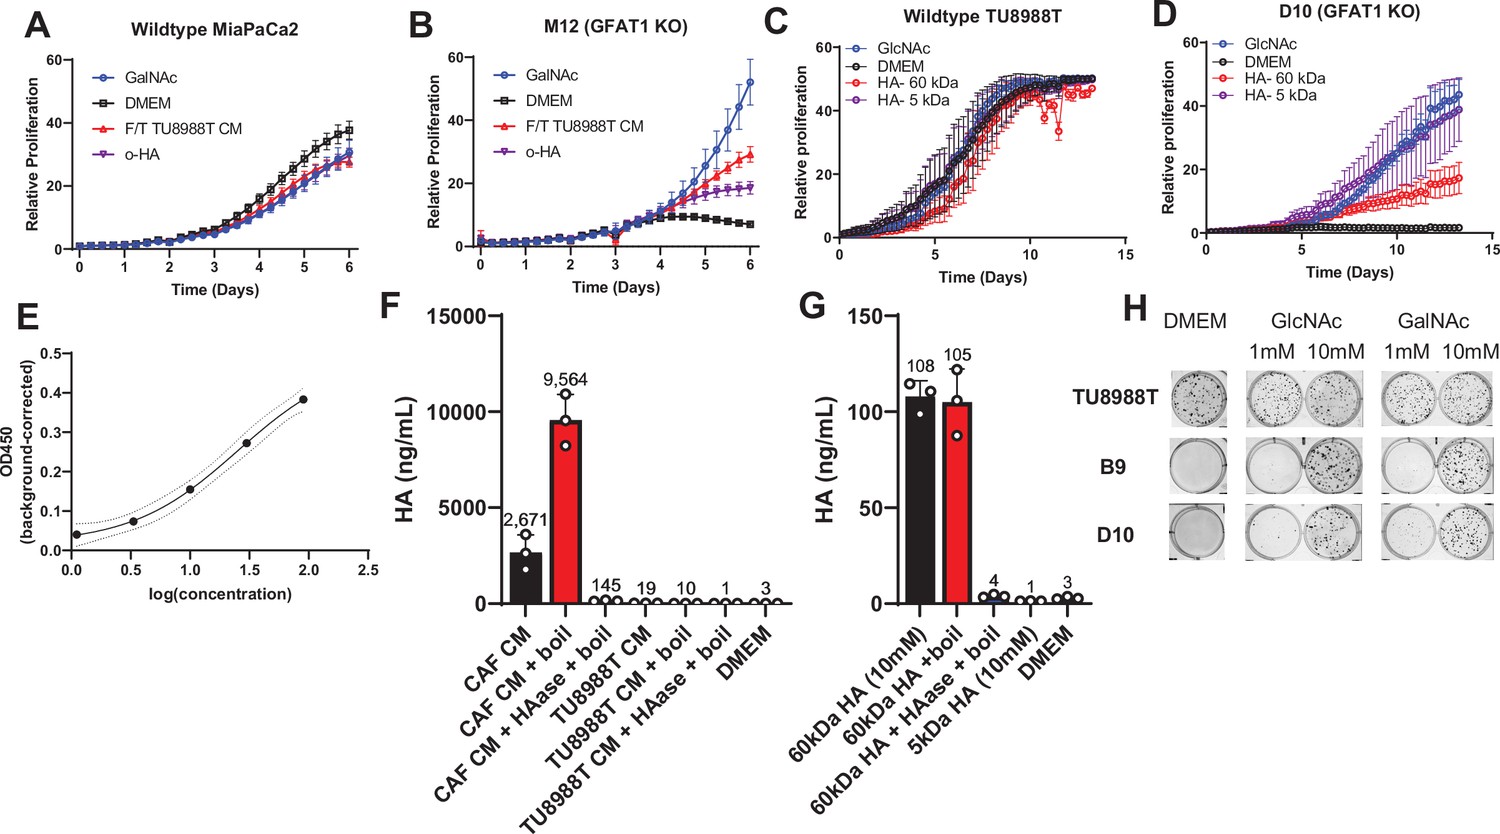
Analysis of hyaluronic acid formulation on GFAT1 rescue and composition in conditioned media (CM).
(A,B) Proliferation time course of (A) parental MiaPaCa2 and (B) GFAT1 knockout cells in base media (DMEM), positive control (N-acetyl-glucosamine [GlcNAc]), 5 kDa HA (oligo-hyaluronic acid [o-HA]), or wildtype TU8988T CM subject to freeze-thaw (F/T) (n = 3). (C,D) Proliferation time course of (C) parental TU8988T and (D) GFAT1 knockout cells in base media (DMEM), positive control (GlcNAc), 60 kDa HA (LMW HA), or 5 kDa HA (o-HA).(E) Dynamic range of HA detection by enzyme-linked immunosorbent assay (ELISA), employed to quantitate HA. (F) HA content in cancer-associated fibroblast (CAF) and wildtype TU8988T CM, that treated with HAase, and that treated with boiled HAase, relative to DMEM alone negative control. (G) Detection of 10 mM 60 kDa and 5 kDa HA standard and 60 kDa standard treated with HAase, as well as that treated with boiled HAase, relative to DMEM alone negative control. (H) Representative wells from colony formation assays in parental and GFAT1 knockout clonal TU8988T cell lines in base media (DMEM), positive control GlcNAc, and N-acetyl-galactosamine (GalNAc). Quantitated data are presented in Figure 5F. Error bars represent mean ± SD.
Figure 4
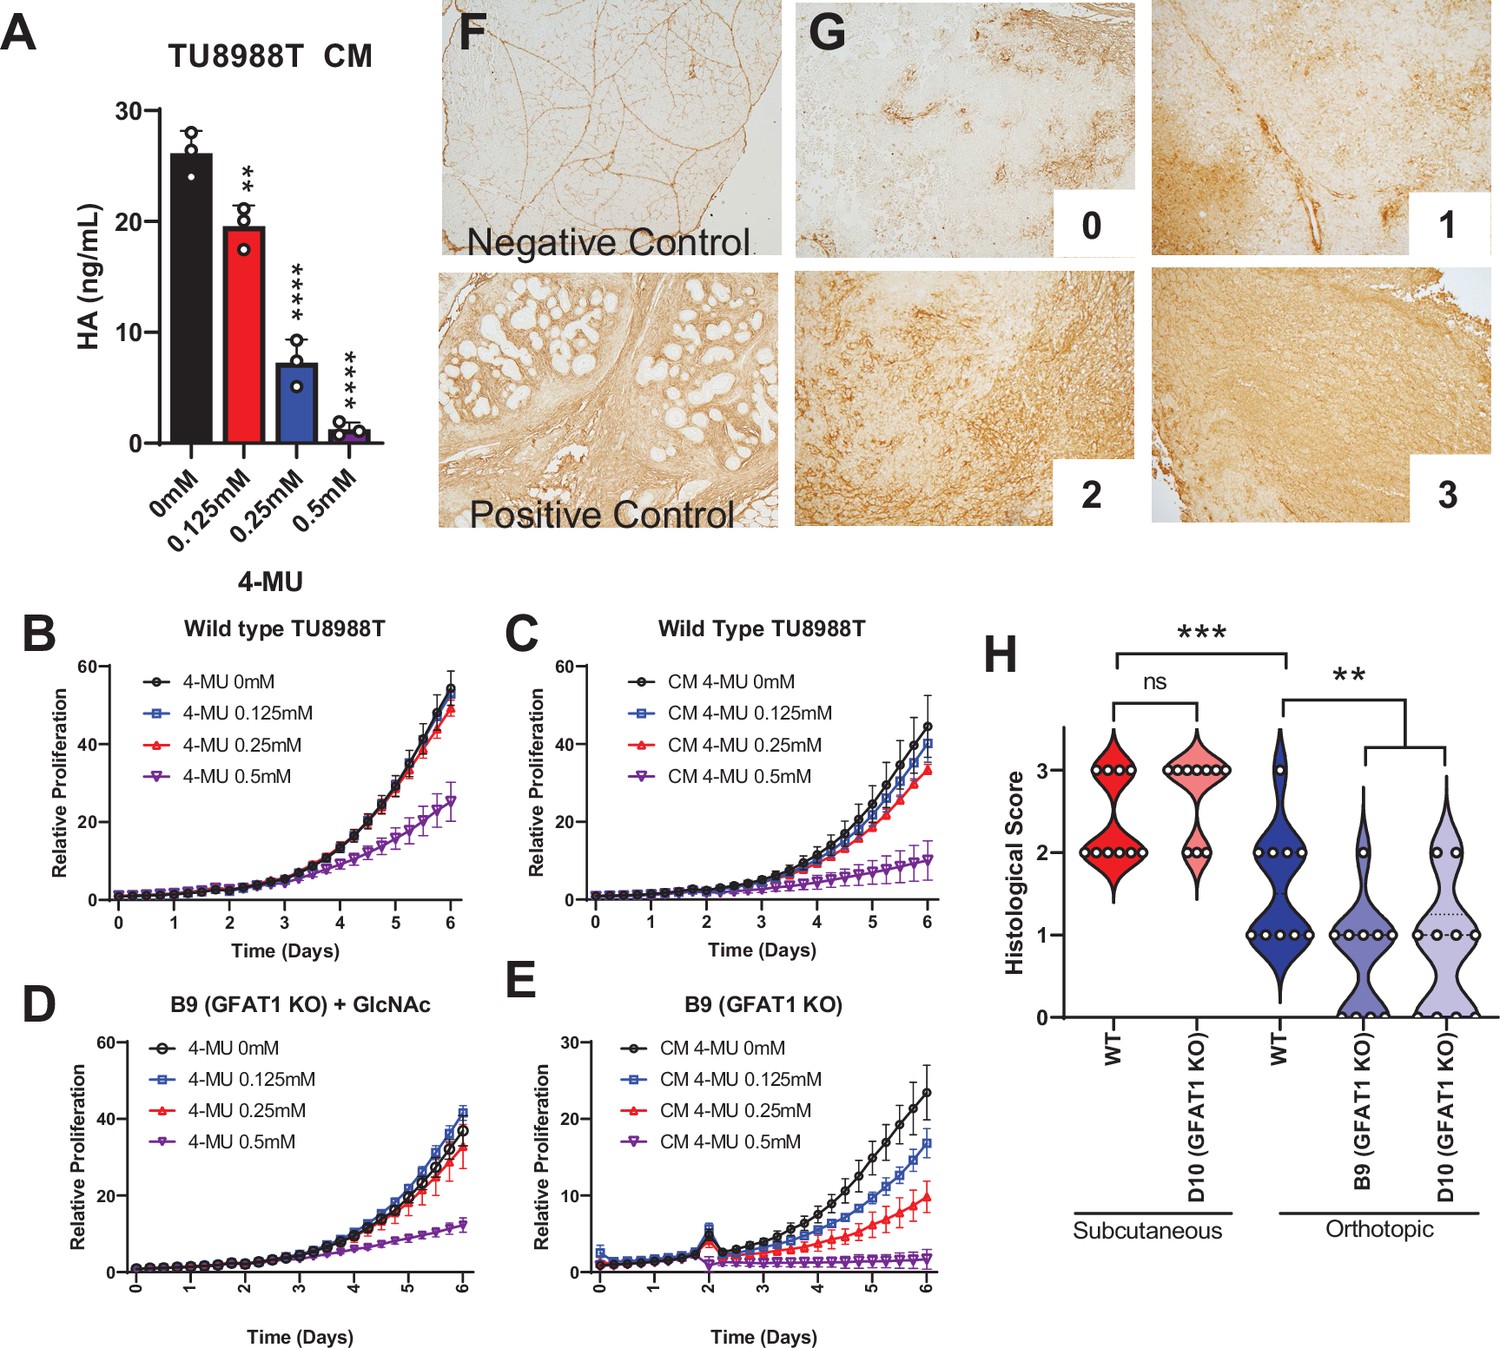
Hyaluronic acid in conditioned media (CM) rescues GFAT1 knockout.
(A) Quantification of hyaluronic acid (HA) in CM from wildtype TU8988T cells treated with varying doses of 4-methylumbelliferone (4-MU) (n = 3). (B–E) Proliferation time course of (B,C) wildtype (WT) TU8988T and (D,E) GFAT1 knockout TU8988T grown (B,D) directly in varying concentrations of 4-MU or (C,E) in CM from WT TU8988T cells exposed to 4-MU during media conditioning. GFAT1 knockout cells in (D) were propagated in N-acetyl-glucosamine (GlcNAc) to maintain viability (n = 3 for all cell lines and conditions). (F) HA binding protein (HABP) staining of normal murine pancreas (negative control) and a murine pancreatic tumor (positive control). (G) Representative images for HABP staining classification used in H. (H) 10 representative slides from WT and GFAT1 knockout subcutaneous and orthotopic tumors (Figure 1F and G) were stained and blindly scored using the classification metric in G (n = 10). Error bars represent mean ± SD. *p < 0.05; **p < 0.01; ***p < 0.001; ****p < 0.0001.
Figure 5 with 1 supplement
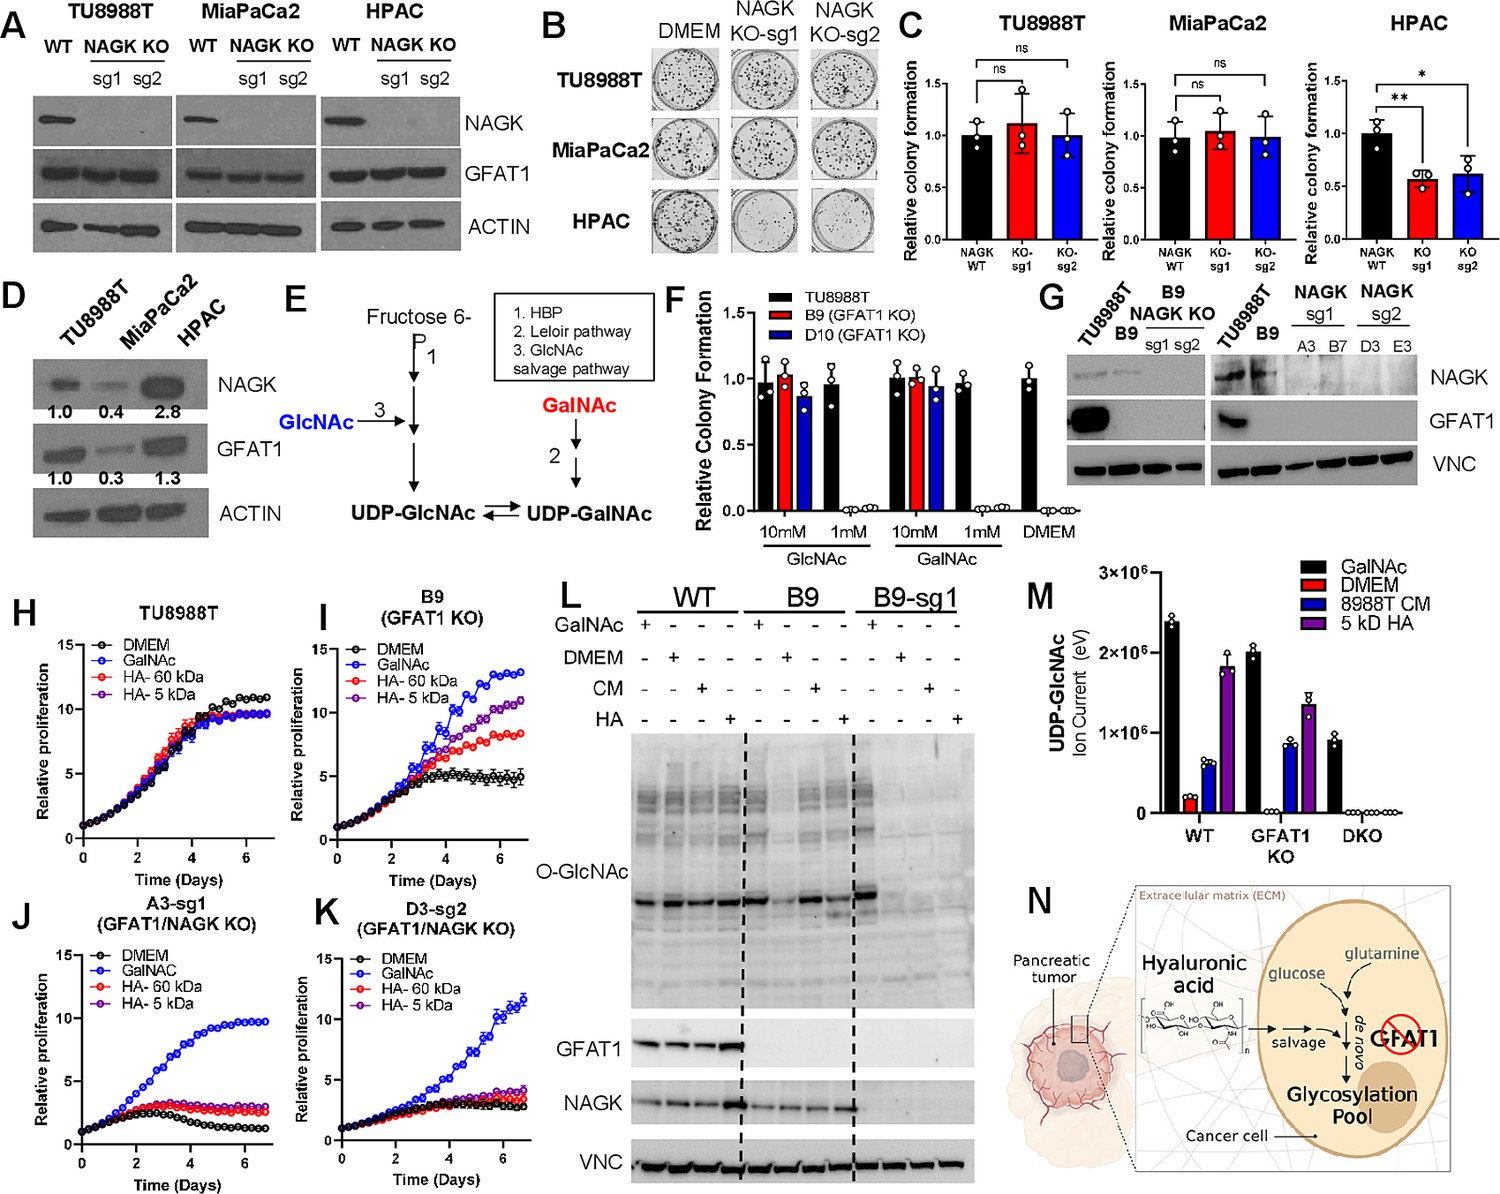
Hyaluronic acid-derived N-acetyl-glucosamine (GlcNAc) rescues GFAT1 loss via the GlcNAc salvage pathway.
(A) Western blot of NAGK, GFAT1, and ACTIN loading control from TU8988T, MiaPaCa2, and HPAC parental (wildtype, WT) and NAGK knockout (KO) populations. NAGK was knocked out using two independent sgRNAs (sg1, sg2). (B) Representative wells from a colony-forming assay for parental and NAGK knockout lines. (C) Quantitation of colony-forming assay data in B (n = 3). (D) Western blot for NAGK, GFAT1, and loading control ACTIN in parental pancreatic ductal adenocarcinoma (PDA) cell lines. Band density was quantitated, normalized to control, and presented below the blot. (E) Schematic overview of the Leloir pathway of galactose catabolism integrated with the hexosamine biosynthetic pathway (HBP) and GlcNAc salvage pathway. (F) Quantitated data from colony formation assays in parental and GFAT1 knockout clonal TU8988T cell lines in base media (DMEM), positive control GlcNAc, and N-acetyl-galactosamine (GalNAc) (n = 3) (G) Western blot for GFAT1, NAGK, and loading control VINCULIN (VNC) in parental TU8988T and HPAC, GFAT1 knockout clones, and GFAT/NAGK double targeted lines. (H–K) Proliferation time course of (H,I) parental TU8988T and GFAT1 knockout line B9 in base media, GalNAc positive control, 60 kDa HA, or 5 kDa HA; (J,K) GFAT1/NAGK double targeted clones in base media, GalNAc positive control, 60 kDa HA, or 5 kDa hyaluronic acid (HA) (n = 3). (L) Western blot for proteome O-GlcNAcylation (O-GlcNAc), GFAT1, NAGK, and VCN in parental (WT), GFAT1 knockout (B9), and GFAT1/NAGK double knockout (B9–sg1) TU8988T cells treated with 10 mM GalNAc, DMEM, CM, or o-HA. (M) Liquid chromatography-coupled tandem mass spectrometry (LC-MS/MS) analysis of UDP-GlcNAc from the samples in L (n = 3). (N) Schematic overview of the HA metabolism through the GlcNAc salvage pathway to fuel glycosylation in GFAT1 knockout PDA. Error bars represent mean ± SD. n.s., non-significant; *p < 0.05; **p < 0.01.
Figure 5—figure supplement 1
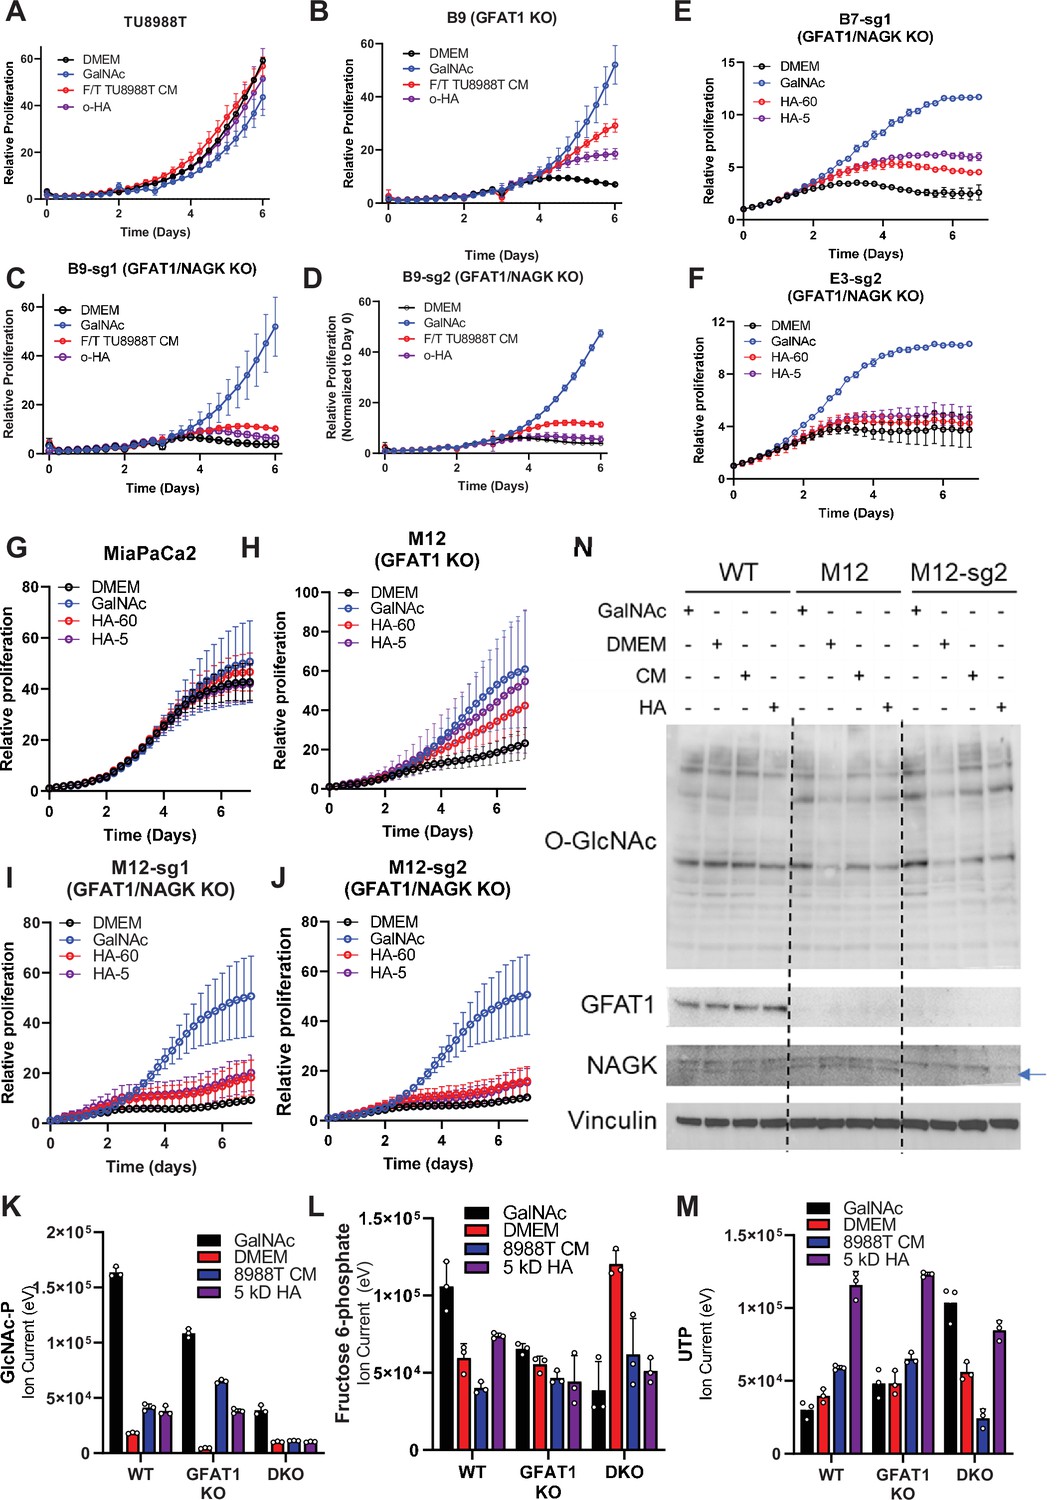
Additional characterization of hyaluronic acid (HA) rescue in GFAT1/NAGK double knockout cell lines.
(A–D) Proliferation time course of (A) parental TU8988T, (B) GFAT1 knockout cells, and (C,D) two GFAT1/NAGK double knockout cell lines in base media (DMEM), positive control (GlcNAc), 5 kDa HA (o-HA), or wildtype (WT) TU8988T conditioned media (CM) subject to freeze-thaw (F/T) (n = 3). (E,F) Proliferation time course of two additional GFAT1/NAGK double knockout cells lines from main text Figure 5H–K in base media (DMEM), positive control (GalNAc), 5 kDa HA (o-HA), or 60 kDa HA (n = 3). (G–J) Proliferation time course of (G) WT MiaPaCa2, (H) GFAT1 knockout line M12, and (I,J) GFAT1/NAGK double knockout cells in base media, GalNAc positive control, 60 kDa HA, or 5 kDa o-HA (n = 3). (K–M) Liquid chromatography-coupled tandem mass spectrometry (LC-MS/MS) analysis of (K) N-acetyl-glucosamine (GlcNAc)-phosphate (GlcNAc-P), (L) fructose 6-phosphate, and (M) uridine triphosphate from the samples in Figure 5L (n = 3). (N) Western blot for proteome O-GlcNAcylation (O-GlcNAc), GFAT1, NAGK, and VCN in parental (WT), GFAT1 knockout (M12) and GFAT1/NAGK double knockout MiaPaCa2 cells treated with 10 mM GalNAc, DMEM, CM, or o-HA. The NAGK band appears below a non-specific band, as indicated by the blue arrow. Error bars represent mean ± SD.
Additional files
-
Source data 1
Raw western blot images.
- https://cdn.elifesciences.org/articles/62645/elife-62645-supp1-v3.docx
-
Transparent reporting form
- https://cdn.elifesciences.org/articles/62645/elife-62645-transrepform1-v3.docx
Download links
A two-part list of links to download the article, or parts of the article, in various formats.
Downloads (link to download the article as PDF)
Open citations (links to open the citations from this article in various online reference manager services)
Cite this article (links to download the citations from this article in formats compatible with various reference manager tools)
Hyaluronic acid fuels pancreatic cancer cell growth
eLife 10:e62645.
https://doi.org/10.7554/eLife.62645


