Phylogenomics of white-eyes, a ‘great speciator’, reveals Indonesian archipelago as the center of lineage diversity
- National University of Singapore, Department of Biological Sciences, Singapore
- Max Planck Institute for Ornithology, Germany
- Division of Zoology, Research Center for Biology, Indonesian Institute of Sciences (LIPI), Cibinong Science Center, Indonesia
- Department of Bioinformatics and Genetics, Swedish Museum of Natural History, Sweden
- Key Laboratory of Zoological Systematics and Evolution, Institute of Zoology, Chinese Academy of Sciences, China
- Center for Excellence in Animal Evolution and Genetics, Chinese Academy of Sciences, China
- Museum of Vertebrate Zoology and Department of Integrative Biology, University of California, Berkeley, United States
- Wildlife Reserves Singapore, Singapore
- University of Western Australia, School of Biological Sciences, Australia
- University of Southampton, School of Biological Sciences, University, United Kingdom
- Sciences Department, Museums Victoria, Australia
- Faculty of Veterinary Medicine, Universitas Syiah Kuala, Indonesia
- Jiangsu Key Laboratory of Phylogenomics and Comparative Genomics, School of Life Sciences, Jiangsu Normal University, China
- Department of Biochemistry and Molecular Biology, 2011 Collaborative Innovation Center of Tianjin for Medical Epigenetics, Tianjin Key Laboratory of Medical Epigenetics, School of Basic Medical Sciences, Tianjin Medical University, China
- Center for Tropical Veterinary Studies – One Health Collaboration Center, Universitas Syiah Kuala, Indonesia
- Museum of Vertebrate Zoology and Department of Environmental Science, Policy, and Management, University of California, Berkeley, United States
Figures
Figure 1
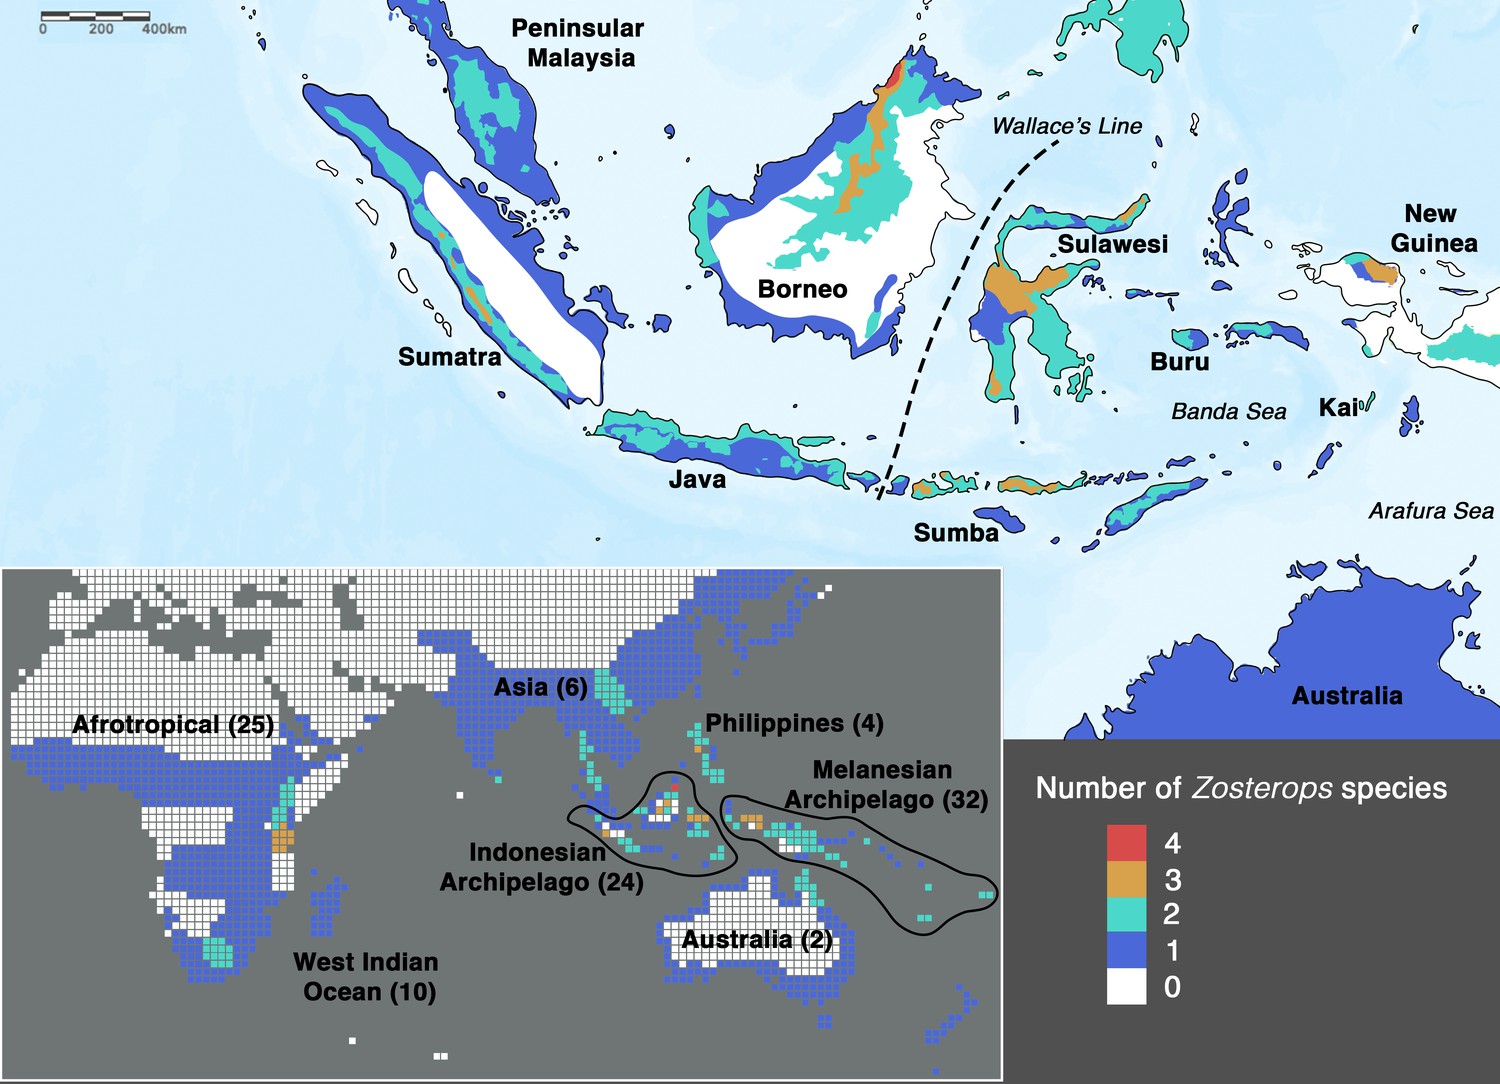
Species density map of the genus Zosterops across the Indonesian archipelago (main map) and across the entire distribution range (bottom left inset).
Islands referred to in the text are specifically labeled on the main map. The total number of Zosterops species is shown in brackets beside each labeled region on the inset. We adopted del Hoyo et al., 2016 as the baseline taxonomy and incorporated taxonomic revisions to the Afrotropical and Asiatic species as proposed by Martins et al., 2020 and Lim et al., 2019, respectively (see Supplementary file 2 for the list of recognized species).
Figure 2 with 3 supplements
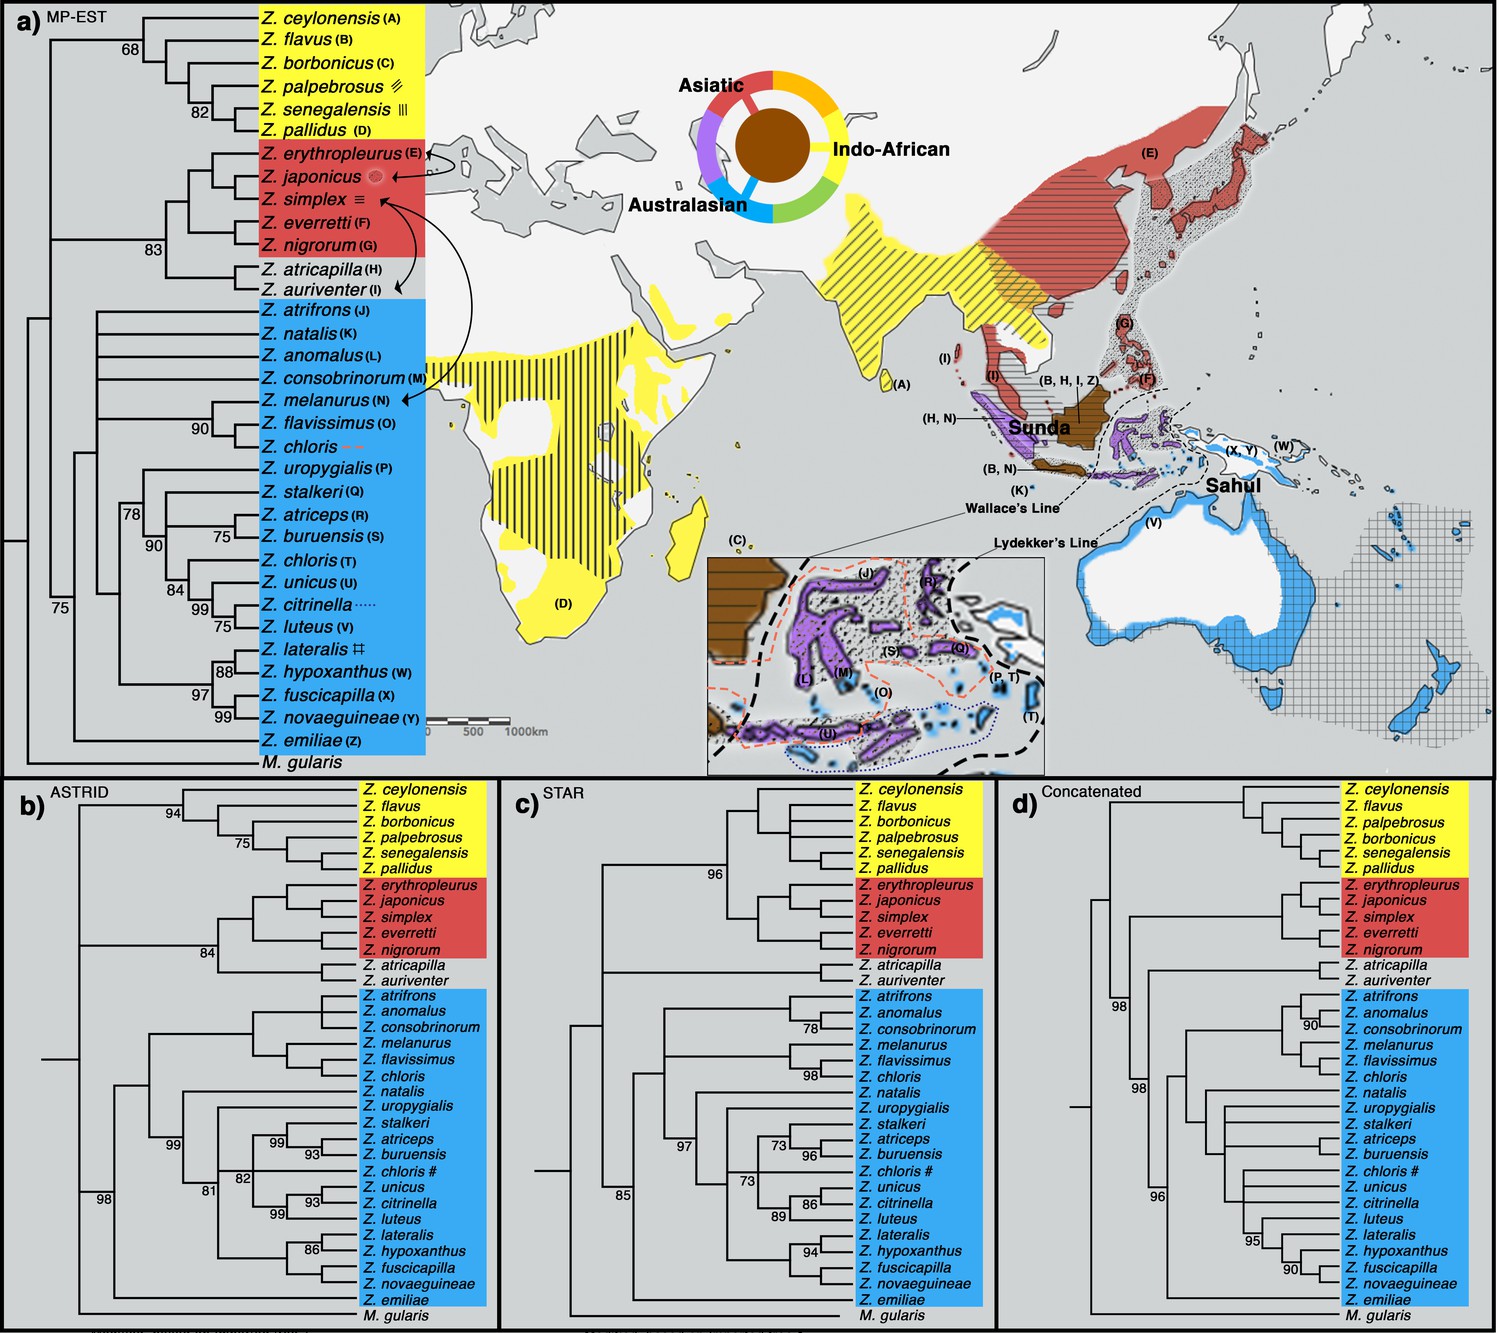
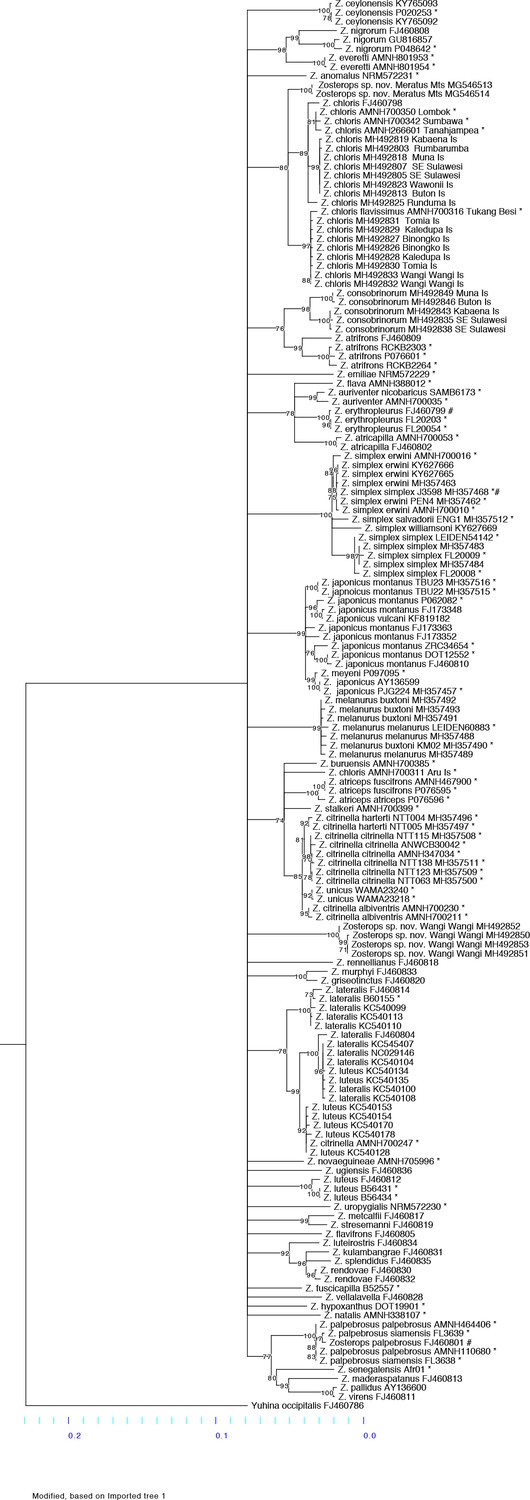
Phylogeny of Zosterops. Trees generated by (a) MP-EST, (b) ASTRID, (c) STAR and (d) the concatenation method (refer to Figure 2—figure supplement 1 for a full concatenated tree and Figure 2—figure supplement 2 for ancestral range estimation).
All nodes are supported by a bootstrap value of 100 unless otherwise stated. Nodes with less than 68% bootstrap support were collapsed. The three main clades are color-coded blue (Australasian), red (Asiatic), and yellow (Indo-African). (a) The distribution of each main clade is color coded on the map, and the distribution of each sampled taxon is depicted by matching letter or symbol. The map includes 30 taxa not sampled by the present study but shown by previous studies to be nested within any of the three main clades with high bootstrap support of at least 90%. Borneo and Java (shaded brown) each harbor taxa from all three main clades, while multiple islands across the rest of Indonesia (shaded purple) each harbor taxa from two main clades. Secondary gene flow detected in multiple species pairs is marked with black arrows on the tree. Refer to Figure 2—figure supplement 3 for a mitochondrial ND2 tree.
Figure 2—figure supplement 1
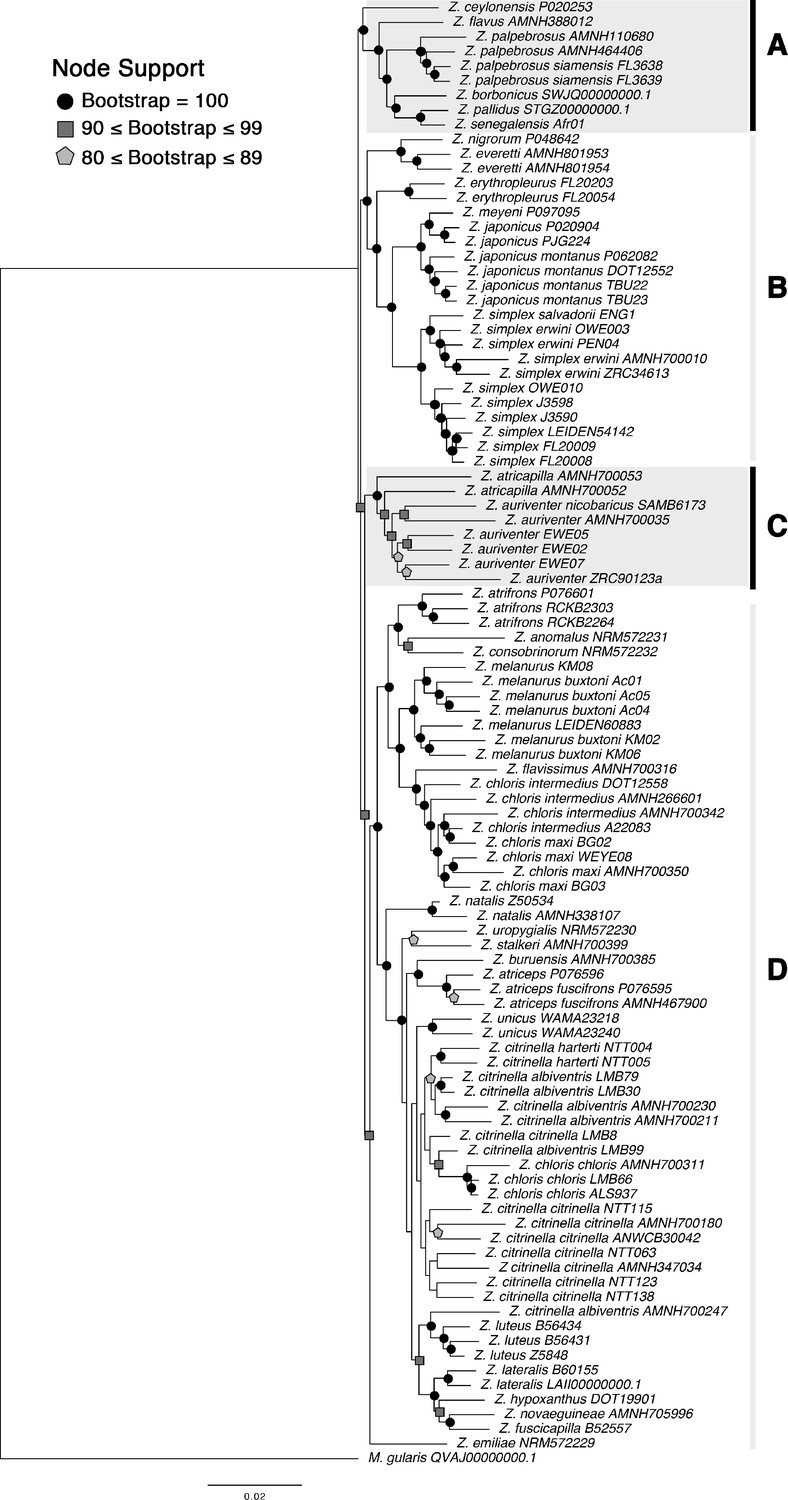
Maximum likelihood tree run with RAxML based on 770 concatenated loci.
Bootstrap support value for each node is denoted by symbols: black circle = 100; dark gray square ≥90, light gray polygon ≥80, while nodes without symbols are weakly supported (<80). Clades: (A) Indo-African group, (B) Asiatic group, (C) Sundaic taxa of incongruent placement, and (D) Australasian group.
Figure 2—figure supplement 2
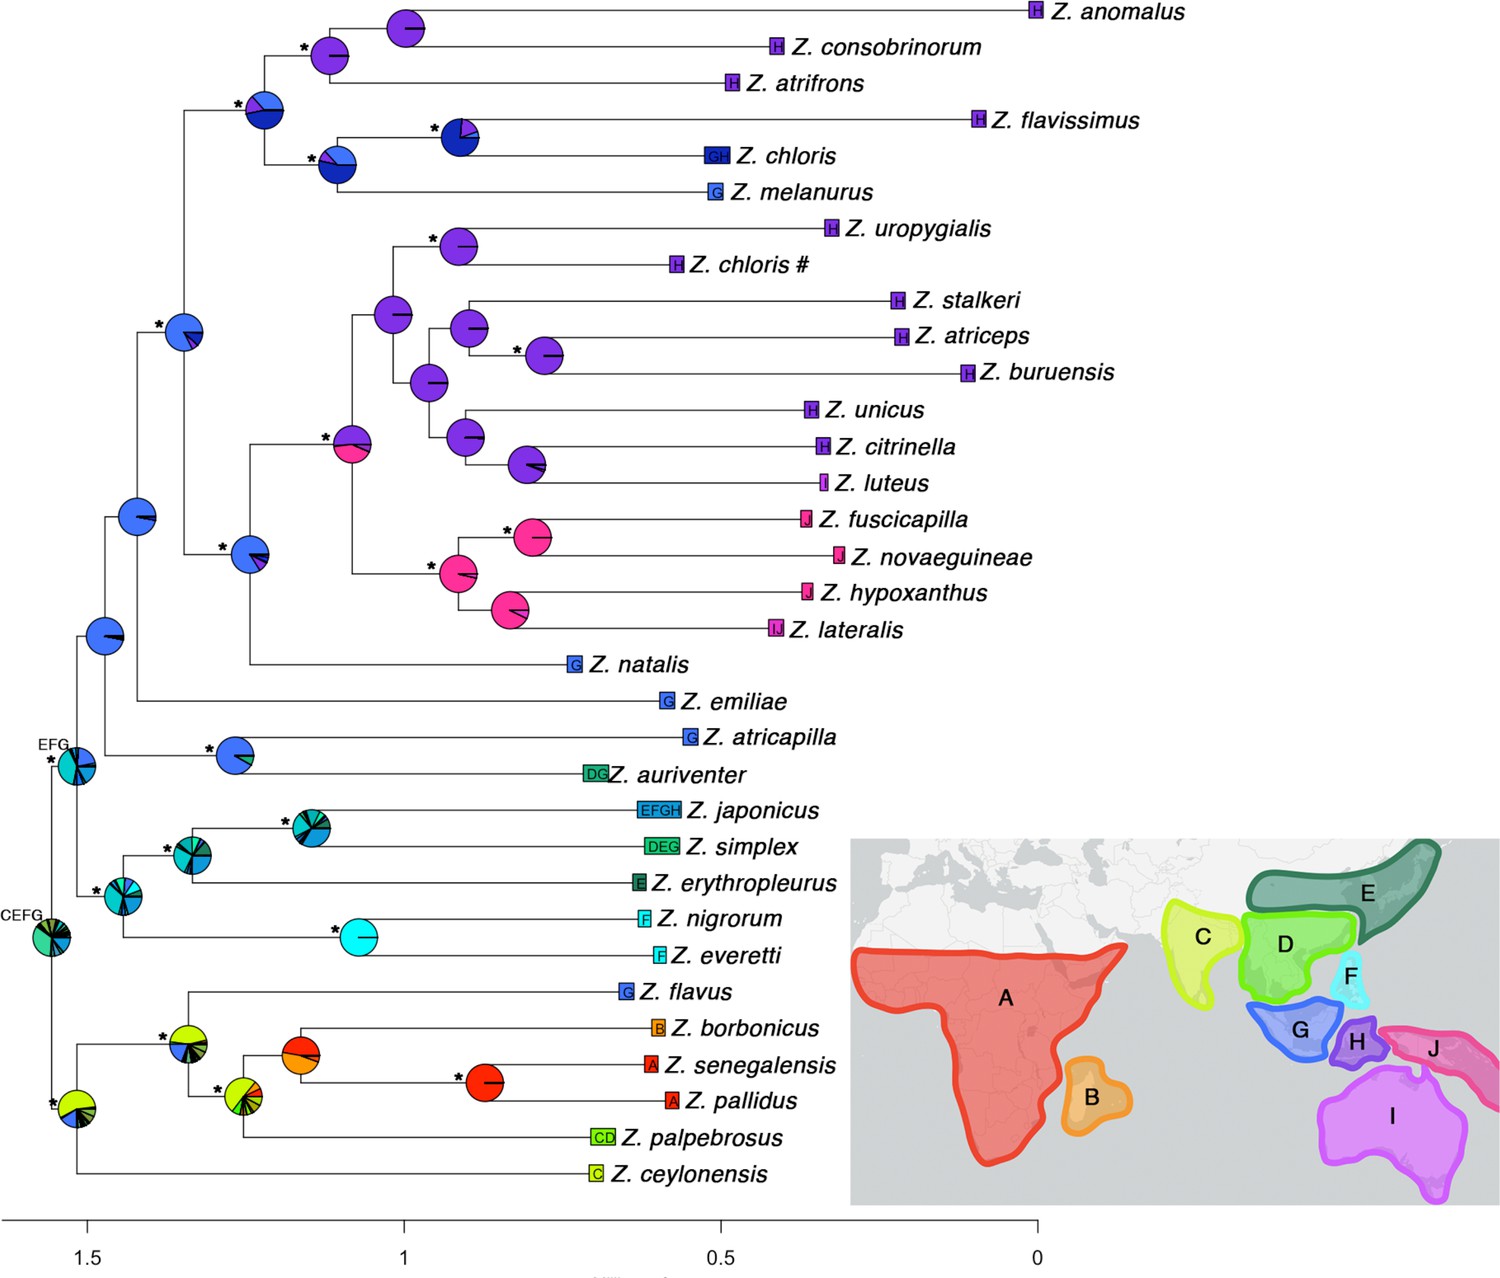
Ancestral range estimation of the genus Zosterops using the DEC+j model in BioGeoBEARS on a concatenated maximum likelihood tree.
The results of BioGeoBEARS are shown as pie charts colored in relative proportions of the most likely ancestral range. Nodes with 100% bootstrap support are indicated with * at the side. Scale at the bottom indicates rate of molecular changes rather than divergence time. Geographical areas defined for ancestral range estimation: (A) Afrotropical region, (B) West Indian Ocean islands, (C) South Asia, (D) mainland Southeast Asia, (E) East Asia, (F) Philippines, (G) Sundaic region, (H) Wallacea, (I) Australia, and (J) Melanesia.
Figure 2—figure supplement 3
Maximum likelihood phylogeny constructed with RaxML using a mitochondrial ND2 gene alignment of 1041 base pairs.
Nodes with a bootstrap value below 70 were collapsed. The scale at the bottom depicts the branch length of the ND2 tree. Samples from our study are marked with * at the end the sample name. Three mislabeled samples obtained from GenBank are each marked with # at the end of the GenBank accession number and assigned to the correct taxon.
Figure 3 with 1 supplement

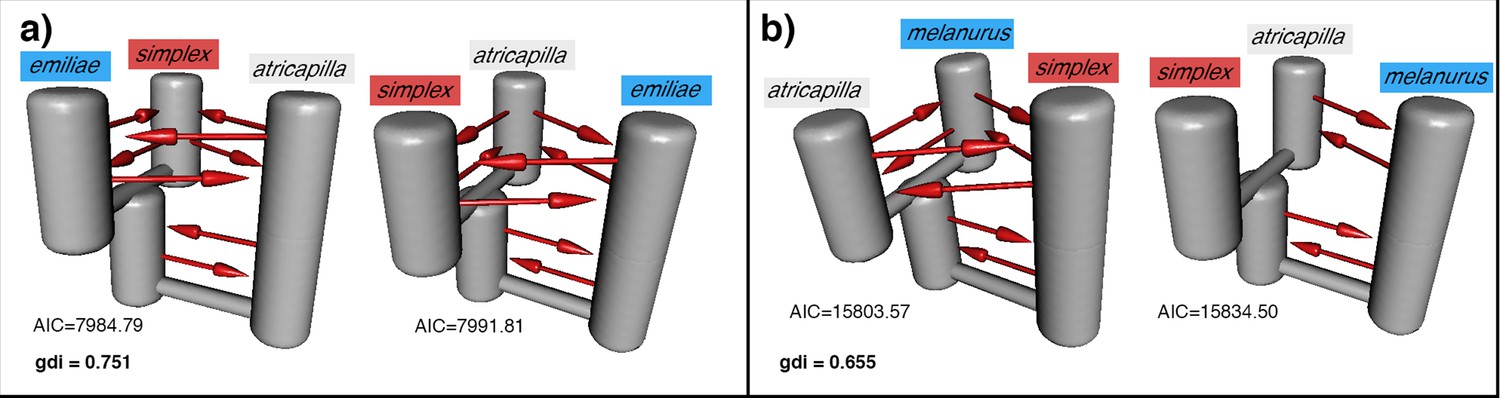
Detection of secondary gene flow in a Sundaic species pair of unresolved placement (gray) with members of either the Asiatic (red) or Australasian (blue) clade.
(a) Placement of the Sundaic pair (Z. atricapilla and Z. auriventer) conflicts between MP-EST species tree and concatenated tree. (b) The top two demographic models in PHRAPL simulations show that Sundaic Z. auriventer is more closely related to Asiatic Z. simplex than to Australasian Z. emiliae, but inconclusive in relation to Z. melanurus due to secondary gene flow between the three taxa. Refer to Figure 3—figure supplement 1 for simulation results with Z. atricapilla. (c) ABBA-BABA statistics for secondary gene flow shows an excess of derived allele sharing between the Sundaic taxa (gray) and Australasian Z. melanurus and Z. citrinella. (D-statistics significantly different from 0; see Table 1 for full statistical results). Topology inferred from ABBA-BABA tests shows the two Sundaic lineages (Z. atricapilla and Z. auriventer) as carriers of genomic admixture between both Asiatic and Australasian clades.
Figure 3—figure supplement 1
Additional PHRAPL results.
Each panel shows the top two demographic models estimated by PHRAPL for the Sundaic Z. atricapilla, Asiatic Z. simplex, and either the Australasian (a) Z. emiliae or (b) Z. melanurus. The genealogical divergence index (gdi) value of each combination is shown in the respective panel. Gene flow is detected in most directions between the three taxa, while the placement of Z. atricapilla to the Asiatic or Australasian clade is inconclusive.
Tables
Table 1
D-statistics of a selection of species combinations to test if two species (H2, H3) exhibit an excess of derived allele sharing.
The ABBA-BABA test was restricted to species combinations with conflicting tree topologies observed in this study (set 1), conflicting tree topologies between this study and Cai et al., 2019 (set 5), and a selection of species with a present-day geographic overlap and opportunities for secondary gene flow (sets 2–4). Z. senegalensis (H4) was used as an outgroup for all comparisons. A critical value (Z) above three suggests a significant excess of derived allele sharing between populations H2 and H3 and is highlighted in bold.
| Set | H1 | H2 | H3 | D-stat | Z | No. of ABBA | No. of BABA |
|---|---|---|---|---|---|---|---|
| 1 | emiliae | melanurus | atricapilla | 0.129 | 3.807 | 192.84 | 148.63 |
| emiliae | melanurus | auriventer | 0.163 | 5.168 | 190.17 | 136.97 | |
| emiliae | citrinella | atricapilla | 0.110 | 3.086 | 178.55 | 143.09 | |
| emiliae | citrinella | auriventer | 0.125 | 3.788 | 172.21 | 133.99 | |
| 2 | citrinella | melanurus | simplex | 0.093 | 3.074 | 142.55 | 118.22 |
| 3 | simplex | japonicus | erythropleurus | 0.215 | 5.272 | 171.87 | 111.15 |
| 4 | erythropleurus | simplex | auriventer | 0.108 | 3.169 | 166.20 | 133.74 |
| 5 | melanurus | emiliae | simplex | −0.053 | −1.456 | 152.33 | 169.34 |
| melanurus | emiliae | japonicus | −0.066 | −1.729 | 149.05 | 170.02 | |
| citrinella | emiliae | simplex | 0.027 | 0.706 | 154.77 | 146.74 | |
| citrinella | emiliae | japonicus | −0.027 | −0.686 | 146.72 | 154.82 |
Additional files
-
Supplementary file 1
Details of all samples included in the study.
Abbreviations for museums: American Museum of Natural History, New York (AMNH); Australian National Wildlife Collection, Canberra (ANWC); Burke Museum of Natural History and Culture, Washington (Burke); Lee Kong Chian Natural History Museum, Singapore (LKCNHM); Museum of Vertebrate Zoology, California (MVZ); Museums Victoria, Melbourne, Australia (NMV); Museum Zoologicum Bogoriense, West Java, Indonesia (MZB); Naturalis Biodiversity Center, Leiden, Netherlands (Naturalis); South Australian Museum, Adelaide (SAMA); Swedish Museum of Natural History, Stockholm (NRM); Western Australian Museum, Perth (WAM); Yale Peabody Museum of Natural History, Connecticut (Peabody). Whole genome resequenced samples are marked with an asterisk (*) at the end of the sample ID.
- https://cdn.elifesciences.org/articles/62765/elife-62765-supp1-v2.docx
-
Supplementary file 2
A list of species assignable to one of the three main Zosterops clades (Indo-African, Asiatic, Australasian), either on the basis of our study (shaded in gray) or based on previous studies with a bootstrap support of at least 90.
All species were assigned to their respective ranges of occurrence (see Figure 1): Afrotropical, West Indian Ocean (WIO), Asia, Philippines, Indonesian Archipelago (Indo), Melanesian Archipelago (Mel), Micronesian Archipelago (Mic), Australia and/or others.
- https://cdn.elifesciences.org/articles/62765/elife-62765-supp2-v2.docx
-
Transparent reporting form
- https://cdn.elifesciences.org/articles/62765/elife-62765-transrepform-v2.pdf
Download links
A two-part list of links to download the article, or parts of the article, in various formats.
Downloads (link to download the article as PDF)
Open citations (links to open the citations from this article in various online reference manager services)
Cite this article (links to download the citations from this article in formats compatible with various reference manager tools)
Phylogenomics of white-eyes, a ‘great speciator’, reveals Indonesian archipelago as the center of lineage diversity
eLife 9:e62765.
https://doi.org/10.7554/eLife.62765


