Cryo-EM structure of the calcium release-activated calcium channel Orai in an open conformation
- Structural Biology Program, Memorial Sloan Kettering Cancer Center, United States
Figures
Figure 1 with 1 supplement
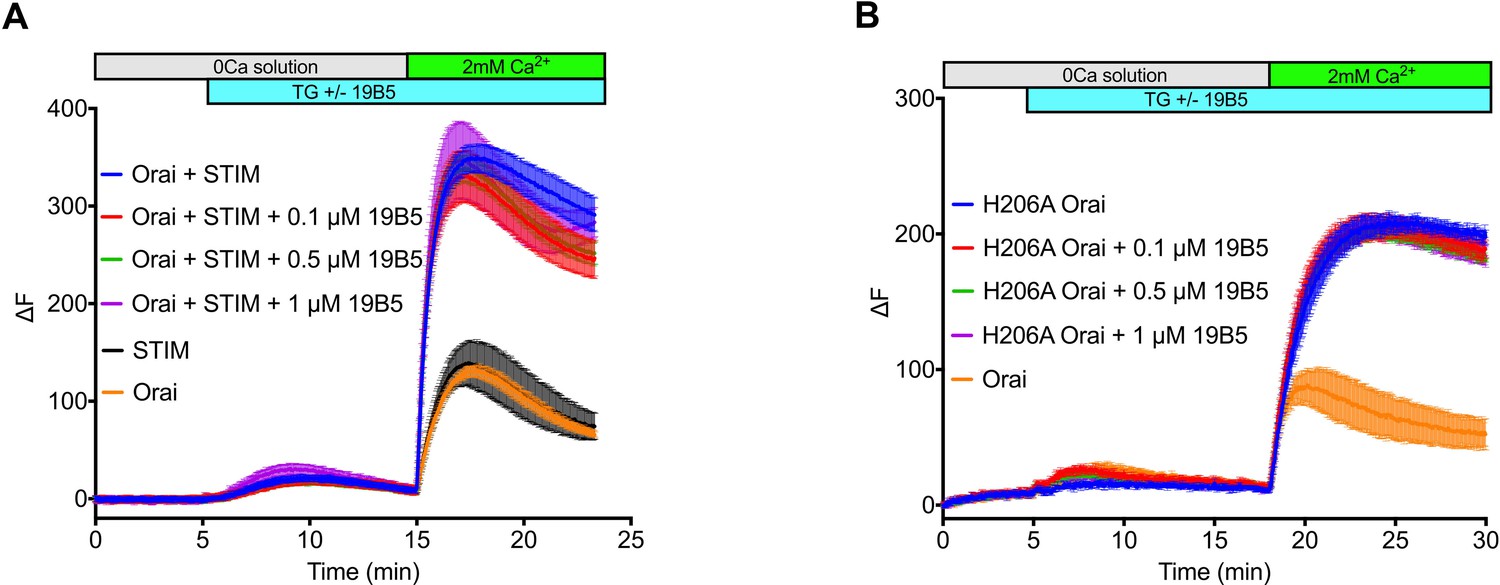
Analysis of the 19B5 antibody using a cellular Ca2+ influx assay.
Ca2+ influx measurements were made from mammalian (HEK293) cells co-expressing wild-type Drosophila Orai with Drosophila STIM (A) or expressing the H206A mutant of Orai alone (B). Cytosolic [Ca2+] levels were detected using a genetically encoded fluorescent Ca2+ indicator, GCaMP6s (Chen et al., 2013), as described previously (Hou et al., 2018). Data are plotted as the change in fluorescence intensity (ΔF). Indicted concentrations of 19B5 antibody were used. Thapsigargin (TG), 2 mM CaCl2, and purified 19B5 antibody were added at the indicated times (horizontal bars). Controls (Orai or STIM alone) indicate background fluorescence levels. Standard error, derived from three independent measurements, is shown for each condition.
Figure 1—figure supplement 1
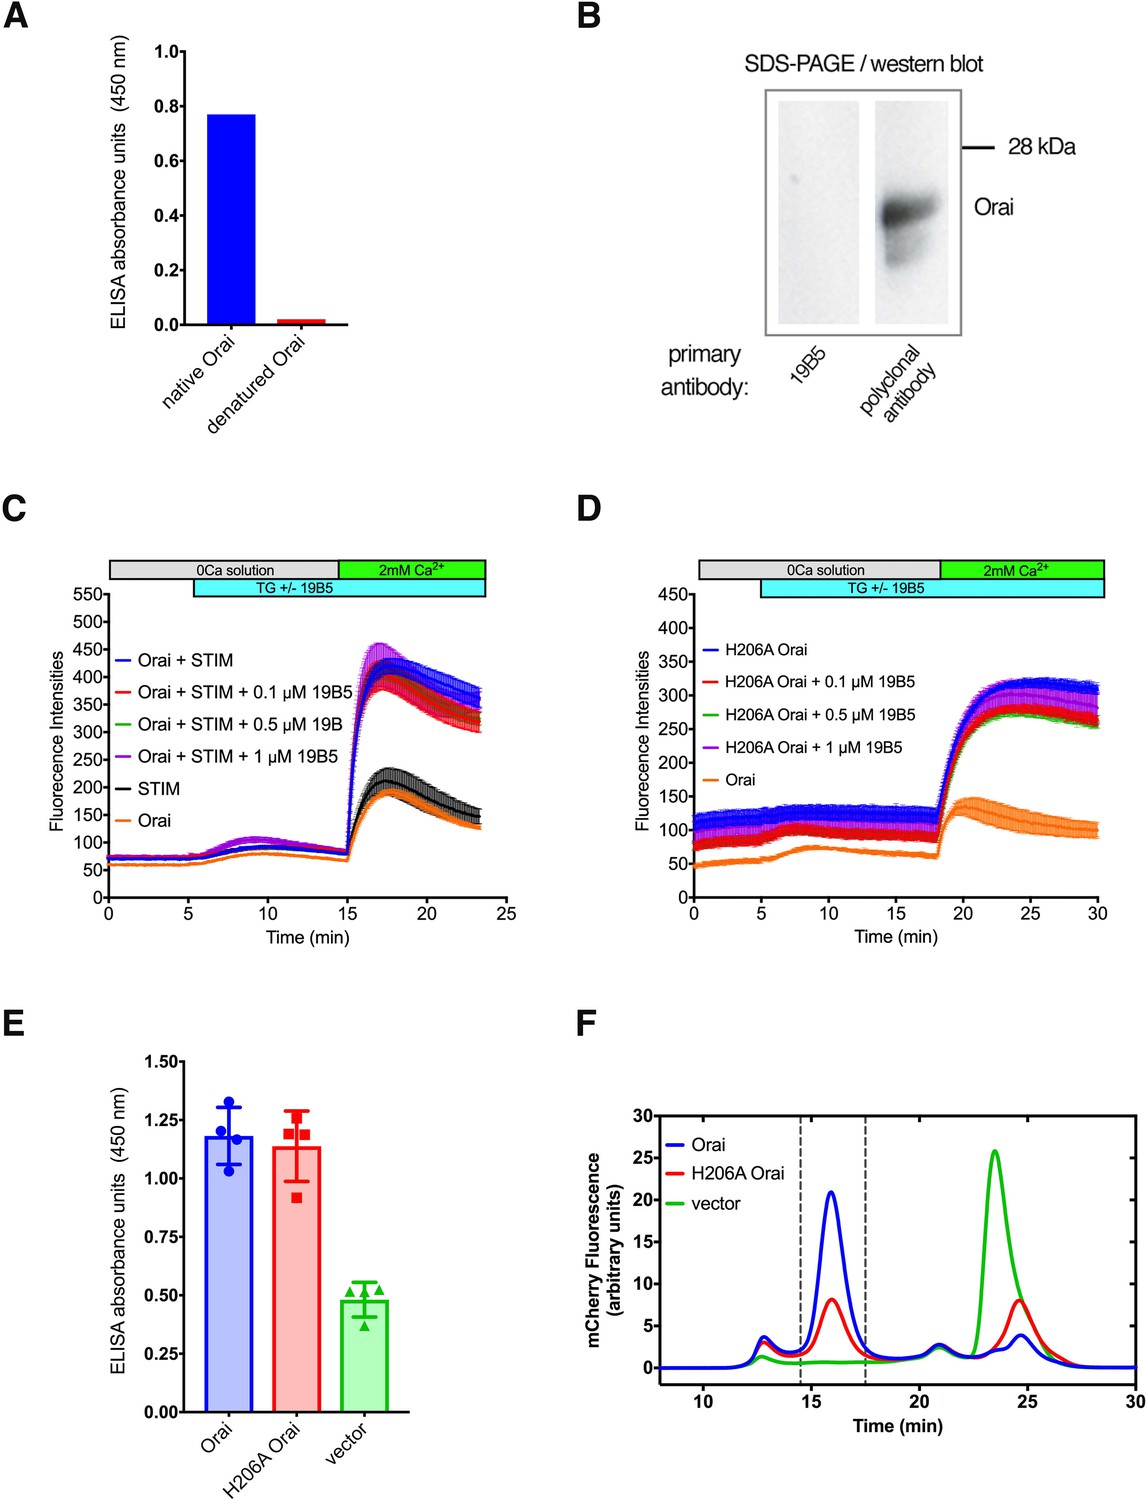
Further analyses of the 19B5 antibody.
(A) ELISA analysis indicates that 19B5 preferentially binds to native rather than denatured Orai. An ELISA assay was performed using plates that had been coated with purified Orai (native Orai) or with purified Orai that had been denatured using SDS (denatured Orai). Absorbance (at 450 nM) indicates binding of 19B5. (B) Western blot analysis of 19B5 showing that 19B5 does not recognize denatured Orai. A polyclonal antibody against Orai (obtained from the mouse used to generate 19B5) contains antibodies that recognize denatured Orai protein (~24 kDa) and is shown as a control. (C and D) Raw data for the Ca2+ influx measurements shown in Figure 1, with fluorescence intensity on the y-axis. The variable initial intensity value for H206A Orai (D) can be attributed to the constitutive activity of this mutant. (E) 19B5 preferentially binds to cells that express Orai or H206A Orai in comparison to cells that express mCherry alone (vector). Details of the experiment are described in the Materials and methods. (F) Fluorescence-detection size-exclusion chromatography (FSEC) analysis confirms cellular expression of the constructs in (E). Peaks within the vertical dashed lines correspond to mCherry-tagged Orai proteins. The vector control indicates expression of free mCherry (peak at ~24 min).
Figure 2 with 4 supplements
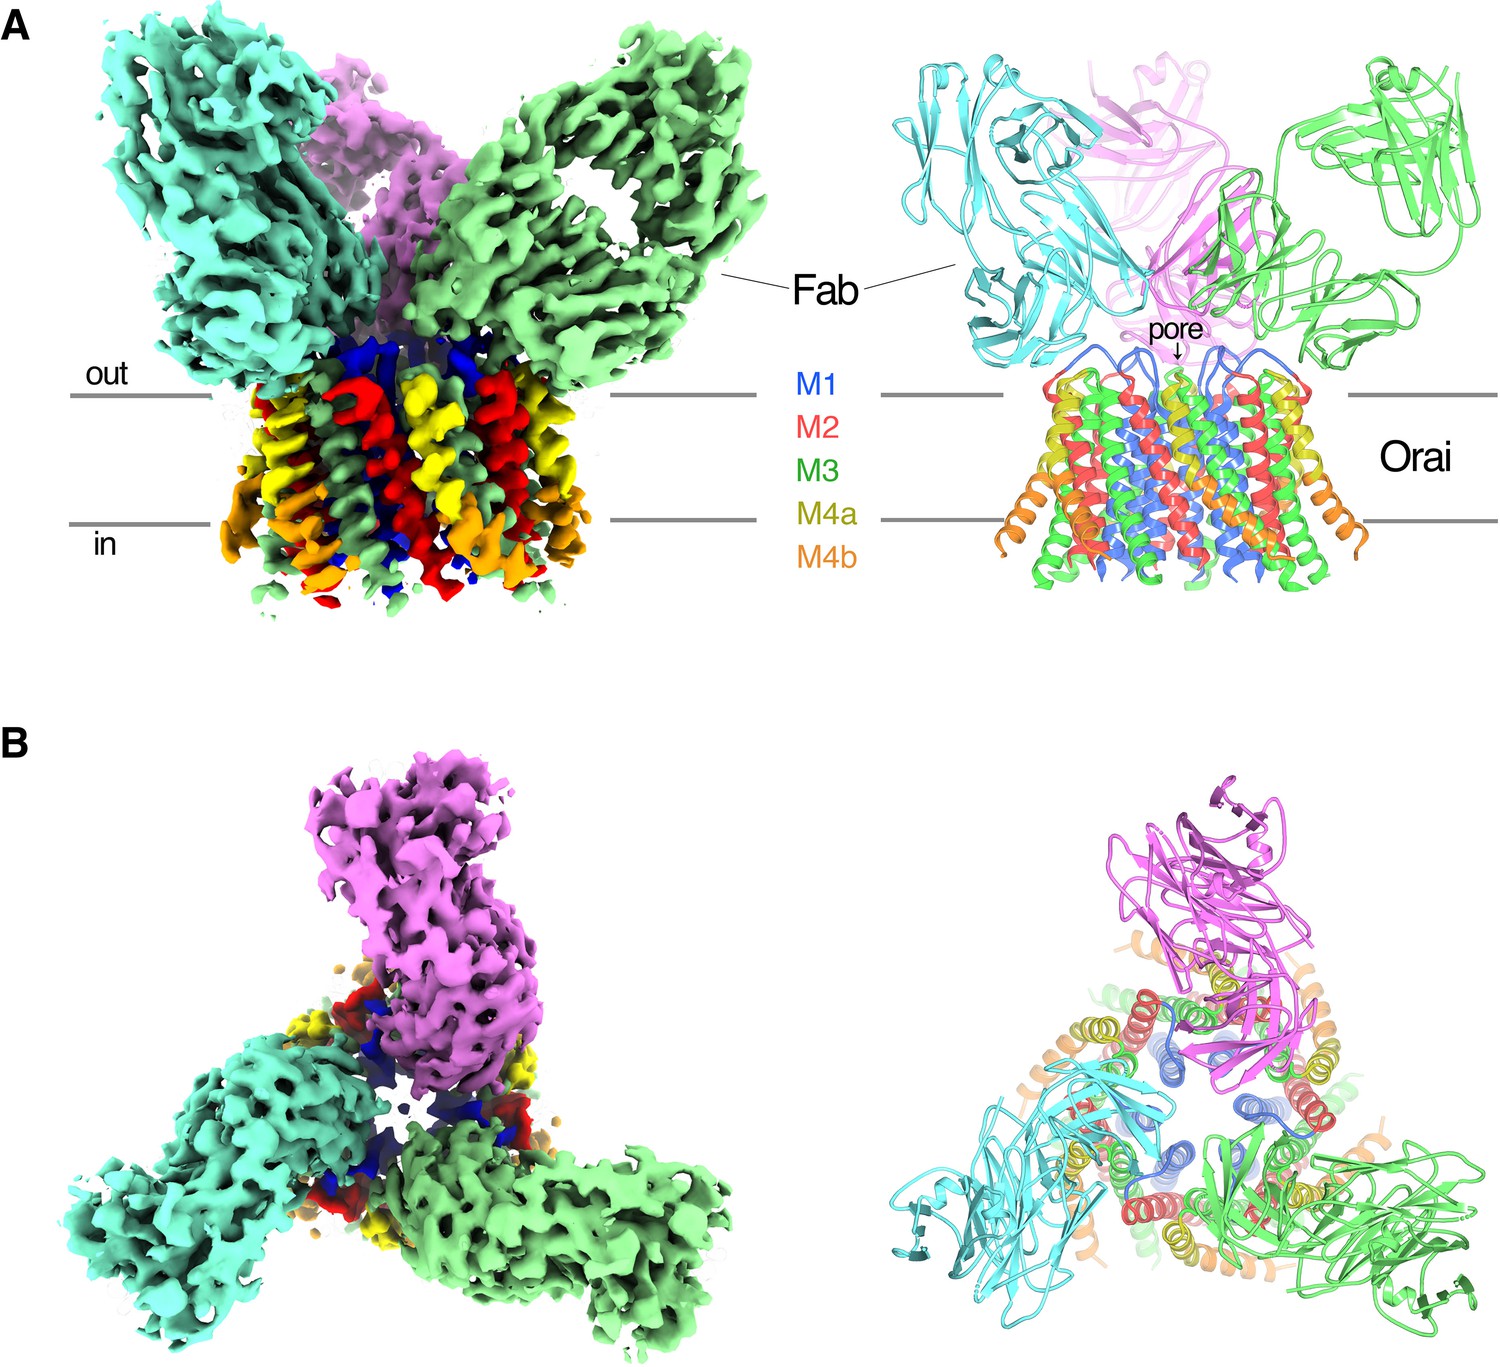
OraiH206A–Fab complex.
(A and B) Overall structure of the complex is shown from the perspective of the membrane (A) and from the extracellular side (B). The cryo-EM map (left) and the cartoon representation of the structure (right) are shown. Each Fab is colored individually; the α-helices of Orai are colored as indicated. Horizontal bars in (A) denote approximate boundaries of the plasma membrane.
-
Figure 2—source data 1
Cryo-EM data collection, refinement, and validation statistics.
- https://cdn.elifesciences.org/articles/62772/elife-62772-fig2-data1-v2.docx
Figure 2—figure supplement 1
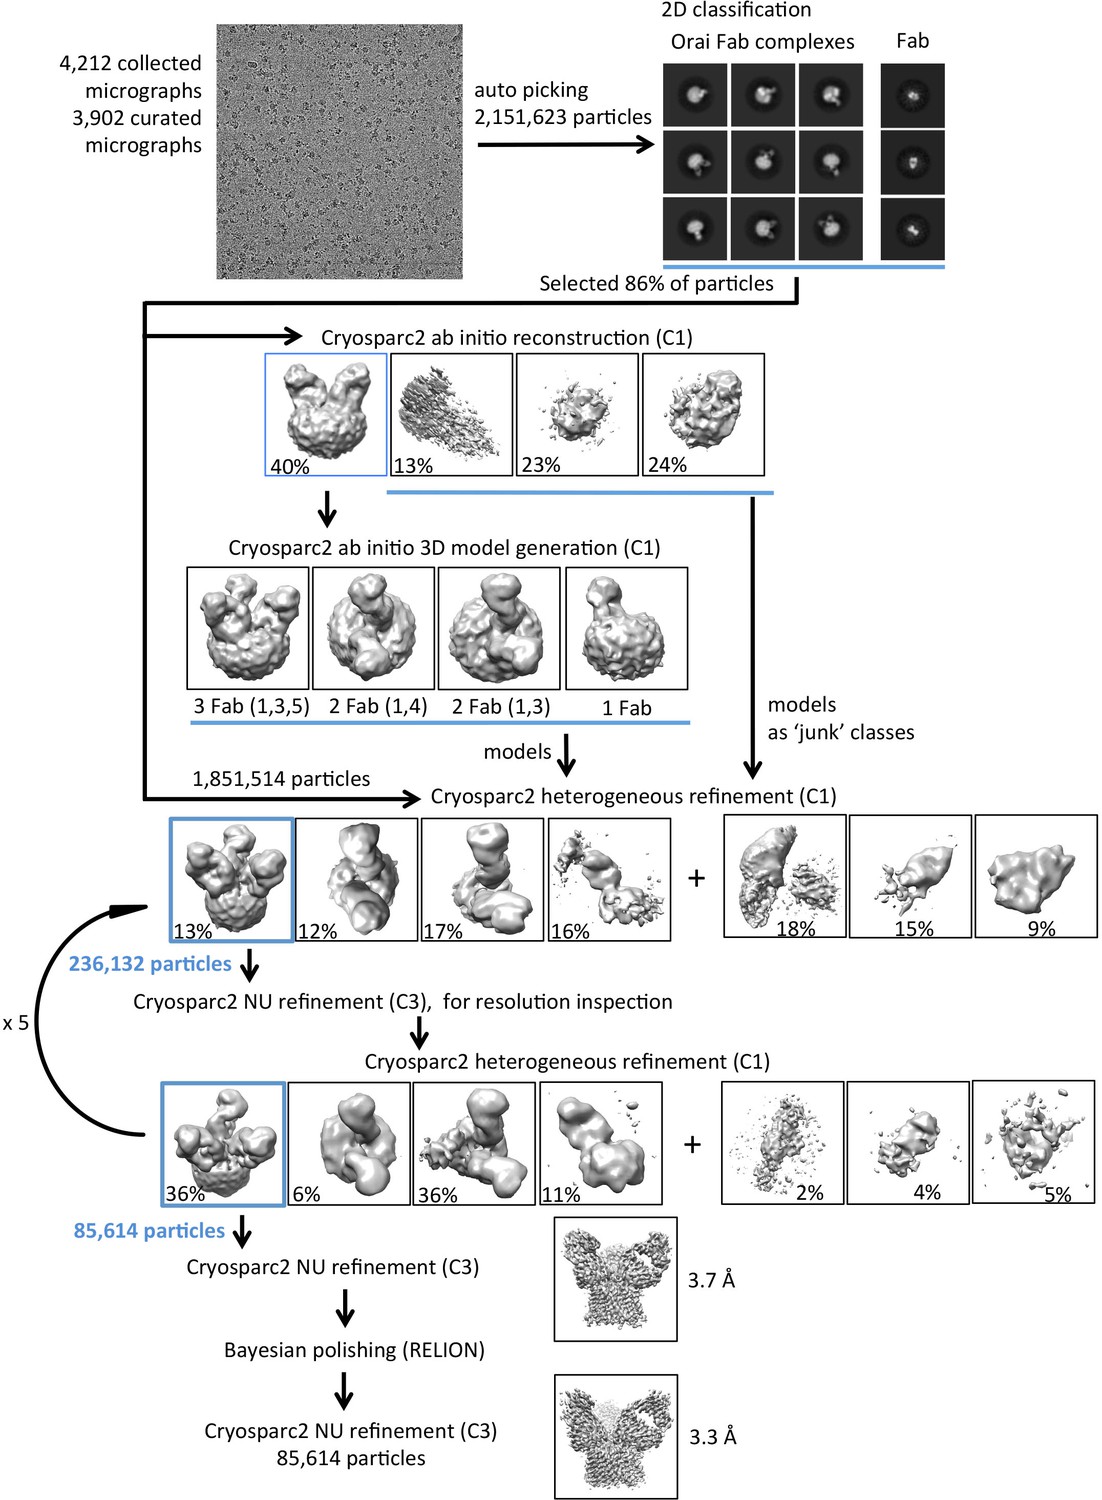
Flowchart for cryo-EM data processing of the OraiH206A–Fab complex.
Details can be found in the Materials and methods.
Figure 2—figure supplement 2
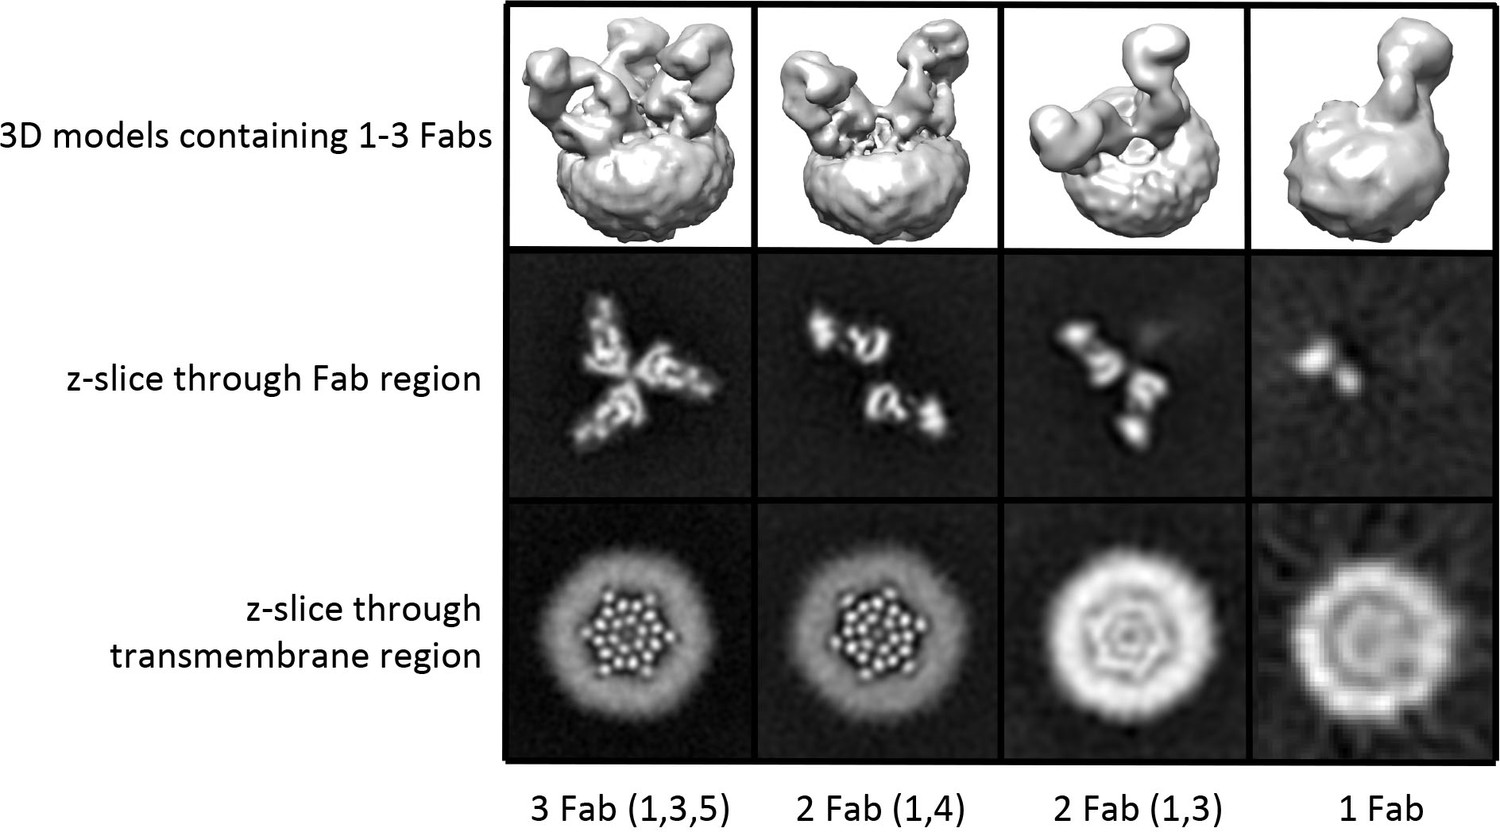
3D reconstructions of OraiH206A–Fab complexes containing between one and three Fab molecules.
3D reconstructions of complexes containing between one and three Fabs are shown in the upper panels (Chimera representations). Slices of the Fab and transmembrane portions of the 3D reconstructions are shown in the middle and lower panels, respectively (the views are from the extracellular side of the reconstruction in these panels). The halo in the lower panels is due to the amphipols surrounding the transmembrane portion of Orai. Complexes containing two Fab molecules have Fabs arranged in two alternative configurations (1,4) or (1,3).
Figure 2—figure supplement 3
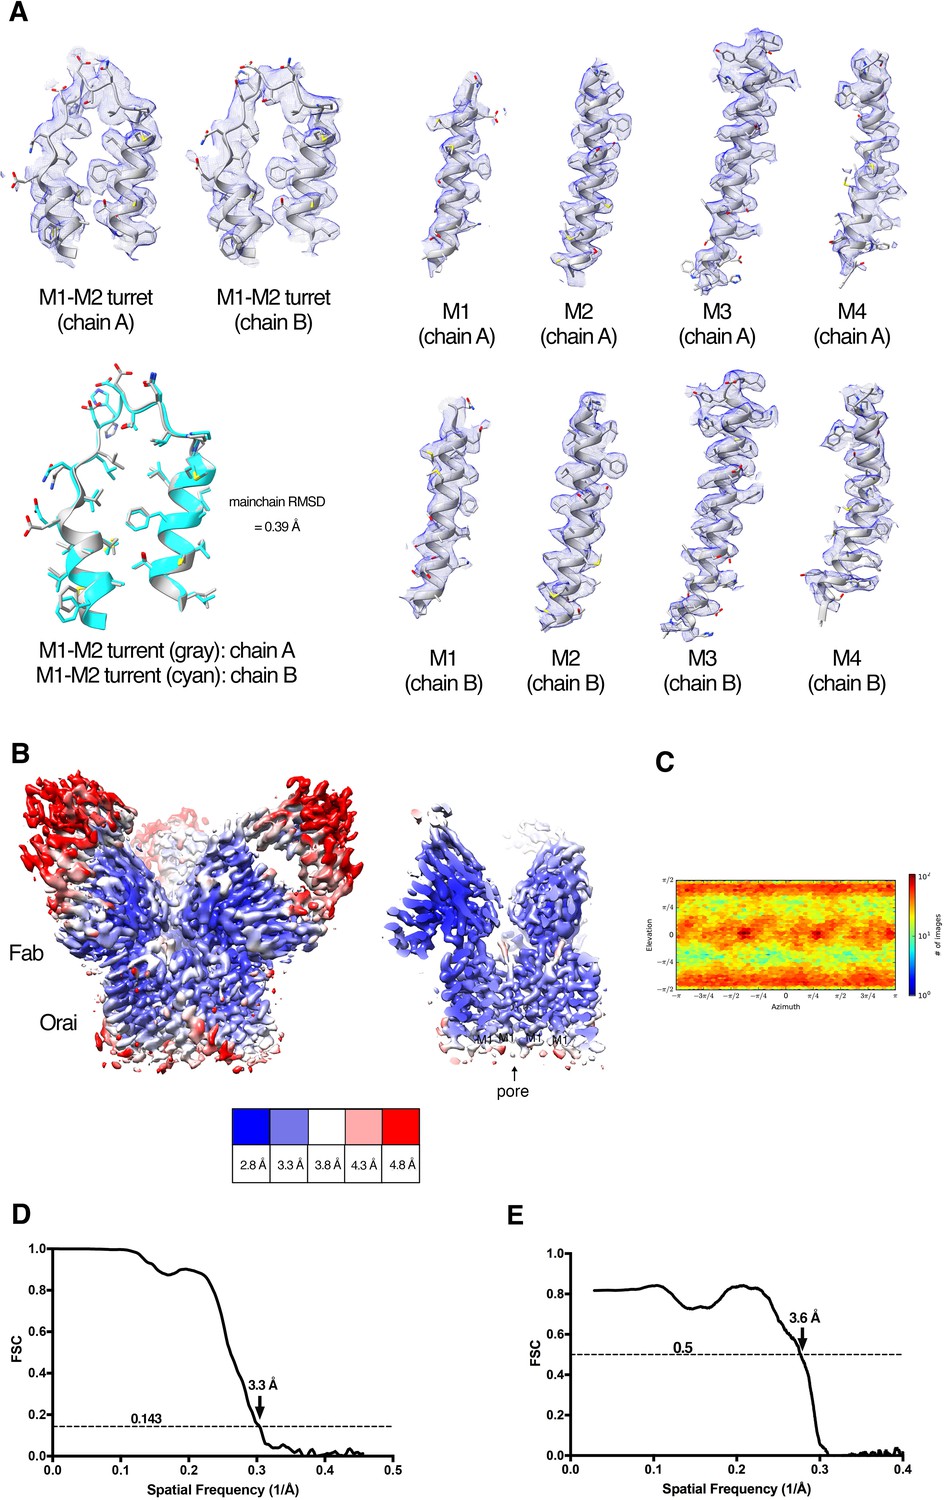
Cryo-EM structure determination and density.
(A) Densities (blue mesh) of indicated regions of Orai in the Orai–Fab complex are shown in the context of the atomic model (cartoon and stick representation). A superposition of the M1–M2 turrets from two neighboring subunits is also shown (lower left panel, main chain RMSD = 0.39 Å). (B) Local resolution of the map estimated using the Local Resolution Estimation function of Cryosparc2 (colored as indicated). An overall view (left panel) and a cross-section (right panel) are shown. (C) Angular orientation distribution of the particles used in the final reconstruction. (D) Gold-standard FSC curve of the final 3D reconstruction. The resolution is 3.3 Å at the FSC cutoff of 0.143. (E) FSC curve showing the correlation of the atomic model and cryo-EM map.
Figure 2—figure supplement 4
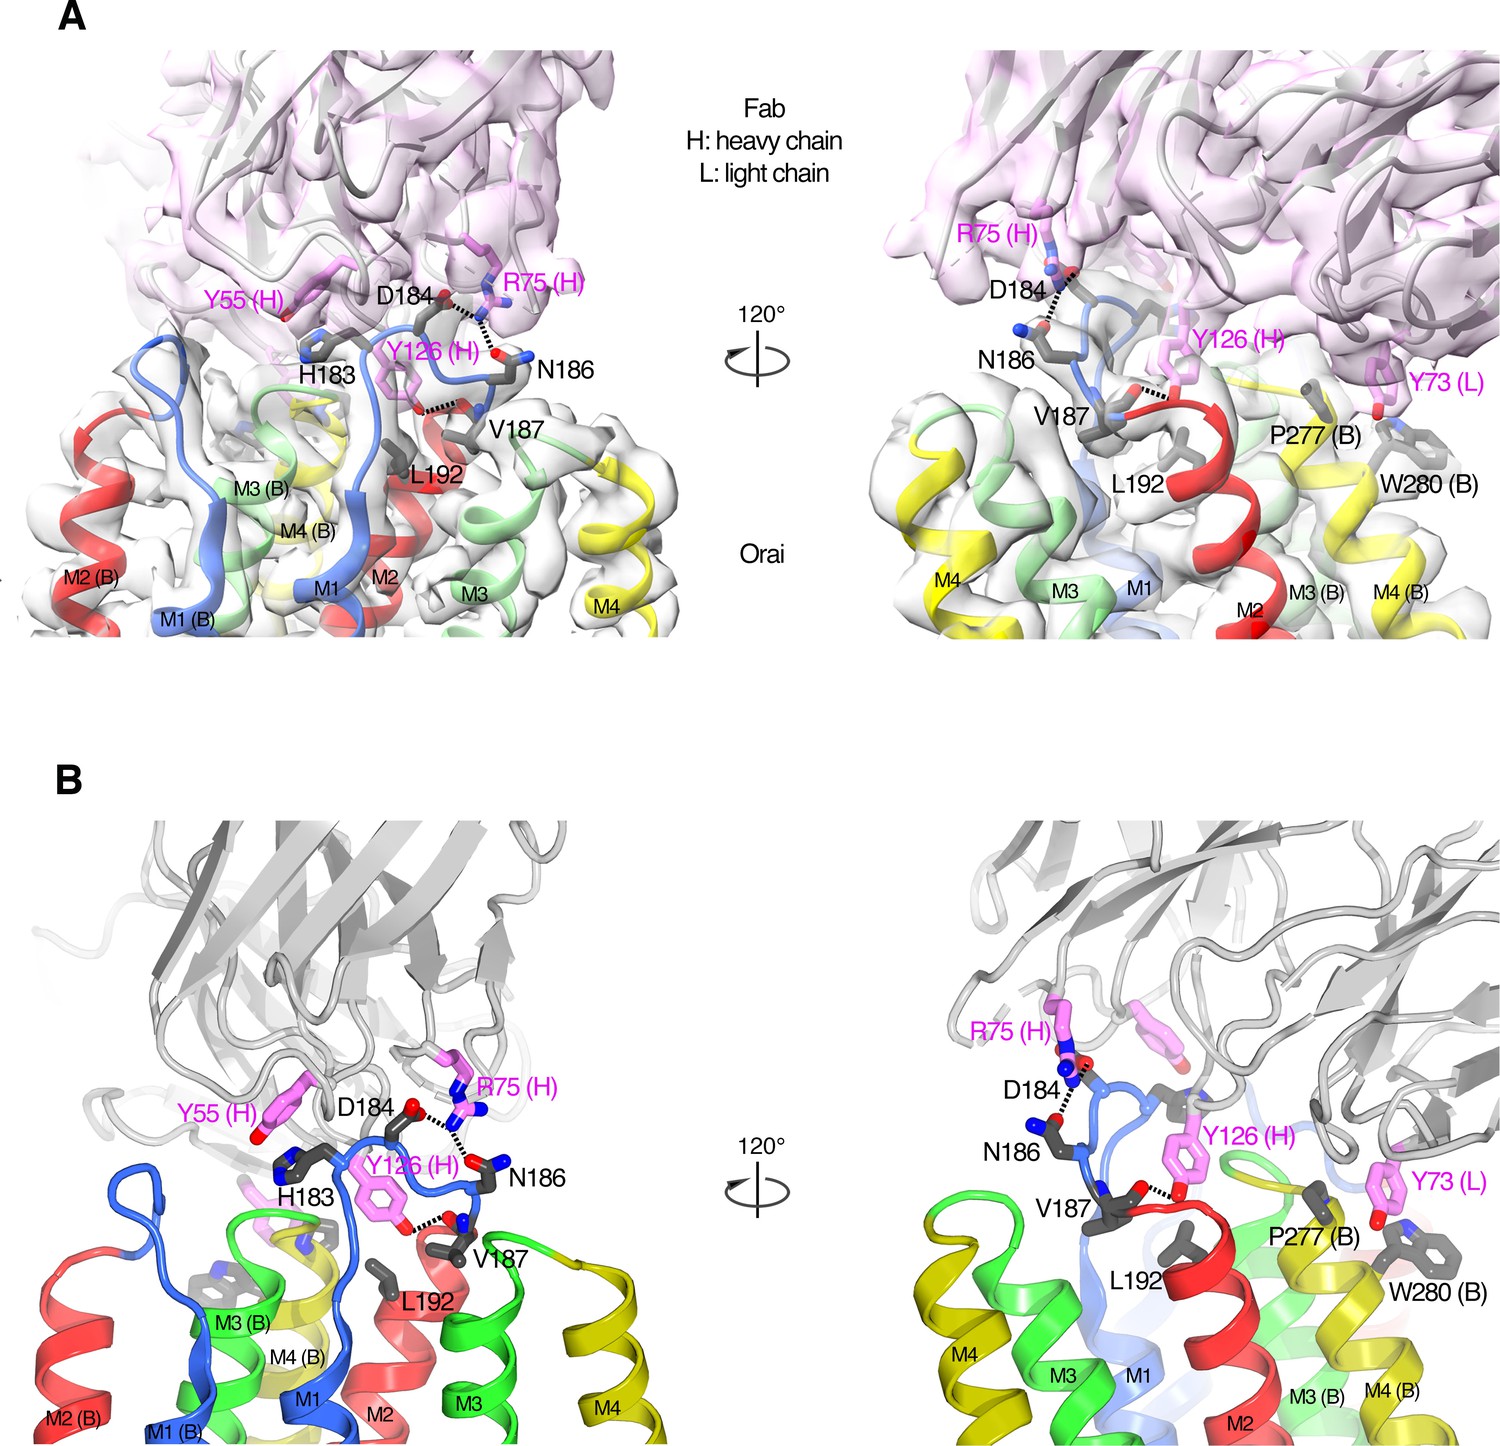
The Orai–Fab interface.
(A) Cartoon representations of the antibody (violet) and two neighboring subunits of Orai (labeled A and B and colored according to transmembrane α-helices as in Figure 2) are shown with the corresponding cryo-EM density (semitransparent surfaces). Amino acids in the Fab–Orai binding interface are drawn as sticks (with carbon atoms colored violet for the Fab and gray for Orai, and with oxygen and nitrogen atoms colored red and blue, respectively). Dashed lines indicate hydrogen bonds. Two perspectives are shown (left and right panels). (B) Analogous depictions as in (A) with the density removed for clarity.
Figure 3 with 1 supplement
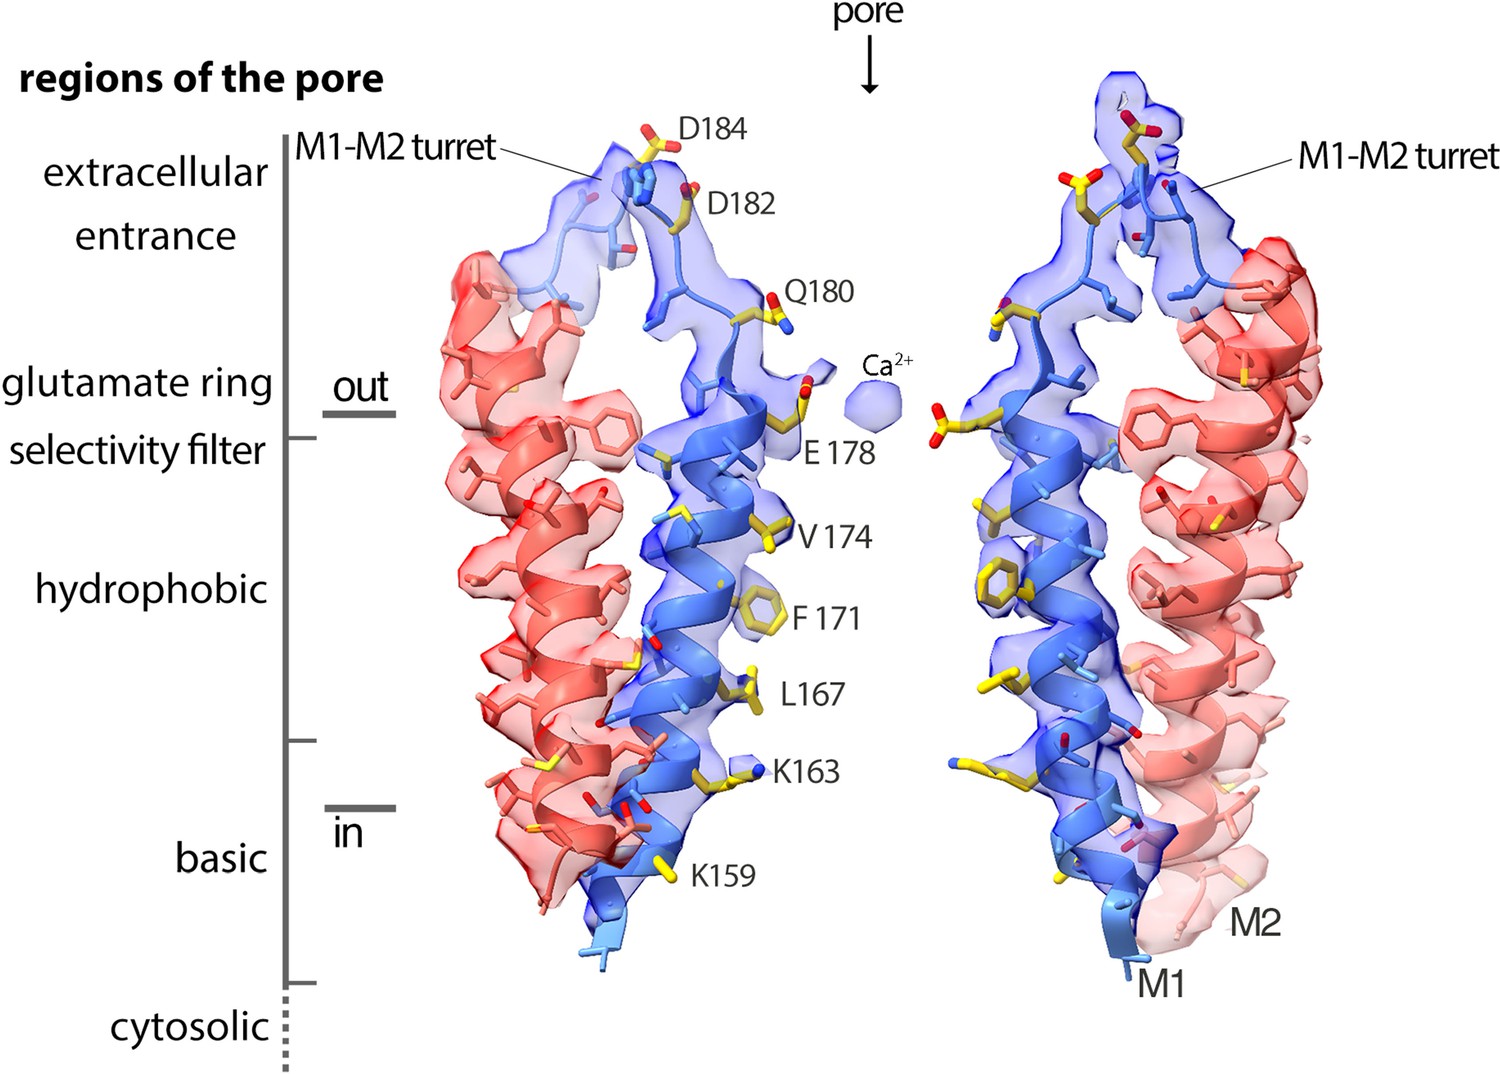
Cryo-EM density and structure of the pore.
Cryo-EM density is displayed as semitransparent surface, showing the M1 through M2 portions of the channel from two opposing subunits (M3–M4 and other subunits are omitted for clarity). The atomic model is shown in cartoon representation, with amino acid side chains drawn as sticks. Amino acid side chains on M1 and on the M1–M2 turret that face the ion conduction pathway have yellow colored carbon atoms. Nitrogen and oxygen atoms are colored dark blue and red, respectively. Regions of the pore are indicated.
Figure 3—figure supplement 1
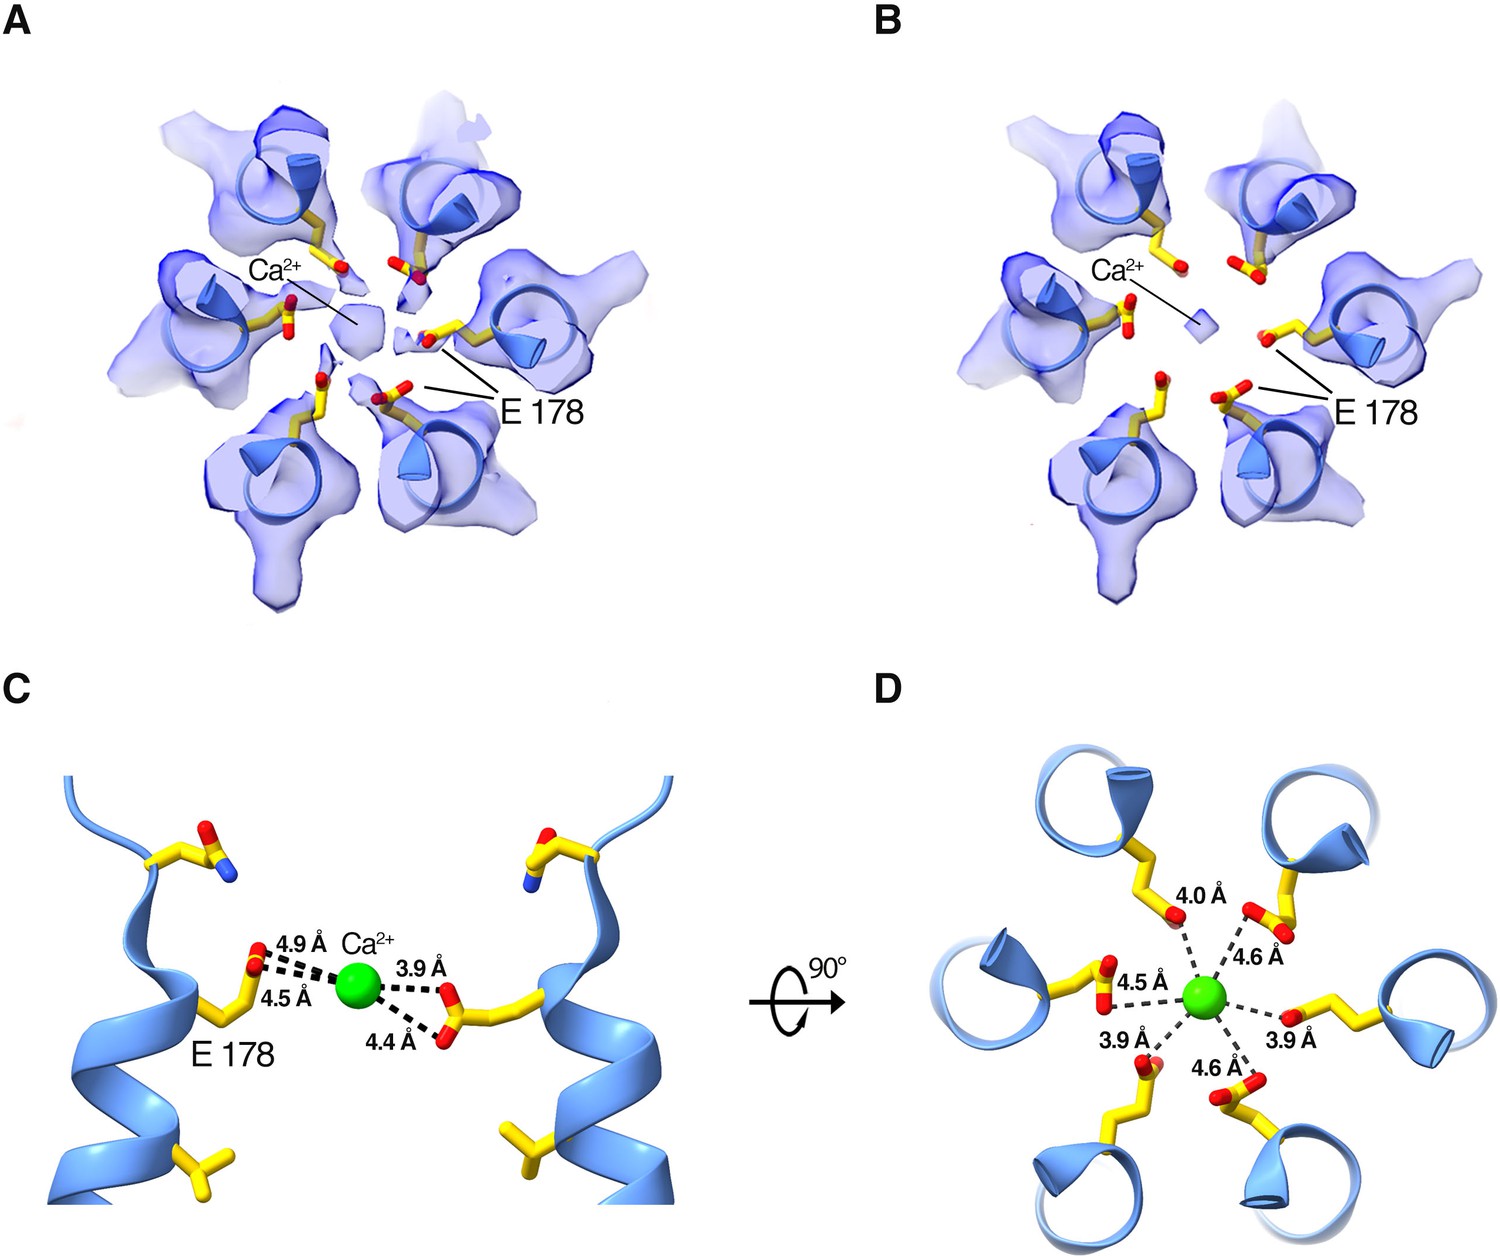
Density and approximate dimensions of the selectivity filter.
(A and B) Cryo-EM density of the selectivity filter region, viewed from the extracellular side. Density is displayed as a semitransparent surface at two contour levels: (0.4 in [A] and 0.6 in [B]). The six Glu 178 residues are displayed as sticks; M1 helices are shown as cartoons. (C and D) Side and top views showing distances between Ca2+ (green sphere) and the Glu 178 residues in the final model.
Figure 4
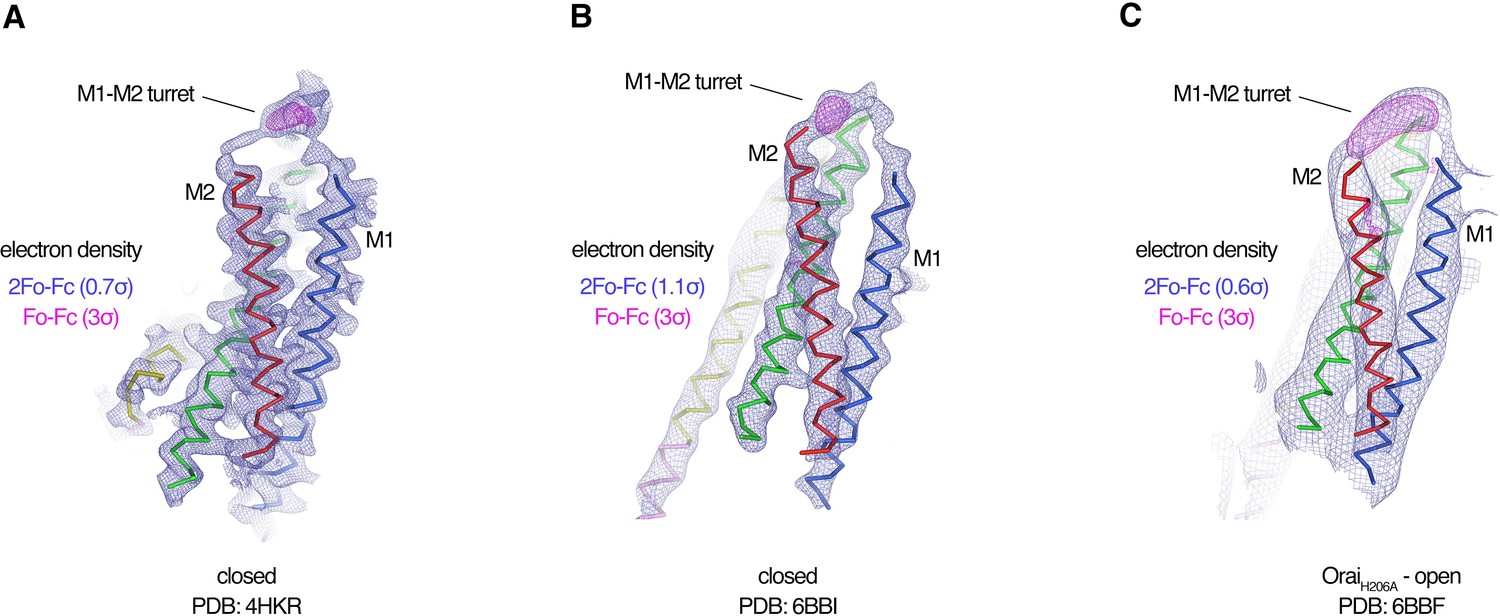
Evidence for the M1–M2 turret in previous X-ray structures of Orai.
(A–C) An Orai subunit (Cα representation) is shown from three X-ray structures. In two of the structures (A and B), the pore of Orai is closed (Hou et al., 2018; Hou et al., 2012). The depiction in (C) is of the low-resolution X-ray structure of OraiH206A (Hou et al., 2018). 2Fo-Fc and Fo-Fc density maps are drawn as blue and magenta mesh, respectively, at the indicated σ levels. The electron density maps were calculated using the map coefficients FWT/PHWT and DELFWT/DELPHWT, respectively, that can be downloaded from the RCSB Protein Data Bank using PDB IDs: 4HKR, 6BBI, and 6BBF, respectively. In (C), 24-fold averaging was applied to the map in real space according to the non-crystallographic symmetry present in this crystal form to increase the signal-to-noise level. Weak 2Fo-Fc density for the M1–M2 turret is visible in each of the three structures (at 0.7σ, 1.1σ, and 0.6σ, respectively). Positive densities in the Fo-Fc difference maps at 3σ confirm the presence of the M1–M2 turrets even though they were not built in the models due to relatively weak density and/or low resolution X-ray data. The structures in (A and B) are of Orai in a quiescent conformation and of K163W Orai in an unlatched-closed conformation, respectively. In those structures, the pores adopt indistinguishable closed conformations (the M4-ext helices have different conformations) (Hou et al., 2018; Hou et al., 2012).
Figure 5
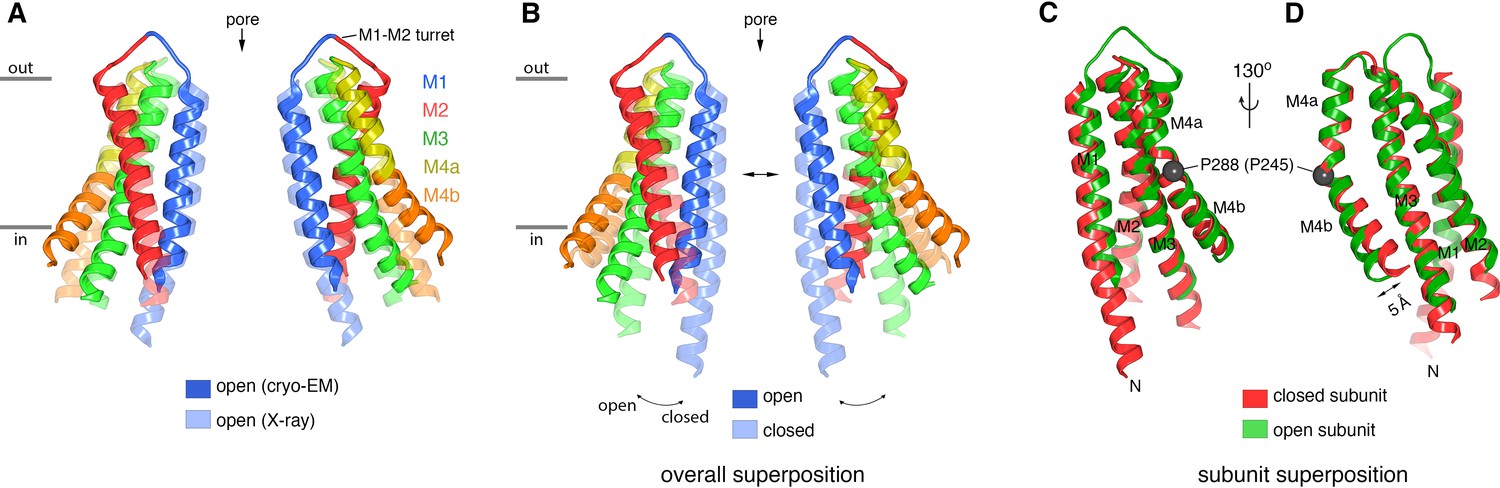
Comparison of the cryo-EM structure of OraiH206A with other structures of the channel.
(A) Comparison between the cryo-EM structure and a previous low-resolution X-ray structure of OraiH206A (Hou et al., 2018). Two opposing subunits of Orai are depicted in cartoon representation and colored as indicated (four subunits are omitted for clarity). The X-ray structure (PDB: 6BBF) is colored in lighter shades. The M1–M2 turrets revealed by the cryo-EM structure, which create the extracellular entrance of the pore, are indicated. The mainchain RMSD between the structures is 1.5 Å. (B) Comparison between the cryo-EM structure of OraiH206A and a 3.3 Å resolution X-ray structure of a closed conformation (quiescent conformation, PDB: 4HKR). The mainchain RMSD between these two structures is 2.7 Å. The depiction is as in (A), with the closed structure drawn in lighter shades. Arrows highlight dilation of the pore and the tilting of subunits. Superpositions in (A and B) were made by aligning complete hexameric channels. (C and D) Superposition of an individual subunit from OraiH206A with an individual subunit of the closed structure (PDB: 4HKR), shown in two orientations (C and D). The mainchain RMSD between these two subunits is 0.74 Å. Aside from a slight displacement of the C-terminal portion of M4b (arrow), the conformations of an isolated subunit are highly similar between the open and closed structures.
Figure 6 with 1 supplement

Ion pore and gating transitions.
(A) Open pore of OraiH206A. Two opposing subunits are shown as cartoons around the ion pore, which is depicted as a gray surface and represents the minimal radial distance to the nearest van der Waals contact. Amino acids lining the pore are shown as sticks (yellow carbon, red oxygen, and blue nitrogen atoms). These amino acids are labeled (the side chain of K159 is only partially modeled due to weak density); parentheses denote human Orai1 counterparts. A green sphere indicates Ca2+. (B) Closed pore of Orai. Two opposing M1 helices from the X-ray structure of the quiescent conformation (PDB: 4HKR) are shown (ribbons) with amino acids that line the pore drawn as sticks. The ion pore is depicted as in (A); red spheres represent iron/anion binding sites. (C) Comparison of the dimensions of the closed and open pores. Pore radius (x-axis) denotes the minimal radial distance to the nearest van der Waals contact along the axis of the pore (y-axis). The positions and scale along the y-axis correspond to (A and B). The selectivity filter and hydrophobic regions are shaded. The blue trace indicates the radius for the final structure. Additional traces shown in Figure 6—figure supplement 1 indicate the pore dimensions when all six Glu 178 residues are modeled in up or down conformations. The dotted line denotes uncertainty in the basic region due to weaker cryo-EM density. The ionic radius for dehydrated Ca2+ (1.0 Å) and the radius of a hydrated Ca2+ ion (approximately 4 Å) are indicated as vertical dashed lines.
Figure 6—figure supplement 1
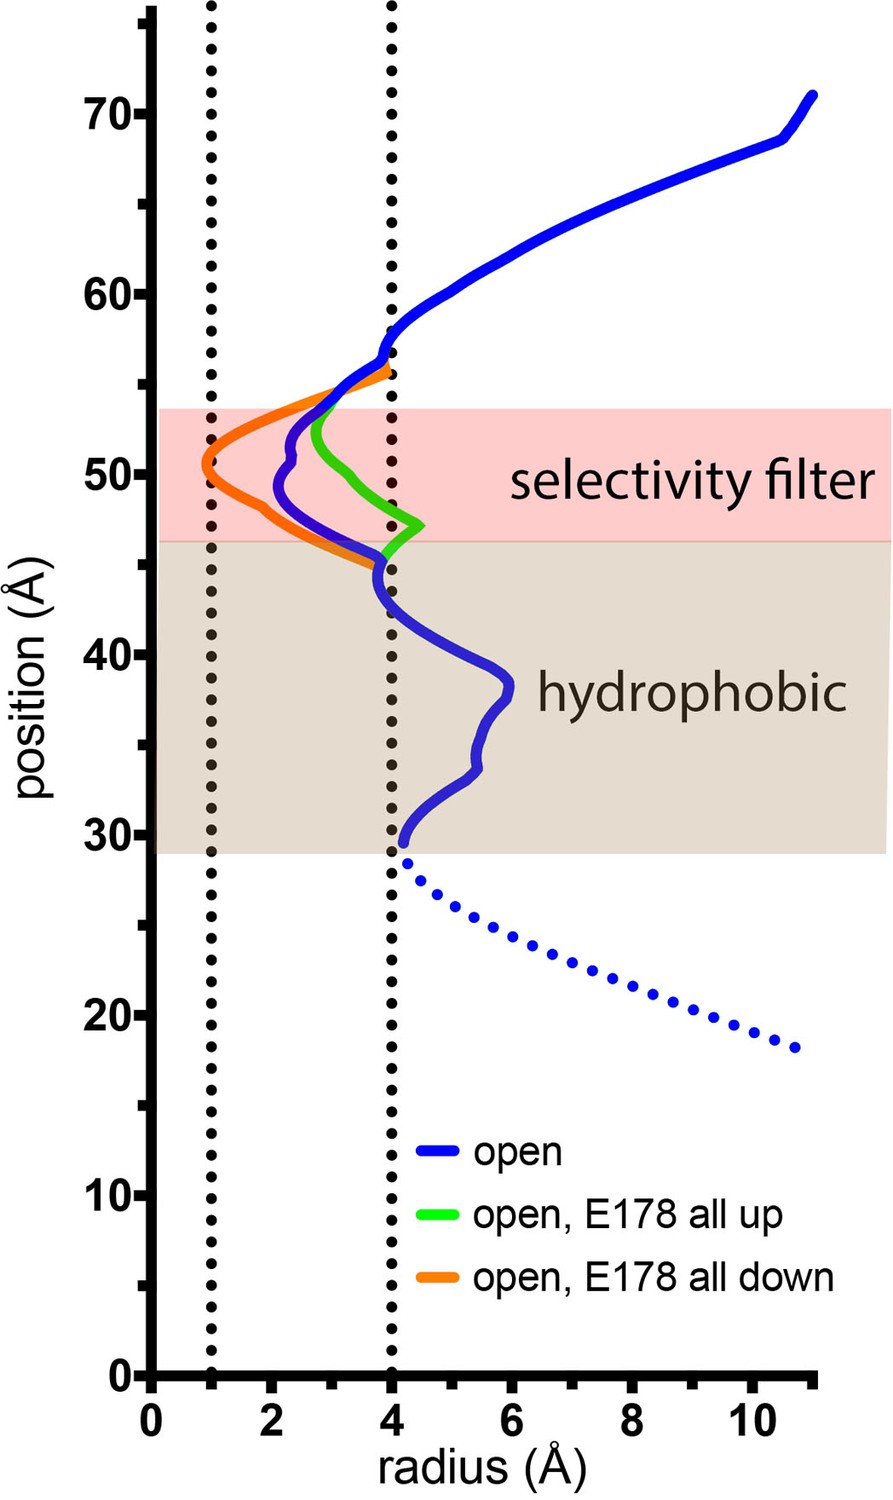
Estimation of the minimal and maximal dimensions of the selectivity filter in the open structure.
The depiction is as in Figure 7C. The blue trace is for the final structure, with Glu 178 residues in the up–down arrangement. Green and orange traces indicate hypothetical dimensions of the selectivity filter when all of the Glu 178 side chains are modeled in up or in down conformations, respectively. The ionic radius for dehydrated Ca2+ (1.0 Å) and the radius of a hydrated Ca2+ ion (approximately 4 Å) are indicated by dotted vertical lines.
Figure 7
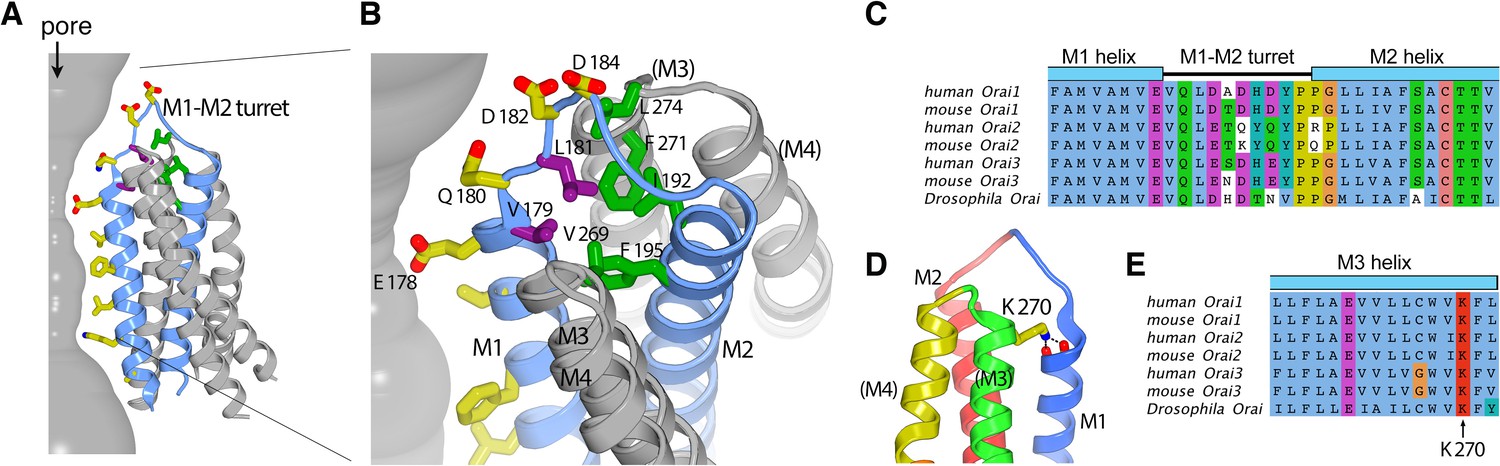
The M1–M2 turret.
(A and B) Overall and close-up views highlighting the M1–M2 turret. The M1 and M2 helices and the intervening turret from a single subunit are light blue. The M3 and M4 helices from the corresponding subunit and a neighboring one are colored gray, with parentheses indicating helices from the neighboring subunit. Select residues are drawn as sticks: pore-lining amino acids (yellow carbon atoms), hydrophobic residues on the turret (purple), and cluster of hydrophobic residues beneath the turret (green). A section of the pore is depicted as a gray surface. (C) Sequence alignment in the turret region. Clustal coloring; portions of the M1 and M2 helices nearest the turret are shown. (D) Close-up view showing an interaction between Lys 270 and the C-terminal end of M1. Lys 270 is drawn as sticks; hydrogen bonds with the backbone carbonyl oxygen atoms at the C-terminal end of M1 are depicted as dashed lines. Parentheses indicate that the M3 and M4 helices are from a neighboring subunit. (E) Sequence alignment near Lys 270.
Figure 8
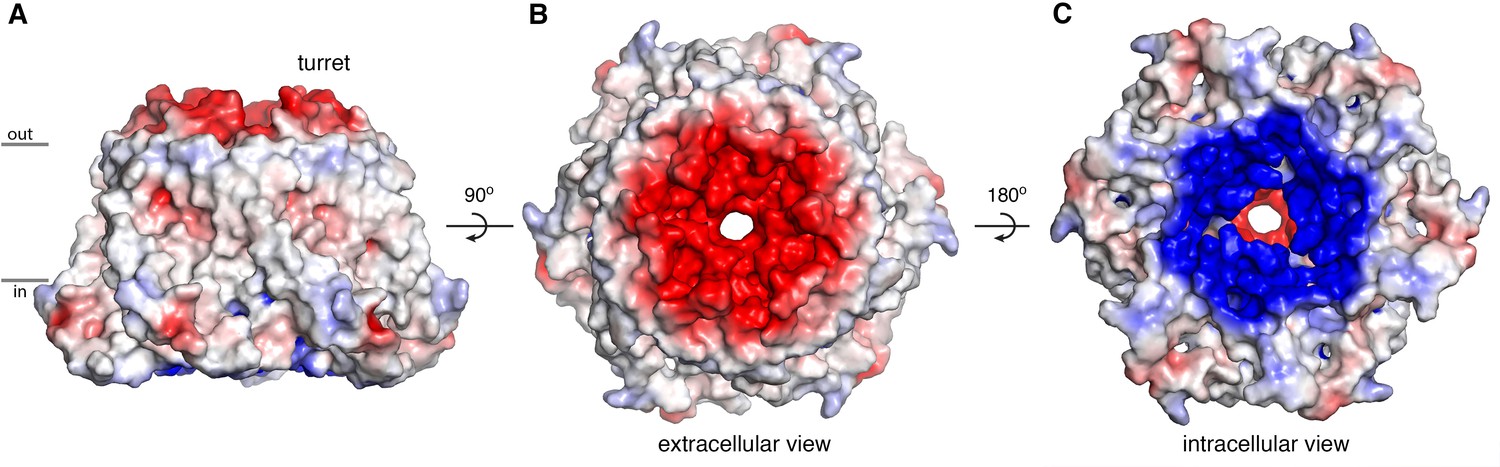
Electrostatic surface.
(A–C) Molecular surface of OraiH206A viewed from the membrane (A), extracellular (B), and intracellular (C) perspectives. Coloring is according to the electrostatic potential, which is contoured from –5 kT (red) to +5 kT (blue) (dielectric constant: 80).
Figure 9 with 3 supplements

Conformational changes in the hydrophobic gate.
(A–F) Slices through the hydrophobic region of the pore from the closed (PDB 4HKR) and OraiH206A open structures (upper and lower panels, respectively). Close up views in panels B and E highlight changes in the dimensions of the pore near Phe 171. The structures are represented as ribbons with amino acids side chains in the hydrophobic region drawn as sticks (dark red). Gly 170 is depicted as a blue sphere. The perspectives are from the extracellular side, perpendicular to the pore, which is centrally located. The slices correspond to approximately 4 Å slabs centered at Val 174, Phe 171, and Leu 167, as indicated. The M1–M4 helices of a single subunit are labeled. Inspection of the upper and lower panels indicates the outward rigid body movements of subunits. Videos 1 and 2 depict these conformational changes.
Figure 9—figure supplement 1

Hydrophobic region.
(A and B) Slices analogous to Figure 9, showing a slab containing the entire hydrophobic region of each pore.
Figure 9—figure supplement 2
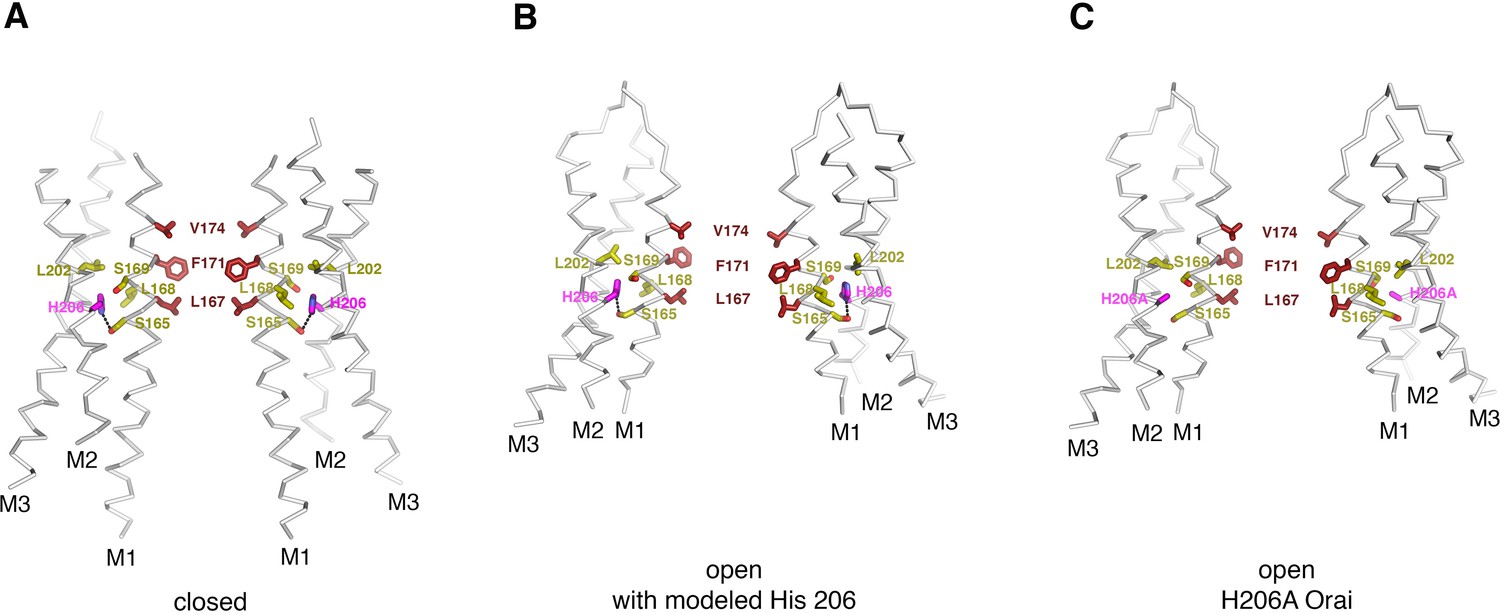
Residue 206 in the closed and open conformations.
(A) In the closed structure (PDB ID:4HKR), His 206 forms a hydrogen bond with Ser 165 (dashed line) and is in van der Waals contact with Leu 202, Leu 168, and Ser 169. (B) Modeling of a histidine residue at position 206 into the OraiH206A open structure. The side chain of His 206 can be accommodated in the cryo-EM structure of OraiH206A with minor adjustments to the surrounding amino acid side chains (refer to panel c for these adjustments). In the model, and in a similar manner as in the closed structure, His 206 forms a hydrogen bond with Ser 165 (dashed line) and is in van der Waals contact with Leu 202, Leu 168, and Ser 169. (C) Depiction of the structure of OraiH206A. In this open structure, the alanine at residue 206 eliminates the hydrogen bond to Ser 165 but the H206A residue still interacts with Leu 168 and Leu 202. The structures in (A–C) are drawn as ribbons with the indicated residues shown as sticks. Residue 206 is colored magenta; residues that are in close contact with it are colored yellow; and the residues of M1 that form the hydrophobic region of the pore are colored dark red.
Figure 9—figure supplement 3
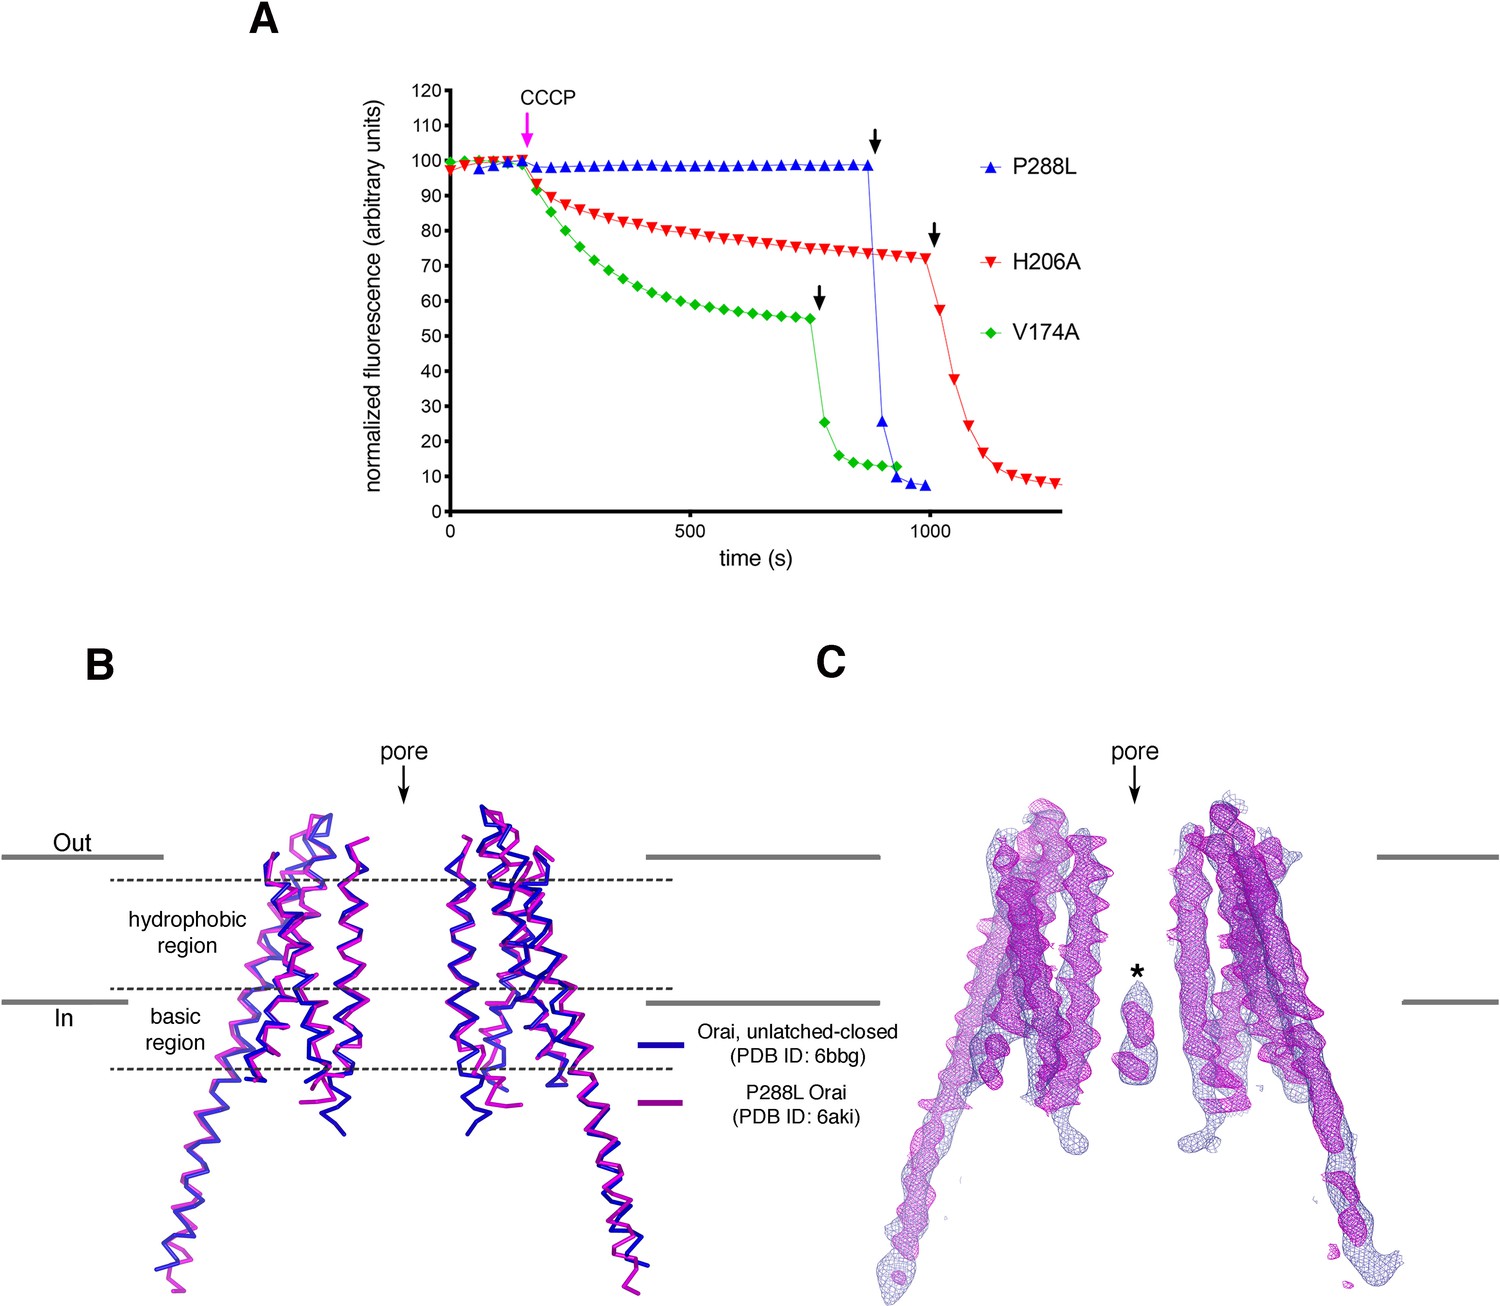
Analyses of P288L Orai.
(A) Ion flux measurements of purified Orai mutants. K+ flux measurements for Orai with the H206A, P288L, or V174A mutations under divalent-free conditions. The assay was performed as previously described (Hou et al., 2018; Hou et al., 2012). Proteoliposomes containing purified Orai with the indicated mutations were loaded with 150 mM KCl and were diluted 50-fold into flux buffer containing a fluorescent pH indicator (ACMA) and 150 mM N-methyl-D-glucamine (NMDG) to establish a K+ gradient (Materials and methods). After stabilization of the fluorescence signal (150 s), a proton ionophore (CCCP) was added. An electric potential arising from K+ efflux drives the uptake of protons, which quenches the fluorescence of ACMA. The time-dependent decrease in fluorescence observed for the H206A and V174A after the addition of CCCP is indicative of K+ flux, whereas K+ flux is not detected for the P288L mutant. Valinomycin, which renders the vesicles permeable to K+, was added near the end of the experiment (black arrows) as a positive control and to establish baseline fluorescence. Traces were normalized by dividing by the initial fluorescence value, which was within ±10% for each experiment. The experiments shown used a protein-to-lipid ratio of 1:100 (wt/wt). Higher concentrations of the P288L mutant (ratios of 1:10 and 1:50) yielded analogous results; ion flux was not detected through P288L Orai. As expected, wild-type Orai does not show K+ flux in this assay as it is not active without STIM (Hou et al., 2018; Hou et al., 2012). (B) Superposition of an X-ray structure of P288L Orai (Liu et al., 2019) with an X-ray structure of Orai without this mutation (WT Orai) in the unlatched-closed conformation, in which the pore is closed (Hou et al., 2018). Two opposing subunits from each structure are shown, with the WT and P288L structures depicted as blue and magenta ribbons, respectively. The RMSD of the superposition is 1.5 Å (for Cα atoms from M1 to M4). (C) Superposition of the electron densities. Electron densities for WT and P288L Orai are drawn in blue and magenta mesh representations, respectively, covering the two subunits shown in (B). The map of WT Orai (contoured at 1.3 σ) was calculated from 20 to 6.9 Å resolution using amplitudes and MR-SAD phases that had been improved by NCS averaging, solvent flattening, and histogram matching (as described in Hou et al., 2018). The density from the P288L Orai structure (2Fo-Fc electron density map, contoured at 1.5 σ) was generated using map coefficients FWT and PHWT downloaded from RCSB Protein Data Bank (PDB ID: 6AKI). The structure and electron density superpositions show that the two structures are indistinguishable within the transmembrane region of the channel and that both structures contain the narrow hydrophobic region characteristic of a closed pore. An asterisk indicates the density assigned to an anion/iron complex that was observed in the basic region of the closed pore (Hou et al., 2018; Hou et al., 2012). Similar density is present in the P288L structure, but this density was modeled as Cl− (Liu et al., 2019). However, because Cl− ions would not be visible in low-resolution maps, we suggest that the density more likely represents the anion/iron complex that is observed when the pore is closed (Hou et al., 2018; Hou et al., 2012).
Videos
Video 1
Opening transition, depicted as in Figure 9, showing a morph between the closed and open conformations.
Video 2
Opening transition, showing a side view of the pore.
Depicted similar to Figure 9, this video shows a side view of a morph between the closed and open conformations. Two opposite subunits are drawn as ribbons with amino acids in the hydrophobic region of the pore depicted as red sticks. Gly 170 residues are shown as blue spheres.
Tables
Key resources table
| Reagent type (species) or resource | Designation | Source or reference | Identifiers | Additional information |
|---|---|---|---|---|
| Gene Drosophila melanogaster | Orai | NCBI | Gene ID: 37040 | |
| Gene Drosophila melanogaster | STIM | NCBI | Gene ID: 32556 | |
| Recombinant DNA reagent | gCamp6s plasmid | Chen et al., 2013 | ||
| Recombinant DNA reagent | pNEH-mCHerry plasmid | Modified from the pNGFP-EU vector (Kawate and Gouaux, 2006) | ||
| Cell line (Homo sapiens) | HEK293 | ATCC | CRL-1573, Lot #: 61714301 | |
| Antibody | Drosophila Orai-19B5 (mouse monoclonal) | Monoclonal Antibody Core Facility of the Memorial Sloan Kettering Cancer Center | (1 μM for ELISA) | |
| Antibody | Peroxidase AffiniPure Goat Anti-Mouse IgG, Fcγ fragment specific | Jackson ImmunoResearch | 115-035-071 | (1:2000 for ELISA) |
| Antibody | YL1/2 (rat monoclonal) | Kilmartin et al., 1982 | (20 mg per 1 g of CNBr resin) | |
| Chemical compound, drug | 1-Palmitoyl-2-oleoyl-sn-glycero-3-phosphoethanolamine | Avanti Polar Lipids | 850757 | |
| Chemical compound, drug | 1-Palmitoyl-2-oleoyl-sn-glycero-3-phospho-(1'-rac-glycerol) (sodium salt) | Avanti Polar Lipids | 840457 | |
| Chemical compound, drug | n-Dodecyl-β-D-Maltopyranoside | Anatrace | O310S | |
| Chemical compound, drug | Amphipol A8-35 | Anatrace | A835 | |
| Chemical compound, drug | n-Octyl-β-D-maltopyranoside | Anatrace | O310 | |
| Chemical compound, drug | n-Decyl-β-D-maltopyranoside | Anatrace | D322 | |
| Chemical compound, drug | Deferoxamine mesylate | Sigma-Aldrich | D9533 | |
| Chemical compound, drug | Thapsigargin | Sigma-Aldrich | T9033 | |
| Chemical compound, drug | Lipofectamine 3000 Transfection Reagent | Thermo Fisher | L3000008 | |
| Chemical compound, drug | 1-Step Ultra TMB-ELISA Substrate | Thermo Scientific | 34029 | |
| Software, algorithm | MotionCor2 | Zheng et al., 2017 | RRID:SCR_016499 | |
| Software, algorithm | CtfFind 4.1.10 | Rohou and Grigorieff, 2015 | RRID:SCR_016731 | |
| Software, algorithm | RELION 3.0 | Scheres, 2016 | http://www2.mrc-lmb.cam.ac.uk/relion RRID:SCR_016274 | |
| Software, algorithm | SerialEM | Mastronarde, 2005 | RRID:SCR_017293 | |
| Software, algorithm | cryoSPARC v2 | Structura Biotechnology | https://cryosparc.com/ RRID:SCR_016501 | |
| Software, algorithm | PHENIX | Liebschner et al., 2019 | https://www.phenix-online.org/ RRID:SCR_014224 | |
| Software, algorithm | COOT | Emsley et al., 2010 | https://www2.mrc-lmb.cam.ac.uk/personal/pemsley/coot/ RRID:SCR_014222 | |
| Software, algorithm | PyMOL | Schrödinger, 2020 | https://pymol.org/2/ RRID:SCR_000305 | |
| Software, algorithm | UCSF Chimera | Pettersen et al., 2004 | https://www.cgl.ucsf.edu/chimera RRID:SCR_004097 | |
| Software, algorithm | GraphPad Prism 7 | GraphPad Software | https://cryosparc.com/ RRID:SCR_016501 | |
| Software, algorithm | Hole | Smart et al., 1996 | http://www.holeprogram.org | |
| Software, algorithm | UCSF ChimeraX | Goddard et al., 2018 | https://www.cgl.ucsf.edu/chimerax/ | |
| Others | QUANTIFOIL R1.2/1.3 holey carbon grids | Quantifoil | ||
| Others | FEI Vitrobot Mark IV | FEI Thermo Fisher |
Additional files
Download links
A two-part list of links to download the article, or parts of the article, in various formats.
Downloads (link to download the article as PDF)
Open citations (links to open the citations from this article in various online reference manager services)
Cite this article (links to download the citations from this article in formats compatible with various reference manager tools)
Cryo-EM structure of the calcium release-activated calcium channel Orai in an open conformation
eLife 9:e62772.
https://doi.org/10.7554/eLife.62772


