Molecular tracking devices quantify antigen distribution and archiving in the murine lymph node
- Department of Biochemistry and Molecular Genetics, University of Colorado School of Medicine, United States
- RNA Bioscience Initiative, University of Colorado School of Medicine, United States
- Immunology Graduate Program, University of Colorado School of Medicine, United States
- Department of Immunology and Microbiology, University of Colorado School of Medicine, United States
- Department of Medicine, Division of Gastroenterology and Hepatology, University of Colorado School of Medicine, United States
Figures
Figure 1 with 2 supplements
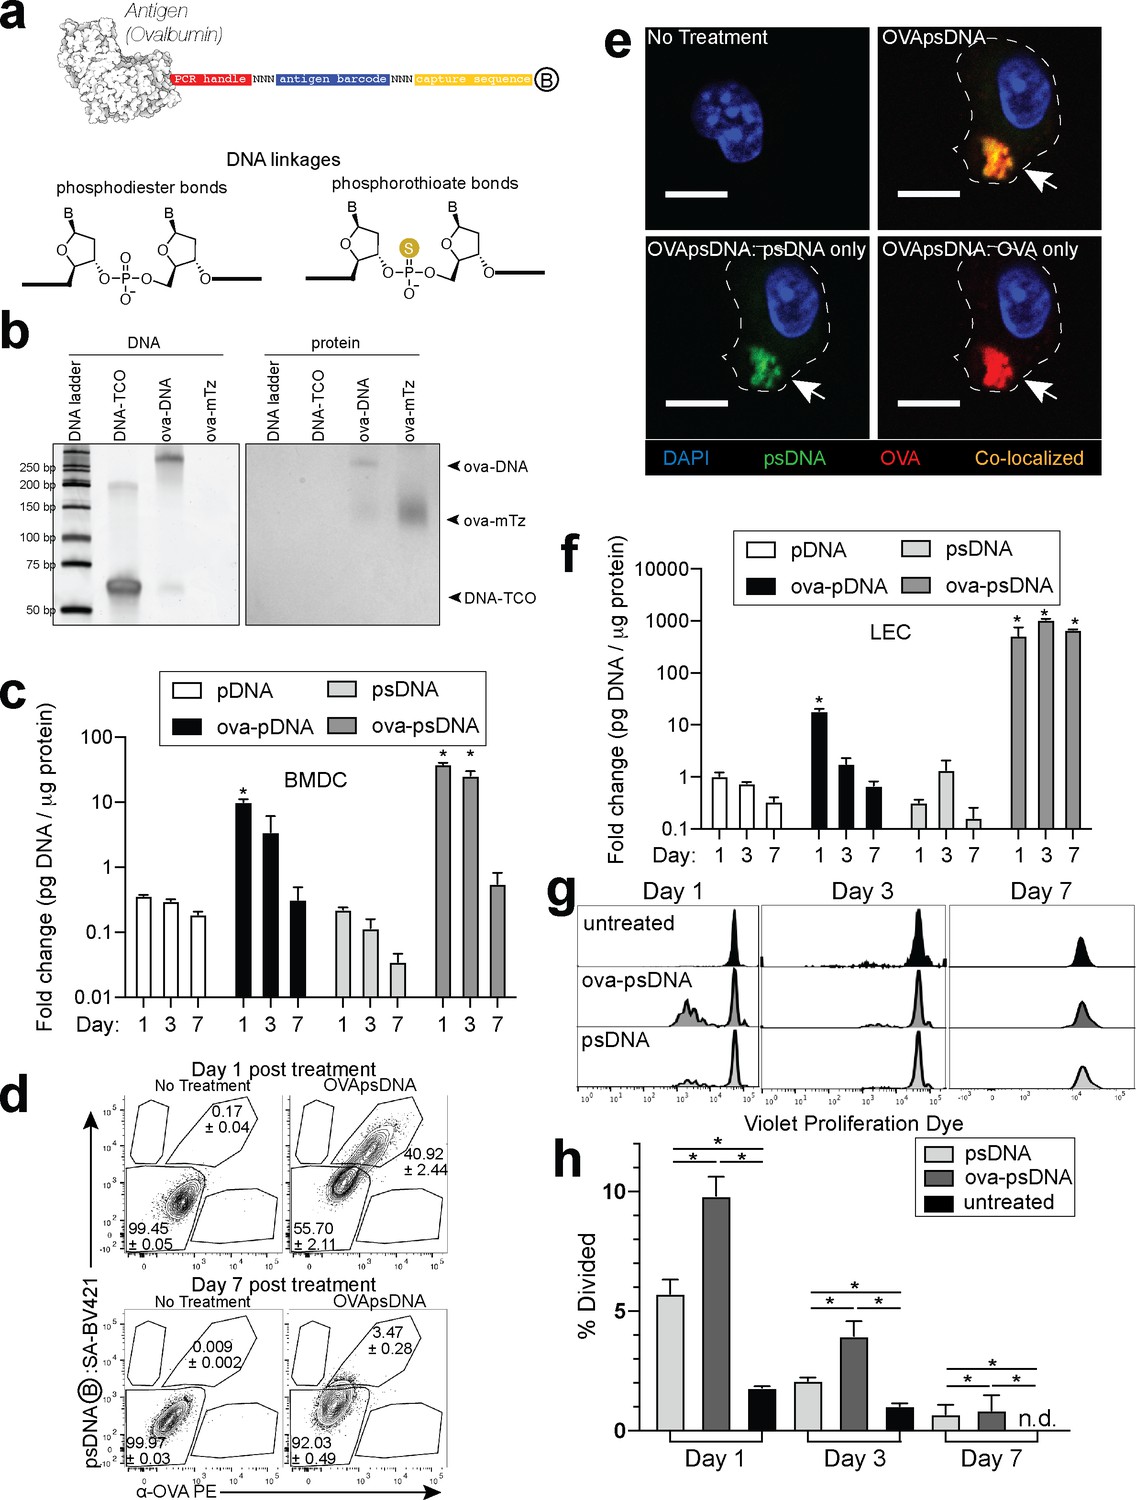
Antigen-psDNA conjugates undergo normal processing and presentation.
(a) Schematic of ovalbumin (PDB code 1ova) antigen conjugation to barcoded DNA with phosphodiester and phosphorothioate DNA linkages and a 3′ biotin label (circle with B inside). Sulfur replaces a non-bridging oxygen to create a DNA phosphorothioate linkage. List of oligo sequences used can be found in Figure 1—source data 1. (b) Conjugation of oligonucleotides to ovalbumin. Purified conjugate was analyzed by 10% TBE native PAGE stained with GelRed for DNA (left) followed by Coomassie staining for protein (right). DNA-TCO: 61 nt barcoded oligonucleotide with 5′-trans-cyclooctene (TCO); ova-mTZ: ovalbumin functionalized with methyltetrazine (mTZ); ova-DNA: DNA-conjugated ovalbumin product with oligonucleotide attached. (c) Bone marrow-derived dendritic cells (BMDCs) were treated with pDNA, psDNA, ova-pDNA, or ova-psDNA (5 µg) by addition to the culture media. After 1, 3, and 7 days, cells were washed, released, lysed, and analyzed for pDNA or psDNA by qPCR. Values are displayed as fold-change relative to the negative control (cells alone). Asterisks denote sample significant amounts relative to the negative control (p<0.01; Wilcoxon rank-sum test). Error bars represent standard error of the mean (SEM). 3–5 wells were evaluated per group on 2–3 independent occasions. (d) Flow cytometric analysis of ova-psDNA conjugates acquired by BMDCs after 1 day or 7 days. Cells were washed 1 day after ova-psDNA treatment. Harvested BMDCs were stained with anti-ovalbumin made in rabbit and a secondary anti-rabbit conjugated to Phycoerythrin (PE) and then stained with streptavidin conjugated to brilliant violet 421 to visualize the 3′ biotin label on the psDNA. Shown are average and ± standard error. Experiment was performed three times with three technical replicates. (e) As in (d) except cells were plated onto glass coverslips and treated with ova-psDNA for 24 hr prior to staining with either anti-ovalbumin and a secondary conjugated to PE (red) followed by streptavidin conjugated to Fluorescein Isothiocyanate (FITC) (green). Co-localization is shown in yellow. Scale bar is 10 μm. Imaging was repeated three independent times. Approximately 100 cells were visualized with a similar frequency of double-positive cells as observed in (d). No single-positive cells were detected. (f) Analysis of DNAs as in (c) using murine lymph node lymphatic endothelial cells. (g) BMDCs were incubated with ova-psDNA (conjugated), ova plus psDNA (unconjugated), or PBS for 1, 3, and 7 days prior to adding OT-1 T cells labeled with violet proliferation dye. T cells and BMDCs were co-cultured at a ratio of 1:10 for 3 days. (h) Quantification of (g) using the percent divided calculation described in the Materials and methods. Experiments were performed three times with 3–5 wells per sample with similar results. Error bars represent SEM. Asterisks denote sample significant amounts relative to the negative control (p<0.05 Wilcoxon rank-sum test). Exact p-values are as follows: day 1 psDNA:ova-psDNA p=0.008, psDNA:untreated p=0.016, ova-psDNA:untreated p=0.016; day 3 psDNA:ova-psDNA p=0.008, psDNA:untreated p=0.016, ova-psDNA:untreated p=0.016; day 7 psDNA:ova-psDNA p=1, psDNA:untreated p=0.400, ova-psDNA:untreated p=0.400. n.d.: none detected.
-
Figure 1—source data 1
Antigen tags and other oligonucleotide sequences used in qPCR and single-cell experiments.
- https://cdn.elifesciences.org/articles/62781/elife-62781-fig1-data1-v2.xlsx
Figure 1—figure supplement 1
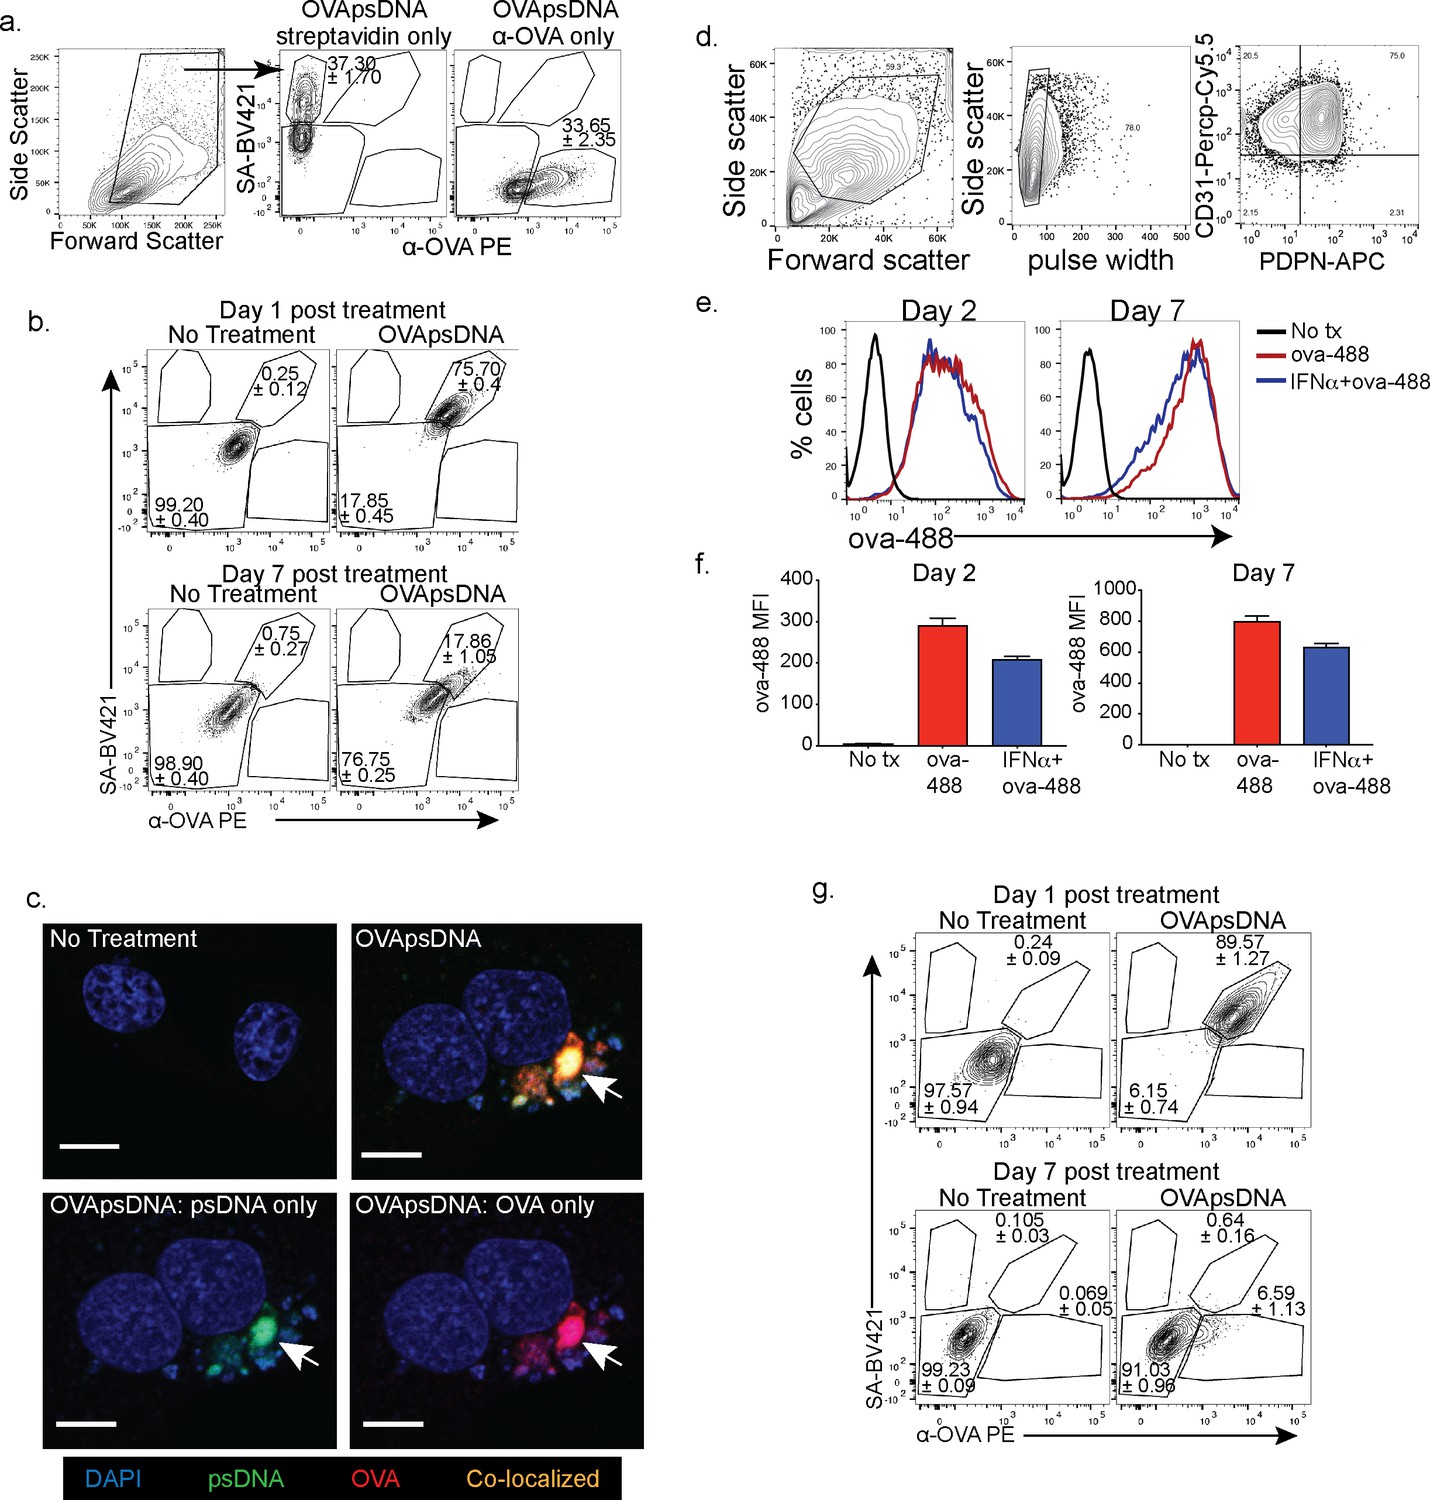
Visualization of antigen and DNA in different cell types.
(a) Gating and single-color staining controls for anti-ovalbumin (ova) and streptavidin 1 day post addition of ova-psDNA. (b) Flow cytometry of SV-40 transformed endothelial cells (SVEC) with indicated stains at indicated time points as in (a). Experiment was repeated three times with three replicates. (c) Immunofluorescence of SVECs treated with ova-psDNA for 24 hr using anti-ova followed by a secondary anti-rabbit conjugated to PE and streptavidin conjugated with FITC. Cells were mounted with vectashield with DAPI. Scale bar is 10 μm. Approximately 100 cells were visualized with a similar frequency of double-positive cells as detected in (b). No single-positive cells were detected. (d) Gating strategy for murine lymphatic endothelial cells. (e) Amount of ova conjugated to Alexa Fluor 488 that was acquired over a 2–7-day period in the presence or absence of type 1 IFN. (f) Quantification of fluorescence intensity 2 or 7 days after treatment as indicated. Experiment was performed at least three times with three replicates each. (g) Flow cytometry of bone marrow- derived macrophages (BMDMs) with indicated stains at indicated time points as in (a). Experiment was repeated three times with three replicates.
Figure 1—figure supplement 2
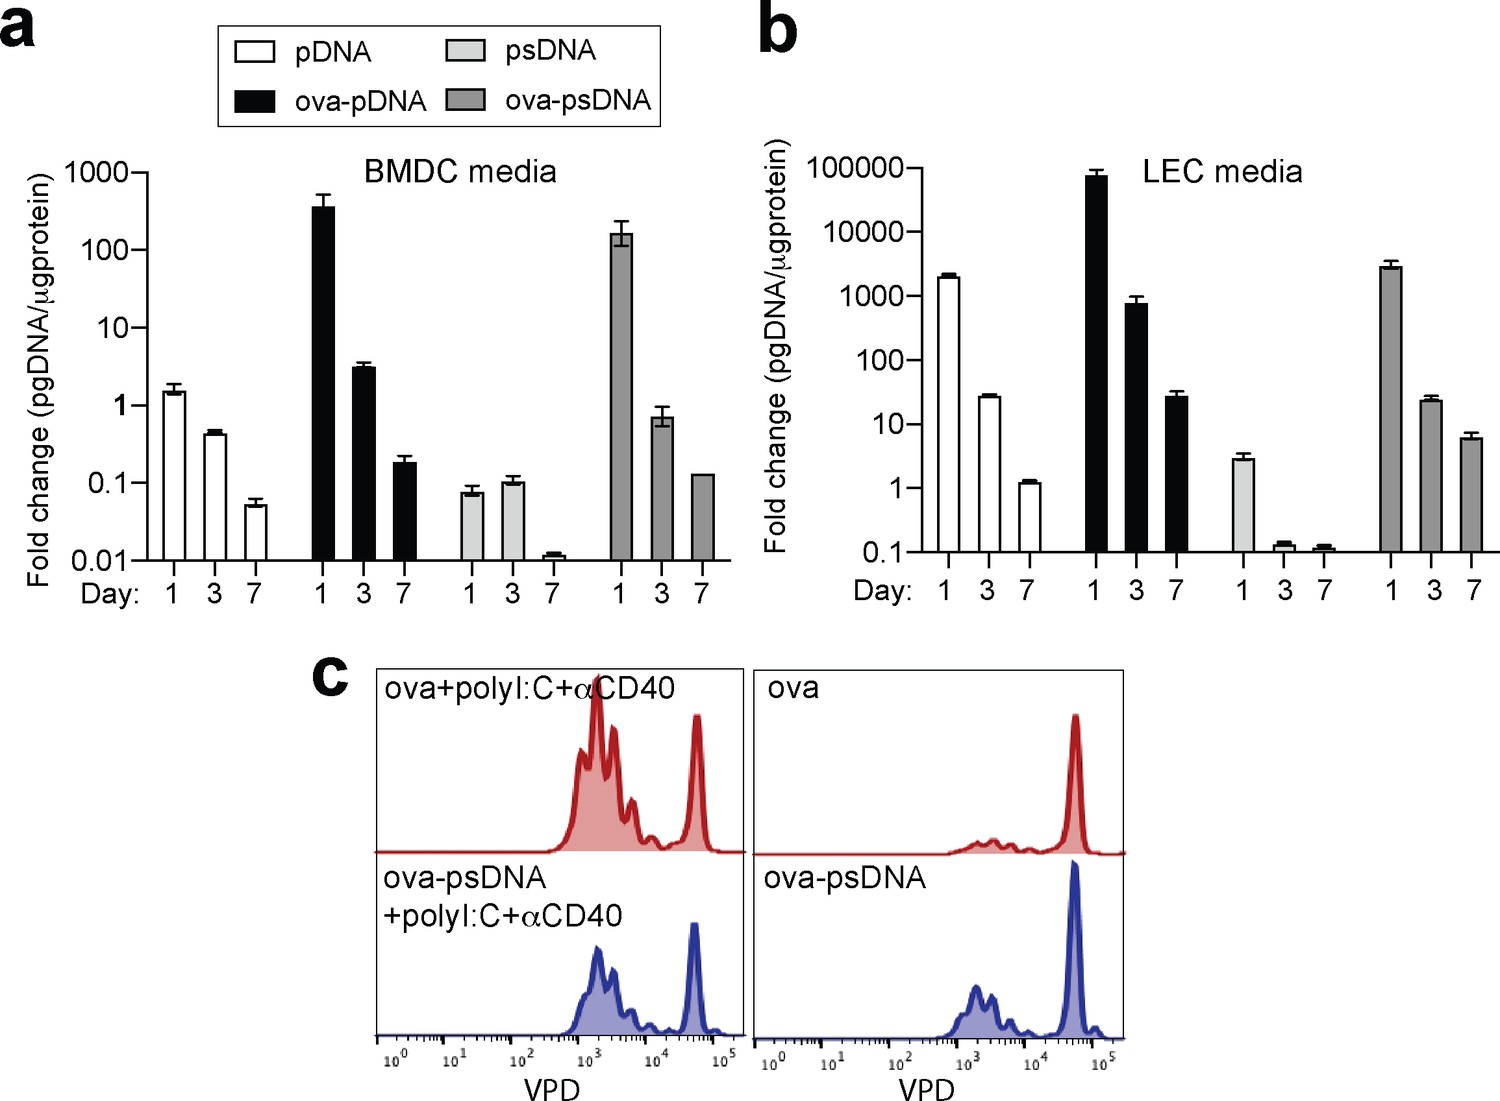
DNA barcode is not retained in cell media over time.
(a) Bone marrow- derived dendritic cells (BMDCs) were grown for 7 days and cultured in GM-CSF. After 7 days, 5 mg of either pDNA, psDNA, ova-pDNA, or ova-psDNA were added to the culture media, and 1, 3, or 7 days after addition, media was removed and qPCR was performed on using primers against the DNA added. 3–5 wells were evaluated per group on 2–3 independent occasions. (b) As in (a) except with murine lymph node lymphatic endothelial cells. (c) As in Figure 1h, I, BMDCs were treated with ovalbumin (ova) (5 μg) ± polyI:C and anti-CD40 (20 μg each) or ova-psDNA ± polyI:C and anti-CD40 overnight and then co-cultured with Carboxyfluorescein Succinimidyl Ester (CFSE)-labeled OT1 T cells for 3 days before evaluating CFSE dilution by flow cytometry. Experiments were performed three times with 3–5 wells per sample with similar results.
Figure 2 with 2 supplements
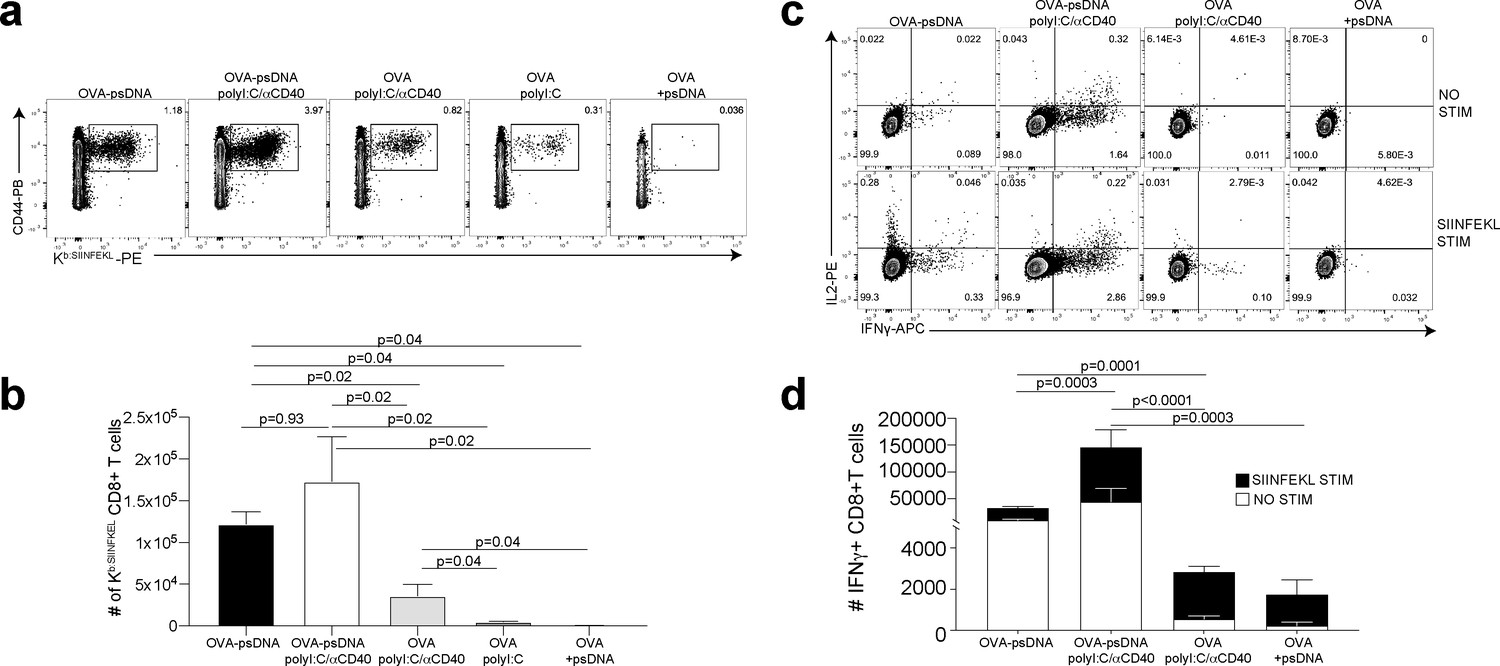
Antigen-psDNA conjugates elicit a robust immune response in vivo.
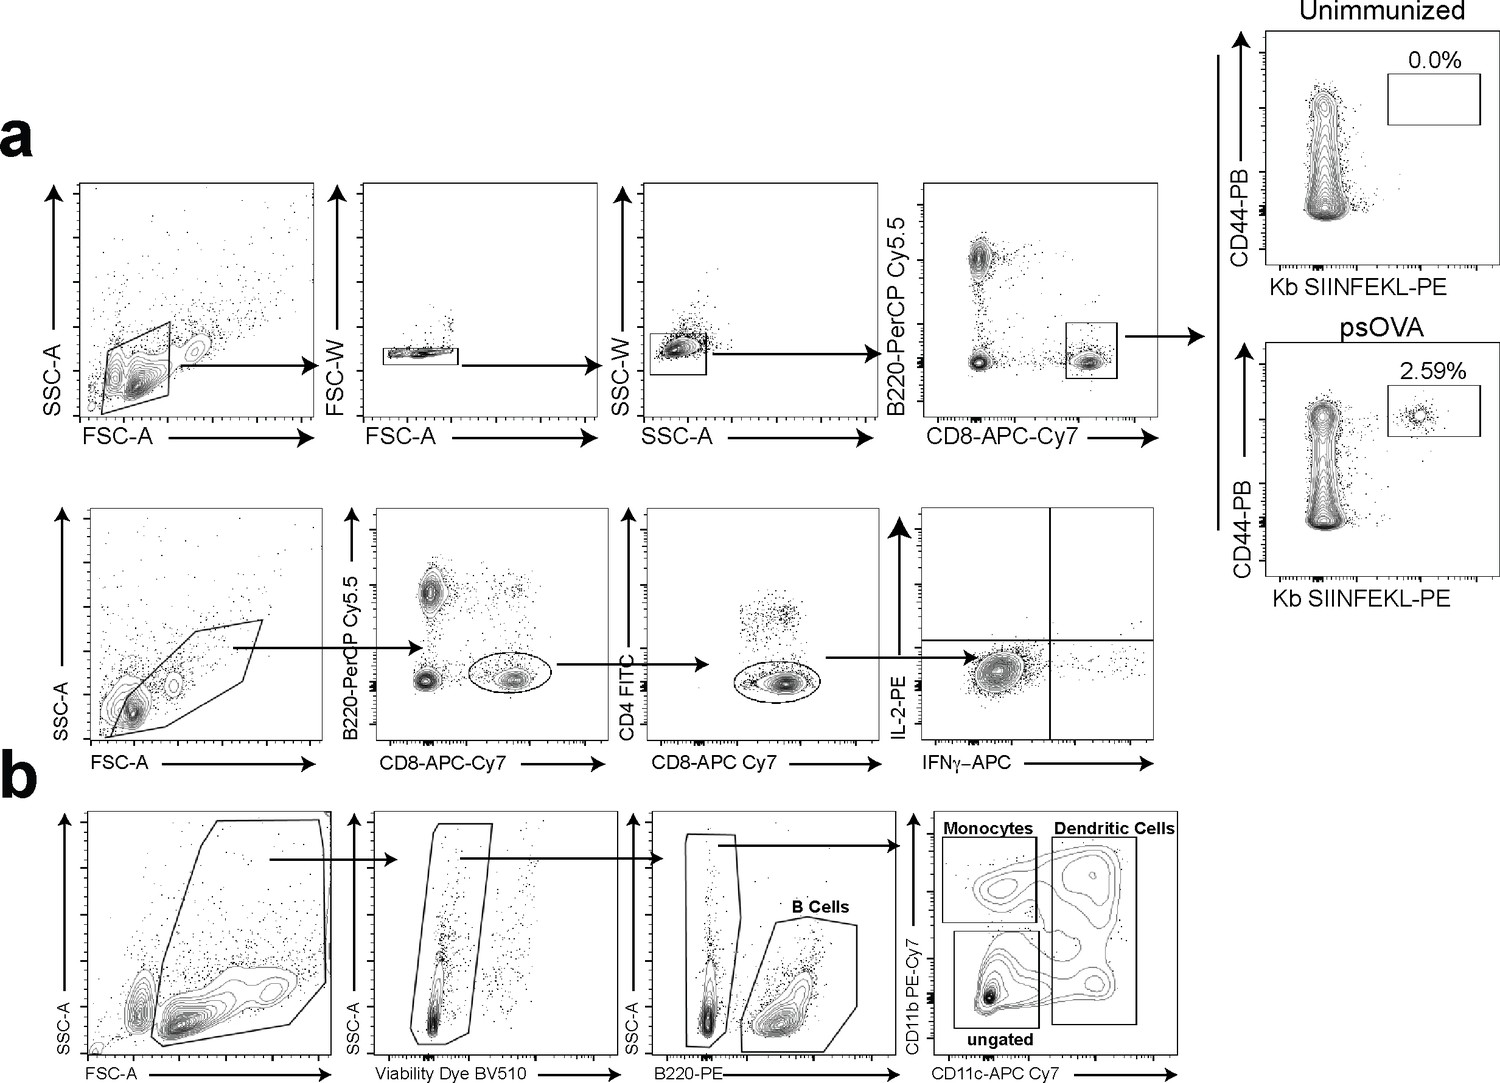
(a) Mice were immunized in the footpad with ovalbumin (ova) alone or ova-psDNA with or without polyI:C/aCD40 or polyI:C. After 7 days, draining popliteal lymph nodes (LNs) were harvested and cells were stained and gated as B220-, CD3+, CD8+, CD44+, and OVA257 Kb SIINFEKL-specific tetramer to measure antigen-specific CD8 T cell responses. (b) Quantification of SIINFEKL-specific CD8 T cells within the LN (data from a). Experiment was performed three times; shown is combined data from at least three mice per group, per experiment. p-Values were calculated using a two-stage step-up method of Benjamini, Krieger, and Yekutieli and did not assume consistent standard deviation. Error bars represent standard error of the mean (SEM). (c) As in (a) and (b) except cells were restimulated with SIINFEKL peptide for 6 hr ex vivo in the presence of brefeldin A, then stained for IFNγ and IL-2. (d) Quantitation of IFNγ-positive CD8+ T cells with or without peptide stimulation in the draining LN. Experiment was performed three times; shown is combined data from at least three mice per group, per experiment. p-Values were calculated using a two-stage step-up method of Benjamini, Krieger, and Yekutieli and did not assume consistent standard deviation. Error bars represent SEM.
Figure 2—figure supplement 1
Gating strategies.
(a) Gating strategy for tetramer staining and intracellular cytokine staining of CD8 T cells. (b) Gating strategy used for cell sorting prior to single-cell RNA sequencing.
Figure 2—figure supplement 2
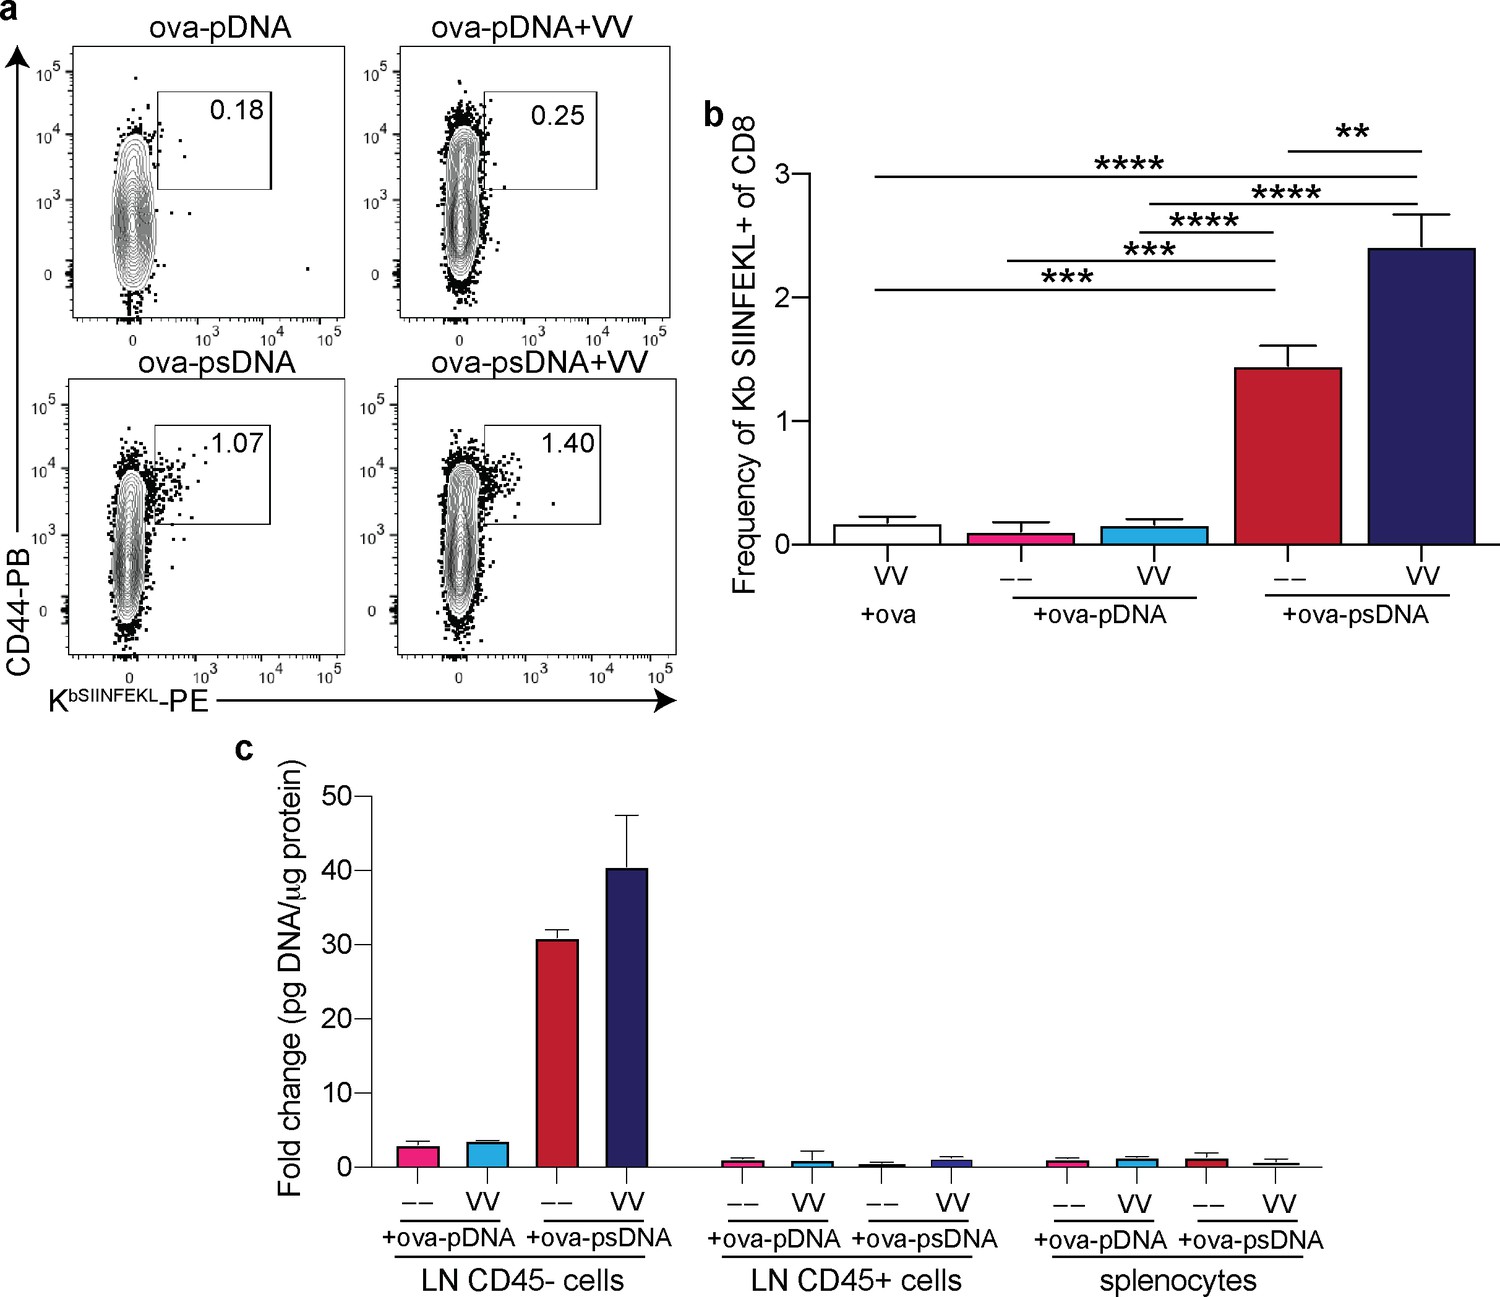
Vaccinia plus ovalbumin (ova)-DNA conjugate induces ova-specific T cell response and archiving.
(a) Mice were vaccinated in the footpad with 10 µg of ova-pDNA (phosphodiester backbone) or ova-psDNA (phosphorothioate backbone) with or without vaccinia virus (103 PFU). Each barcode conjugate contained a unique sequence barcode. 7 days after vaccination, mice were euthanized and draining popliteal lymph node (LN) cells were isolated and stained. Shown are B220-, CD3+, and CD8+ cells. Box indicates the frequency of tetramer-specific and CD44 high cells per lymph node. (b) Quantification of (a). (c) Mice were vaccinated with 10 μg ova conjugated to psDNA (ova-psDNA) plus 1E3 VV-WR, 1E4 VV-WR, or polyI:C/aCD40 (5 μg each) in each footpad. LNs were harvested 20 days later, and Miltenyi bead selection was performed using CD45 to select hematopoietic (CD45+) versus non-hematopoietic (CD45-) cells. The amount of DNA barcode was assessed in each group as a faithful reporter of antigen archiving. Values are displayed as fold-change relative to the negative control naive sample. Experiment was performed twice with 3–4 mice per group.
Figure 3 with 5 supplements
Dynamic acquisition of antigen-psDNA conjugates in lymph node tissue.
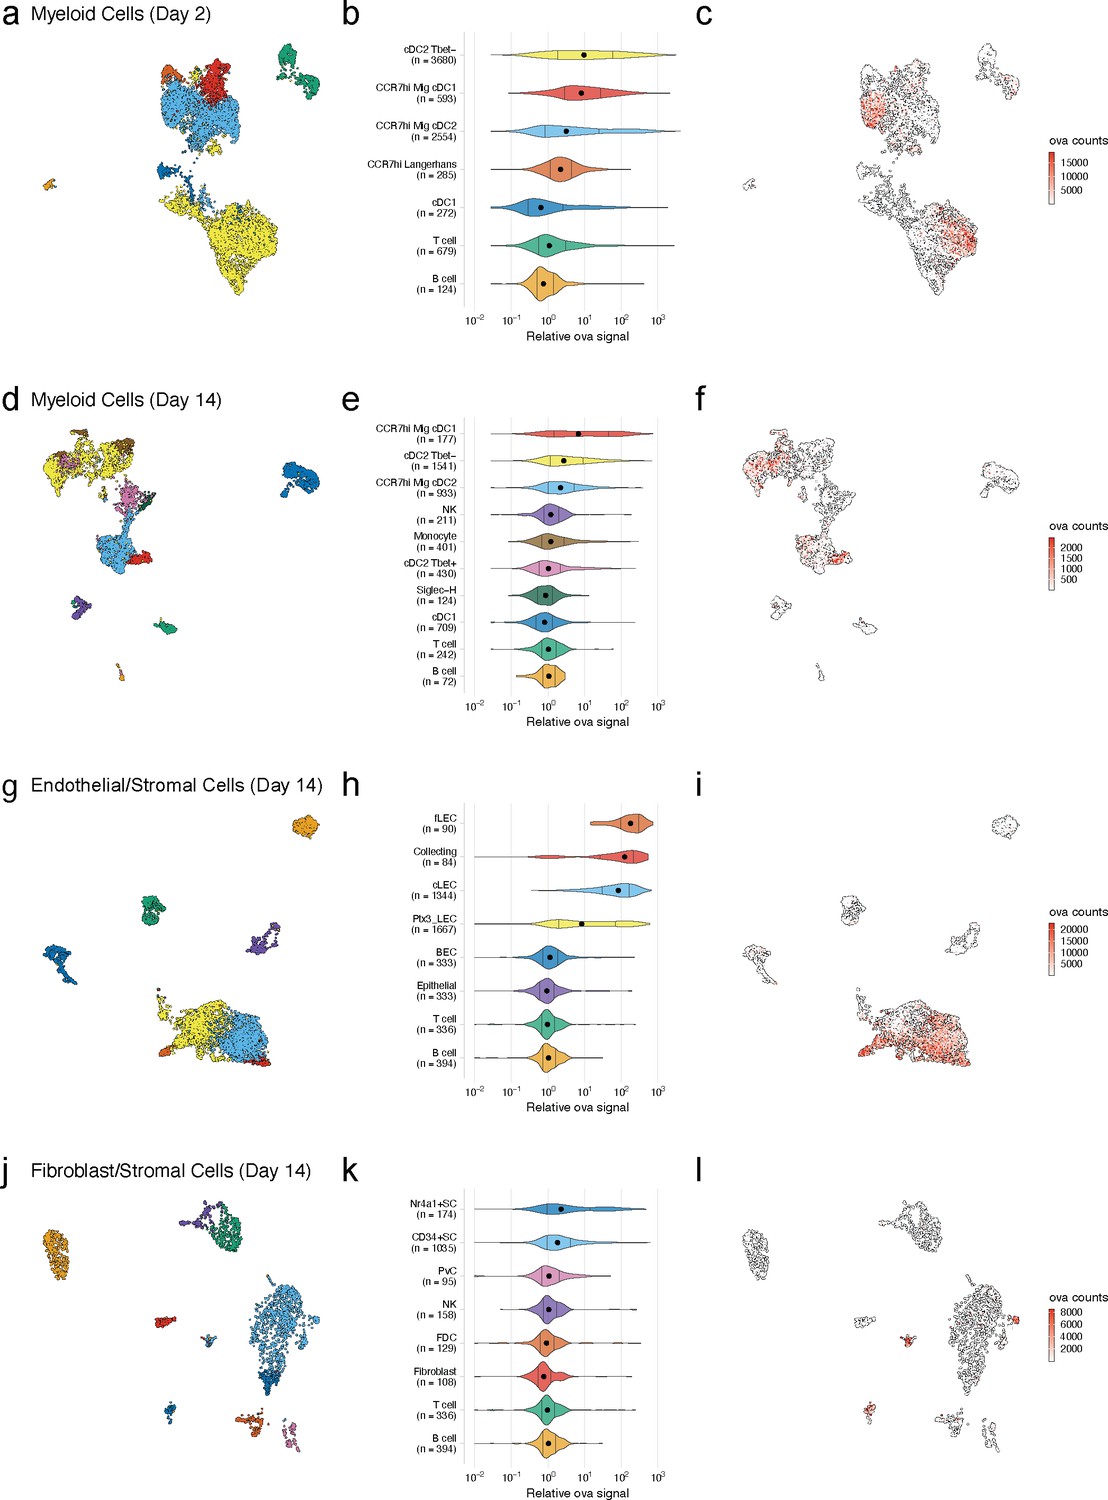
(a, d, g, j) Uniform manifold approximation and projections (UMAPs) are shown for dendritic cells (DCs) (a, d), lymphatic endothelial cells (LECs) (g), and fibroblastic reticular cells (FRC)s (j) at day 2 (a) and day 14 (d, g, j). (b, e, h, k) Relative ovalbumin (ova) signal was calculated by dividing antigen counts for each cell by the median antigen counts for T and B cells. Signals are plotted on log10 scale; black dots indicate median values, and vertical lines denote quartiles. Statistical comparisons between each pair of groups are available in Figure 3—source data 1. (c, f, i, l) unique moleular identifier (UMI)-adjusted antigen counts are displayed on UMAPs for each cell type.
-
Figure 3—source data 1
Comparison of relative ovalbumin (ova) signal for cell types shown in Figure 3—figure supplements 3, 4b, and 5b.
A two-sided Wilcoxon rank-sum test was used to compare relative ova signal for each cell type. Relative ova signal was calculated by dividing antigen counts for each cell by the median antigen counts for T and B cells. The Bonferroni method was used to correct for multiple comparisons. The number of cells in each group (n cells), fraction of the total cells for the sample (frac cells), median relative ova signal, test statistic (statistic), estimation of the median difference (estimate), and confidence interval (conf.low, conf.high) are included.
- https://cdn.elifesciences.org/articles/62781/elife-62781-fig3-data1-v2.xlsx
Figure 3—figure supplement 1
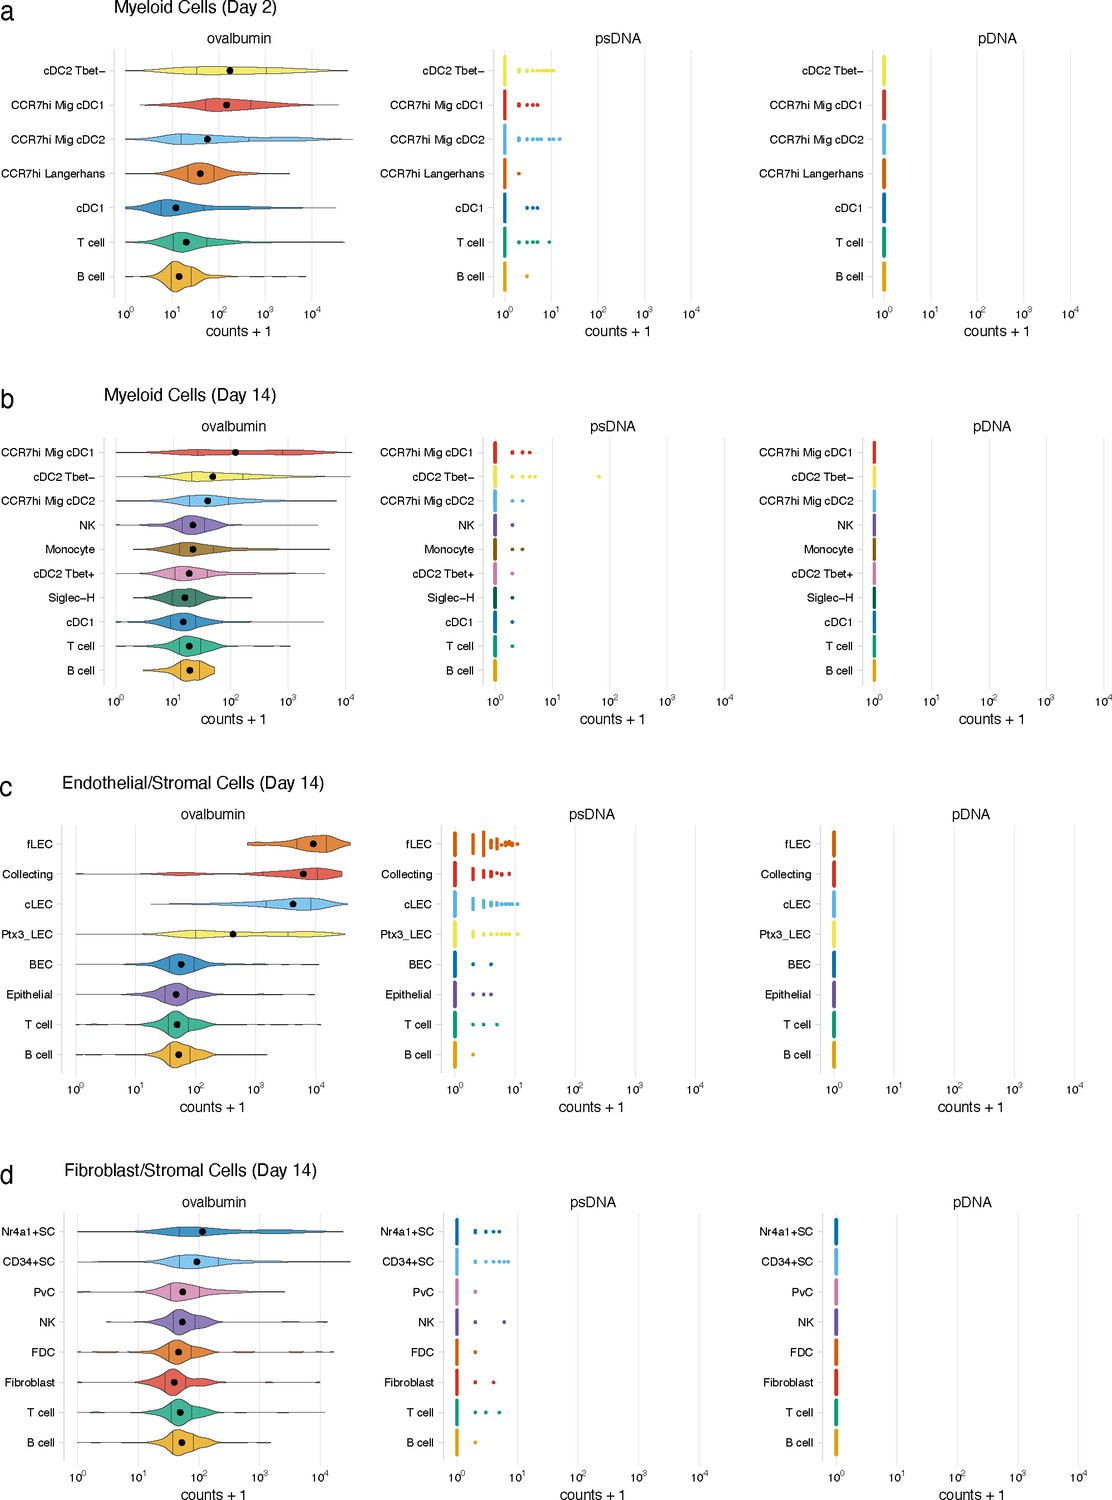
Detection of DNA barcode requires conjugation to ovalbumin (ova).
Mice were vaccinated with ova-psDNA, psDNA, and pDNA with IE3 CFU of VV-WR. Each DNA injected had a unique barcode sequence for detection during sequencing. Counts of ova-psDNA, psDNA, and pDNA for dendritic cells (DCs) at (a) day 2 or (b) day 14. Counts for ova-psDNA, psDNA, and pDNA for (c) lymphatic endothelial cells (LECs) and (d) FRCs 14 days post vaccination.
Figure 3—figure supplement 2
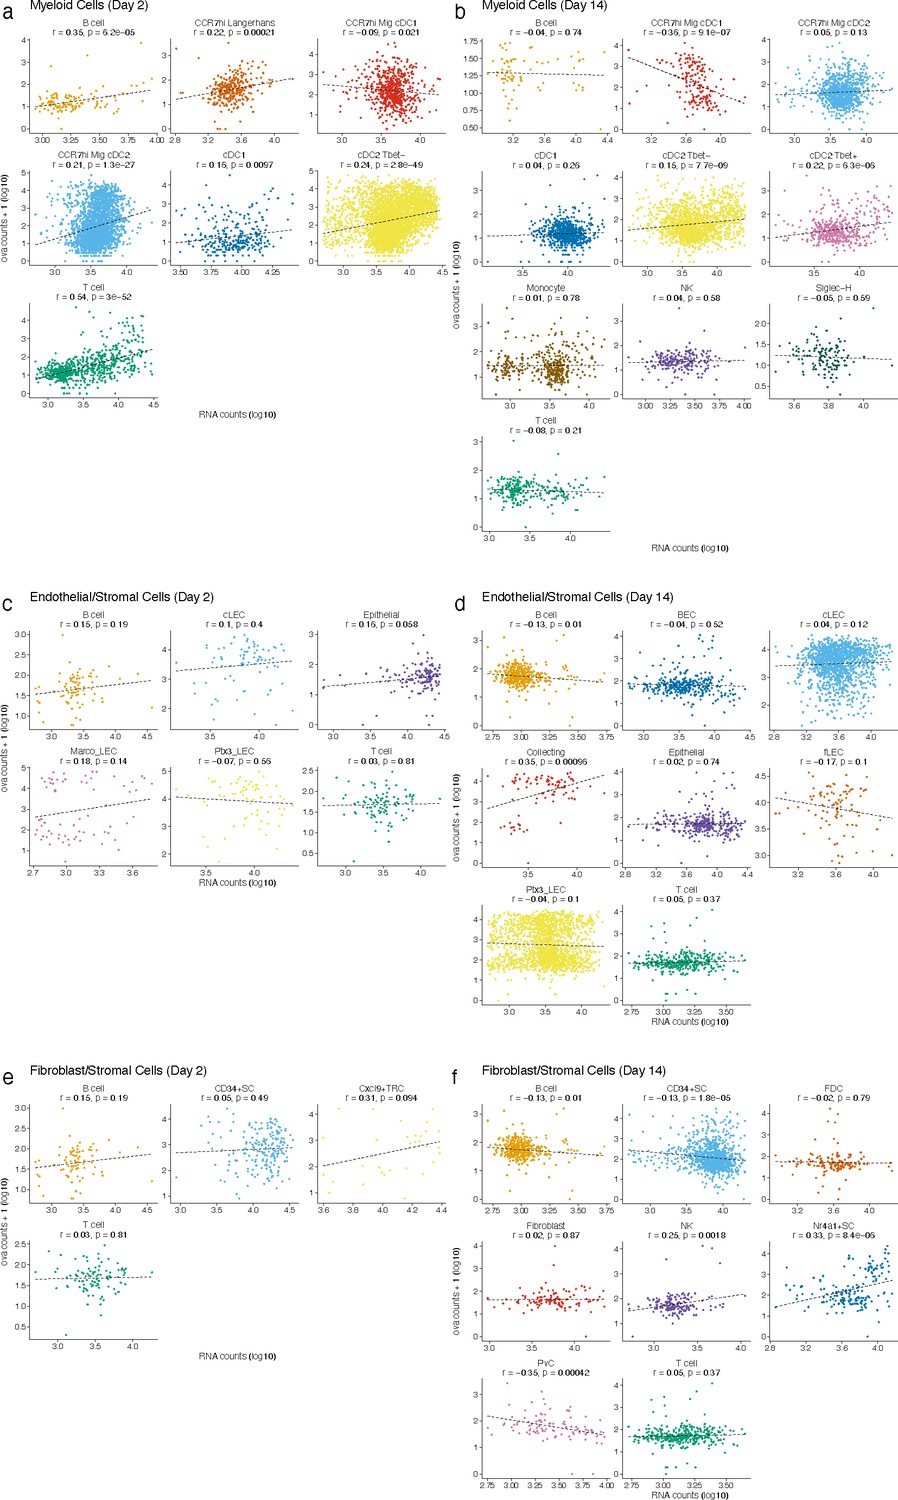
Antigen counts were independent of total mRNA counts.
Antigen counts were compared with total mRNA counts for each cell for dendritic cells (DCs) (a, b), lymphatic endothelial cells (LECs) (c, d), and FRCs (e, f). Pearson’s correlation coefficient and associated p-value are shown for each cell type.
Figure 3—figure supplement 3
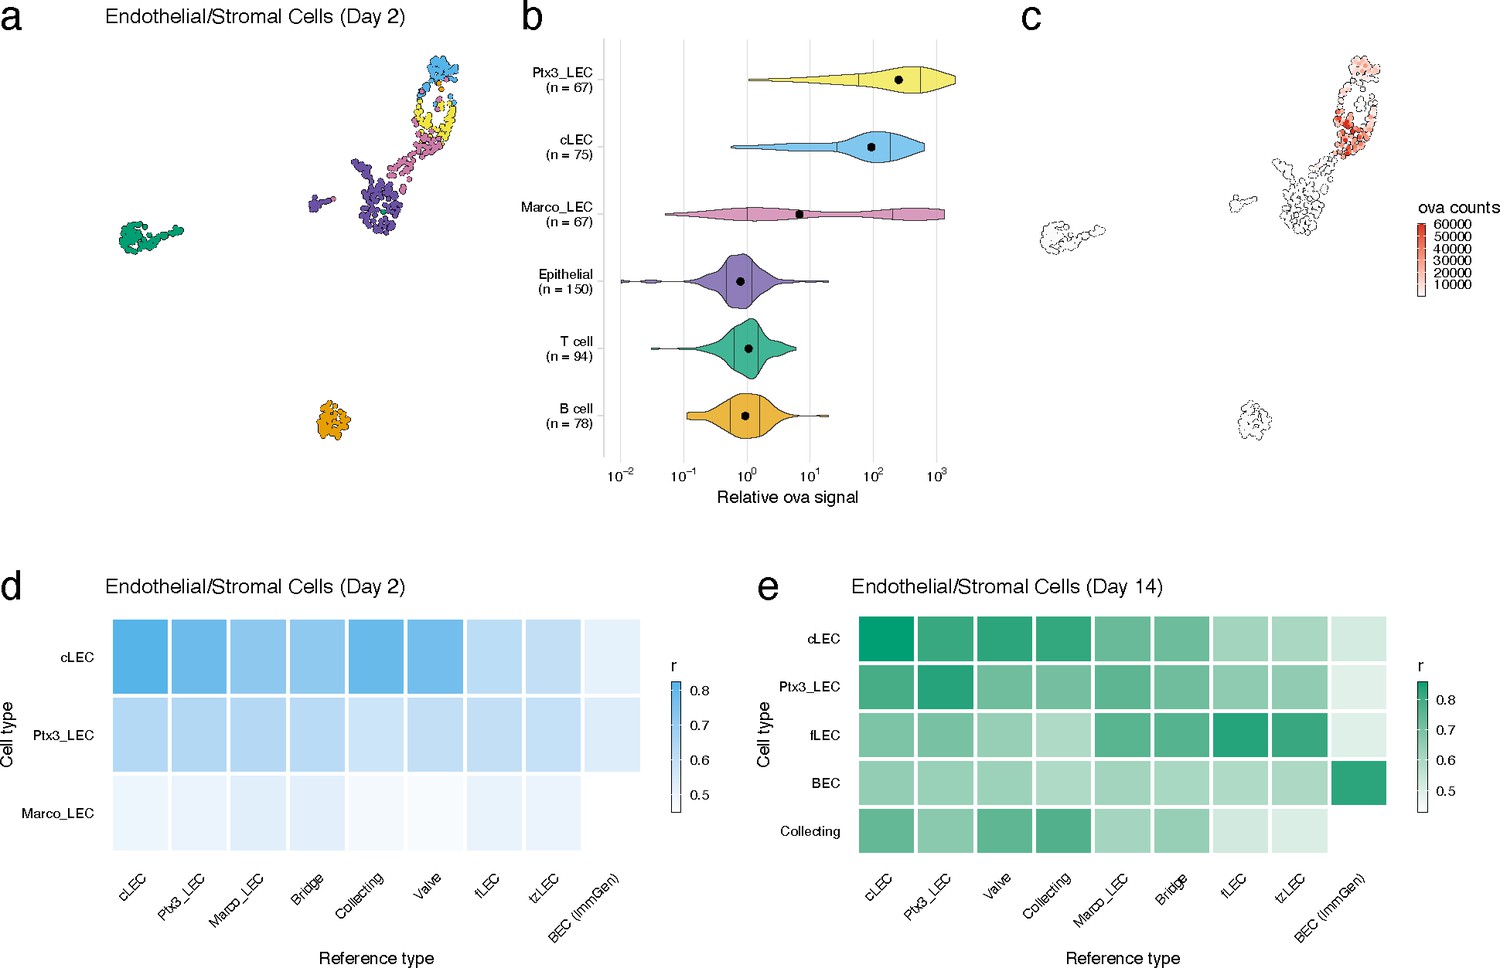
Lymphatic endothelial cell (LEC) types associated with high antigen counts 2 days after vaccination.
(a) A uniform manifold approximation and projection (UMAP) is shown for LEC types, epithelial cells, B cells and T cells identified for the day 2 time point. (b) Relative ovalbumin (ova) signal is shown for each cell type. Relative ova signal was calculated by dividing antigen counts for each cell by the median antigen counts for T and B cells. (c) Antigen counts are displayed on the UMAP shown in (a). (d, e) Correlation coefficients are shown comparing each identified LEC type with the reference cell types from Xiang et al.
Figure 3—figure supplement 4
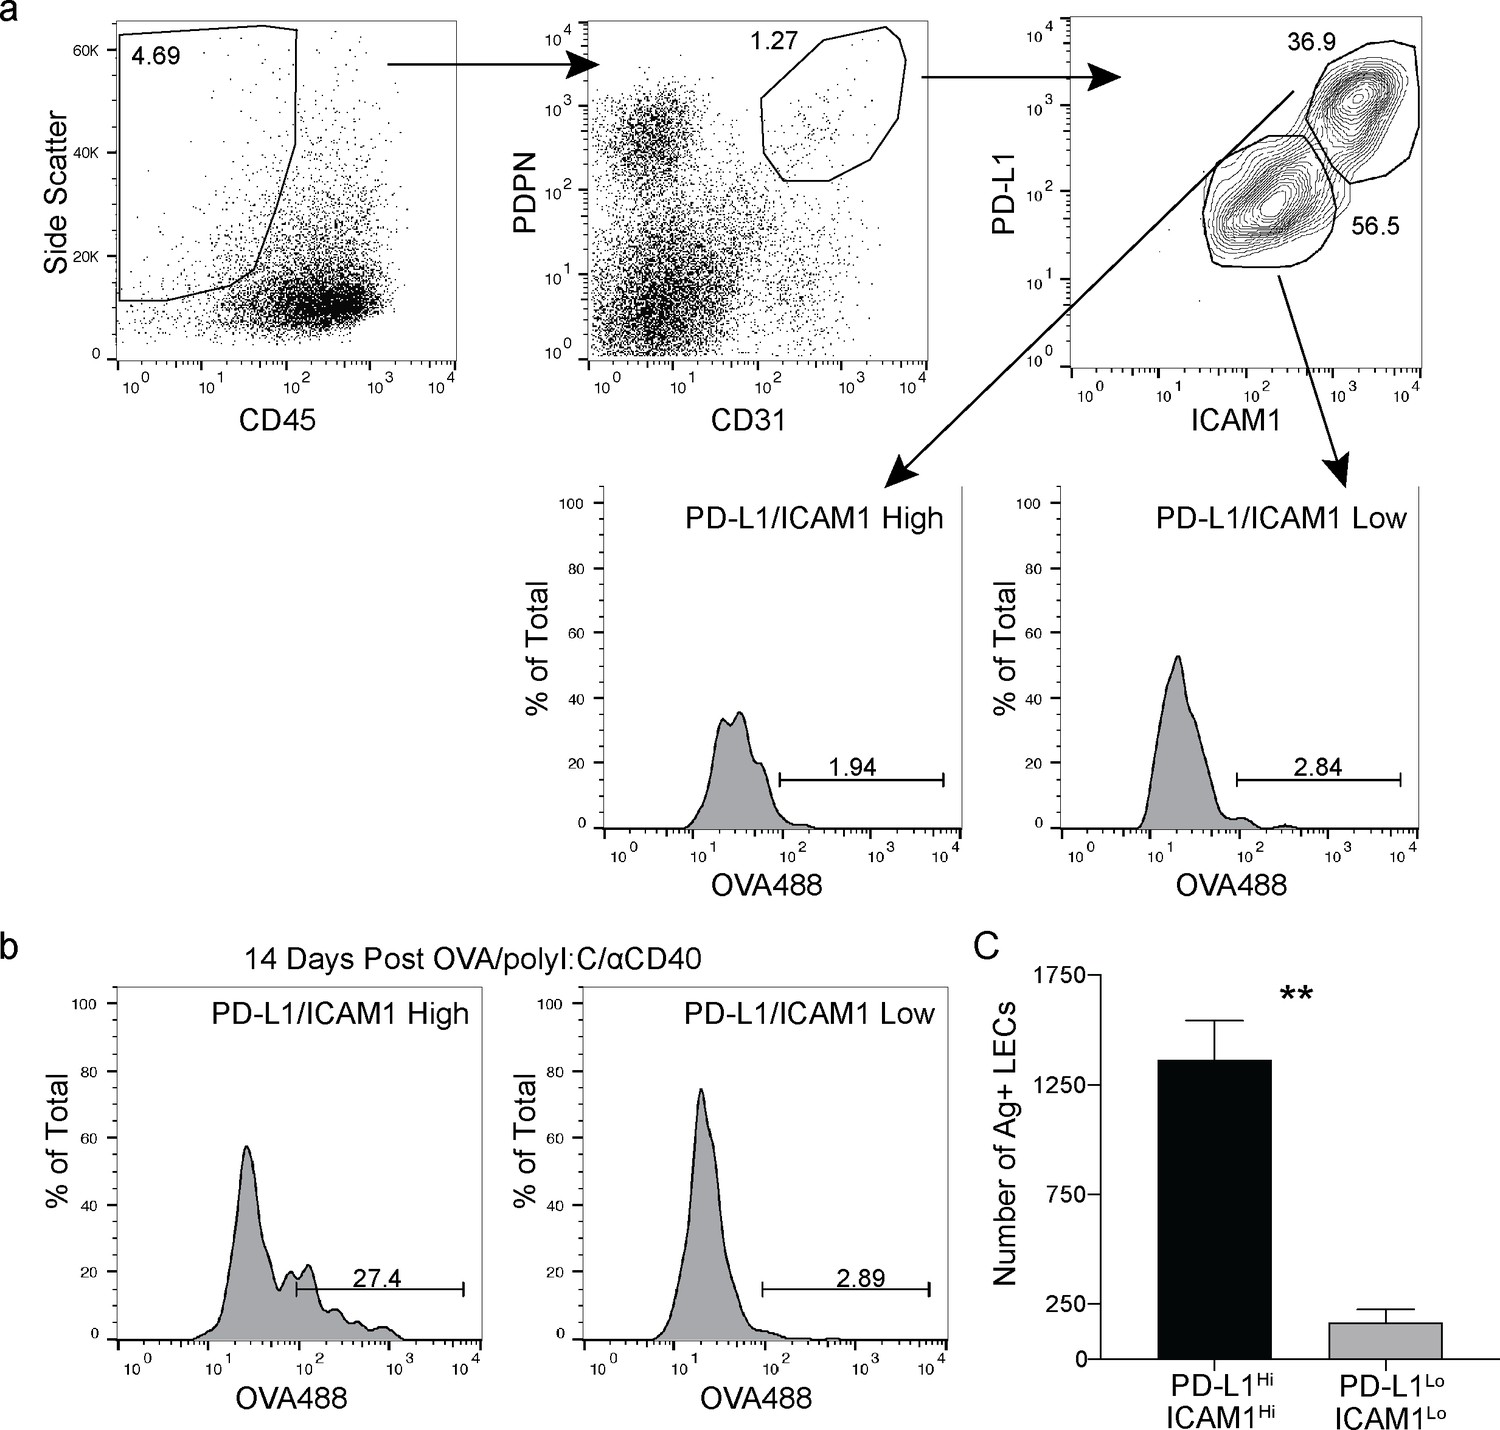
Antigen is held by PD-L1/ICAM1 high lymphatic endothelial cells (LECs).
(a) Gating strategy for LECs in the dLN with markers for ICAM1 and PD-L1. (b) Representative flow plots of antigen held by LECs 14 days following subcutaneous immunization with OVA488 (10 μg/site), polyI:C (5 μg/site), and aCD40 (5. μg/site). LECs were gated first on PD-L1 high/ICAM1 high or PD-L1 low/ICAM1 low and then gated on antigen positive. (c) Quantification of (b) showing the number of antigen-positive LECs gated on PD-L1 high/ICAM1 high or PD-L1 low/ICAM1 low. Statistical analysis was done using an unpaired Student’s t-test, **p=0.0032. Experiment was performed at least three times with 3–5 mice per group.
Figure 3—figure supplement 5
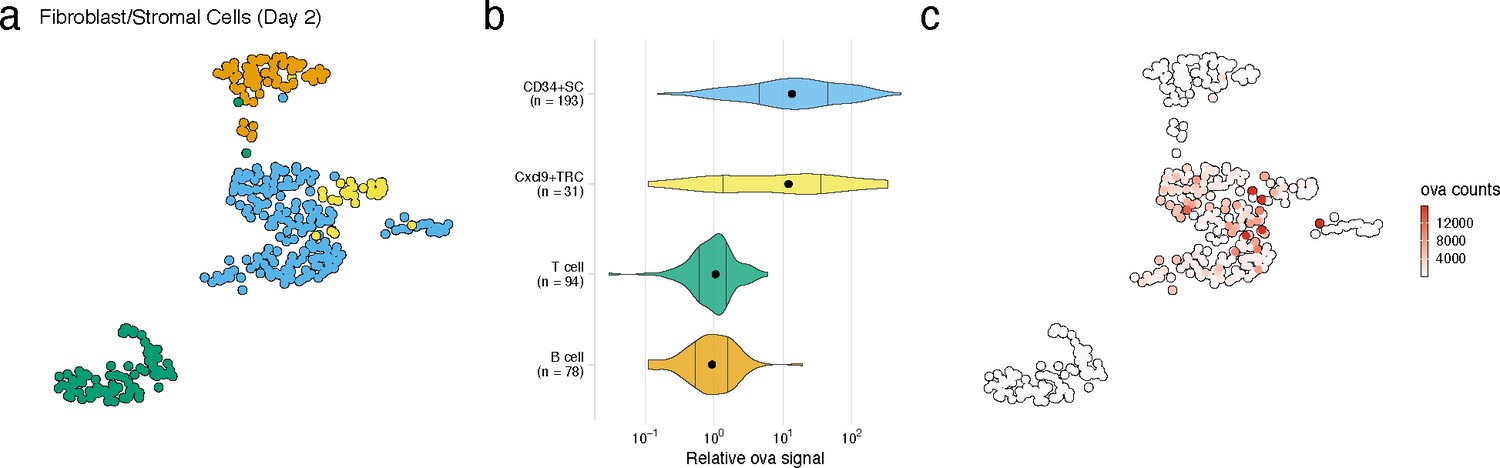
FRC cell types with high antigen counts at day 2 post vaccination.
(a) Uniform manifold approximation and projection (UMAP) is shown for FRC cell types, B cells, and T cells identified for the day 2 time point. (b) Relative ovalbumin signal is shown for each cell type. Relative ovalbumin signal was calculated by dividing antigen counts for each cell by the median antigen counts for T and B cells. (c) Antigen counts are displayed on the UMAP shown in (a).
Figure 4
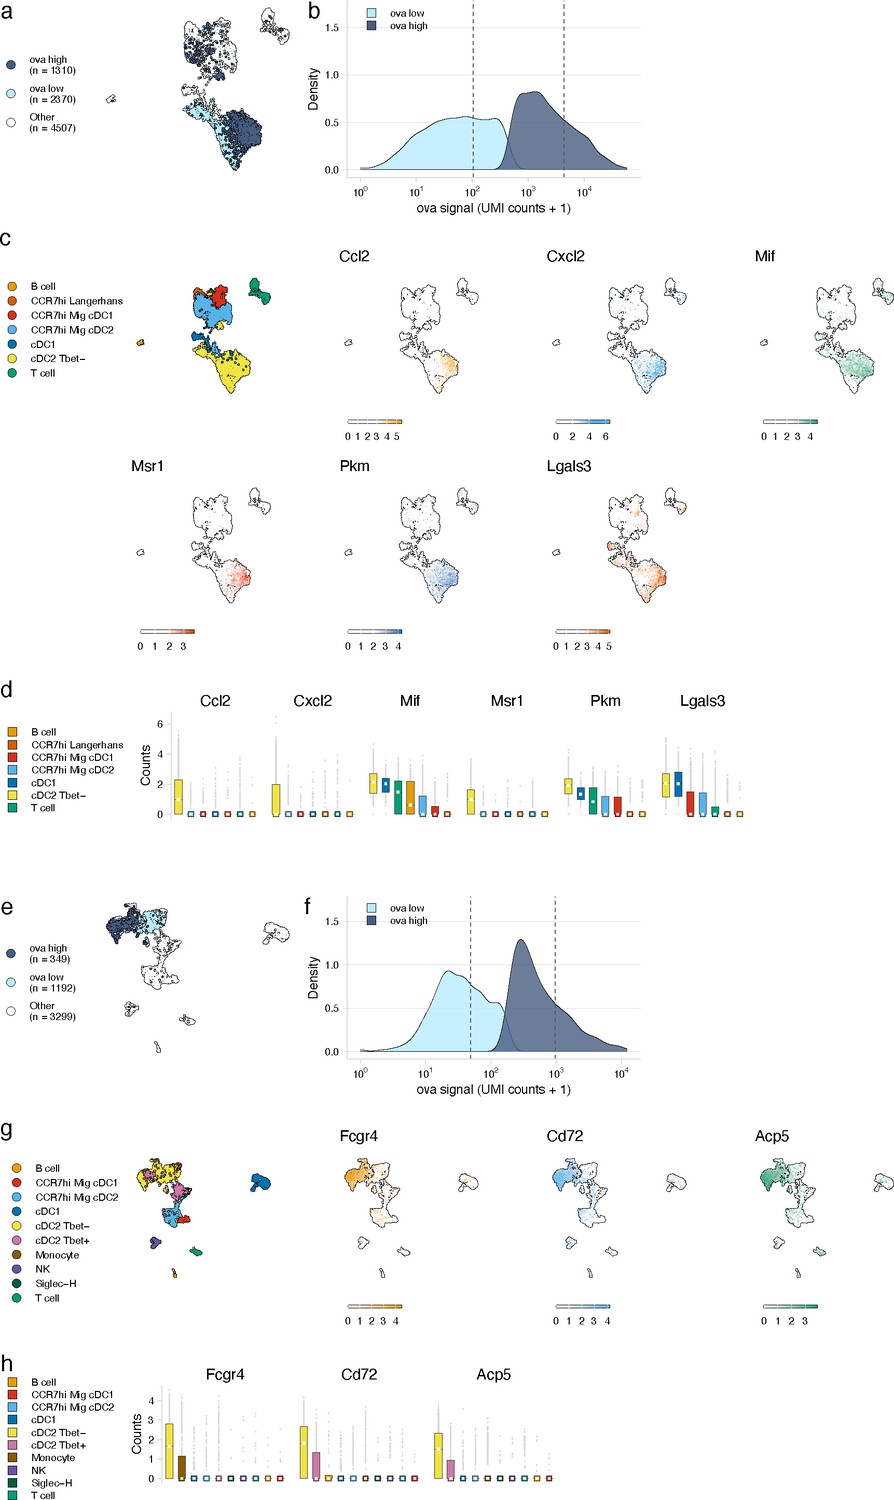
Antigen-based classification of dendritic cells (DCs) and validation of genes associated with DC activation.
(a, e) Day 2 (a) and day 14 (e) cDC2 Tbet- cells containing low and high antigen counts were identified using a two-component mixture model. A uniform manifold approximation and projection (UMAP) is shown for ovalbumin (ova)-low and ova-high cells. Cell types not included in the comparison are shown in white (other). (b, f) The distribution of ova antigen counts is shown for ova-low and ova-high cDC2 Tbet- cells. Dotted lines indicate the mean counts for each population. Identification of genes associated with ova-low and ova-high for each cell type is available in Figure 4—source data 1. (c, g) UMAPs show the expression (log-normalized counts) of top markers associated with ova-high cDC2 Tbet- cells. (d, h) Expression (log-normalized counts) of antigen-high markers in each cell type.
-
Figure 4—source data 1
Genes associated with ovalbumin (ova)-high cells for dendritic cell (DC), FRC, and lymphatic endothelial cell (LEC) subtypes.
Ova-low and ova-high cells were independently identified for each cell type shown in Figure 3 using a Gaussian mixture model implemented with the R package mixtools. Differentially expressed genes were identified using a Wilcoxon rank-sum test performed using the R package presto (wilcoxauc). The Benjamini–Hochberg method was used to correct for multiple comparisons. Genes were filtered to only include those with an adjusted p-value<0.05, log fold-change >0.25, area under the receiver operator curve (AUC) >0.5, and with at least 50% of ova-high cells expressing the gene. The average expression, log fold-change, test statistic (statistic), AUC, percentage of ova-high cells that express the gene (pct_in), and percentage of ova-low cells that express the gene (pct_out) are included.
- https://cdn.elifesciences.org/articles/62781/elife-62781-fig4-data1-v2.xlsx
Figure 5
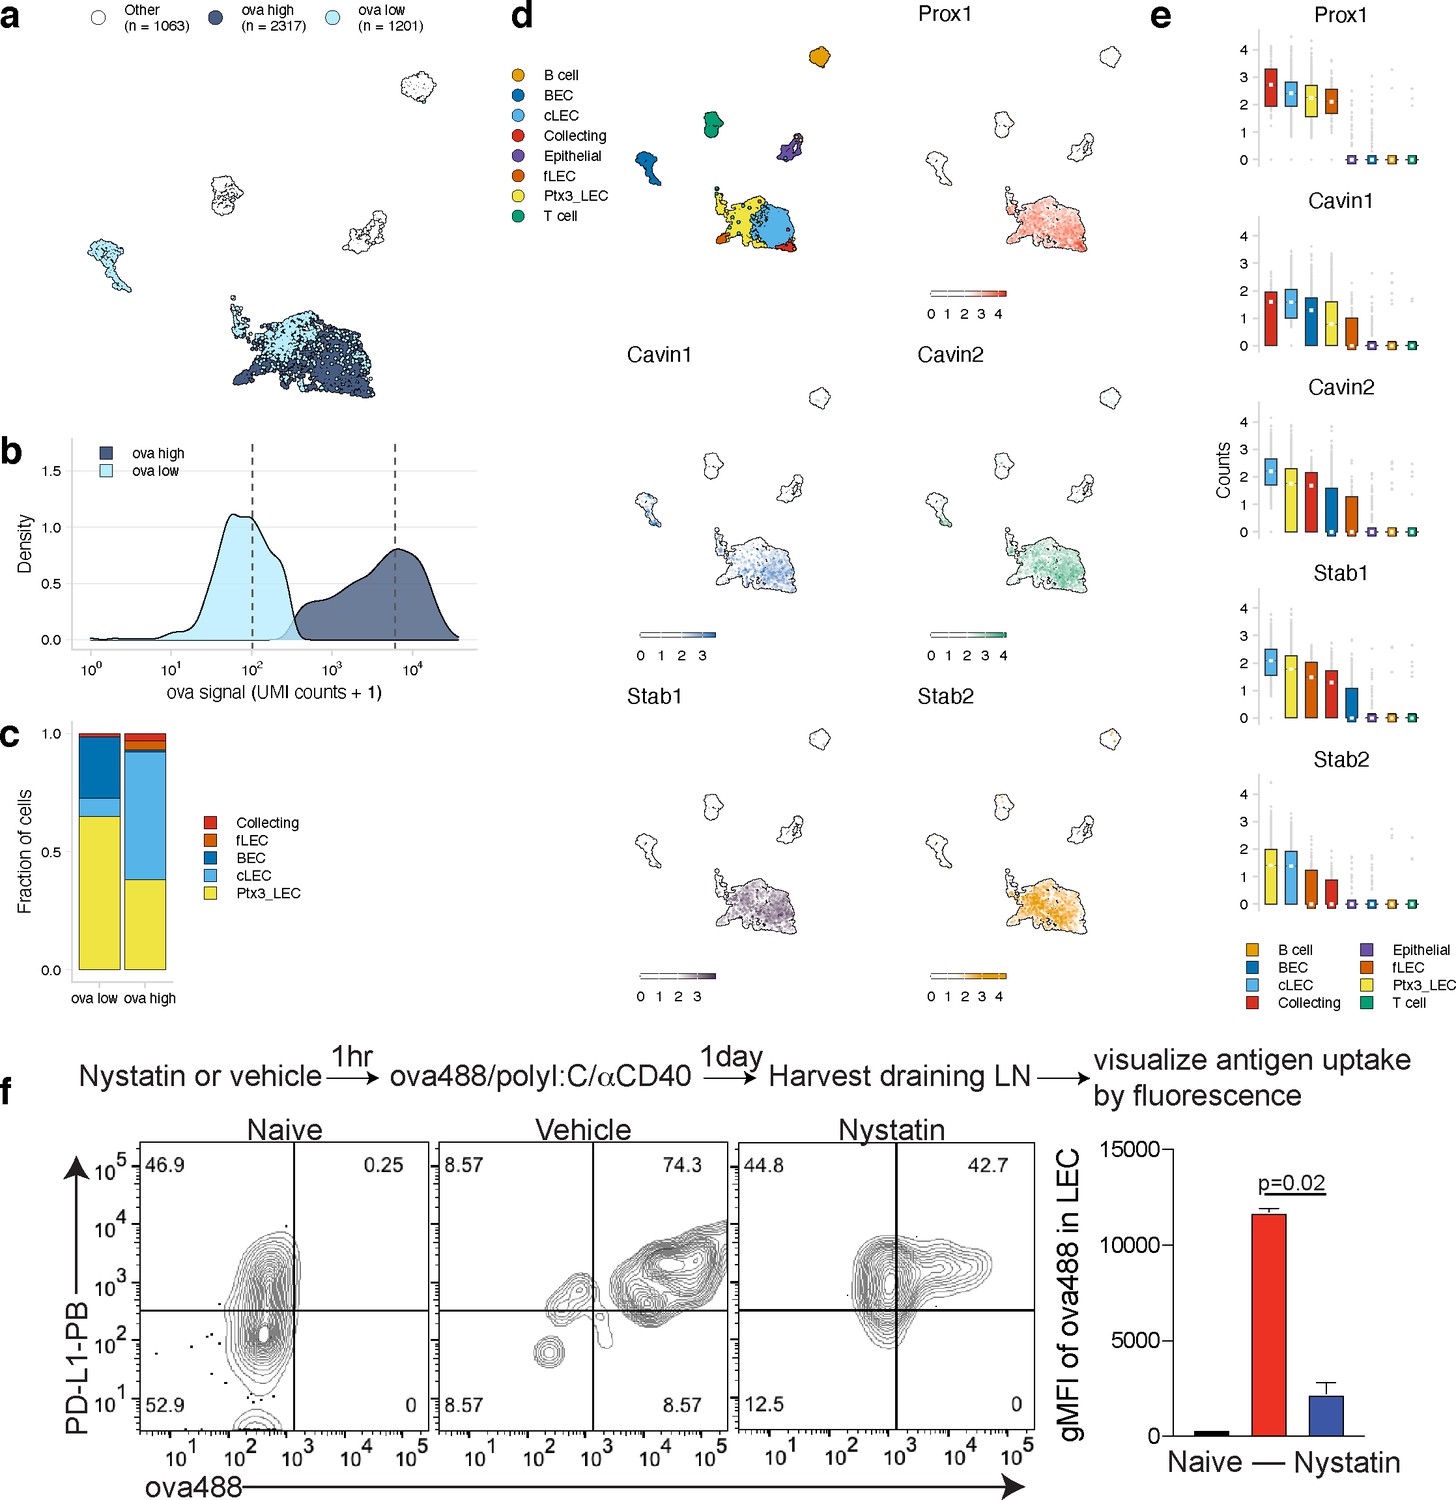
Antigen-based classification of lymphatic endothelial cells (LECs) and identification of marker genes.
(a) Day 14 LECs were classified into antigen-high and antigen-low using a two-component Gaussian mixture model. A uniform manifold approximation and projection (UMAP) is shown for antigen-low and antigen-high cells. T cells, B cells, and epithelial cells are shown in white (Other). (b) Distribution of antigen counts for antigen-low (light blue) and antigen-high (dark blue) cells. Dotted lines indicate mean counts for each population. Identification of genes associated with ovalbumin (ova)-low and ova-high for each cell type is available in Figure 5—source data 1. (c) The fraction of cells belonging to each LEC type for antigen-low and antigen-high populations. (d) UMAPs show expression of genes significantly enriched in the antigen-high population (scale is log-normalized counts). (e) Expression (log-normalized counts) of antigen-high markers in each cell type. (f) Mice were injected in the footpad with nystatin (dose) and 1 hr later ova488/polyI:C/αCD40. After 24 hr, mice were euthanized and draining popliteal lymph node (LN) removed, stained for LEC markers (CD45, PDPN, CD31, PDL1), and gated as in Figure 3—figure supplement 4. Shown are representative flow plots and quantification of geometric mean fluorescence intensity (gMFI) from naive (black bar), vehicle control (red bar), and nystatin treated (blue bar). Three mice per group were evaluated, and experiment was performed three independent times with similar results. Nystatin treatment reduces ova488 signal in LECs relative to vehicle (p=0.02; Wilcoxon rank-sum test). Error bars indicate standard error of the mean (SEM).
-
Figure 5—source data 1
Genes associated with ovalbumin (ova)-low and ova-high cells for dendritic cells (DCs), FRCs, and lymphatic endothelial cells (LECs).
Ova-low and ova-high cells were identified independently for DCs, FRCs, and LECs using a Gaussian mixture model implemented with the R package mixtools. Differentially expressed genes were identified as described for Figure 4—source data 1.
- https://cdn.elifesciences.org/articles/62781/elife-62781-fig5-data1-v2.xlsx
Tables
Key resources table
| Reagent type (species) or resource | Designation | Source or reference | Identifiers | Additional information |
|---|---|---|---|---|
| Antibody | Anti-mouse CD40 (Rat monoclonal) | BioXcell | Cat#BE0016-2 | |
| Antibody | Anti-ovalbumin (rabbit monoclonal) | Abcam | Ab181688 | 1:100 |
| Antibody | Anti-rabbit IgG PE (Donkey polyclonal) | Biolegend | Cat# 406421 RRID:AB_2563484 | 1:100 |
| Antibody | Anti-mouse CD45 BV510 (Rat monoclonal) | Biolegend | Cat#103138 RRID:AB_2563061 | 1:300 |
| Antibody | Anti-mouse CD45 PE (Rat monoclonal) | Biolegend | Cat#103106 RRID:AB_312971 | 1:300 |
| Antibody | Anti-mouse podoplanin APC (Hamster monoclonal) | Biolegend | Cat#127410 RRID:AB_10613649 | 1:200 |
| Antibody | Anti-mouse CD31 PerCP-Cy5.5 (Rat monoclonal) | Biolegend | Cat#102420 RRID:AB_10613644 | 1:200 |
| Antibody | Anti-mouse PD-L1 BV421 (Rat monoclonal) | Biolegend | Cat#124315 RRID:AB_10897097 | 1:200 |
| Antibody | Anti-mouse CD8a APC-Cy7 (Rat monoclonal) | Biolegend | Cat#100714 RRID:AB_312753 | 1:400 |
| Antibody | Anti-mouse CD44 PerCP-Cy5.5 (Rat monoclonal) | Biolegend | Cat# 103032 RRID:AB_2076204 | 1:400 |
| Antibody | Anti-mouse B220/CD45R BV510 (Rat monoclonal) | Biolegend | Cat# 103248 RRID:AB_2650679 | 1:300 |
| Antibody | Anti-mouse B220/CD45R PE (Rat monoclonal) | Biolegend | Cat# 103208 RRID:AB_312993 | 1:300 |
| Antibody | Anti-mouse CD11c APC Cy7 (Hamster monoclonal) | Biolegend | Cat#117324 RRID:AB_830649 | 1:400 |
| Antibody | Anti-mouse CD11b PE-Cy7 (Rat monoclonal) | Biolegend | Cat#101216 | 1:300 |
| Peptide, recombinant protein | Streptavidin BV421 | Biolegend | Cat#405226 | 1:1000 |
| Peptide, recombinant protein | Streptavidin AF488 | Thermo Fisher Scientific | Cat#S11223 | 1:1000 |
| Chemical compound, drug | PolyI:C | Invivogen | Cat#Vac-PIC | |
| Chemical compound, drug | Nystatin | Sigma Aldrich | Cat#N4014 | |
| Chemical compound, drug | Violet proliferation dye | BD Biosciences | Cat#562158 | |
| Chemical compound, drug | CFSE | BD Biosciences | Cat#565082 | |
| Strain, strain background (Mus musculus) | WT: C57BL/6 | Charles River Labs | C57BL/6 (B6) Mouse Inbred 027 | |
| Strain, strain background (M. musculus) | OT1: C57BL/6-Tg(TcraTcrb) 1100Mjb/J | Jackson Labs | JAX: 003831 | |
| Cell line (M. musculus) | SVEC4-10 | ATCC | ATCC CRL2181 | |
| Primary cells (M. musculus) | mLEC | Cell Biologics | C57-6092 |
Additional files
Download links
A two-part list of links to download the article, or parts of the article, in various formats.
Downloads (link to download the article as PDF)
Open citations (links to open the citations from this article in various online reference manager services)
Cite this article (links to download the citations from this article in formats compatible with various reference manager tools)
Molecular tracking devices quantify antigen distribution and archiving in the murine lymph node
eLife 10:e62781.
https://doi.org/10.7554/eLife.62781


