TWIST1 and chromatin regulatory proteins interact to guide neural crest cell differentiation
- Embryology Unit, Children’s Medical Research Institute, The University of Sydney, Australia
- The University of Sydney, School of Medical Sciences, Faculty of Medicine and Health, Australia
- Synapse Proteomics Group, Children’s Medical Research Institute, The University of Sydney, Australia
Figures
Figure 1 with 2 supplements
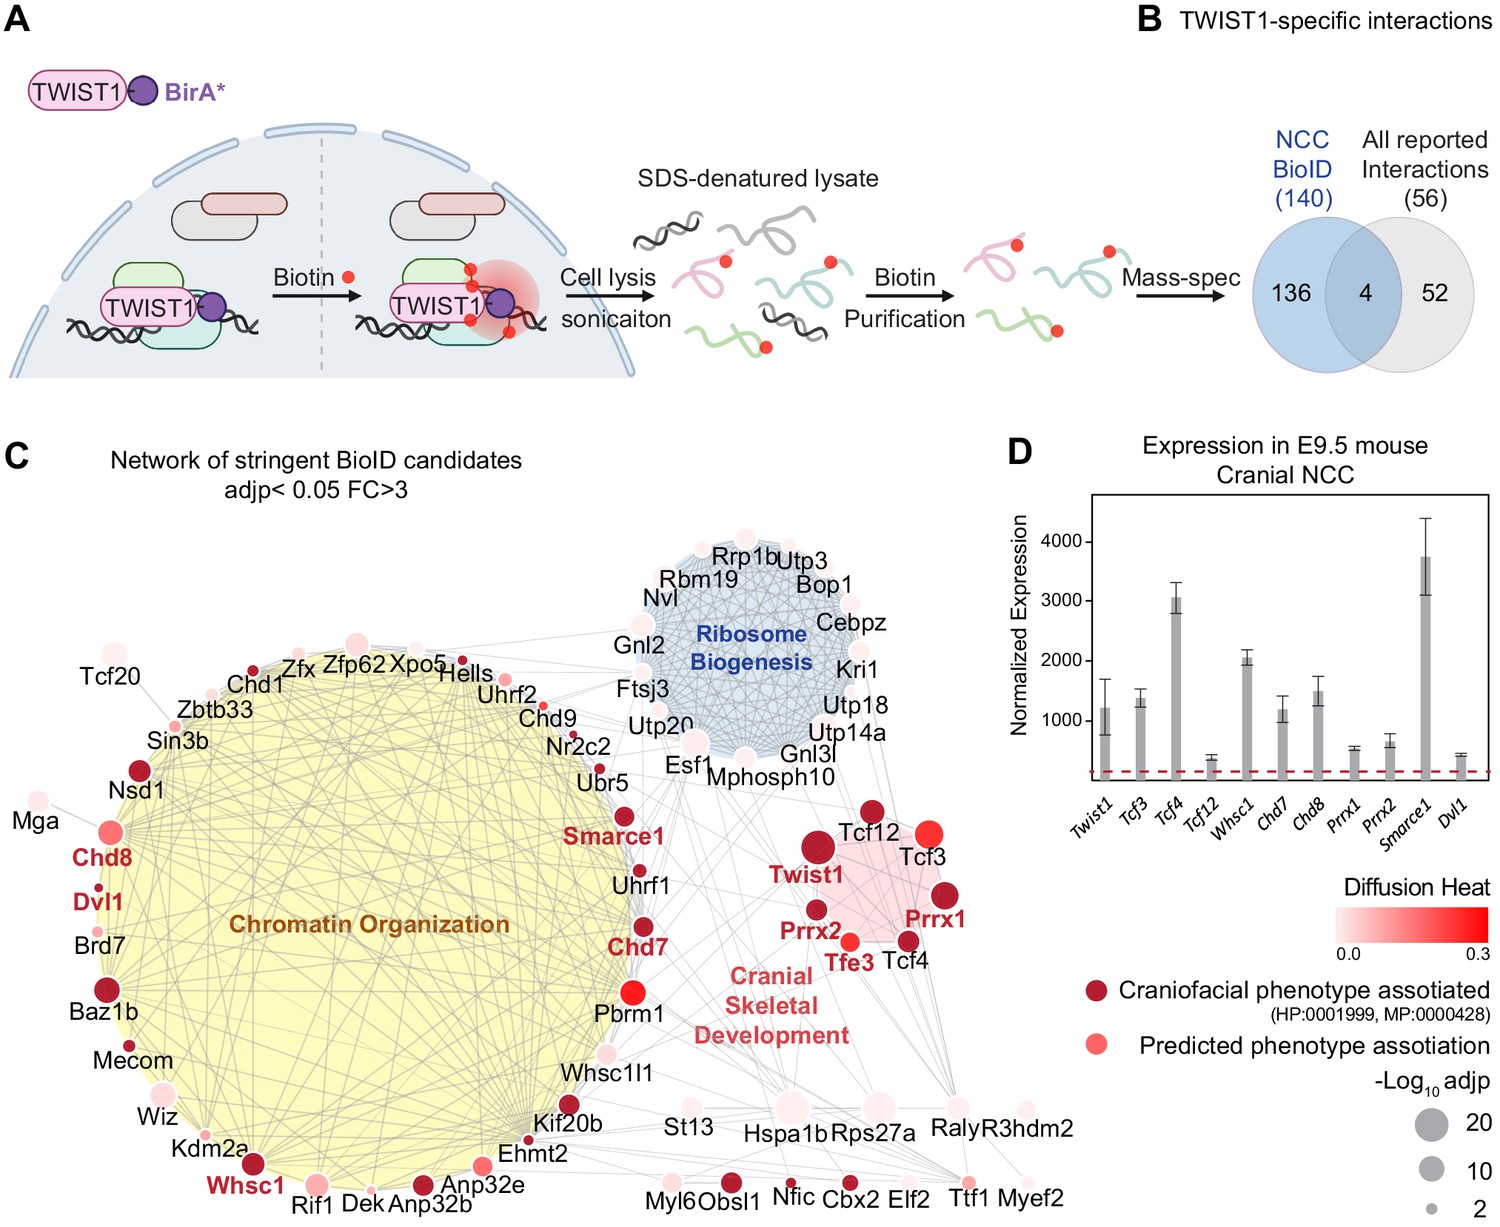
TWIST1 interactome in cranial NCCs revealed using BioID and network propagation.
(A) BioID procedure to identify TWIST1-interacting partners in neural crest stem cells (NCCs). TWIST1-BirA* (TWIST1 fused to the BirA* biotin ligase) labeled the proteins partners within the 10 nm proximity in live cells. Following cell lysis and sonication, streptavidin beads were used to capture denatured biotin-labeled proteins, which were purified and processed for mass spectrometry analysis. (B) TWIST1-specific interaction candidates identified by BioID mass-spectrometry analysis in NCC cell line (p<0.05; Fold-change >3; PSM#>2) overlap with all reported TWIST1 interactions on the Agile Protein Interactomes DataServer (APID) (Alonso-López et al., 2019). (C) Networks constructed from stringent TWIST1-specific interaction at a significant threshold of adjusted p-value (adjp) <0.05 and Fold-change >3. Unconnected nodes were removed. Top GO terms for proteins from three different clusters are shown. Node size = -Log10 (adjp). Genes associated with human and mouse facial malformation (HP:0001999, MP:0000428) were used as seeds (dark red) for heat diffusion through network neighbors. Node color represents the heat diffusion score. (D) Expression of candidate interactor genes in cranial neural crest from E9.5 mouse embryos; data were derived from published transcriptome dataset (Fan et al., 2016). Each bar represents mean expression ± SE of three biological replicates. All genes shown are expressed at level above the microarray detection threshold (27, red dashed line).
Figure 1—figure supplement 1
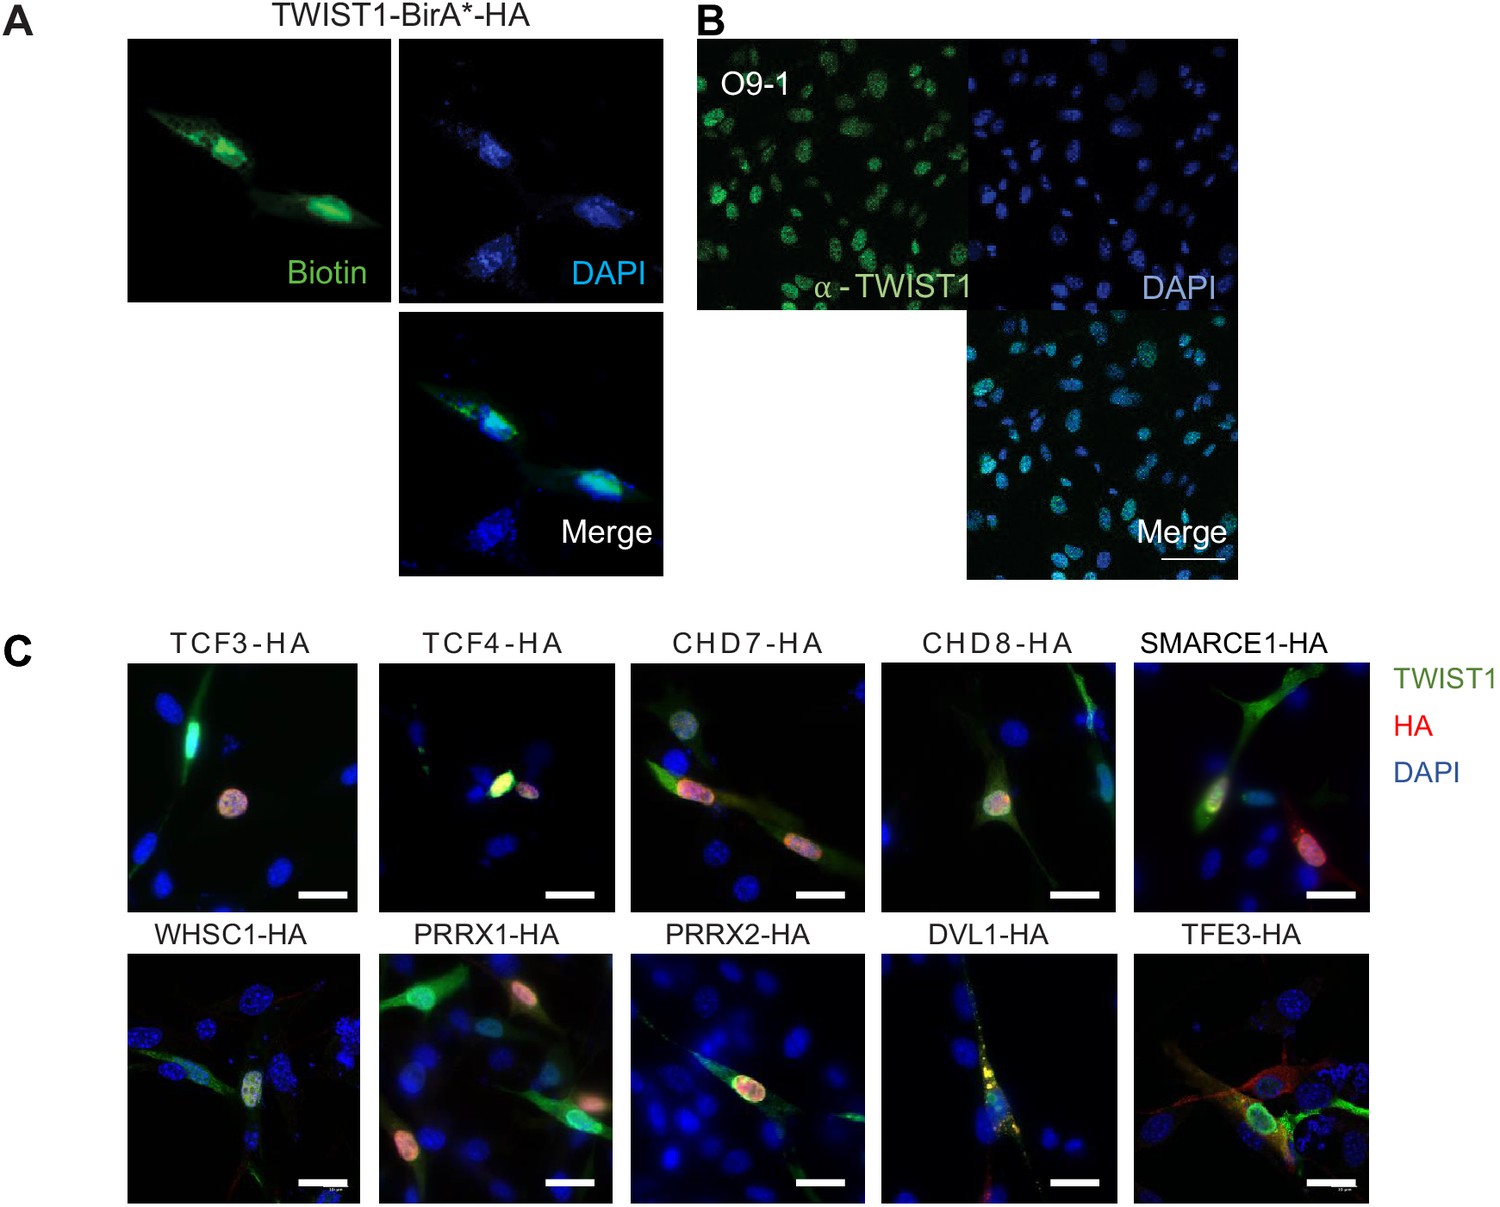
Nuclear localization of TWIST1-BirA* biotinylated proteins and the endogenous TWIST1.
(A) Immunofluorescence analysis revealed co-localization of TWIST1-BirA* (HA tagged) and biotinylated proteins (labeled with streptavidin-GFP) in the nucleus in NCCs. Bar = 20 μm. (B) Expression and localization of endogenous TWIST1 in untransfected cells detected by immunostaining with α-TWIST1. Bar = 50 μm. (C) Immunofluorescence detection of proteins in cells co-expressing FLAG-TWIST1 (α-TWIST1) and 10 HA-tagged proteins (α-HA). Nuclei were stained by DAPI.
Figure 1—figure supplement 2
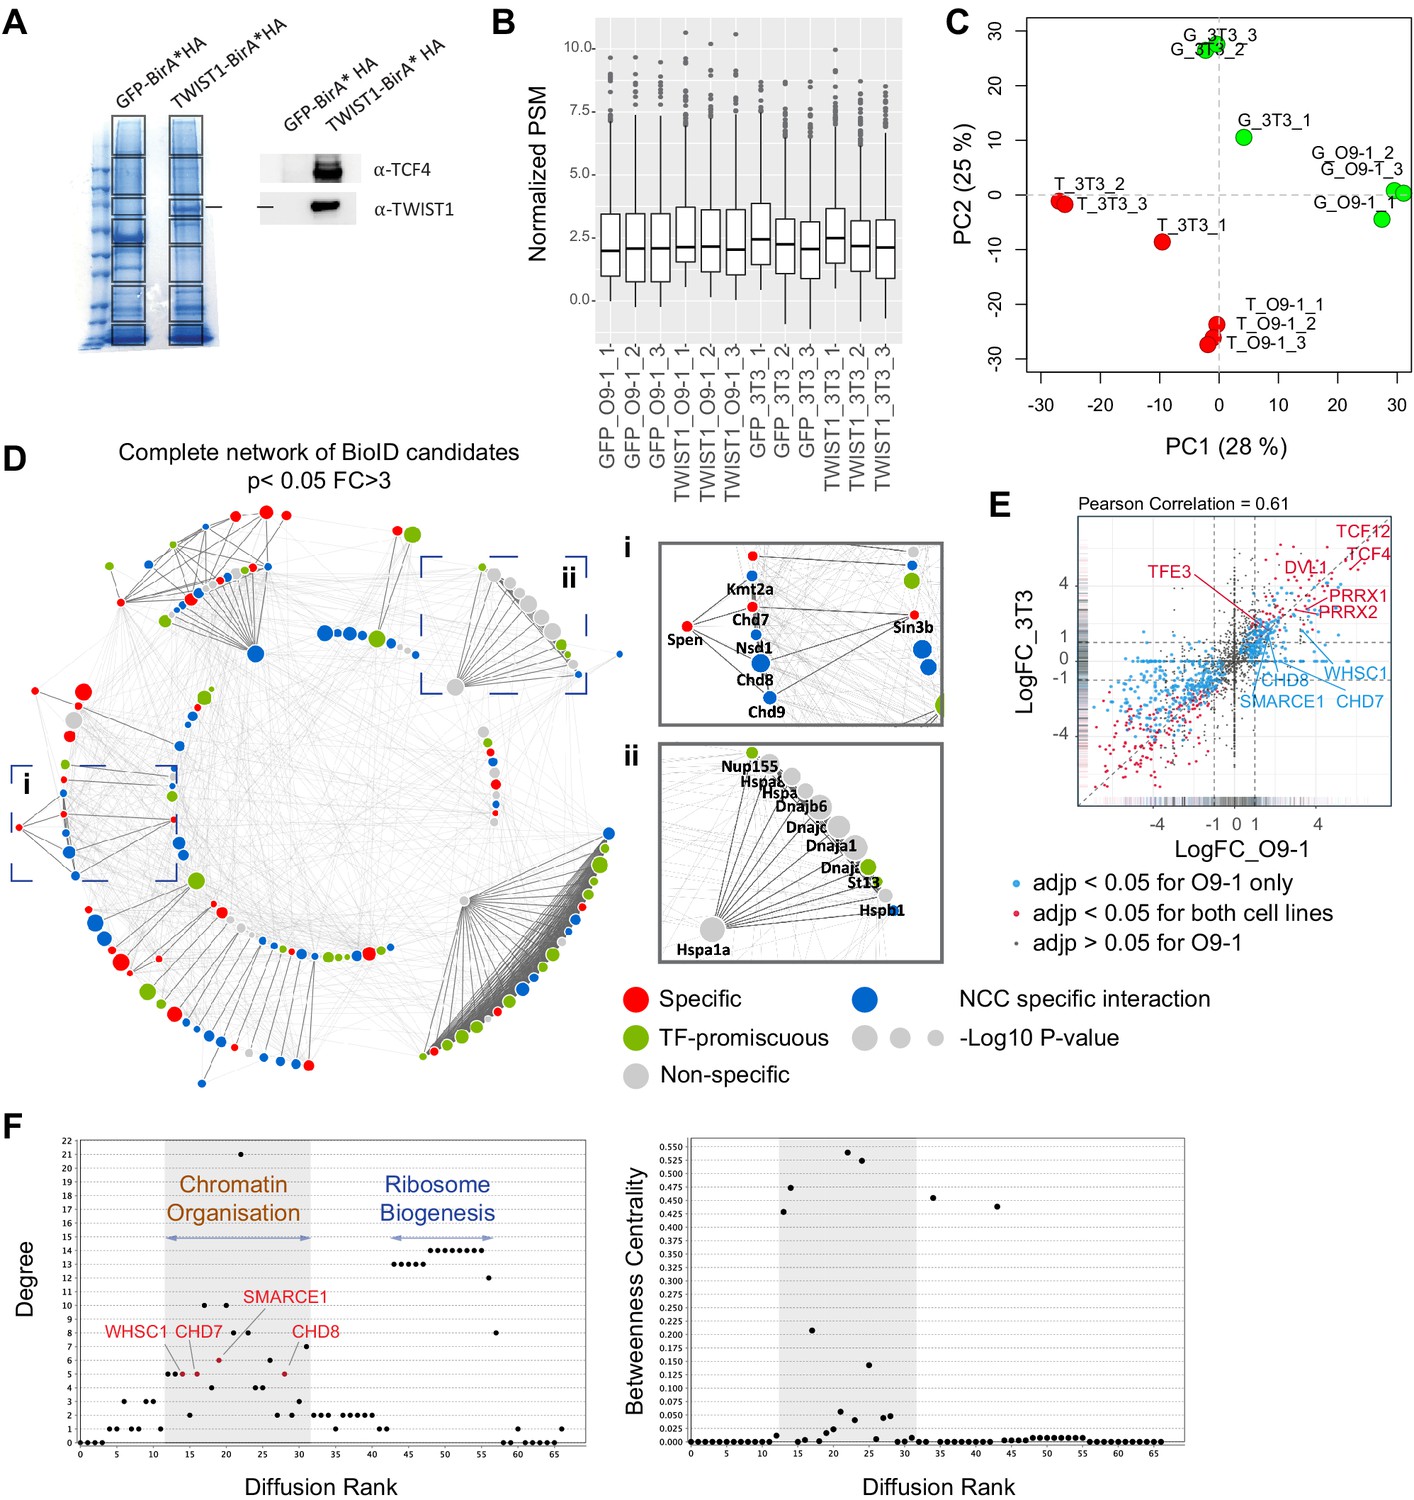
Identification of core NCC regulators within the TWIST1-CRM.
(A) Profile of streptavidin-purified proteins in GFP-BirA* and TWIST1-BirA*-expressing 3T3 cells visualized by Coomassie staining (left panel). Box: Gel bands sampled for mass spectrometry analysis. Expression of the TWIST1-BirA*HA encoded by the transgene and TCF4, a known TWIST1 interactor, by western blot analysis of the streptavidin-beads purified proteins (right panel). (B) Mean peptide spectrum match (PSM) across samples, normalized by total PSM of the peptide library. (C) PCA plot of normalized PSM data. G: GFP-BirA* Green dots, T: TWIST1-BirA* Red dots. (D) Complete network of 140 BioID candidates (p<0.05; Fold-change >3; PSM#>2) interacting physically with TWIST1 in the O9-1 neural crest stem cells. Functional interactions (edges) of these candidates, based on prior evidences of co-expression, protein-protein interaction, evolutionary conservation and text mining, were retrieved from STRING database (Szklarczyk et al., 2015). Medium confidence (combined score >0.4) was used as the cut-off for interactions. The MCL algorithm was used to generate protein interaction hubs with strongest connection (dark edges). Result from previous protein interaction survey of 56 TFs (Li et al., 2015) was referenced to annotate putative specific (red), non-specific (gray) or promiscuous TF interactors (green) among the BioID candidates. Blue nodes are putative-specific TWIST1 partners not annotated in Li et al. study. Node size = -Log10 (P-value). (i and ii) Example clusters. (E) Pairwise correlation of TWIST1 BioID data from O9-1 NCCs (x-axis) versus 3T3 fibroblasts (y-axis). Each data point represents one protein, plotted with their log2 fold change of PSM in TWIST1-BirA* versus GFP group (Log2FC). Point density were represented by rug plot next to the axis. Adjusted p-values (adjp) were generated with EdgeR package using negative binomial model: blue, adjp <0.05 (significant) for O9-1 but not 3T3, red, adjp <0.05 for both cell lines, black, adjp >0.05 for O9-1. (F) Plots generated by NetworkAnalyzer (Assenov et al., 2008) for Diffusion Rank of nodes against Degree of connection (number of edges), and cluster where peaks of highly connected nodes were labeled (left panel), and Between-ness centrality, a measures of how fast information spreads to other nodes (right panel). Putative neural crest disease-causing factors are found in the shaded region.
Figure 2
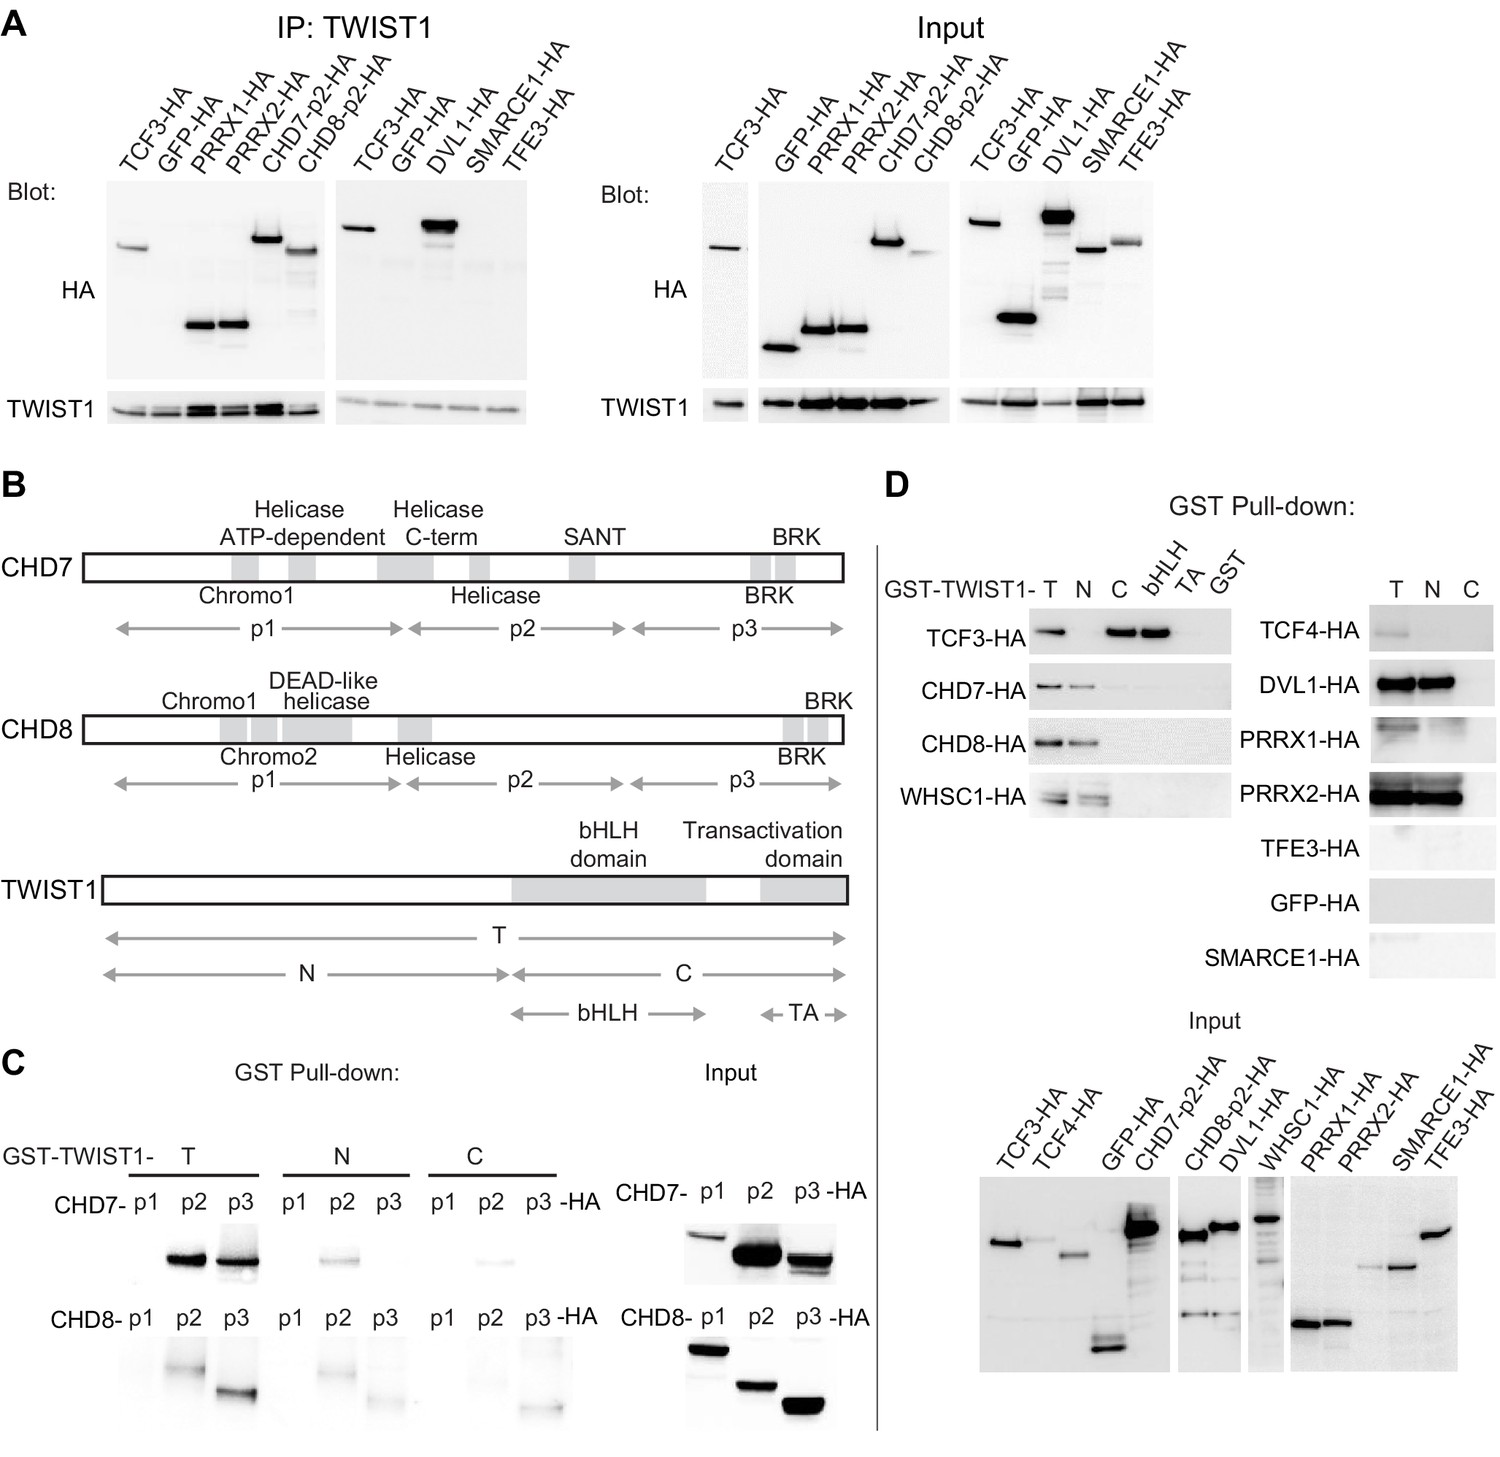
The chromatin regulators interact with the N-terminus domain of TWIST1.
(A) Detection of HA-tagged proteins after immunoprecipitation (IP) of TWIST1 (IP: α-TWIST1) from lysates of O9-1 cells transfected with constructs expressing TWIST1 (input blot: α-TWIST1) and the HA-tagged proteins partners (input blot: α-HA). (B) Schematics of CHD7, CHD8, and TWIST1 proteins showing the known domains (gray blocks) and the regions (double arrows) tested in the experiments shown in panels C and D. (C, D) Western blot analysis of HA-tagged proteins (α-HA antibody) after GST-pulldown with different TWIST1 domains (illustrated in B). Protein expression in the input is displayed separately. T, full-length TWIST1; N, N-terminal region; C, C-terminal region; bHLH, basic helix-loop-helix domain; TA, transactivation domain.
Figure 3 with 1 supplement

Genetic interaction of Twist1 and chromatin regulators in craniofacial morphogenesis.
(A) Experimental strategy for generating chimeric mice from WT and mutant ESCs (see Materials and methods). (B) Lateral and dorsal view of mid-gestation chimeric embryos with predominant ESC contribution (embryos showing low or undetectable red fluorescence). Genotype of ESC used for injection is indicated. Scale bar: 1 mm. Heterozygous embryos of single genes (Twist1+/-, Chd8+/-, Whsc1+/-) showed mild defects including hemorrhages and mild neural tube defect (white arrowheads). Compound heterozygous embryos displayed open neural tube and head malformation (orange arrowheads, n ≥ 6 for each genotype, see panel 3C), in addition to heart defects. (C) Proportions of normal and malformed embryos (Y-axis) for each genotype (X-axis). Severity of mutant phenotypes was determined based on the incidence of developmental defects in the neuroepithelium, midline tissues, heart and vasculature: Normal (no defect); Mild (1–2 defects); Severe (3–4 defects), and early lethality. The number of embryos scored for each genotype is in parentheses. (D) Whole-mount immunofluorescence of E11.5 chimeras derived from wildtype ESCs, shows the expression of TFAP2A (red) and neurofilament (NF, green) and cell nuclei by DAPI (blue). Schematic on the right shows the neuroepithelium structures: f, forebrain; m, midbrain; h, hindbrain; tv, telencephalic vesicle; fn, frontonasal region. (E) (i) NCC cells, marked by TFAP2A, and neuroepithelial cells, marked by SOX2, are shown in (ii) sagittal, and (iii) transverse view of the craniofacial region (red line in ii: plane of section). (F) Quantification of frontal nasal TFAP2A+ tissues (mean normalized area ± SE) of three different sections of embryos of each genotype. (G) SOX2 intensity (mean ± SE) in the ventricular zone of three sections of embryos of each genotype were quantified using IMARIS. (H) (i) Cranial nerves visualized by immunostaining of neurofilament (NF). (ii–v) Maximum projection of cranial nerves in embryos. Missing or hypoplastic neurites are indicated by arrowheads. (ii'–v') Cross-section of neurofilament bundles in the trigeminal ganglion. Red dashed line in i: plane of section. Bar: 500 μm; V, trigeminal ganglion; III, IV, VII, VIII; rio, infraorbital nerve of V2; rmd, mandibular nerve; ropht, ophthalmic profundal nerve of V1; rfr, frontal nerve. (I) Thickness of neural bundle in the trigeminal ganglion was measured by the GFP-positive area, normalized against area of the trigeminal ganglion (TFAP2A+). Values plotted represent mean fold change ± SE. Each condition was compared to WT. p-Values were computed by one-way ANOVA. *p<0.05, **p<0.01, ***p<0.001, ****p<0.0001. ns, not significant.
Figure 3—figure supplement 1
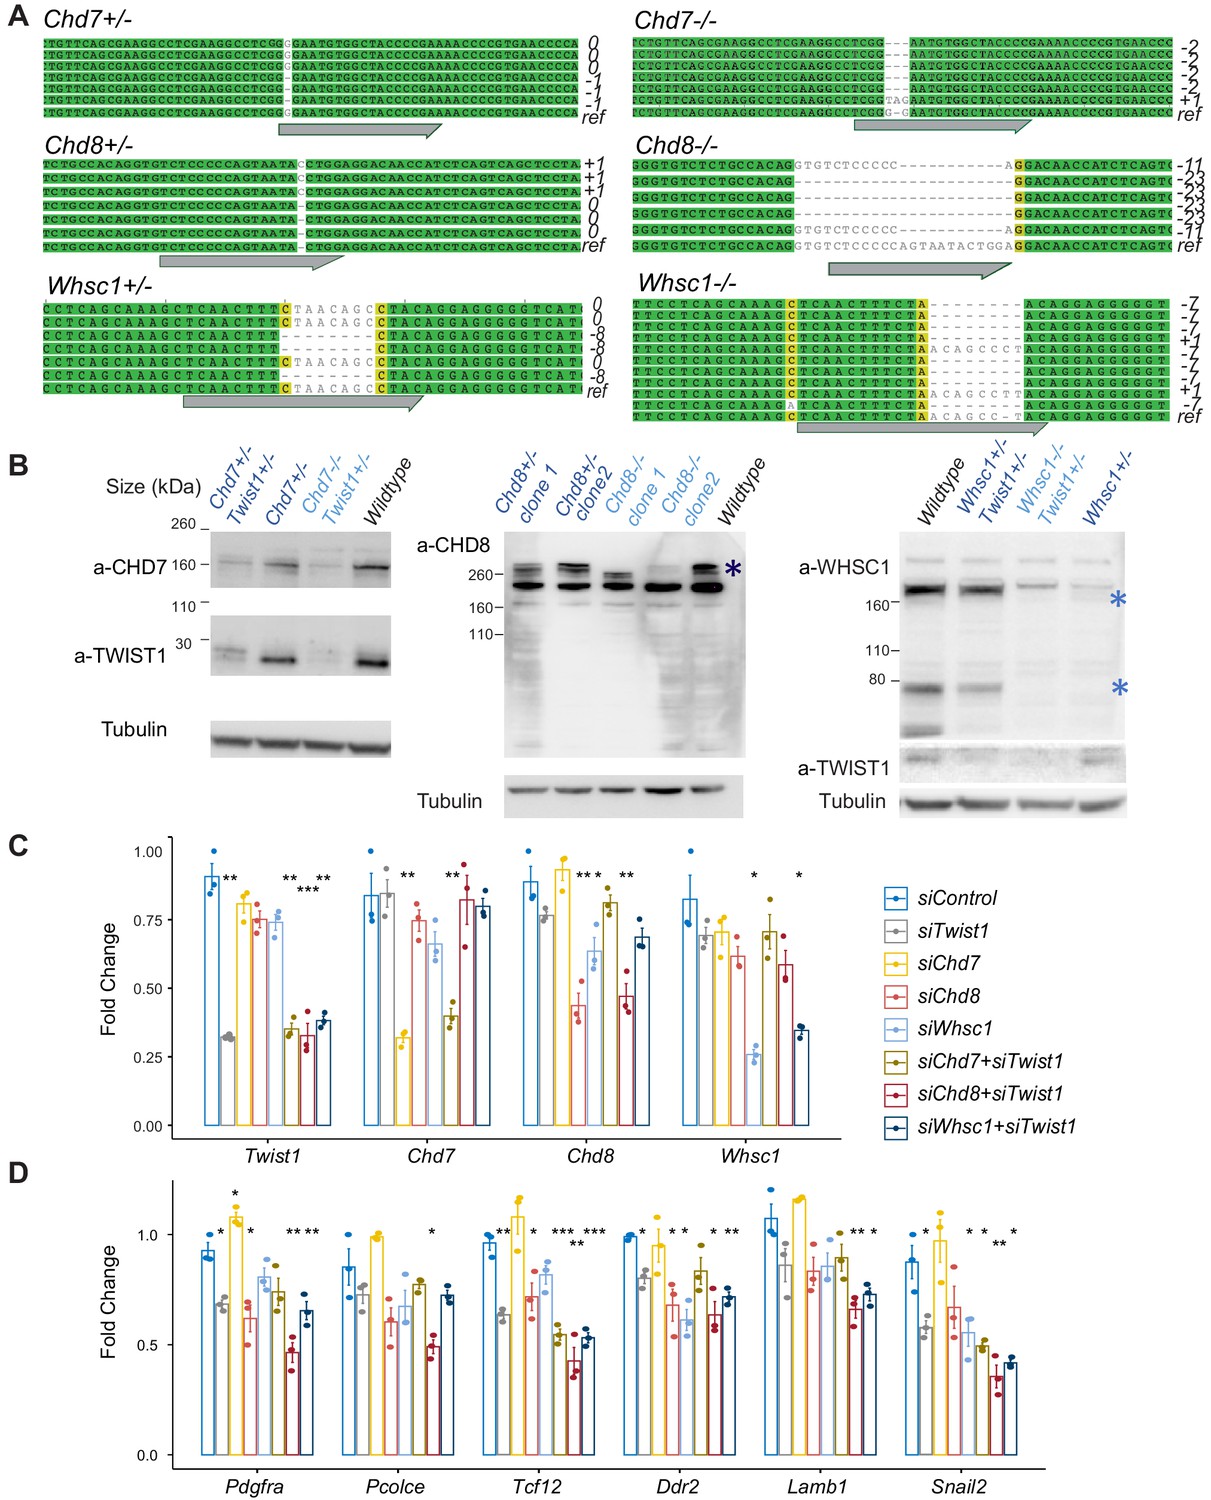
Characterization of CRISPR knockout clones and siRNA knockdown efficiency.
(A) Genotyping result of CRISPR targeted locus in clones with frame-shift mutations. ref, reference/wildtype; Gray arrow, guide RNA targeted site. (B) Western blot analysis of protein using corresponding antibodies. Expression of Twist1-chromatin regulators was induced by neurogenic differentiation treatment (day 3 of culture) of O9-1 NCCs. Predicted protein sizes were marked by * in WHSC1 and CHD8 blots. (C), (D) qPCR results for siRNA targeted genes and EMT markers in the knockdown groups. qPCR analysis was performed after 24 hr siRNA treatment (see Materials and methods). qPCR signals were normalized against average expression of three housekeeping genes (Gapdh, Tbp, Actb) and displayed as fold change +/- SE against control for each treatment. p-Values generated using one-way ANOVA. *p<0.05, **p<0.01, ***p<0.001. ns, not significant.
Figure 4 with 3 supplements
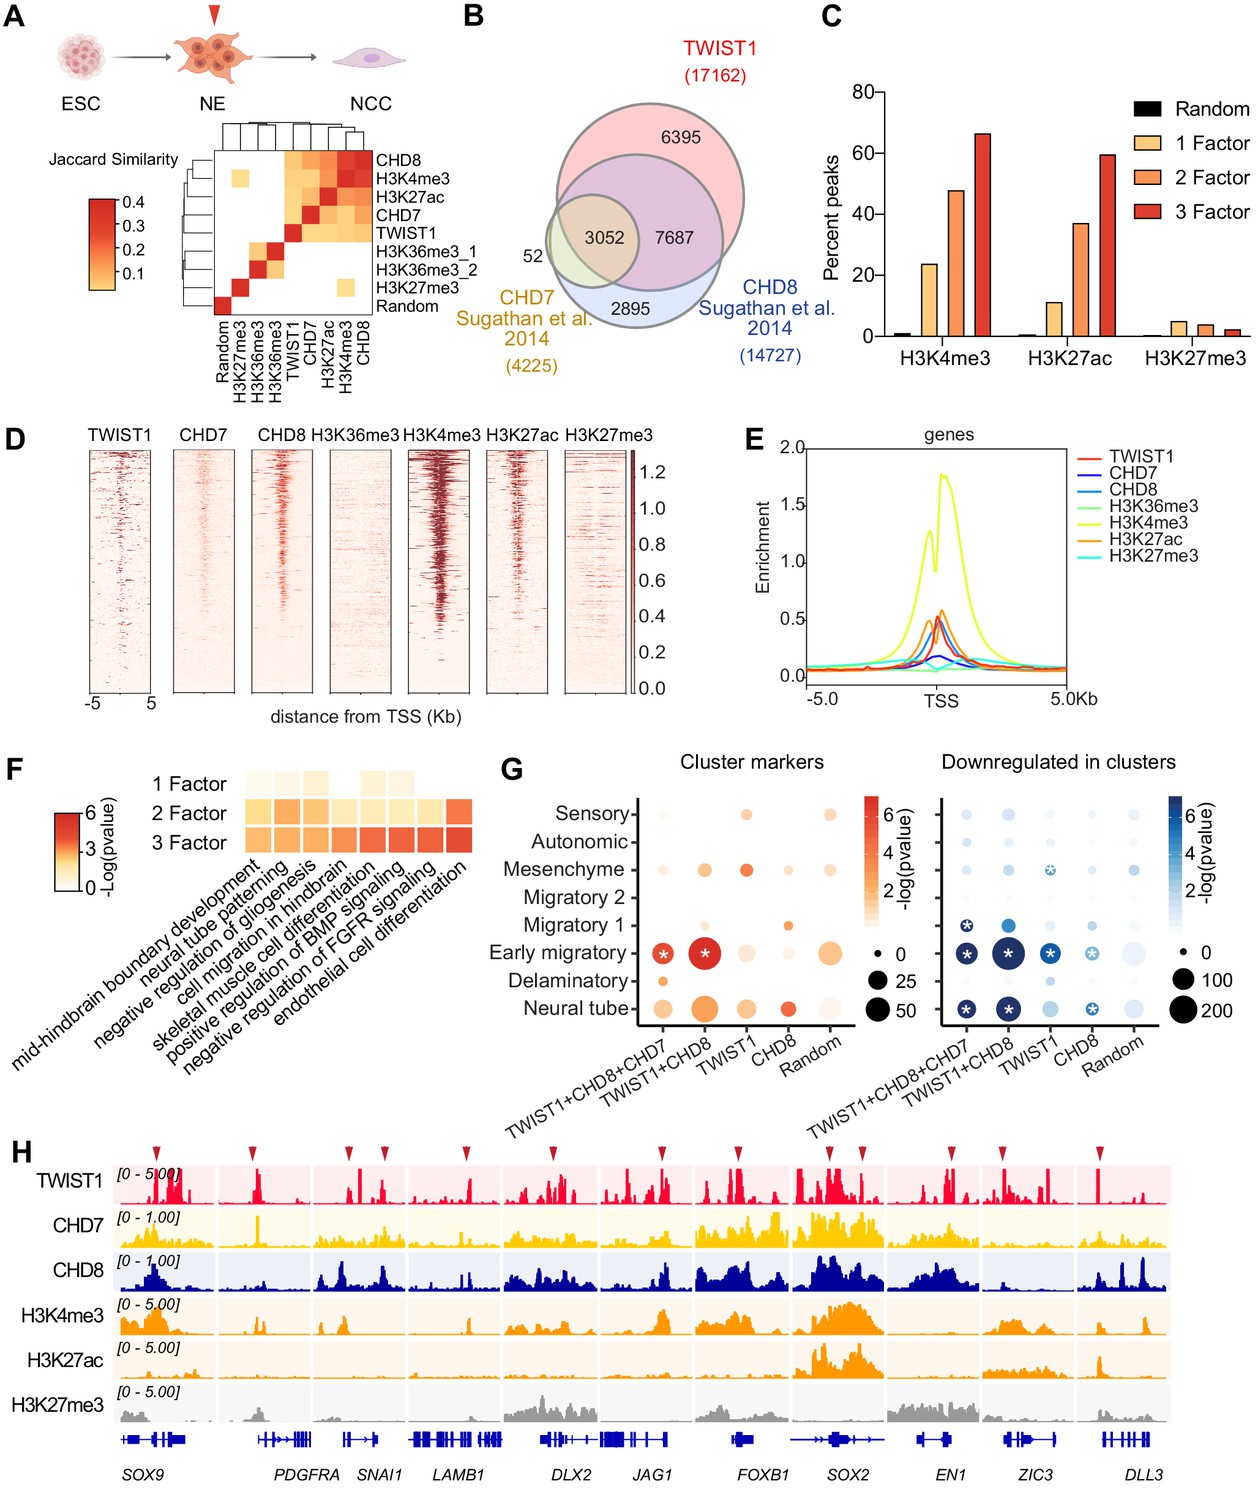
Genomic region showing overlapping binding of TWIST1 and partners are enriched for active regulatory signatures and neural tube patterning genes.
(A) Top panel: Trajectory of ESC differentiation to neuroepithelial cells (NECs) and NCCs. Bottom panel: Jaccard Similarity matrix generated of ChIP-seq data of TWIST1, CHD7, CHD8, and histone modifications from NE cells. The Jaccard correlation is represented by a color scale. White squares indicate no significant correlation (p<0.05, fisher’s exact test) or odds ratio <10 between the two datasets. (B) Venn diagram showing overlaps of putative direct targets of TWIST1, CHD7, and CHD8, based on ChIP-seq datasets for NECs (Sugathan et al., 2014). (C) Percent genomic region that is marked by H3K4me3, H3K27ac, and H3K27me3 among regions bound by one, two or all three factors among TWIST1, CHD7, and CHD8. Randomized peak regions of similar length (1 kb) were generated for hg38 as a control. (D) Heatmaps of genomic footprint of protein partners at ± 5 kb from the TSS, based on the ChIP-seq datasets (as in A) and compared with histone marks H3K4me3, H3K27ac, and H3K27me3 in human neural progenitor cells (Ziller et al., 2015). TSS lanes with no overlapping signals were omitted. (E) ChIP-seq density profile (rpkm normalized) for all TSS flanking regions shown in D. (F) Gene Ontology analysis of genomic regulatory regions by annotations of the nearby genes. Regions were grouped by presence of binding site of individual factor (TWIST1, CHD7, and CHD8), or by 2–3 factors in combination. The top non-redundant developmental processes or pathways for combinatorial binding peaks or individual factor binding peaks are shown. p-Value cut-off: 0.05. (G) Enrichment of TWIST-chromatin regulator targets among regulons of different NCC single-cell clusters at E8.5-E10.5 (Soldatov et al., 2019). Number of overlapping genes with DNA binding peaks (TSS ± 1 kb) for each TF combination are represented by dot size and -log(p-value) is represented by color gradient. Gene modules with significant enrichment (p<0.05) are labeled with asterisk. A random set of genes from the scRNA-seq, with number comparable to the largest TF binding group (1000 genes) were used as control. (H) IGV track (Robinson et al., 2011) showing ChIP-peak overlap (red arrows) at common transcriptional target genes in cell mobility (Sox9, Pdgfra, Snai1, Lamb1, Dlx2) in NCC development and neurogenesis (Jag1, Foxb1, Sox2, En1, Zic3, Dll3) repressed at early migration. Gene diagrams are indicated (bottom row).
Figure 4—figure supplement 1
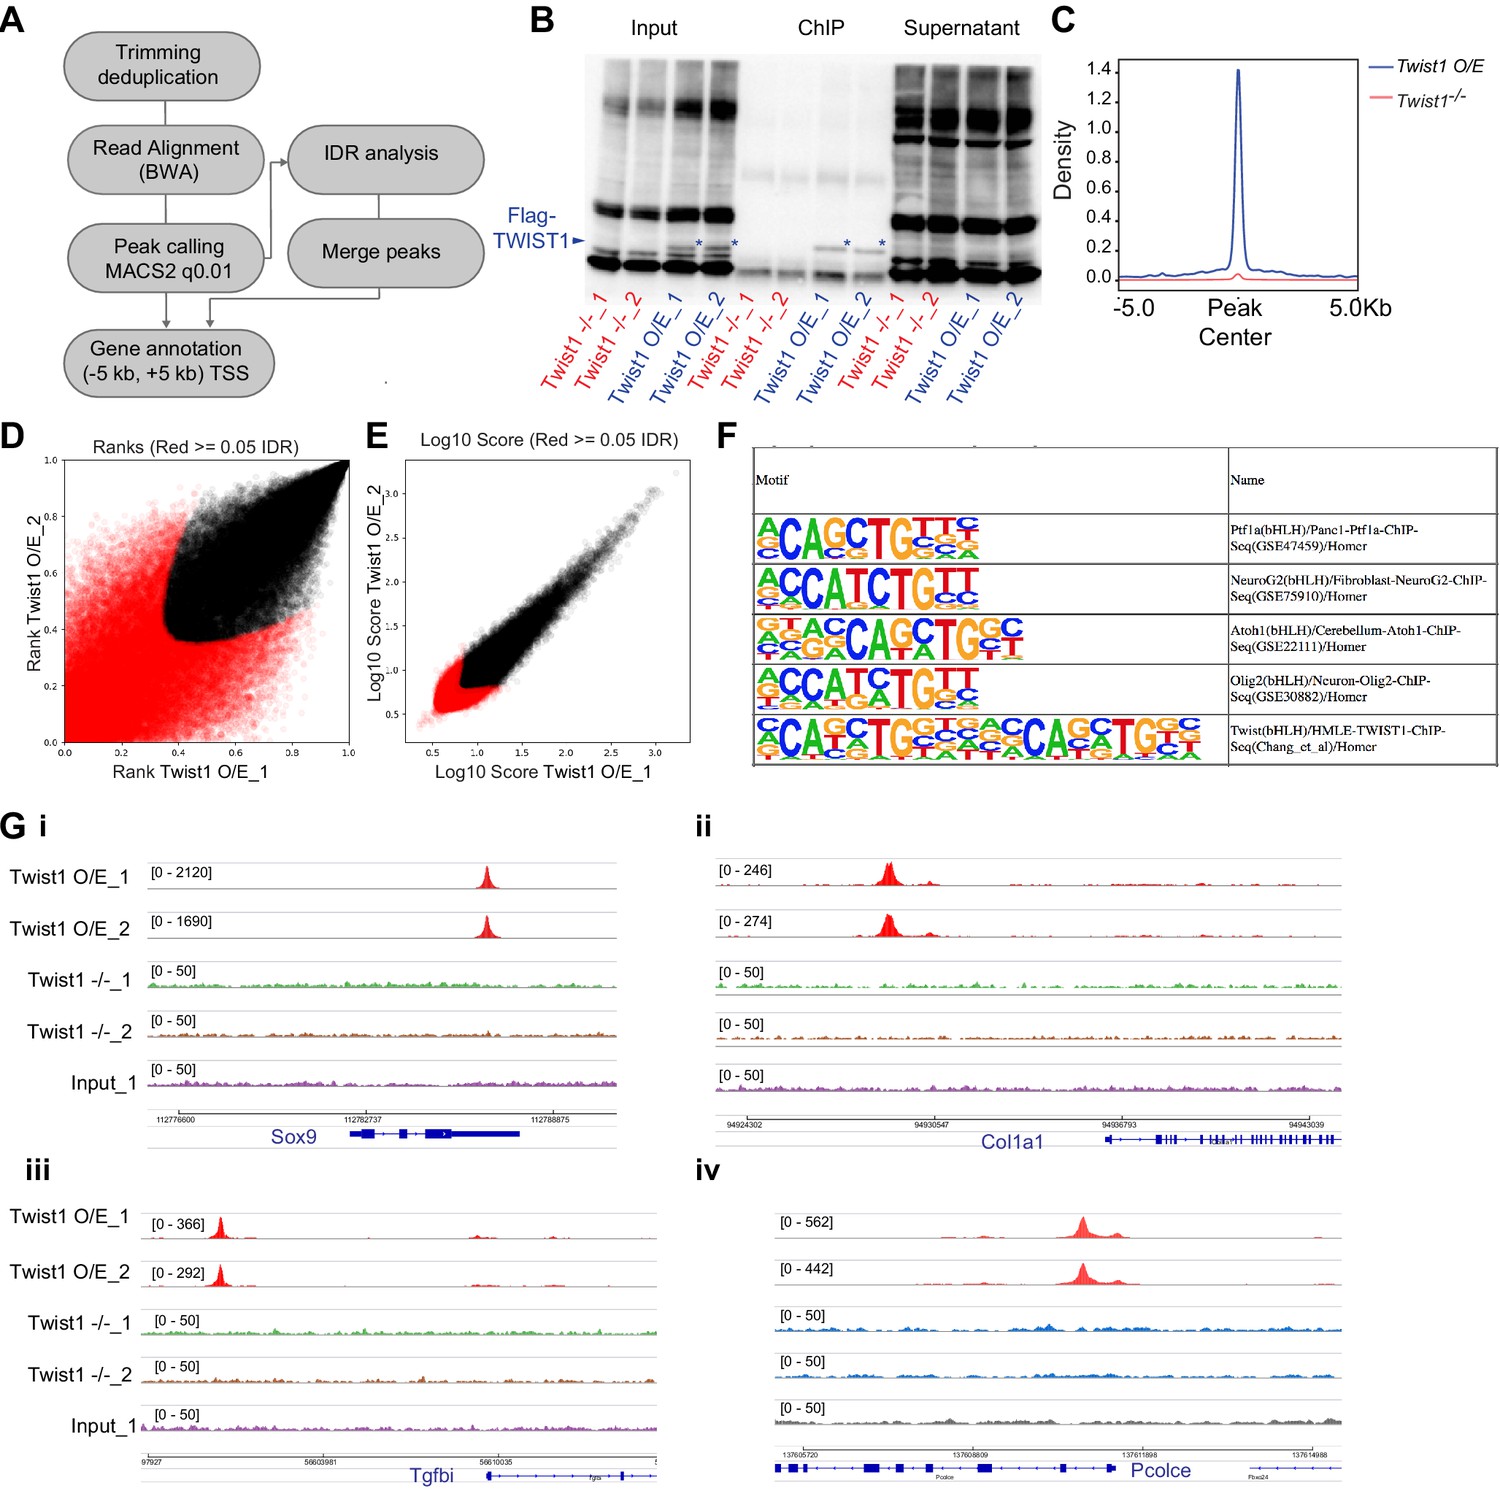
TWIST1 ChIP-seq experiment in ESC-derived neuroepithelial cells.
(A) ChIP-seq data analysis pipeline adapted from ENCODE project (ENCODE Project Consortium, 2012). (B) Quality control of chromatin immunoprecipitation specificity for assays of TWIST1 expression in Twist1-null ESCs and ESCs overexpressing Twist1 (O/E). * TWIST1 protein band. (C) ChIP-seq density profile (rpkm) on mouse genome. (D, E) IDR analysis showing peaks with significant correlation between replicate experiments (black dots). (F) Motif enriched in TWIST1-bound chromatin regions. (G) IGV track showing DNA amplification at validated TWIST1-bound regions of Sox9, Col1a1, Tgfbi, and Pcolce in Twist1 O/E cells but not Twist1-null cells or input ChIP samples.
Figure 4—figure supplement 2
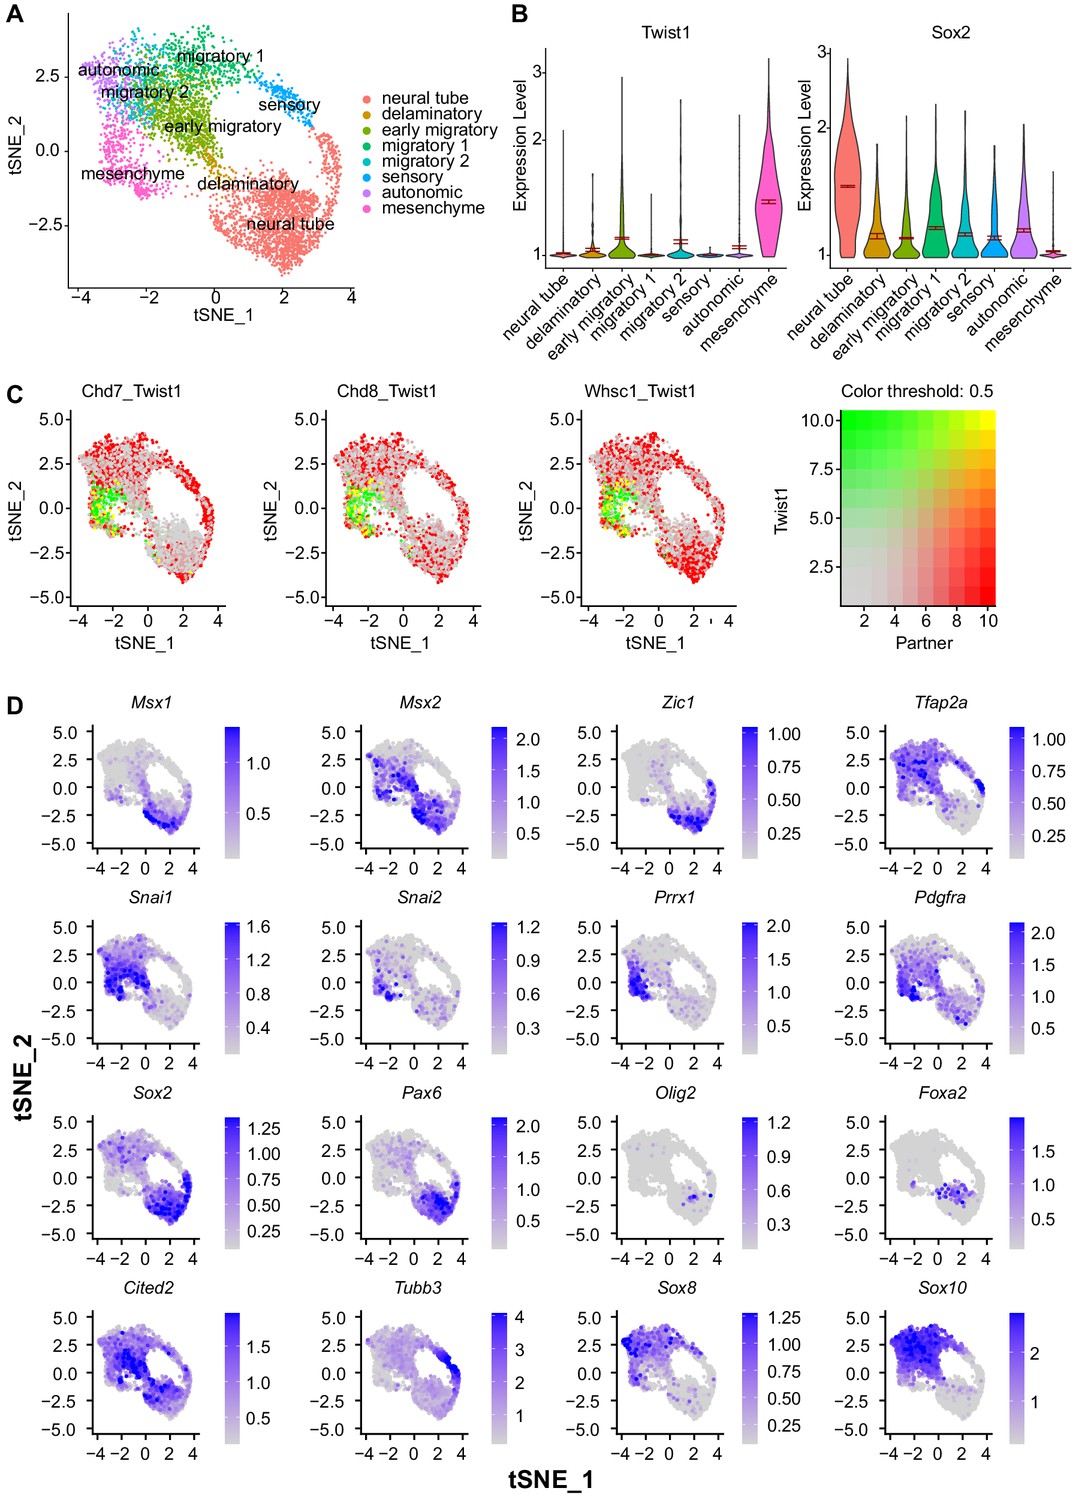
Expression of key target genes identified in scRNA-seq analysis of E 8.5-E10.5 NCCs.
(A) tSNE plot of E 8.5–10.5 mouse NCCs isolated through Wnt1-Cre or Sox10-Cre activated reporter. tSNE embedding and cell cluster annotation were imported from the original study (Soldatov et al., 2019). (B) Reciprocal regulation of Twist1 and Sox2 through NCC stages ordered in developmental pseudo time. (C) Single-cell co-localization plot with color scale indicating level of co-expression. (D) Expression pattern of key marker genes of the NCC lineages characterized in this study.
Figure 4—figure supplement 3
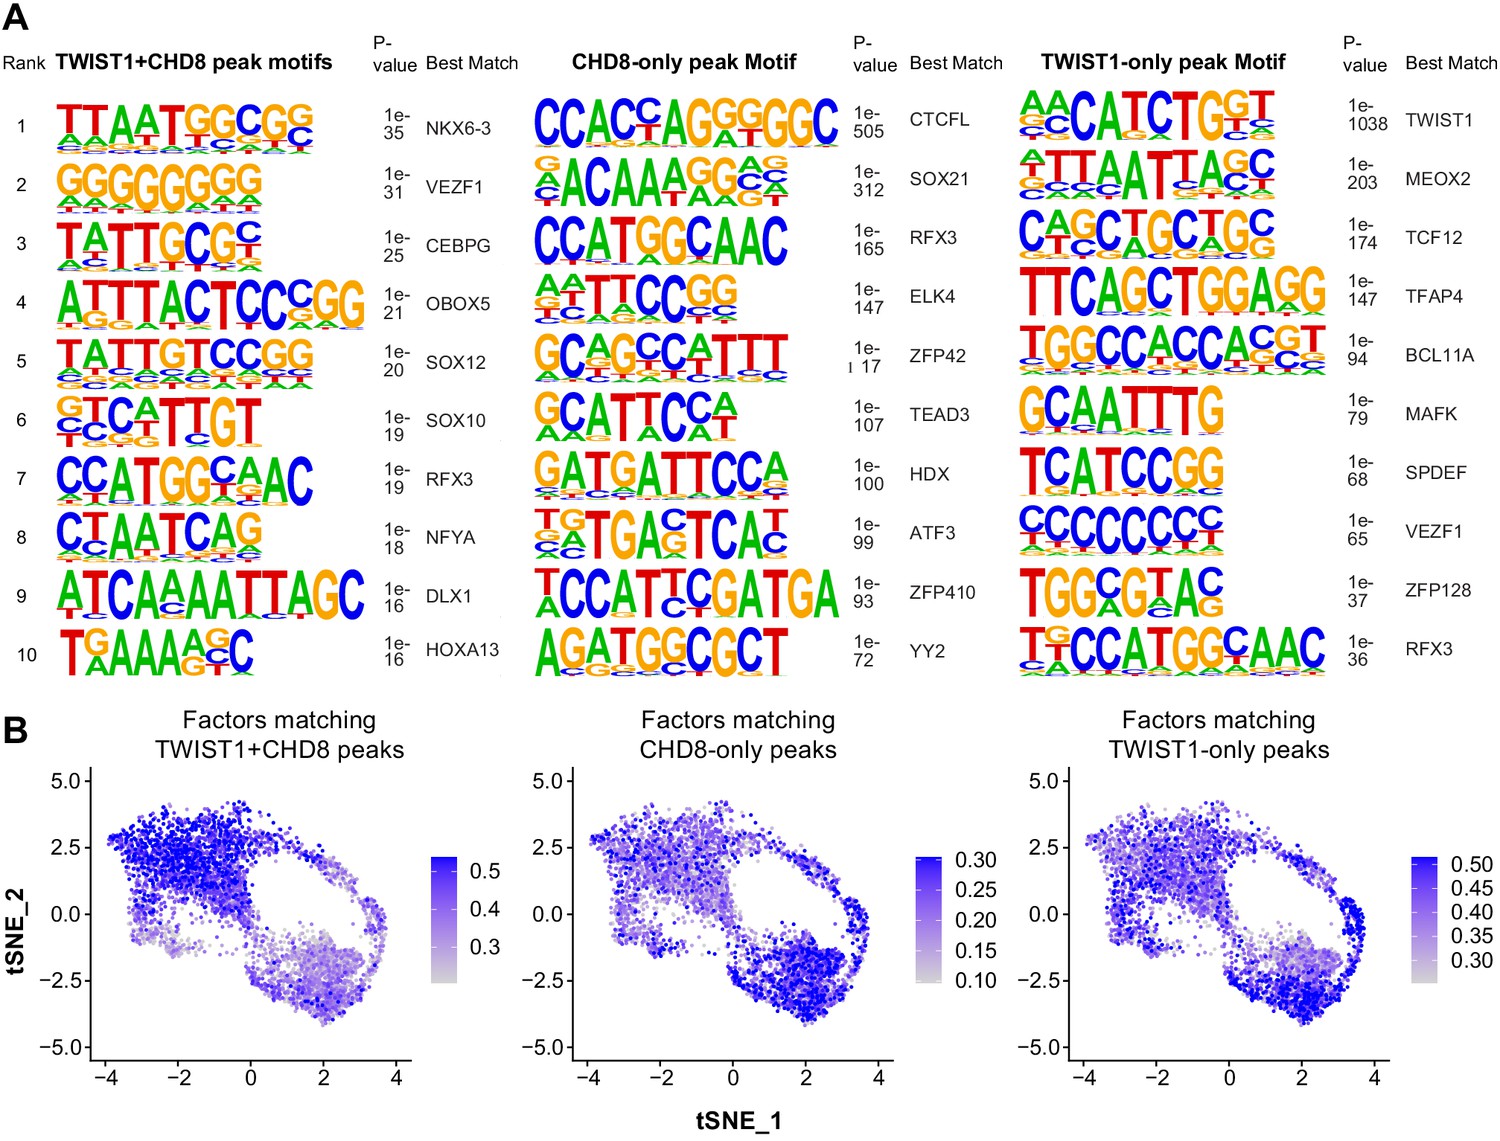
Motif enrichment analysis of overlapping and unique ChIP-seq peaks between TWIST1 and CHD8.
(A) Motif enriched in chromatin region bound by both TWIST1 and CHD8, CHD8 only or TWIST1 only. p-Values for enrichment and factors best matched to the motifs are shown. (B) Single-cell feature plot with color scale showing the average level of expression of top-10 factors matching to TWIST1+CHD8, CHD8 only and TWIST1-only peaks in E8.5- E10.5 single NCCs.
Figure 5
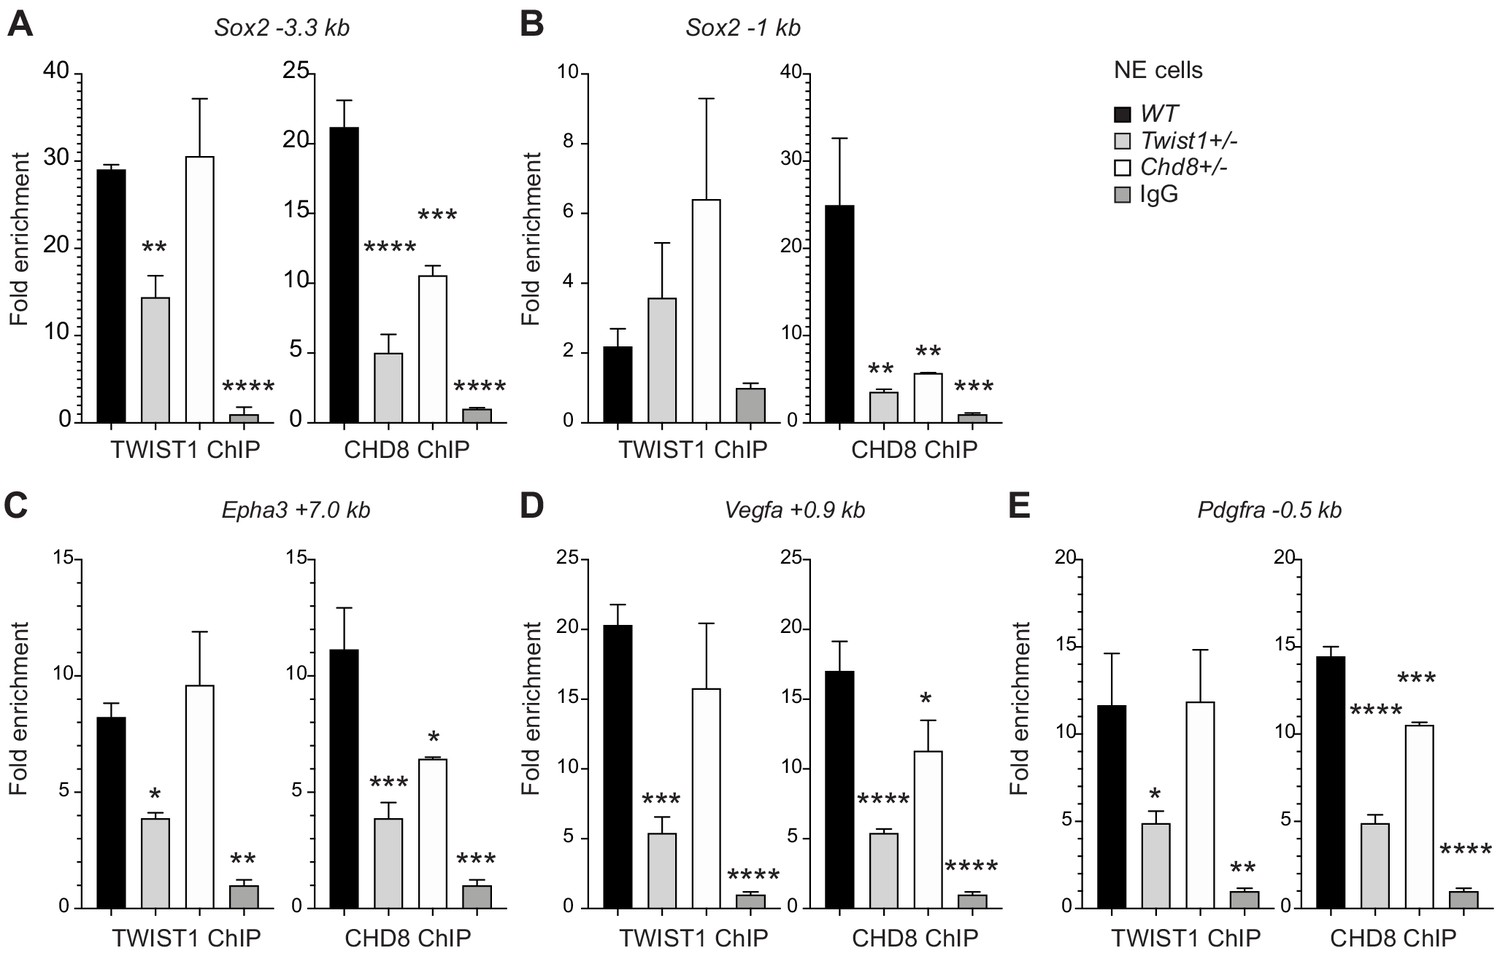
TWIST1 is required for the recruitment of CHD8 to the regulatory region of target genes.
Binding of endogenous TWIST1 and CHD8 to overlapping genomic peak regions called by MACS2 (q < 0.05) were assessed by ChIP-qPCR. (A–E) qPCR quantification of genomic DNA from ChIP of endogenous TWIST1 or CHD8 proteins are shown as mean fold enrichment ± SE. ChIP experiments using anti-TWIST1 or anti-CHD8 antibodies against endogenous proteins were performed on wildtype (WT), Twist1+/- and Chd8+/- NECs derived from ESC (n = 3, day 3). qPCR results were normalized against signal from non-binding negative control region and displayed as fold change against IgG control. Each condition was compared against WT and P-values were generated using one-way ANOVA. *p<0.05, **p<0.01, ***p<0.001, ****p<0.0001. ns, not significant.
Figure 6 with 1 supplement
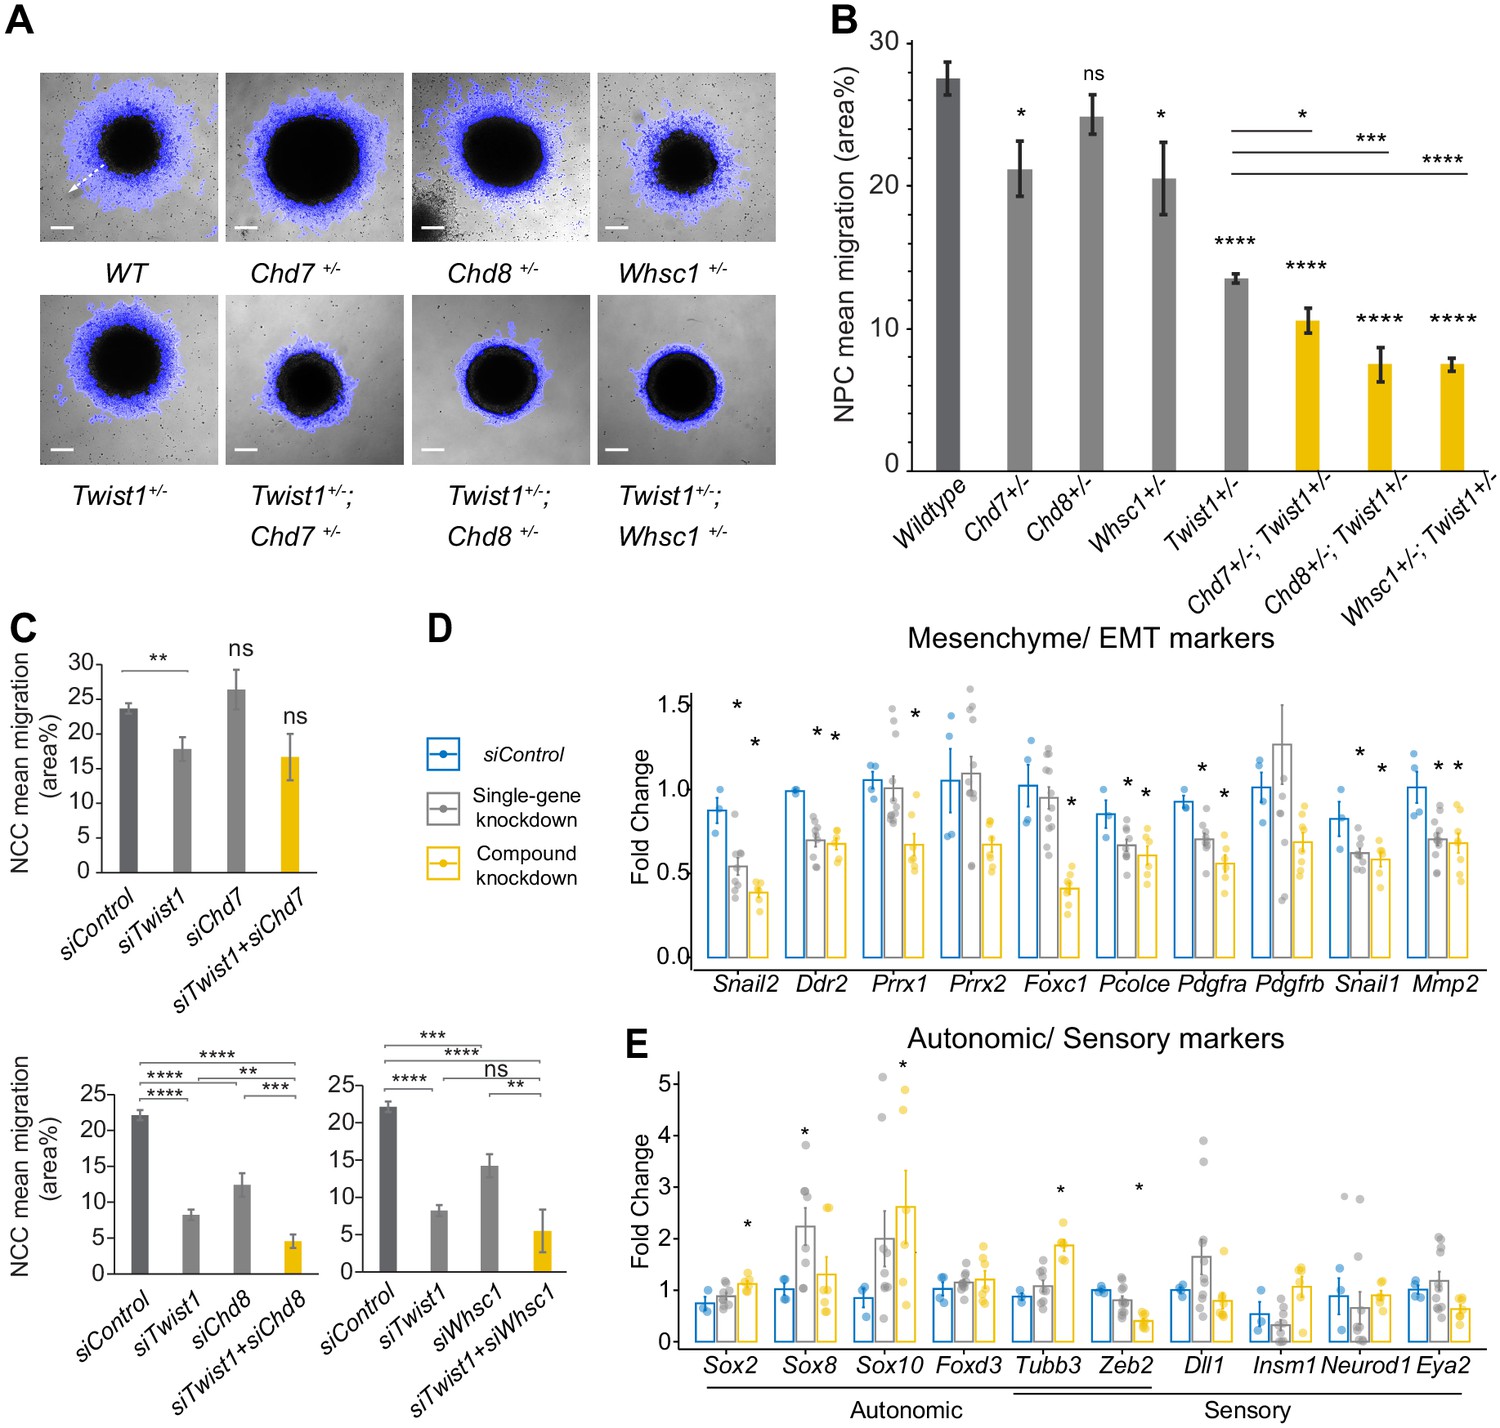
The TWIST1-chromatin regulators are necessary for cell migration and the NCC ectomesenchyme potential.
(A) Dispersion of cells from the colony over 10 hr period in vitro (blue halo area). White arrow (shown in wildtype, WT) indicates the centrifugal cell movement. Bright-field time-lapse images were captured at set tile regions. Bar = 0.2 mm (B) Cell migration over 10 hr was quantified from time-lapse imaging data and plotted as mean area % ± SE for each cell type. n = 5 for each genotype. p-Values were computed by one-way ANOVA with Holm-sidak post-test. (C) Results of the scratch assay of O9-1 cells with siRNA knockdowns of Twist1, Chd7, Chd8, Whsc1, and control siRNA. Bright-field images were captured at set tile regions every 15 min over 10 hr. Cell migration was measured as mean area % traversed ± SE, in triplicate experiments for each genotype. Each condition was compared to WT. p-Values were computed by one-way ANOVA. *p<0.05, **p<0.01, ***p<0.001, ****p<0.0001. ns, not significant. (D, E) RT-qPCR quantification of expression of genes associated with EMT/ectomesenchyme, autonomic and sensory neuron fates, selected from E8.5-E10.5 mouse NCC scRNA-seq data. Gene expression is represented as fold change against control ± SE. The bar diagram shows the expression fold changes in cells treated with siRNA individually for Twist/ Chd8 or Whsc1 (pooled result of the treatments, gray bar) and siRNA for Twist1 in combination with Chd8 or Whsc1 (pooled result of the treatments, yellow bar). Expression were normalized with the average expression of three housekeeping genes (Gapdh, Tbp, Actb). Each group was compared to control knockdown treatment. p-Values were computed by one-way ANOVA. *p<0.05.
Figure 6—figure supplement 1
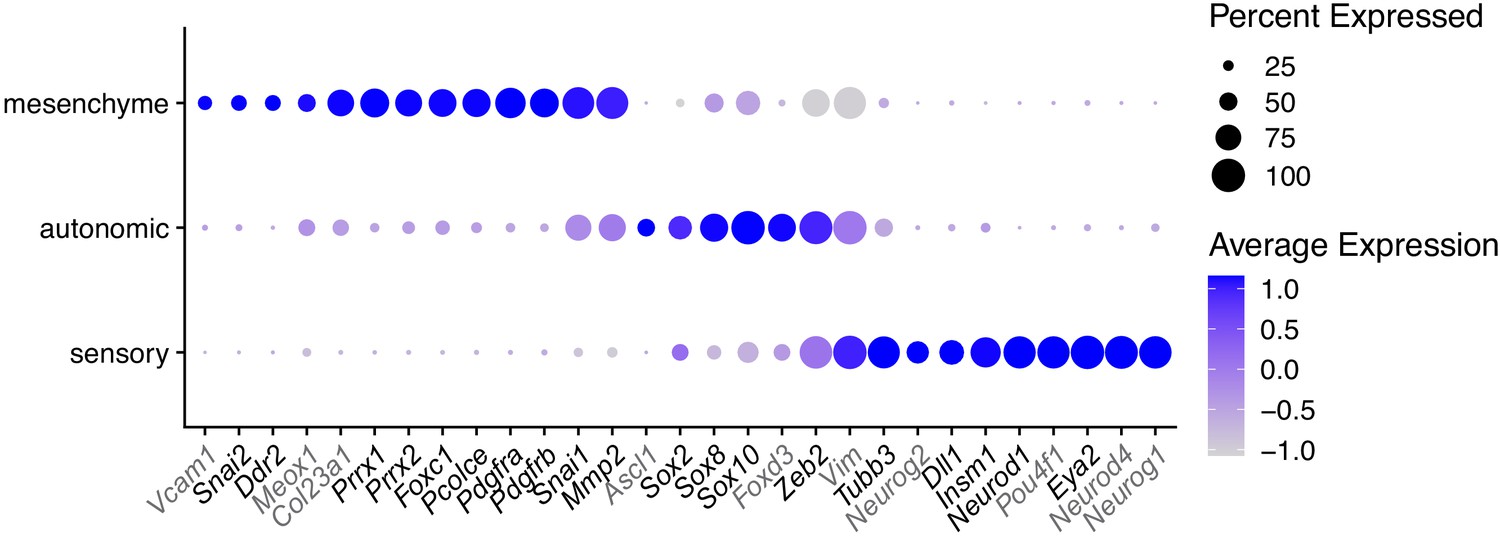
Marker genes selected for qPCR analysis in O9-1 cells with TWIST1-CRM knockdown.
Gene markers for mesenchyme, autonomic and sensory neural cell identity were selected based on bifurcation analysis (Soldatov et al., 2019). Genes not detected in O9-1 cells are marked in gray. The dot size represents the percentage of cells expressing the selected genes and the color gradient shows log normalized expression level in scRNA-seq datasets of E8.5-E10.5 NCCs.
Figure 7 with 1 supplement
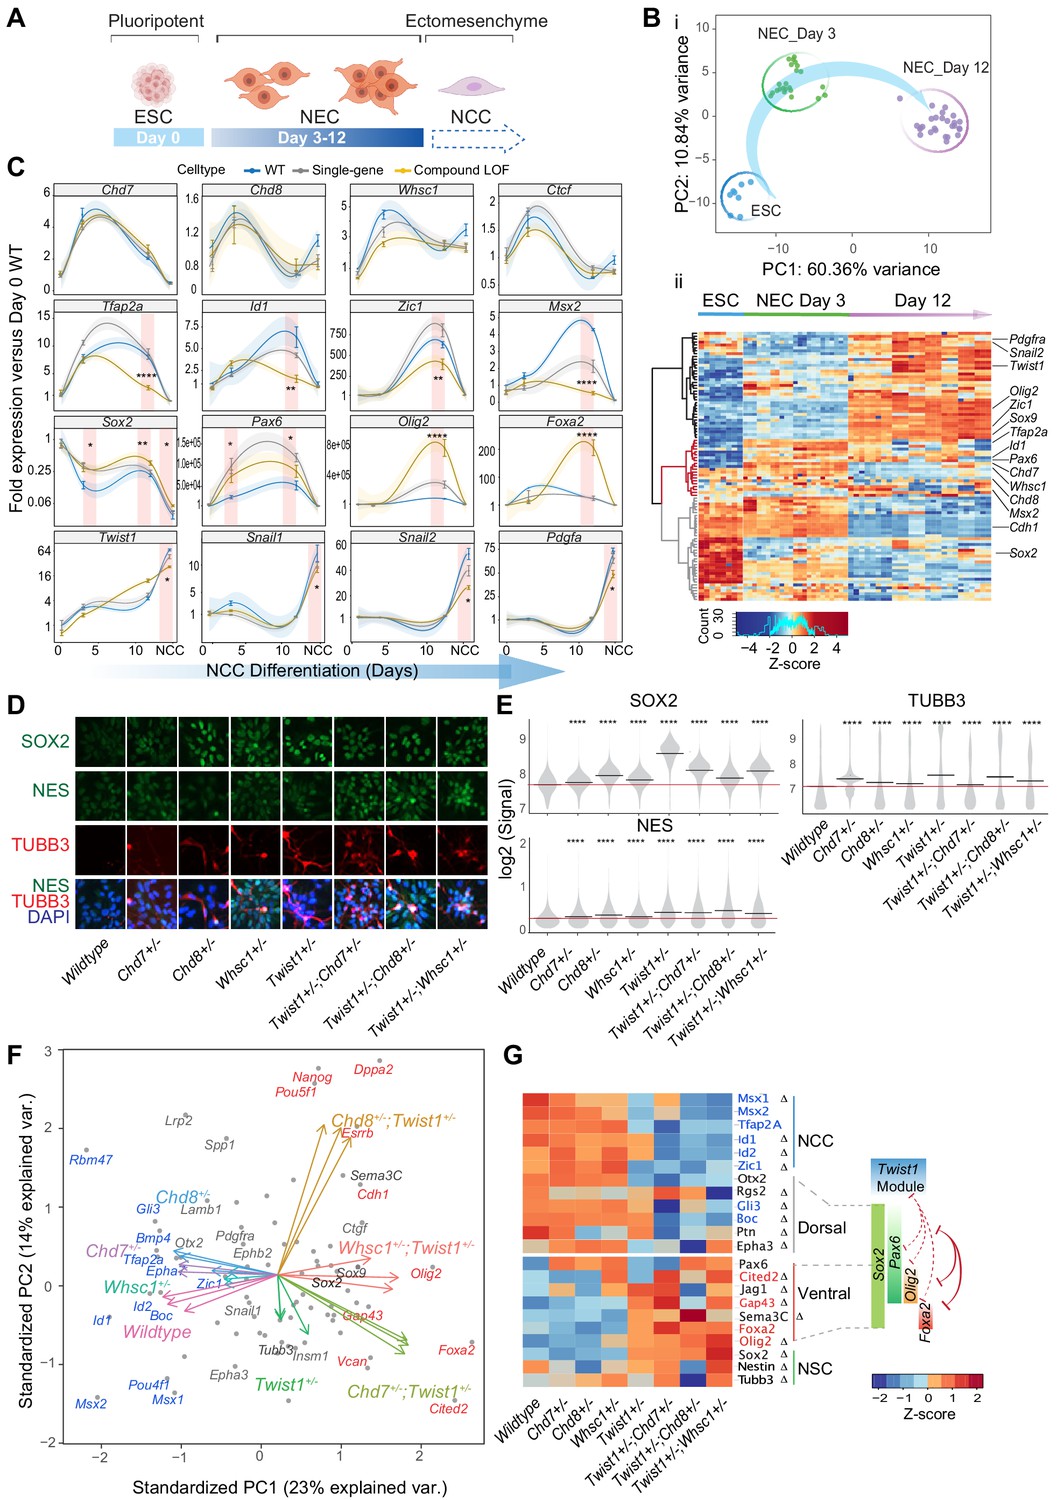
The TWIST1-chromatin regulators predispose NCC propensity and facilitate dorsal-ventral neuroepithelial specification.
(A) Experimental strategy of neural differentiation in vitro (Bajpai et al., 2010; Varshney et al., 2017). (B) (i) Principal component analysis (PCA) of the Fluidigm high-throughput qPCR data for all cell lines collected as ESC, and neuroepithelial cells (NECs) at day 0, day 3, and day 12 of differentiation, respectively. Differentiation trajectory from ESC to NEC is shown for the first two PC axes. (ii) Heatmap clustering of normalized gene expressions for all cell lines: n = 3 for each genotype analyzed at day 3 and day 12 of neuroepithelium differentiation and n = 1 for ESCs. Clusters indicate activated (black), transiently activated (red) and repressed (gray) genes during neural differentiation. Z-score (color-coded) is calculated from log2 transformed normalized expression. (C) Profiles of expression of representative genes during neural differentiation (day 0 to NCC). Mean expression ± standard error (SE) are plotted for wildtype, single-gene heterozygous (average of Twist1+/-, Chd7+/-, Chd8+/-, and Whsc1+/-) or compound heterozygous (average of Twist1+/-;Chd7+/-, Twist1+/-;Chd8+/-, and Twist1+/-;Whsc1+/-) groups. For NCCs, samples were collected O9-1 cells with siRNA knockdown of single-gene or combinations of Twist1 and one of the partners. Gene expression were normalized against the mean expression value of three housekeeping genes (Gapdh, Tbp, Actb), and then the expression of day 0 wild-type ESCs. Shading of trend line represents 90% confidence interval. Red stripes indicate stages when target gene expressions were significantly affected by the double knockdown. -Values were calculated using one-way ANOVA. *p<0.05, **p<0.01, ***p<0.001, ****p<0.0001. ns, not significant. (D) Immunofluorescence of SOX2 and selected NSC markers and (E) quantification of signal intensity ± SE in single cells of indicated genotypes (X-axis). p-Values were generated using one-way ANOVA with Holm-sidak post-test. *p<0.05, **p<0.01, ***p<0.001, ****p<0.0001. (F) PCA plot of the NECs (day 12) showing genes with highest PC loadings (blue = top 10 loading, red = bottom 10 loading), and vector of each genotype indicating their weight on the PCs. (G) Heatmap of genes associated with neural tube to NCC transitions: NCC specifiers, dorsal-, ventral-, pan-NSC in mutant versus wild-type NECs. Progenitor identities along the neural tube, the reported master TFs and the co-repression (red solid line) of dorsal and ventral progenitors are illustrated on the right (Briscoe et al., 2000; Alaynick et al., 2011; Kutejova et al., 2016). Repression (red) or promotion (green) of cell fates by TWIST1-module based on the perturbation data are indicated in dashed lines. Genes with the highest PC loadings were indicated in same colors as in D. Z-scores (color-coded) were calculated from Log2 fold-change against wildtype cells. Changes in gene expressions were significant (by one-way ANOVA). Genes identified as targets in at least two ChIP-seq datasets among TWIST1, CHD7, and CHD8 are labeled with ∆.
-
Figure 7—source data 1
Normalized gene expression table from Fluidigm high-throughput qPCR analysis.
Expression of 91 marker genes on days 0, 3, 12 of neural differentiation for wildtype, single-gene heterozygous (average of Twist1+/-, Chd7+/-, Chd8+/- and Whsc1+/-) or compound heterozygous (average of Twist1+/-;Chd7+/-, Twist1+/-;Chd8+/- and Twist1+/-;Whsc1+/-) groups. For NCCs, samples were collected O9-1 cells with siRNA knockdown of single-gene or combinations of Twist1 and one of the partners. Gene expression were normalized against the mean expression value of three housekeeping genes (Gapdh, Tbp, Actb), and then the expression of day 0 wild-type ESCs.
- https://cdn.elifesciences.org/articles/62873/elife-62873-fig7-data1-v2.csv
Figure 7—figure supplement 1
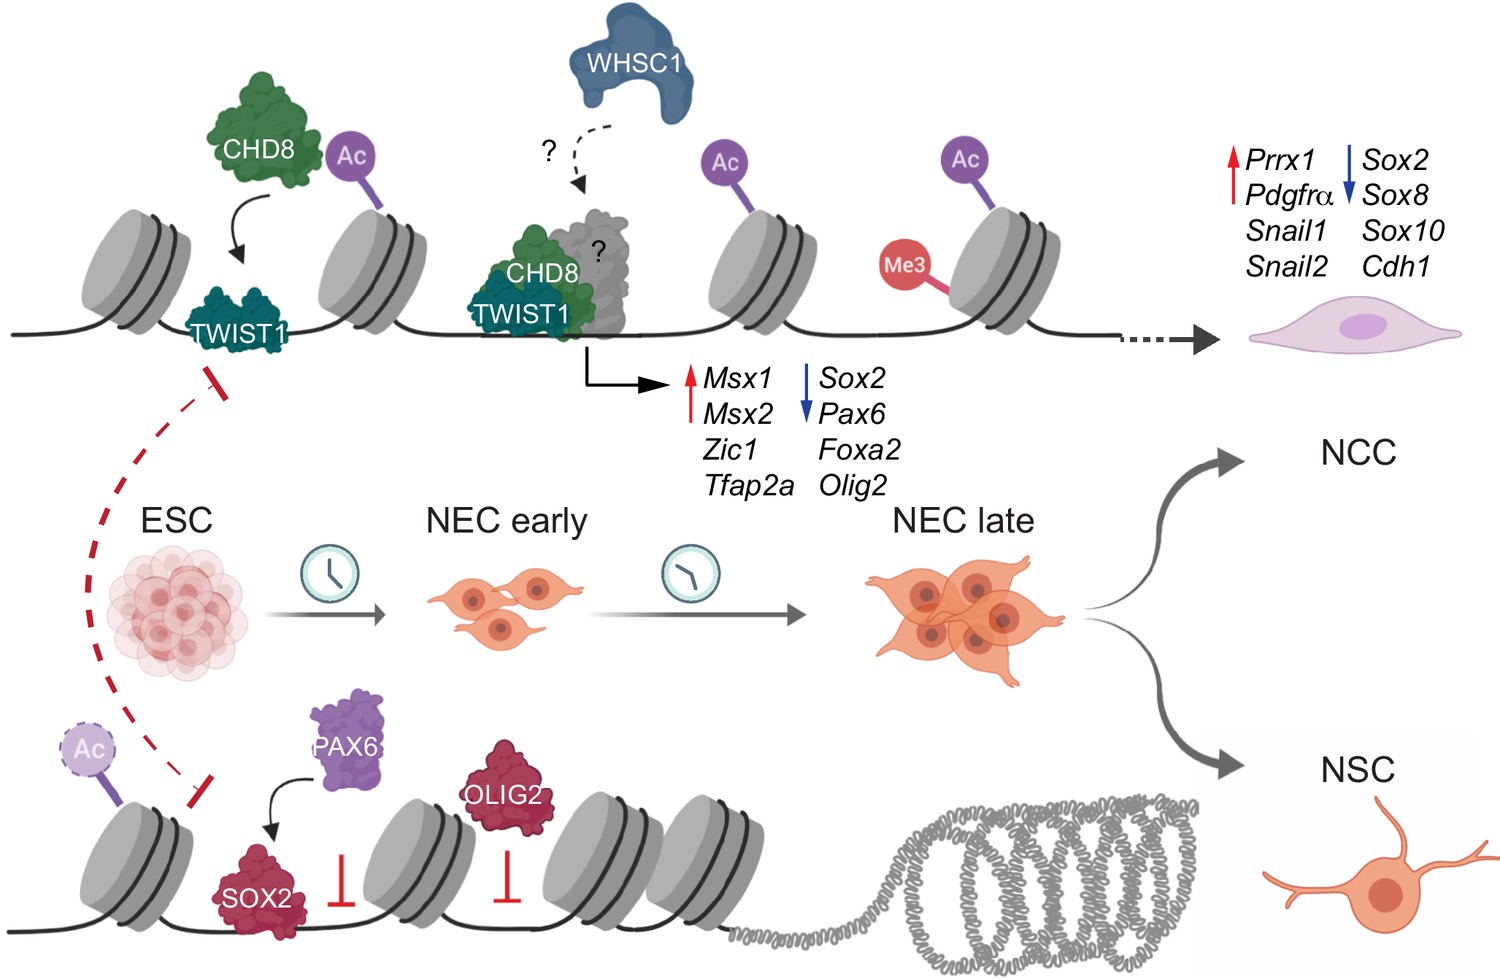
Molecular model of the fate decision between neural crest cells (NCC) and neural stem cells (NSC).
During NCC differentiation TWIST1 enables the assembly of chromatin regulators at the regulatory elements of genes that promote NCC identity and EMT, while repress the expression of NSC transcription factors (TFs). Concurrently, the NSC TFs: SOX2, PAX6, and OLIG2, compete for occupancy of regulatory regions to constrain the transcriptional activity of the NCC program and activate the neurogenic program to enhance the bias toward NSC fates.
Tables
Key resources table
| Reagent type (species) or resource | Designation | Source or reference | Identifiers | Additional information |
|---|---|---|---|---|
| Aantibody (mouse monoclonal) | α-TWIST | Abcam | cat# ab50887; RRID:AB_883294 | 1:1000 |
| Antibody (rabbit polyclonal) | α-CHD7 | Abcam | cat# ab117522; RRID:AB_10938324 | 1:5000 |
| Antibody (rabbit polyclonal) | α-CHD8 | Abcam | cat# ab114126; RRID:AB_10859797 | 1:10,000 |
| Antibody (mouse monoclonal) | α-WHSC1 | Abcam | cat# ab75359; RRID:AB_1310816 | 1:5000 |
| Antibody (rabbit polyclonal) | α-SOX2 | Abcam | cat# ab59776; RRID:AB_945584 | 1:1000 |
| Antibody (mouse monoclonal) | α-VINCULIN | Sigma | cat# V9131; RRID:AB_477629 | 1:1000 |
| Antibody (mouse monoclonal) | α-OCT3/4 | Santa Cruz | cat# sc-5279; RRID:AB_628051 | 1:1000 |
| Antibody (rabbit polyclonal) | α-TFAP2A | Abcam | cat# ab52222; RRID:AB_867683 | 1:1000 |
| Antibody (mouse monoclonal) | α-NESTIN | Abcam | cat# ab7659; RRID:AB_2298388 | 1:1000 |
| Antibody (mouse monoclonal) | α-FLAG | Sigma | cat# F1804; RRID:AB_262044 | 1:1000 |
| Antibody (mouse monoclonal) | α-neurofilament | DSHB | cat#2H3; | 1:1000 |
| Antibody (rabbit polyclonal) | α-HA | Abcam | cat# ab9110; RRID:AB_307019 | 1:1000 |
| Transfected construct (M. musculus) | siChd7 #1 | Sigma-Aldrich | SASI_Mm02_00298181 | |
| Transfected construct (M. musculus) | siChd7 #2 | Sigma-Aldrich | SASI_Mm01_00234434 | |
| Transfected construct (M. musculus) | siChd7 #3 | Sigma-Aldrich | SASI_Mm01_00234436 | |
| Transfected construct (M. musculus) | siChd8 #1 | Sigma-Aldrich | SASI_Mm02_00351688 | |
| Transfected construct (M. musculus) | siChd8 #2 | Sigma-Aldrich | SASI_Mm02_00351689 | |
| Transfected construct (M. musculus) | siChd8 #3 | Sigma-Aldrich | SASI_Mm02_00351691 | |
| Transfected construct (M. musculus) | siWhsc1 #1 | Sigma-Aldrich | SASI_Mm01_00278608 | |
| Transfected construct (M. musculus) | siWhsc1 #2 | Sigma-Aldrich | SASI_Mm01_00278610 | |
| Transfected construct (M. musculus) | siWhsc1 #3 | Sigma-Aldrich | SASI_Mm02_00295201 | |
| Transfected construct (M. musculus) | siTwist1 | Sigma-Aldrich | SASI_Mm01_00043025 | |
| Transfected construct (M. musculus) | siRNA Universal Negative Control #1 | Sigma-Aldrich | SIC001 | |
| Transfected construct (M. musculus) | siRNA Universal Negative Control #2 | Sigma-Aldrich | SIC002 | |
| Cell line (M. musculus) | O9-1 neural crest stem cell | Millipore | Millipore | |
| Cell line (M. musculus) | 3T3 | ATCC | ATCC | |
| Cell line (M. musculus) | A2loxCre ESCs | Kyba Lab | Lillehei Heart Institute, Minnesota, USA | |
| Cell line (M. musculus) | A2loxCre Twist1+/- | This paper | See Materials and methods | |
| Cell line (M. musculus) | A2loxCre Twist1-/- | This paper | See Materials and methods | |
| Cell line (M. musculus) | A2loxCre Twist1+/-; Chd7+/- | This paper | See Materials and methods | |
| Cell line (M. musculus) | A2loxCre Twist1+/-; Chd8+/- | This paper | See Materials and methods | |
| Cell line (M. musculus) | A2loxCre Twist1+/-; Whsc1+/- | This paper | See Materials and methods | |
| Cell line (M. musculus) | A2loxCre Chd7+/- | This paper | See Materials and methods | |
| Cell line (M. musculus) | A2loxCre Chd8+/- | This paper | See Materials and methods | |
| Cell line (M. musculus) | A2loxCre Whsc1+/- | This paper | See Materials and methods |
Additional files
-
Supplementary file 1
BioID EdgeR test result table.
- https://cdn.elifesciences.org/articles/62873/elife-62873-supp1-v2.xlsx
-
Supplementary file 2
TWIST1 protein interaction module and Gene Ontology analysis.
- https://cdn.elifesciences.org/articles/62873/elife-62873-supp2-v2.xlsx
-
Supplementary file 3
Information on BioID candidates selected for validation.
Cell line of origin of the candidate is listed. Expression data of the embryonic head was from published study (Fan et al., 2016). PSM: peptide sequence matches. Log2 FC = log2 transformed PSM fold-change between TWIST1-BirA*HA and GFP transfected O9-1 cells. Adjusted p-value was computed from dataset from O9-1 cell line, generated by the likelihood ratio test corrected by the Benjamini and Hochberg method in EdgeR (Robinson et al., 2010). Diffusion Rank: The rank of candidates in heat diffusion from genes associated with human and mouse facial malformation.
- https://cdn.elifesciences.org/articles/62873/elife-62873-supp3-v2.docx
-
Supplementary file 4
Integrative analysis of ChIP datasets.
- https://cdn.elifesciences.org/articles/62873/elife-62873-supp4-v2.xlsx
-
Supplementary file 5
BioMark reporter card setup.
- https://cdn.elifesciences.org/articles/62873/elife-62873-supp5-v2.xlsx
-
Supplementary file 6
Summary of external ChIP-seq datasets analyzed in this study.
- https://cdn.elifesciences.org/articles/62873/elife-62873-supp6-v2.xlsx
-
Transparent reporting form
- https://cdn.elifesciences.org/articles/62873/elife-62873-transrepform-v2.docx
Download links
A two-part list of links to download the article, or parts of the article, in various formats.
Downloads (link to download the article as PDF)
Open citations (links to open the citations from this article in various online reference manager services)
Cite this article (links to download the citations from this article in formats compatible with various reference manager tools)
TWIST1 and chromatin regulatory proteins interact to guide neural crest cell differentiation
eLife 10:e62873.
https://doi.org/10.7554/eLife.62873


