Pre-existing bilayer stresses modulate triglyceride accumulation in the ER versus lipid droplets
- University of Fribourg, Department of Biology, Switzerland
- Laboratoire de Physique de l’École Normale Supérieure, ENS, Université PSL, CNRS, Sorbonne Université, Université de Paris, France
Figures
Figure 1 with 1 supplement
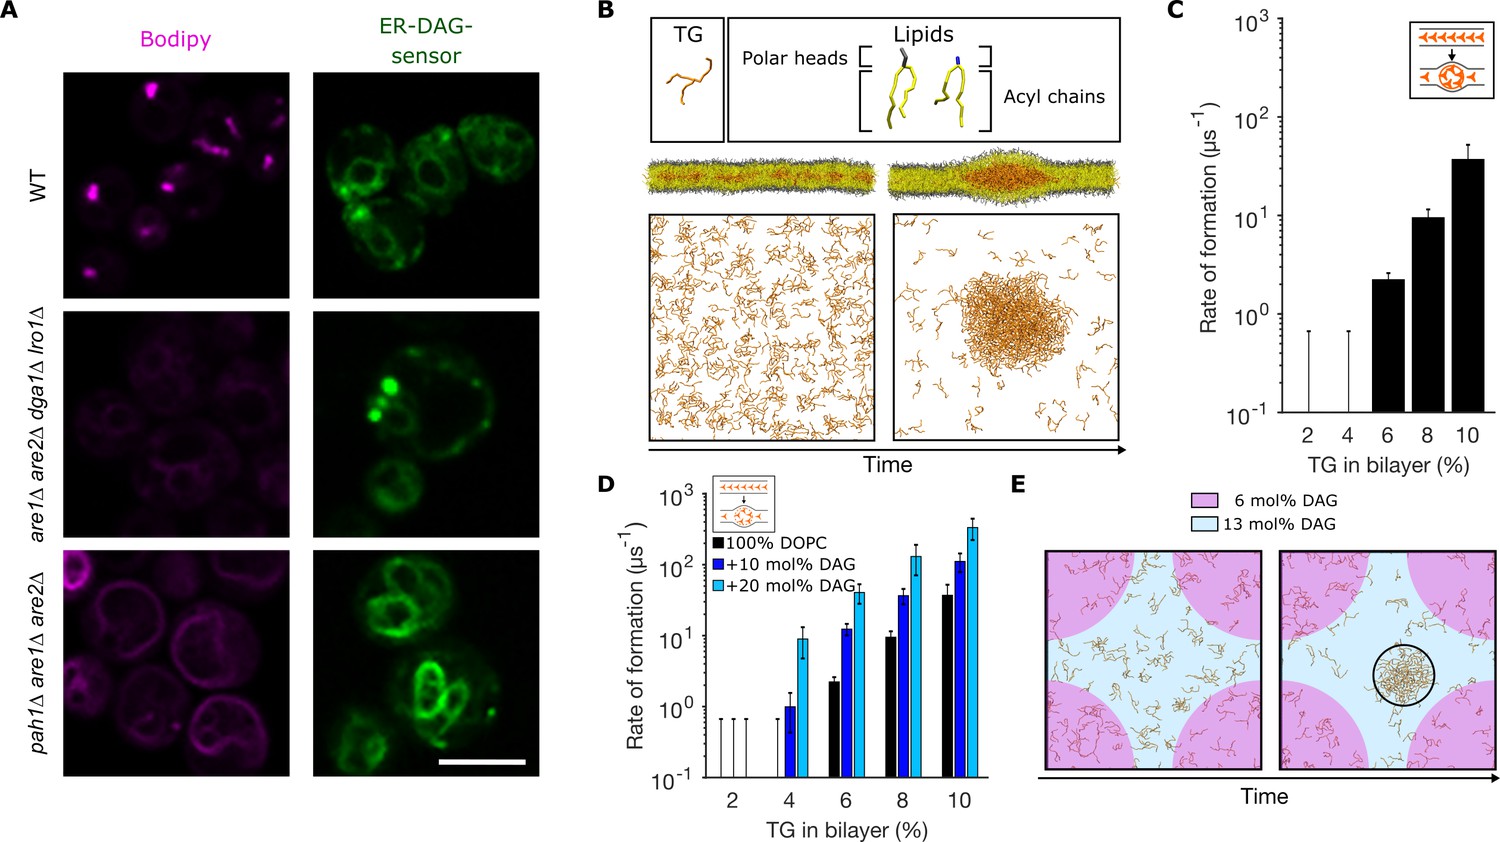
Diacylglycerol (DAG) promotes nucleation of triglyceride (TG) blisters.
(A) Fluorescence microscopy images of WT, dga1Δlro1Δare1Δare2Δ (4Δ) and pah1Δare1Δare2Δ yeast cells. Left panels: neutral lipids (NLs) are stained by BODIPY, right panels: ER-DAG sensor staining. Microscope intensity settings in the three panels are identical to allow for quantitative comparison. (B) Setup used to investigate TG nucleation in molecular dynamics (MD) simulations. TG at different concentrations are randomly distributed in a bilayer and simulations are run until formation of blisters or for a total length of 1.5 µs. TG concentrations are reported as ratio between TG and phospholipids (PLs). (C) Rate of formation of TG blisters at different TG concentrations, obtained from MD simulations. (D) Rate of formation of TG blisters at different TG concentrations in the presence of DAG (10 mol%, 20 mol%), from MD simulations. TG concentrations are reported as ratio between TG and PLs. (E) Top view of TG nucleation from simulations of lipid bilayers with two coexisting DAG concentrations (6 mol% and 13 mol%). The two bilayer regions with different DAG concentrations have identical surface areas.
Figure 1—figure supplement 1
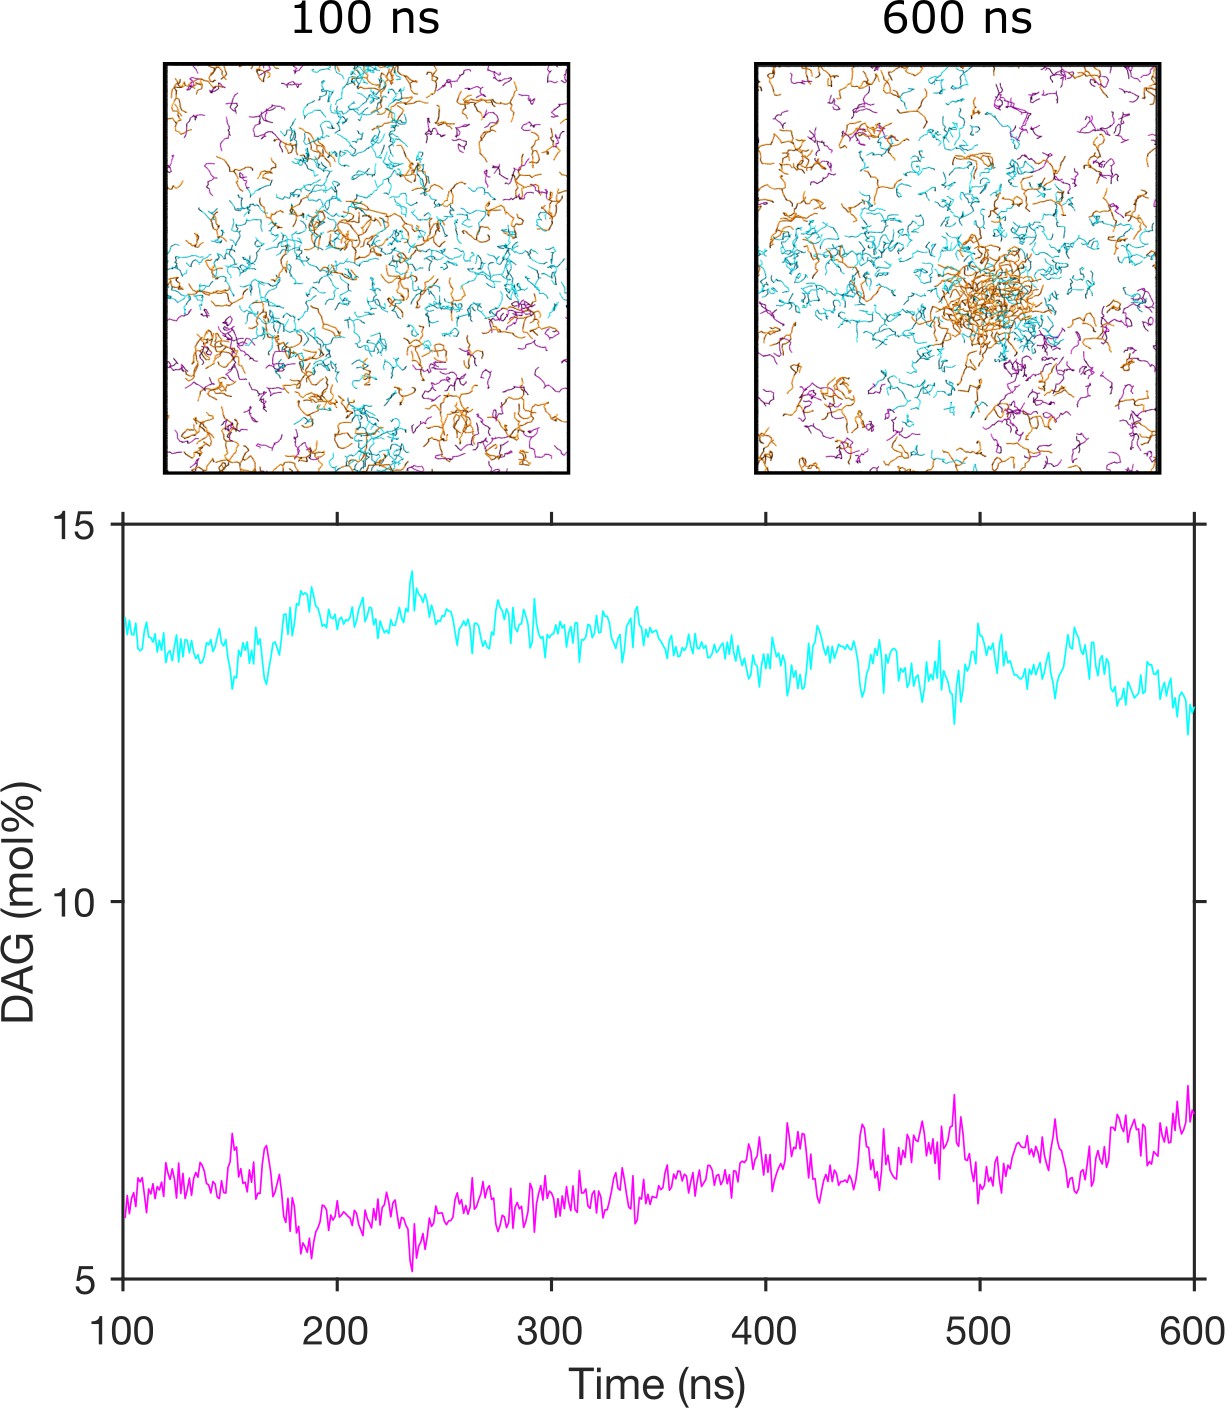
Diacylglycerol (DAG) promotes nucleation of triglyceride (TG) blisters.
Concentration of DAG in different regions over time in one replica. DAG molecules in the region with the highest concentration are colored in cyan, and DAG molecules in the region with the lowest concentration are colored in magenta.
Figure 2 with 1 supplement
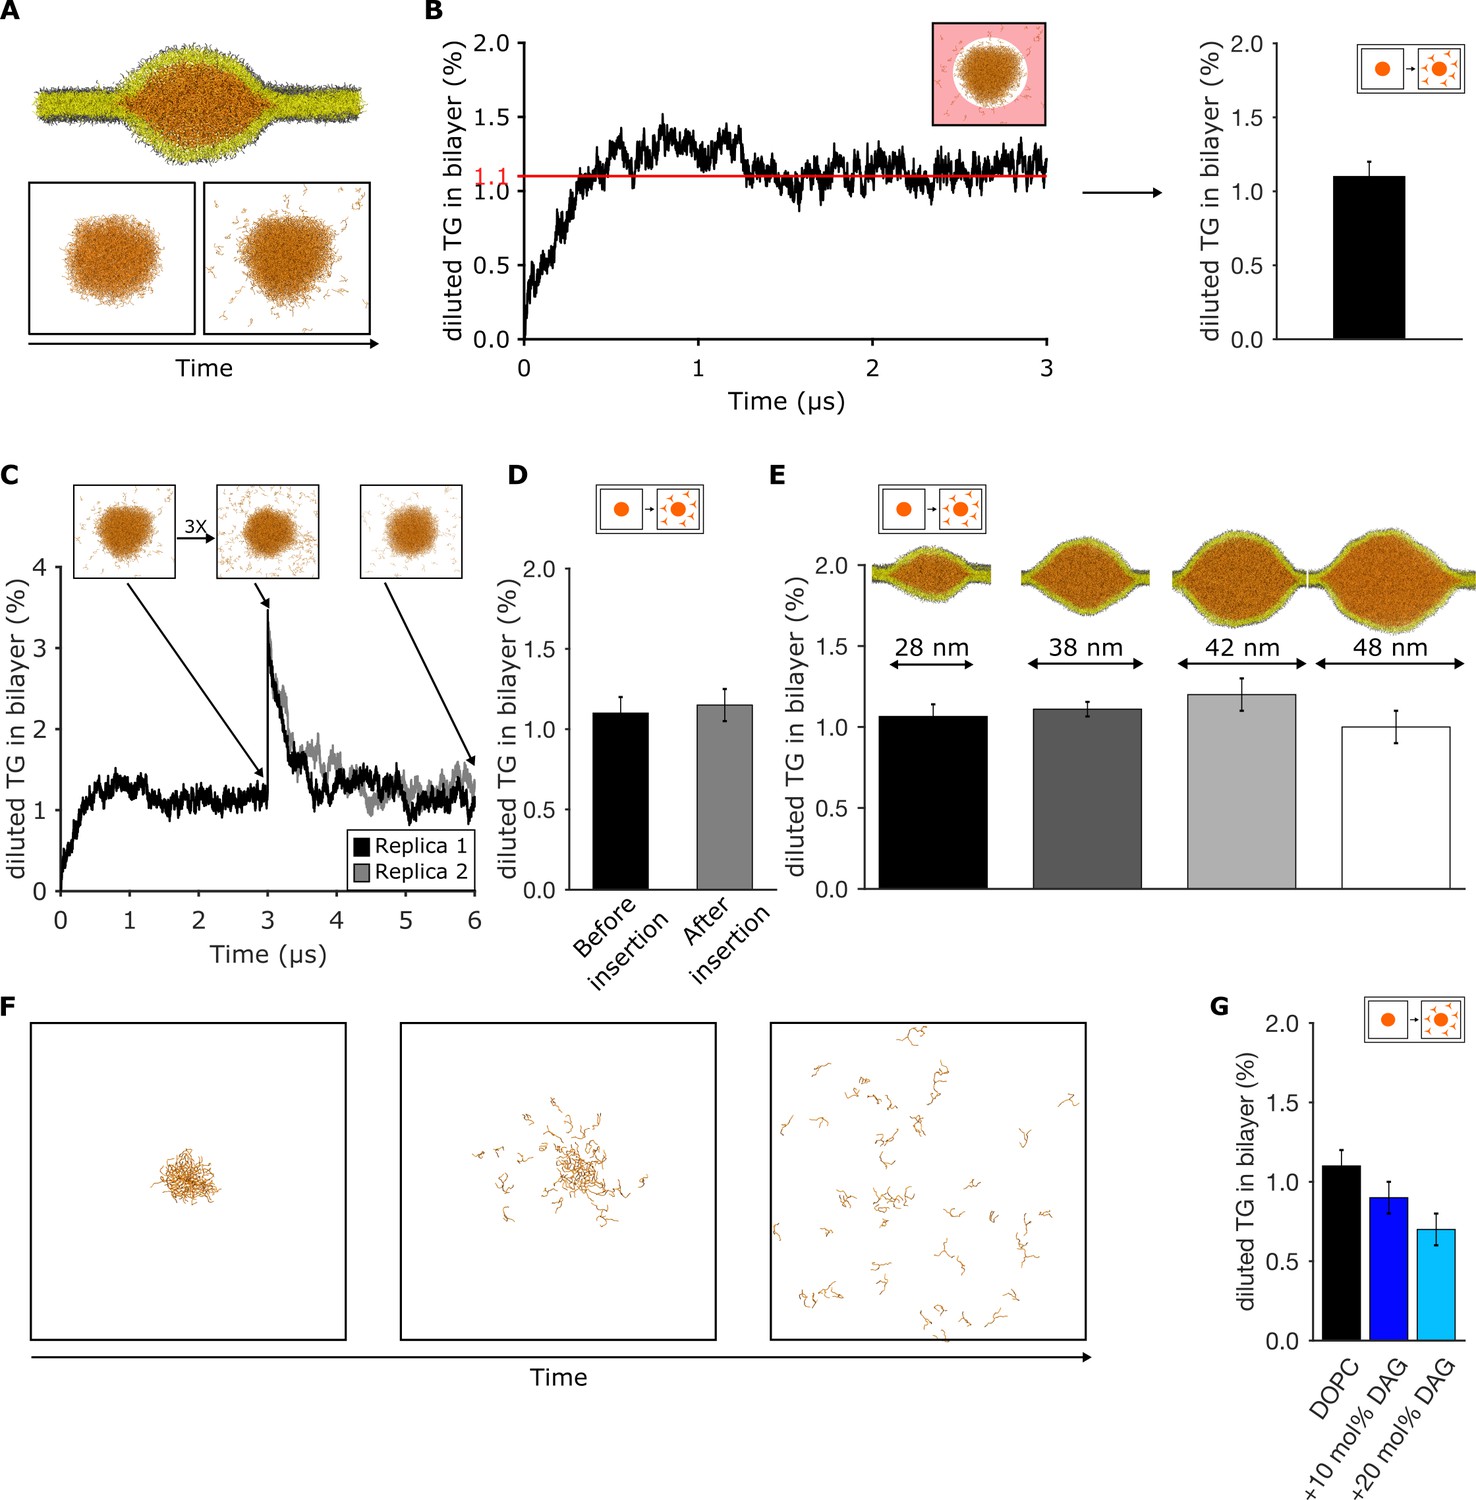
Triglyceride (TG) blister formation in lipid bilayers is consistent with a phase separation process.
(A) Setup used to measure the amount of diluted TG via spontaneous diffusion from a pre-formed blister and (B) quantification over time. The area in which TG is assumed as diluted is highlighted in light red. (C) Time evolution of the percentage of diluted TG inside the bilayer. The injection of additional TG molecules was performed after 3 μs of dynamics. (D) Comparison between the values of diluted TG before and after the insertion of TG in the bilayer. (E) Quantification of diluted TG in oil blisters of different sizes. (F) Time evolution of blister dissolution when the total TG concentration in the system is below the threshold observed in (B and C). (G) Percentage of diluted TG in lipid bilayers enriched in diacylglycerol (DAG) lipids. In all the panels, TG concentrations are reported as ratio between TG and phospholipid (PL).
Figure 2—figure supplement 1
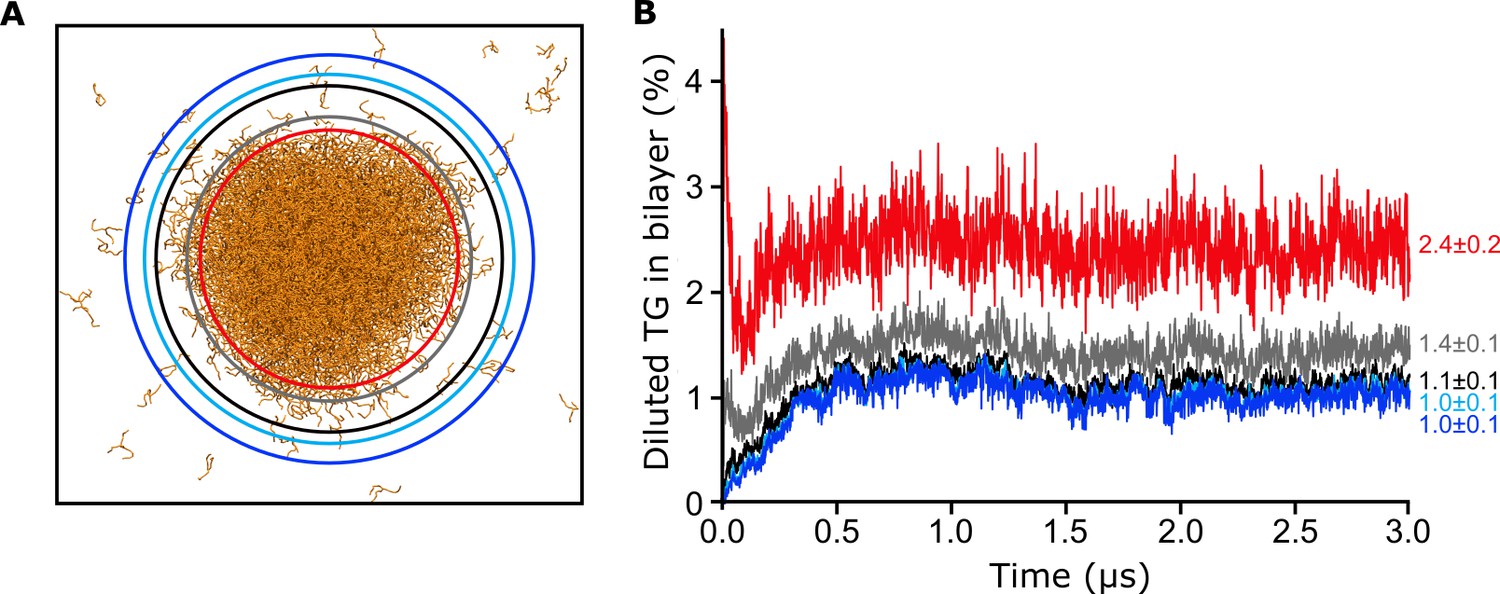
Choice of the radius for the calculation of diluted triglycerides (TG).
We chose the smallest radius (black) above which we got always the same value of diluted TG.
Figure 3
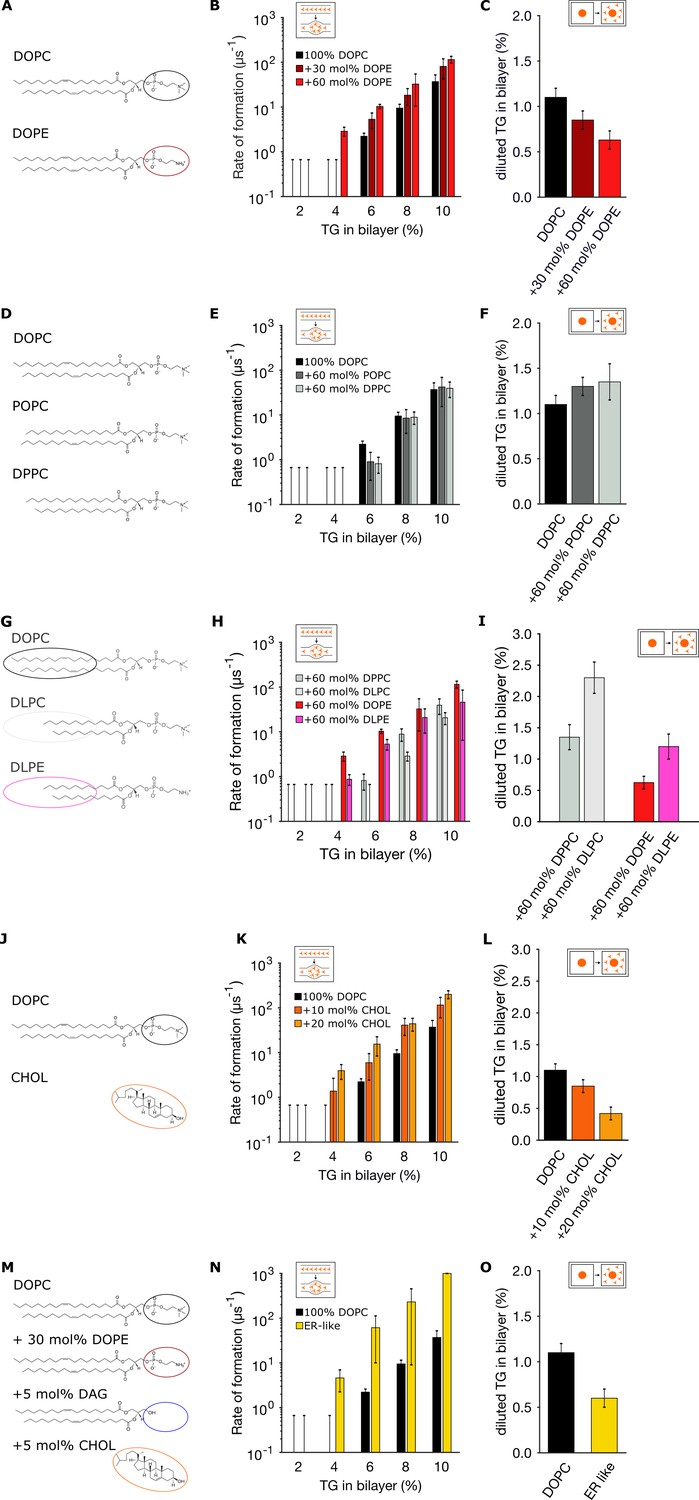
Endoplasmic reticulum (ER) membrane lipids promote triglyceride (TG) blister formation.
(A, D, G, J, M) Lipid compositions tested and chemical structures of the various lipids involved in the mixtures. (B, E, H, K, N) Corresponding rates of blister formation, and (C, F, I, L, O) percentage of diluted TG. In all the panels, TG concentrations are reported as ratio between TG and phospholipid (PL).
Figure 4
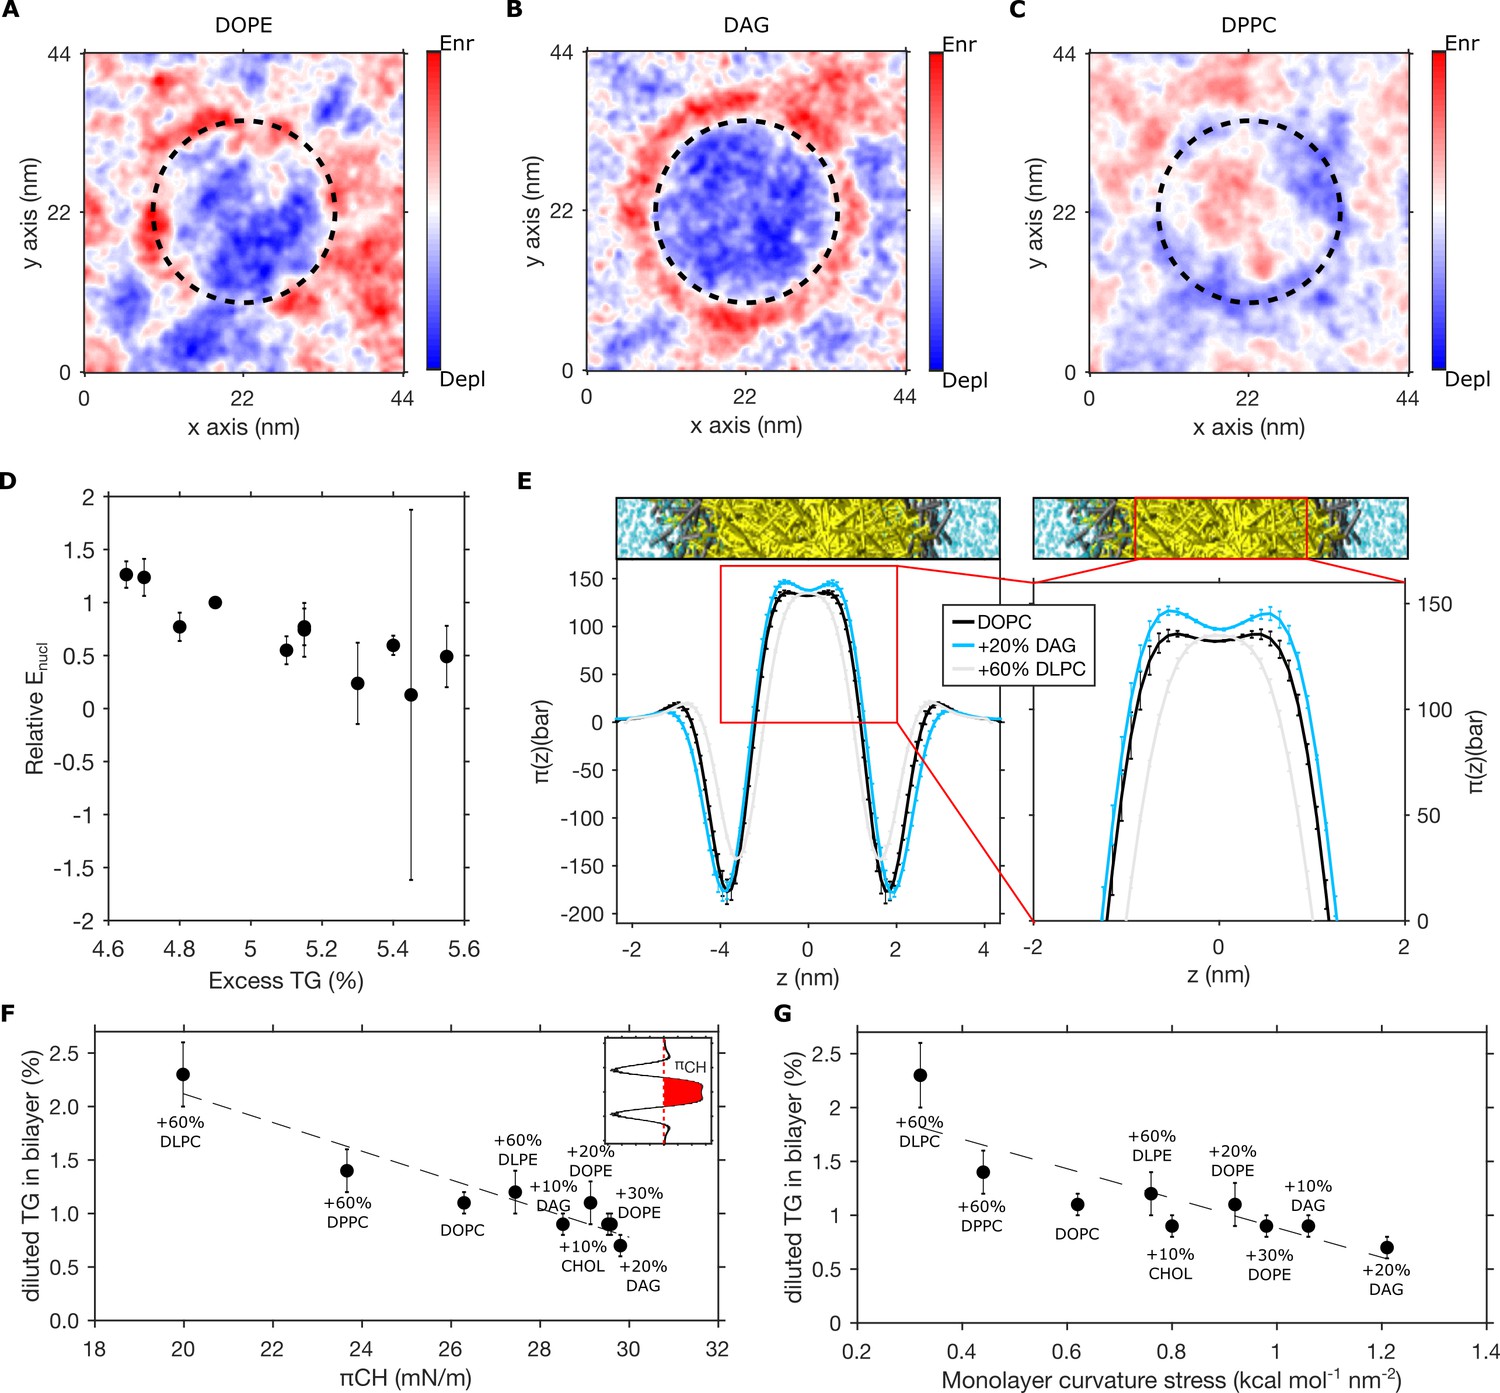
Pre-existing bilayer stresses modulate in-bilayer diluted triglyceride (TG) concentration.
(A–C) Depletion-enrichment maps for (A) DOPC + 20 mol% DOPE, (B) DOPC + 20 mol% diacylglycerol (DAG), and (C) DOPC + 60 mol% DPPC bilayers in the presence of a TG blister (dashed line). (D) Correlation between the relative nucleation energy (Enucl) for different bilayer compositions (with respect to Enucl of DOPC bilayers) and excess TG. (E) Lateral pressure profile of bilayers containing different lipid compositions. (F and G) Correlation between chain pressure πCH (F) or monolayer curvature stress (G) and TG equilibrium concentration for bilayer mixtures containing DOPC, DOPE, DAG, DPPC, DLPC, DLPE, and cholesterol. All the percentage in the graph referring to bilayer compositions are to be intended as mol%, while TG concentrations are reported as ratio between TG and phospholipid (PL).
Figure 5
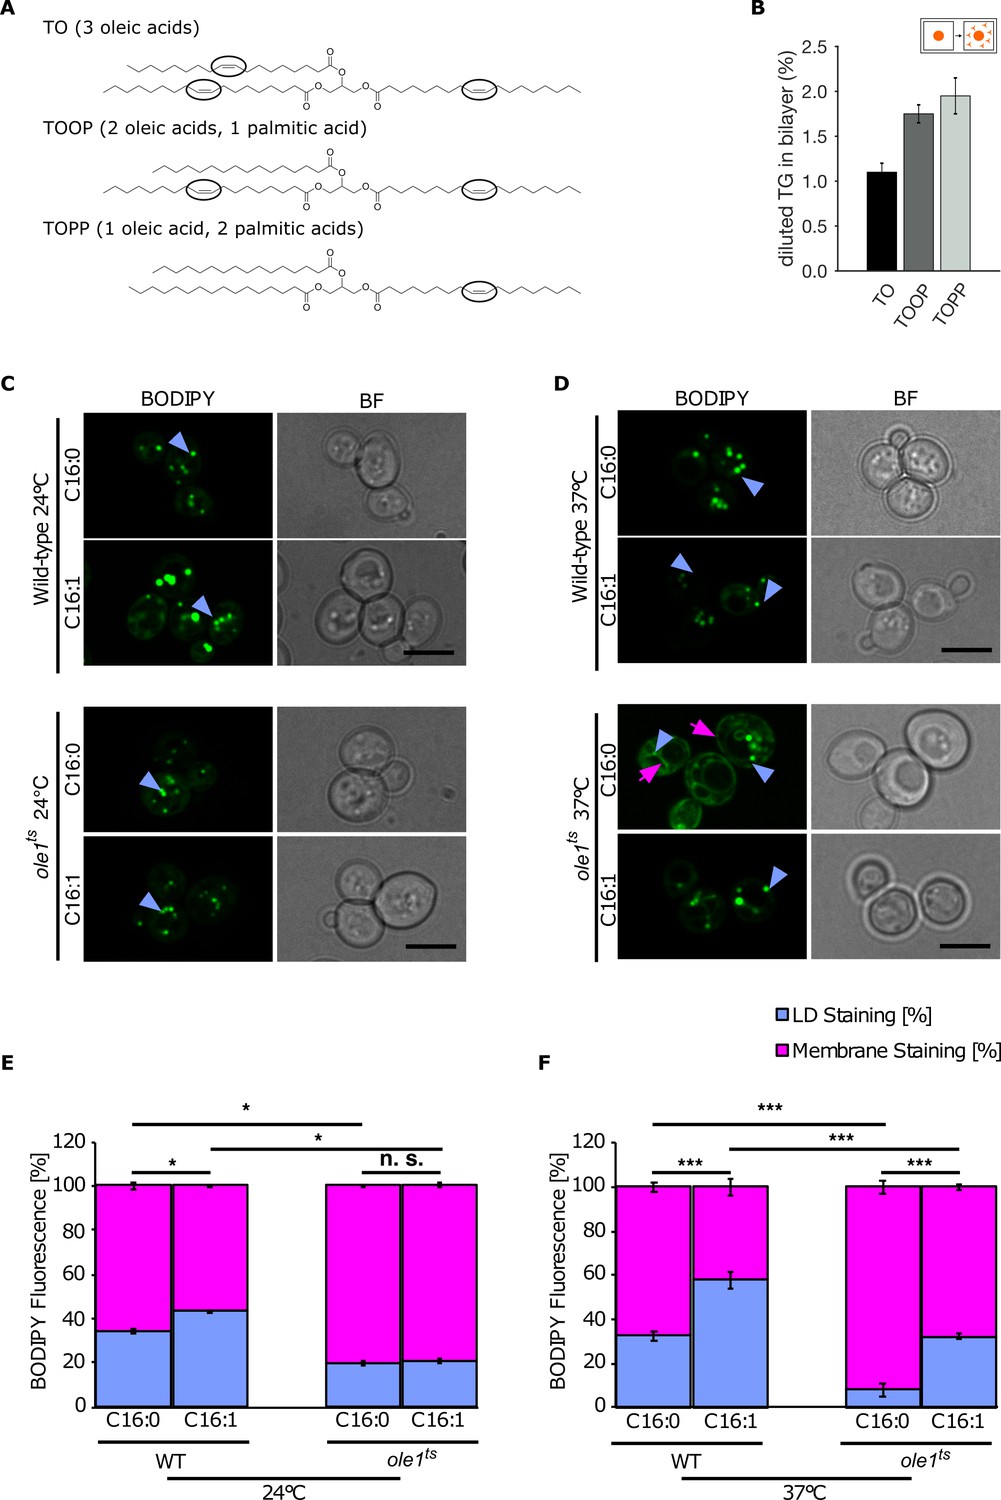
Lipid saturation promotes triglyceride (TG) accumulation in the endoplasmic reticulum (ER).
(A) Chemical structure of unsaturated TG used in molecular dynamics (MD) simulations. Black ovals indicate the presence of double bonds in the acyl chain. (B) Equilibrium 'diluted' concentration of different TG in DOPC bilayers. TG concentrations are reported as ratio between TG and phospholipids (PLs). (C and D) Fluorescence microscopy images of wild-type and temperature-sensitive ole1ts at 24°C (C) and 37°C (D). Strains were cultivated in SC medium containing palmitic acid (C16:0) or palmitoleic acid (C16:1) and cells were stained with the neutral lipid (NL) marker BODIPY. The blue arrowheads highlight lipid droplets (LDs), and the pink arrows point to the cortical and perinuclear ER membrane. (E and F) Quantification of fluorescent intensities of LDs and membranes (n = 50) in the different conditions shown in (C and D): Values represent fluorescent intensity relative to total cellular fluorescence. Asterisks denote statistical significance (Student’s t-test, *p < 0.05, ***p < 0.001), n.s., non-significant.
Figure 6
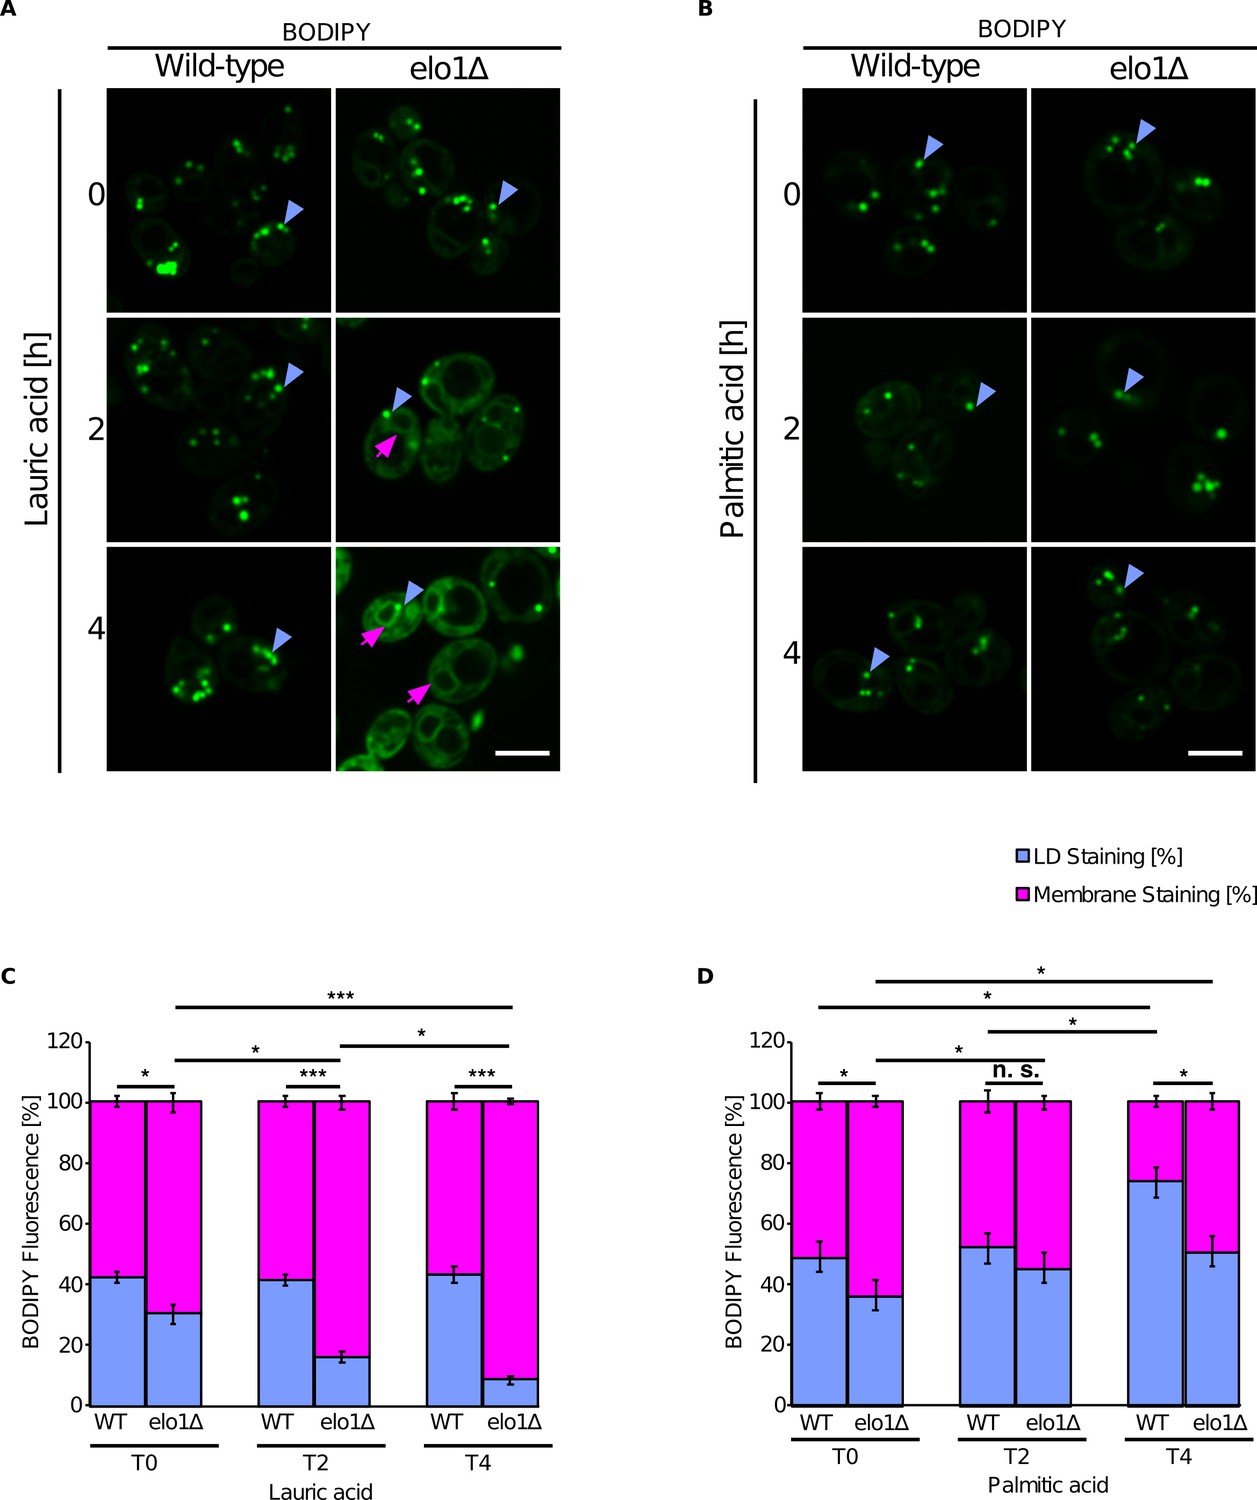
Short-chain lipids promote triglyceride (TG) accumulation in the endoplasmic reticulum (ER).
(A and B) Fluorescence microscopy images of wild-type and elo1∆ mutant cells cultivated in SC medium containing lauric acid (C12:0, 2 mM) or palmitic acid (C16:0, 2 mM) for the indicated period of time. Cells were stained with BODIPY and visualized by fluorescence microscopy. Lipid droplets (LDs) are indicated by blue arrowheads and ER stained with BODIPY is marked by purple arrows. Scale bar, 5 µM. (C and D) Quantification of BODIPY fluorescence of LD and cellular membranes (n = 50). Values represent fluorescent intensity relative to total cellular fluorescence. Asterisks denote statistical significance (Student’s t-test, *p < 0.05, ***p < 0.001), n.s., non-significant.
Videos
Video 1
Triglyceride (TG) lens dissolution in a DOPC bilayer.
The concentration of TG is below (<1%) the calculated ‘free TG’ threshold in a DOPC bilayer (1.1 ± 0.1%).
Tables
Key resources table
| Reagent type (species) or resource | Designation | Source or reference | Identifiers | Additional information |
|---|---|---|---|---|
| Strain, strain background (S. cerevisiae) | BY4741 | Euroscarf | RRID: SCR_003093 | Mata, his3∆1, leu2∆0, met15∆0, ura3∆0. |
| Chemical compound, drug | Palmitic acid | Sigma-Aldrich | P0500 RRID:SCR_008988 | 2 mM |
| Chemical compound, drug | Palmitoleic acid | Sigma-Aldrich | P9417 RRID:SCR_008988 | 2 mM |
| Chemical compound, drug | Lauric acid | Sigma-Aldrich | 8053330100 RRID:SCR_008988 | 2 mM |
| Chemical compound, drug | Brij58 | Sigma-Aldrich | P5884 RRID:SCR_008988 | 1% |
| Software, algorithm | VisiView | Visitron systems GMBH | 4.2.0 | |
| Software, algorithm | ImageJ | https://imagej.nih.gov/ij/ | RRID:SCR_003070 | Schneider et al., 2012 |
| Software, algorithm | Photoshop | Adobe, Mountain View | RRID:SCR_014199 | |
| Software, algorithm | LAMMPS | https://lammps.sandia.gov | RRID:SCR_015240 | MD simulations software |
| Software, algorithm | GROMACS | http://www.gromacs.org | RRID:SCR_014565 | MD simulations software |
| Software, algorithm | VMD | http://www.ks.uiuc.edu/Research/vmd/ | RRID:SCR_001820 | |
| Other | BODIPY493/503 stain | Invitrogen | D3922 RRID:SCR_008988 | 1 µg/mL |
Table 1
List of all the molecular dynamics (MD) setups, with bilayer composition, number of triglyceride (TG) molecules, number of replicas, and length of simulations.
| TG lenses formation | ||||
|---|---|---|---|---|
| System | Bilayer composition (no. of molecules) | No. of TG | No. of replicas | Length (μs) |
| 100% DOPC | 3200 DOPC | 64 | 3 | 1.5 |
| 3200 DOPC | 128 | 3 | 1.5 | |
| 3200 DOPC | 192 | 3 | <1.5 | |
| 3200 DOPC | 256 | 3 | <1.5 | |
| 3200 DOPC | 320 | 3 | <1.5 | |
| +60 mol% POPC | 1280 DOPC + 1920 POPC | 64 | 3 | 1.5 |
| 1280 DOPC + 1920 POPC | 128 | 3 | 1.5 | |
| 1280 DOPC + 1920 POPC | 192 | 3 | <1.5 | |
| 1280 DOPC + 1920 POPC | 256 | 3 | <1.5 | |
| 1280 DOPC + 1920 POPC | 320 | 3 | <1.5 | |
| + 60 mol% DPPC | 1280 DOPC + 1920 DPPC | 64 | 3 | 1.5 |
| 1280 DOPC + 1920 DPPC | 128 | 3 | 1.5 | |
| 1280 DOPC + 1920 DPPC | 192 | 3 | <1.5 | |
| 1280 DOPC + 1920 DPPC | 256 | 3 | <1.5 | |
| 1280 DOPC + 1920 DPPC | 320 | 3 | <1.5 | |
| + 60 mol% DLPC | 1280 DOPC + 1920 DLPC | 64 | 3 | 1.5 |
| 1280 DOPC + 1920 DLPC | 128 | 3 | 1.5 | |
| 1280 DOPC + 1920 DLPC | 192 | 3 | 1.5 | |
| 1280 DOPC + 1920 DLPC | 256 | 3 | <1.5 | |
| 1280 DOPC + 1920 DLPC | 320 | 3 | <1.5 | |
| + 60 mol% DOPE | 1280 DOPC + 1920 DOPE | 64 | 3 | 1.5 |
| 1280 DOPC + 1920 DOPE | 128 | 3 | <1.5 | |
| 1280 DOPC + 1920 DOPE | 192 | 3 | <1.5 | |
| 1280 DOPC + 1920 DOPE | 256 | 3 | <1.5 | |
| 1280 DOPC + 1920 DOPE | 320 | 3 | <1.5 | |
| +30 mol% DOPE | 2240 DOPC + 960 DOPE | 64 | 3 | 1.5 |
| 2240 DOPC + 960 DOPE | 128 | 3 | 1.5 | |
| 2240 DOPC + 960 DOPE | 192 | 3 | <1.5 | |
| 2240 DOPC + 960 DOPE | 256 | 3 | <1.5 | |
| 2240 DOPC + 960 DOPE | 320 | 3 | <1.5 | |
| + 60 mol% DLPE | 1280 DOPC + 1920 DLPE | 64 | 3 | 1.5 |
| 1280 DOPC + 1920 DLPE | 128 | 3 | <1.5 | |
| 1280 DOPC + 1920 DLPE | 192 | 3 | <1.5 | |
| 1280 DOPC + 1920 DLPE | 256 | 3 | <1.5 | |
| 1280 DOPC + 1920 DLPE | 320 | 3 | <1.5 | |
| +10 mol% Diacylglycerol (DAG) | 2880 DOPC + 320 DAG | 64 | 3 | 1.5 |
| 2880 DOPC + 320 DAG | 128 | 3 | <1.5 | |
| 2880 DOPC + 320 DAG | 192 | 3 | <1.5 | |
| 2880 DOPC + 320 DAG | 256 | 3 | <1.5 | |
| 2880 DOPC + 320 DAG | 320 | 3 | <1.5 | |
| +20 mol% DAG | 2560 DOPC + 640 DAG | 64 | 3 | 1.5 |
| 2560 DOPC + 640 DAG | 128 | 3 | <1.5 | |
| 2560 DOPC + 640 DAG | 192 | 3 | <1.5 | |
| 2560 DOPC + 640 DAG | 256 | 3 | <1.5 | |
| 2560 DOPC + 640 DAG | 320 | 3 | <1.5 | |
| +10 mol% CHOL | 2880 DOPC + 320 CHOL | 64 | 3 | 1.5 |
| 2880 DOPC + 320 CHOL | 128 | 3 | <1.5 | |
| 2880 DOPC + 320 CHOL | 192 | 3 | <1.5 | |
| 2880 DOPC + 320 CHOL | 256 | 3 | <1.5 | |
| 2880 DOPC + 320 CHOL | 320 | 3 | <1.5 | |
| +20 mol% CHOL | 2560 DOPC + 640 CHOL | 64 | 3 | 1.5 |
| 2560 DOPC + 640 CHOL | 128 | 3 | <1.5 | |
| 2560 DOPC + 640 CHOL | 192 | 3 | <1.5 | |
| 2560 DOPC + 640 CHOL | 256 | 3 | <1.5 | |
| 2560 DOPC + 640 CHOL | 320 | 3 | <1.5 | |
| Endoplasmic reticulum (ER) like | 1856 DOPC + 960 DOPE + 192 CHOL + 192 DAG | 64 | 3 | 1.5 |
| 1856 DOPC + 960 DOPE + 192 CHOL + 192 DAG | 128 | 3 | <1.5 | |
| 1856 DOPC + 960 DOPE + 192 CHOL + 192 DAG | 192 | 3 | <1.5 | |
| 1856 DOPC + 960 DOPE + 192 CHOL + 192 DAG | 256 | 3 | <1.5 | |
| 1856 DOPC + 960 DOPE + 192 CHOL + 192 DAG | 320 | 3 | <1.5 | |
| Calculation of ‘free TG’ | ||||
| 100% DOPC | 6050 DOPC | 1836 | 2 | 3 |
| + 60 mol% POPC | 2420 DOPC + 3630 POPC | 1836 | 2 | 3 |
| + 60 mol% DPPC | 2420 DOPC + 3630 DPPC | 1836 | 2 | 3 |
| + 60 mol% DLPC | 2420 DOPC + 3630 DLPC | 1836 | 2 | 3 |
| + 60 mol% DOPE | 2420 DOPC + 3630 DOPE | 1836 | 2 | 3 |
| + 30 mol% DOPE | 4235 DOPC + 1815 DOPE | 1836 | 2 | 3 |
| + 60 mol% DLPE | 2420 DOPC + 3630 DLPE | 1836 | 2 | 3 |
| +10 mol% DAG | 5445 DOPC + 605 DAG | 1836 | 2 | 3 |
| ER like | 3509 DOPC + 1815 DOPE + 363 DAG + 363 CHOL | 1836 | 2 | 3 |
| +20 mol% DAG | 4840 DOPC + 1210 DAG | 1836 | 2 | 3 |
| +10 mol% CHOL | 5445 DOPC + 605 CHOL | 1836 | 2 | 3 |
| +20 mol% CHOL | 4840 DOPC + 1210 CHOL | 1836 | 2 | 3 |
| Insertion of TG | 6050 DOPC | 1934 | 2 | 3 |
| Different sizes | 11,250 DOPC | 1836 | 2 | 3 |
| 11,250 DOPC | 5508 | 2 | 3 | |
| 11,250 DOPC | 9180 | 2 | 3 | |
| 16,200 DOPC | 13,665 | 2 | 3 | |
| Dissolution | ||||
| Dissolution | 6050 DOPC | 50 | 1 | 0.8 |
| Effect of saturation in TG chains | ||||
| DOPC+TOOP | 6050 DOPC | 1836 TOOP | 2 | 3 |
| DOPC+TOPP | 6050 DOPC | 1836 TOPP | 2 | 3 |
| Lateral pressure profile | ||||
| DOPC | 3200 | 0 | 3 | 0.2 |
| +10 mol% CHOL | 2880 DOPC + 320 CHOL | 0 | 3 | 0.2 |
| +20 mol% DAG | 2560 DOPC + 640 DAG | 0 | 3 | 0.2 |
| +10 mol% DAG | 2880 DOPC + 320 DAG | 0 | 3 | 0.2 |
| +30 mol% DOPE | 2240 DOPC + 960 DOPE | 0 | 3 | 0.2 |
| +20 mol% DOPE | 2560 DOPC + 640 DOPE | 0 | 3 | 0.2 |
| +60 mol% DLPC | 1280 DOPC + 1920 DLPC | 0 | 3 | 0.2 |
| +60 mol% DLPE | 1280 DOPC + 1920 DLPE | 0 | 3 | 0.2 |
| +60 mol% DPPC | 1280 DOPC + 1920 DPPC | 0 | 3 | 0.2 |
Additional files
-
Supplementary file 1
Additional information.
Supplementary table 1. Non-bonded parameters derived for this study. Supplementary table 2. Calculated values of πCH for each bilayer composition and the relative percentage change with respect to the composition ‘100% DOPC’. Supplementary table 3. Calculated values of κb for each bilayer composition with two different methods: from the real-space analysis of the instantaneous surface deformations (κb ReSIS) and from the Fourier-space analysis of the membrane fluctuations (κb Fluct). Supplementary table 4: S. cerevisiae strains used in this study.
- https://cdn.elifesciences.org/articles/62886/elife-62886-supp1-v2.docx
-
Transparent reporting form
- https://cdn.elifesciences.org/articles/62886/elife-62886-transrepform-v2.docx
Download links
A two-part list of links to download the article, or parts of the article, in various formats.
Downloads (link to download the article as PDF)
Open citations (links to open the citations from this article in various online reference manager services)
Cite this article (links to download the citations from this article in formats compatible with various reference manager tools)
Pre-existing bilayer stresses modulate triglyceride accumulation in the ER versus lipid droplets
eLife 10:e62886.
https://doi.org/10.7554/eLife.62886


