A transcriptomic taxonomy of Drosophila circadian neurons around the clock
- Howard Hughes Medical Institute, Brandeis University, United States
- Howard Hughes Medical Institute, Janelia Research Campus, United States
Figures
Figure 1 with 1 supplement
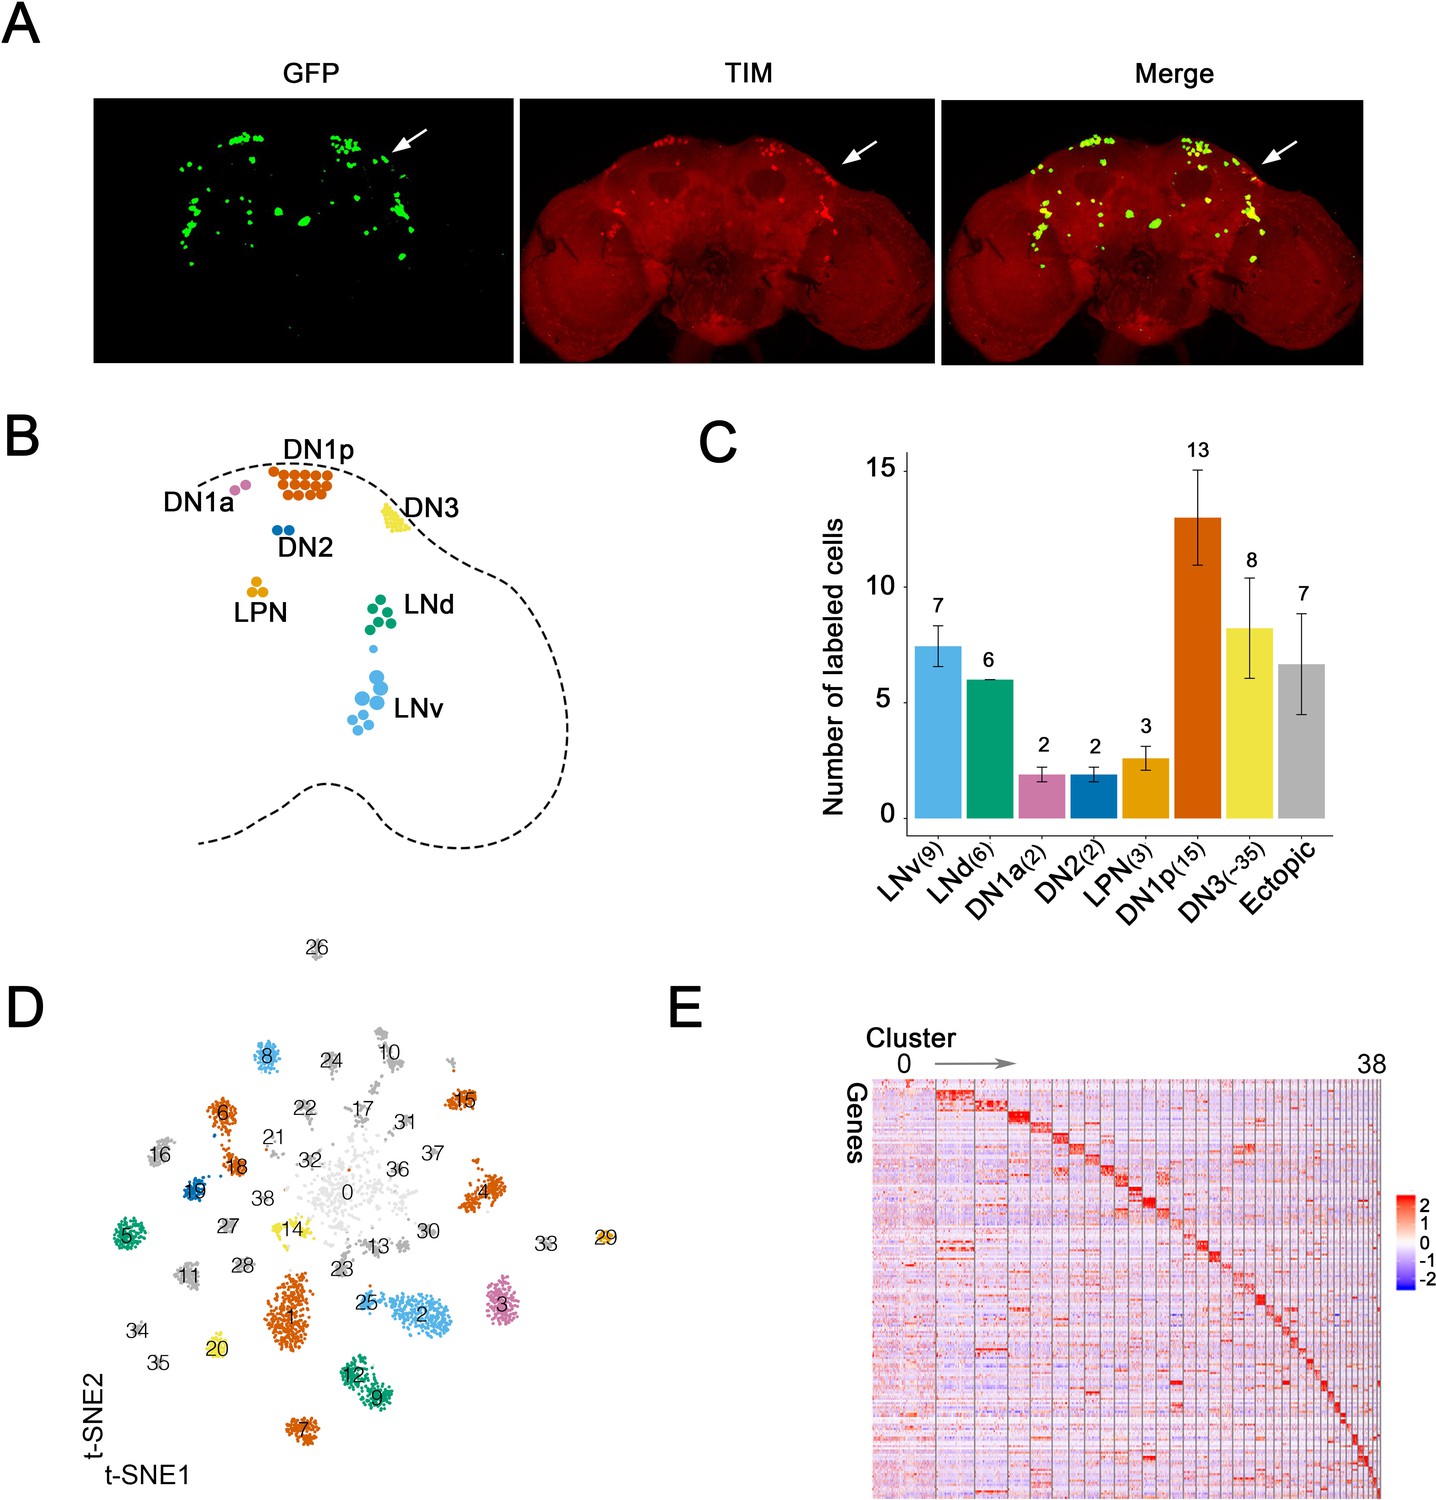
Single-cell RNA sequencing of Drosophila clock neurons around the clock.
(A) Confocal stack images of immunostained brains from Clk856-GAL4 > UAS-Stinger-GFP flies at ZT18. Anti-GFP (left), anti-TIM (middle) and a merge of these two images (right). The arrow indicates the DN3 neurons. (B) Schematic depiction of clock neurons in an adult Drosophila brain. The core clock network consists of about 150 lateral and dorsal neurons, they are subdivided into different groups based on anatomy. (C) Quantification of the neurons labeled by Clk856-GAL4 as shown in (A). The number on top of the bars represent the number neurons that were observed to be GFP- and TIM-positive (clock neuron subgroups) or just GFP-positive (ectopic neurons). The numbers indicated in the x-axis labels reflect the number of each type of neuron that is found in one hemisphere of an adult fly brain. Nearly, all neurons in the clock network are labeled by the Clk856-GAL4 driver with the exception of some of the DN3s. (D) Visualization of Drosophila clock neuron clusters on the t-Distributed stochastic neighbor embedding (t-SNE) plot. Each dot represents a cell and they are color-coded by major anatomy groups. Thirty-nine different clusters were found. Clustering contains all cells: both light:dark (LD) and constant darkness (DD) conditions at all timepoints. (E) Each neuron cluster is defined by a set of highly differentially expressed genes. The heatmap showing the expression levels of the top differentially expressed genes (rows) in cells (columns). Clusters are ordered by size: cluster 0 on the left and cluster 38 on the right. Expression is indicated by Z score of ln (TP10K+1); red indicates high expression and blue indicates low expression.
Figure 1—figure supplement 1
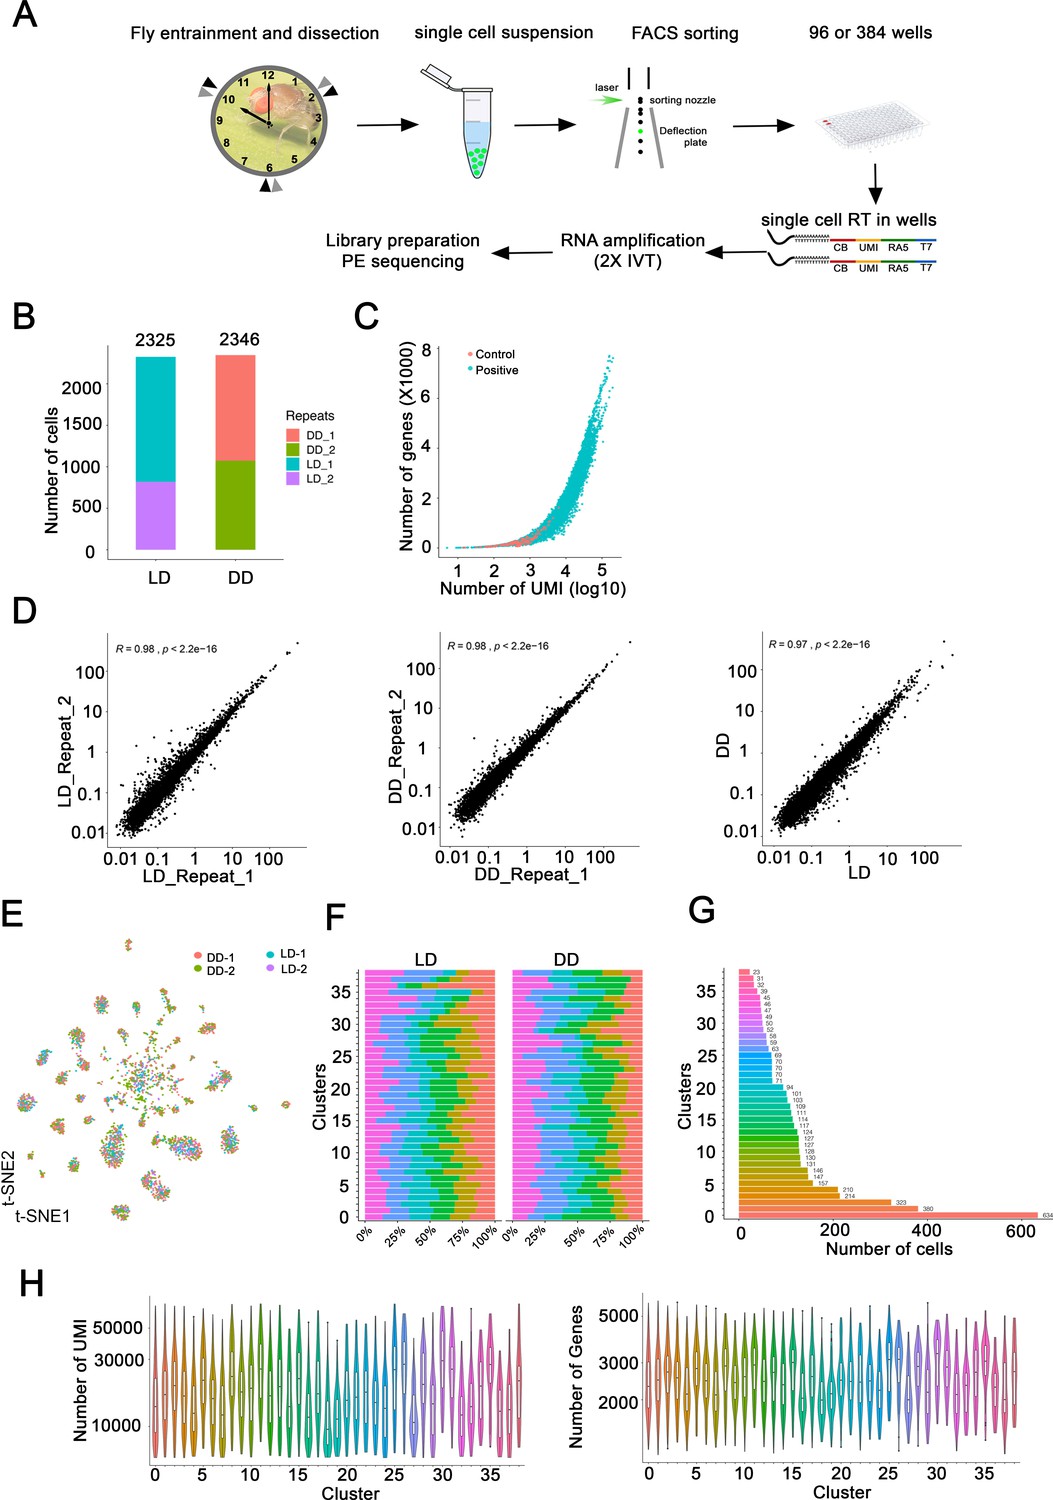
Methods and verification of single-cell RNA sequencing of Drosophila clock neurons.
(A) Schematic of single-cell RNA-seq protocol. The method is based on CEL-Seq2 with some modifications. EGFP-labeled clock neurons were sorted into 96- or 384-well plates by fluorescence-activated cell sorting (FACS). CEL-Seq2 primers and two rounds in vitro transcriptions were used to amplify the polyA-tailed mRNA. (B) The number of single cells isolated in each light:dark (LD) and constant darkness (DD) experiments. Two experiments were performed at each condition. (C) Thousands of genes with multiple UMIs each were identified in most single cells. The number of UMIs (x-axis; log10) per gene (y-axis, X1000) in single cells (blue) or negative control wells (red; no cell added) is plotted. Two empty negative control wells were used in each plate assayed. Negative control wells have no or very few genes been detected. (D) Gene expression correlation between replicates and conditions. Comparisons between two LD experiments (left panel), two DD experiments (middle panel), between one LD and one DD experiment (right panel) are shown. The cells collected in two replicates and conditions were pooled and further analyzed as pseudo-bulk samples. (E) t-SNE plot of all single cells from four separate experiments illustrates that each cluster contains a mix of cells from each experiment. Two LD and two DD experiments were co-clustered in each cluster, each dot represents a single cell and colored by repeats. Two independent DD experiments are shown in pink and green. Two independent LD experiments are show in blue and purple. (F) Bar plots showing the percentage of cells in that cluster that come from each of the six timepoints collected. Each cluster has relatively similar numbers of cells from each of the timepoints in both LD and DD experiments. (G) The number of single cells assigned to each cluster. This includes cells from all timepoints in both LD and DD conditions. (H) Violin plots showing the number of detected UMIs and genes in each cluster. Each cluster has relatively similar numbers of genes and UMIs. Numbers on the x-axis represent 39 clusters.
Figure 2 with 1 supplement
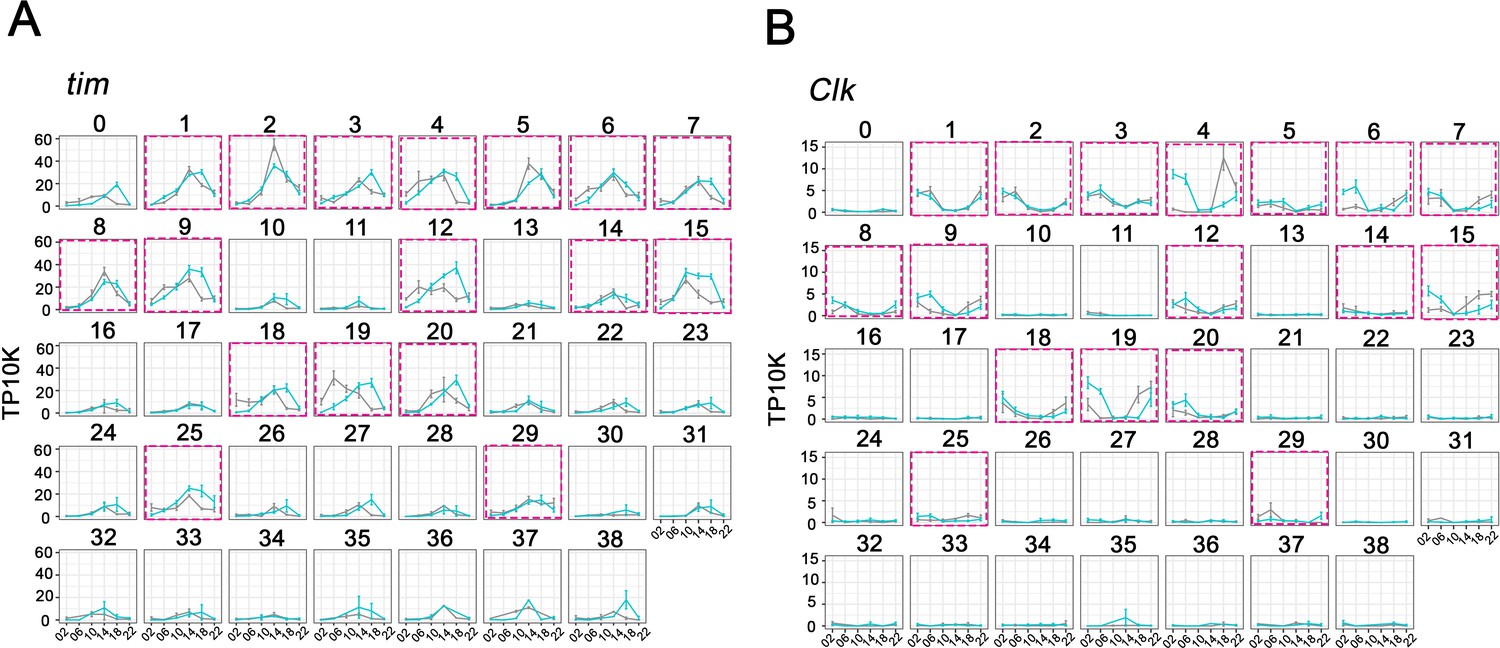
Cycling timeless (tim) expression and Clock (Clk) abundance defines key circadian neuron clusters.
(A–B) The mean tim expression (A) and Clk (B) throughout the day in light: dark (LD) and constant darkness (DD) conditions is graphed for each cluster. Seventeen clusters were chosen as high confidence clusters based on robust core clock genes expression (purple boxes). X axis indicates the time points in LD and DD. Error bars represent mean ± SEM. Cyan and gray lines indicate the gene expression in LD and DD conditions, respectively.
Figure 2—figure supplement 1
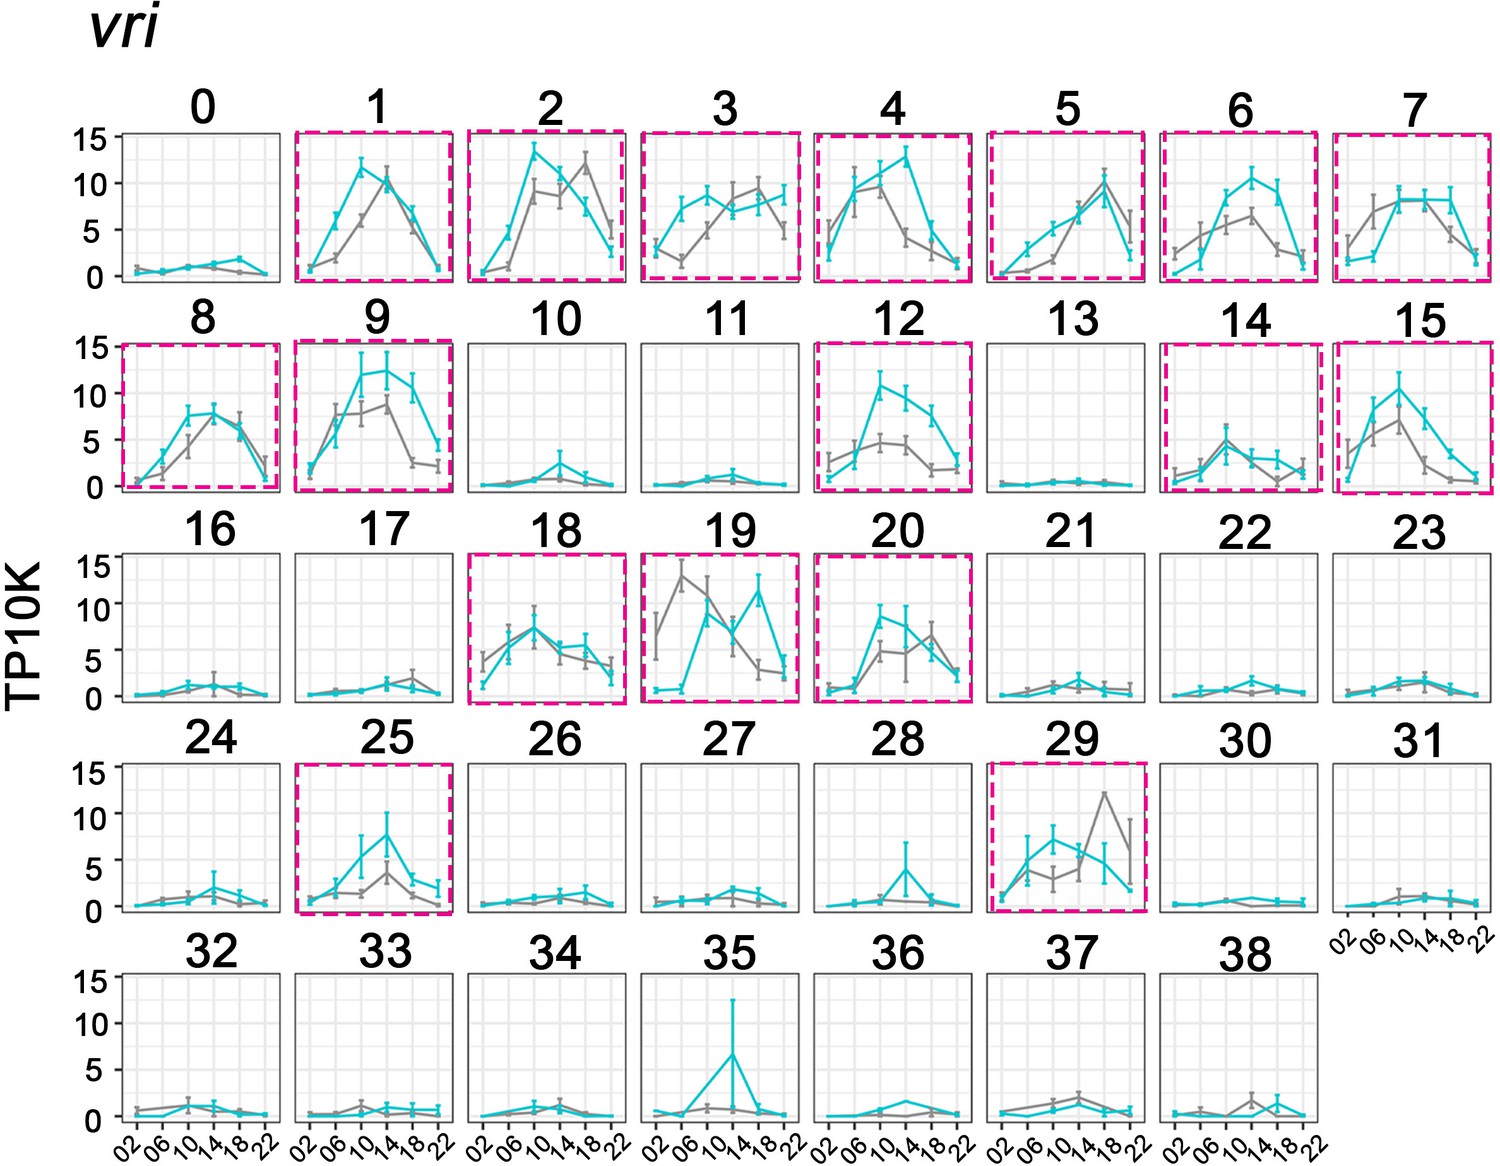
Cycling vrille (vri) expression helps to define key circadian neuron clusters.
The mean vri expression throughout the day in light:dark (LD) and constant darkness (DD) conditions is graphed for each cluster. vri expression in high confidence clusters are labeled with purple boxes. X axis indicates the time points in LD and DD. Error bars represent mean ± SEM. Cyan and gray lines indicate the gene expression in LD and DD conditions, respectively.
Figure 3 with 1 supplement
Identification of the lateral neuron clusters: LNvs and LNds.
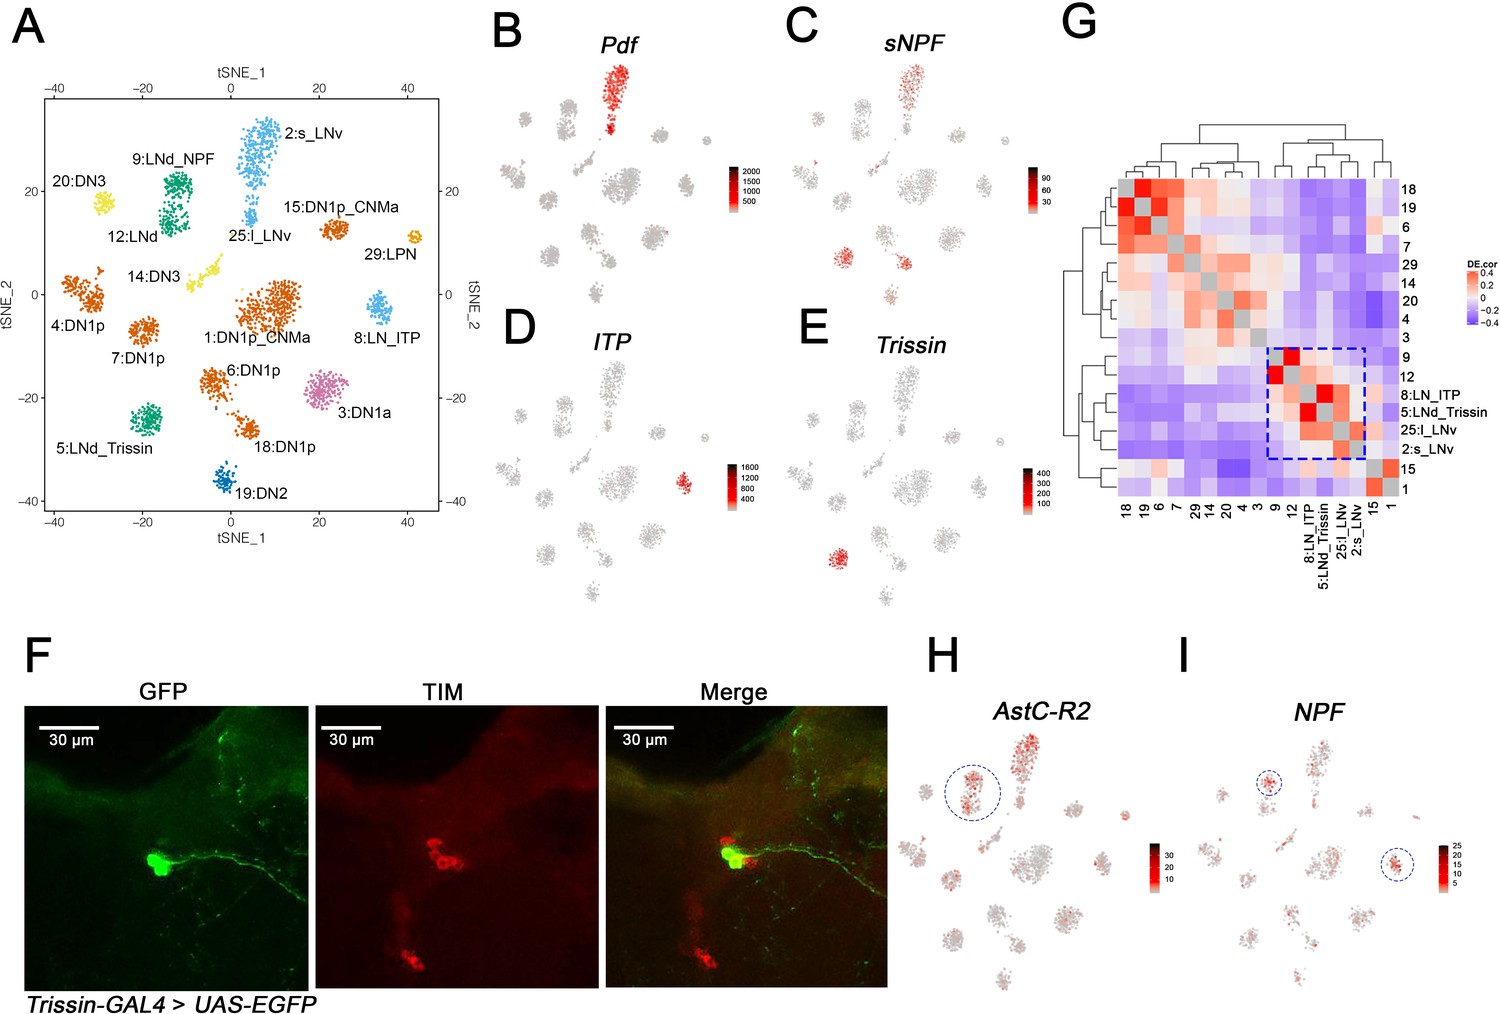
(A) Seventeen Drosophila clock neuron clusters. t-SNE visualization of 2615 clock neurons from both light:dark (LD) and constant darkness (DD). Each cluster retains its original identifying number (as in Figure 1D), and the anatomical cluster to which it was assigned is added to its name. The clusters are colored by their major anatomy groups. (B–E) t-SNE plots showing key lateral neuron marker genes expression: Pdf (B), sNPF (C), ITP (D) and Trissin (E). Red indicates higher expression (color bar, TP10K), LD and DD data are plotted together. (F) Confocal stack images from Trissin-GAL4 > UAS-EGFP adult fly brains stained with GFP and TIM antibodies. GFP (left), TIM (middle), and a merge of these two images (right). Only two neurons in the clock network were identified using the Trissin-GAL4 knock-in line. (G) Gene expression correlation of the identified clock neuron clusters. (H–I) t-SNE plots showing key lateral neuron marker genes expression: AstC-R2 (H) and NPF (I). Red indicates higher expression (color bar, TP10K). AstC-R2 expression is from LD and DD together, NPF expression is from LD condition only.
Figure 3—figure supplement 1

Identification of two Trissin-expressiong LNd neurons.
Confocal stack of images showing antibody staining for GFP and TIM in Trissin-LexA > LexAop-FLP; Clk856-GAL4 > UAS-FRT-STOP-FRT-Cschrimson.venus fly brains. GFP (left), TIM (middle), and a merge of these two images (right). Only two LNds neurons in the clock network express Trissin.
Figure 4 with 1 supplement
Mapping the dorsal and lateral posterior neuron (LPN) clock neurons.
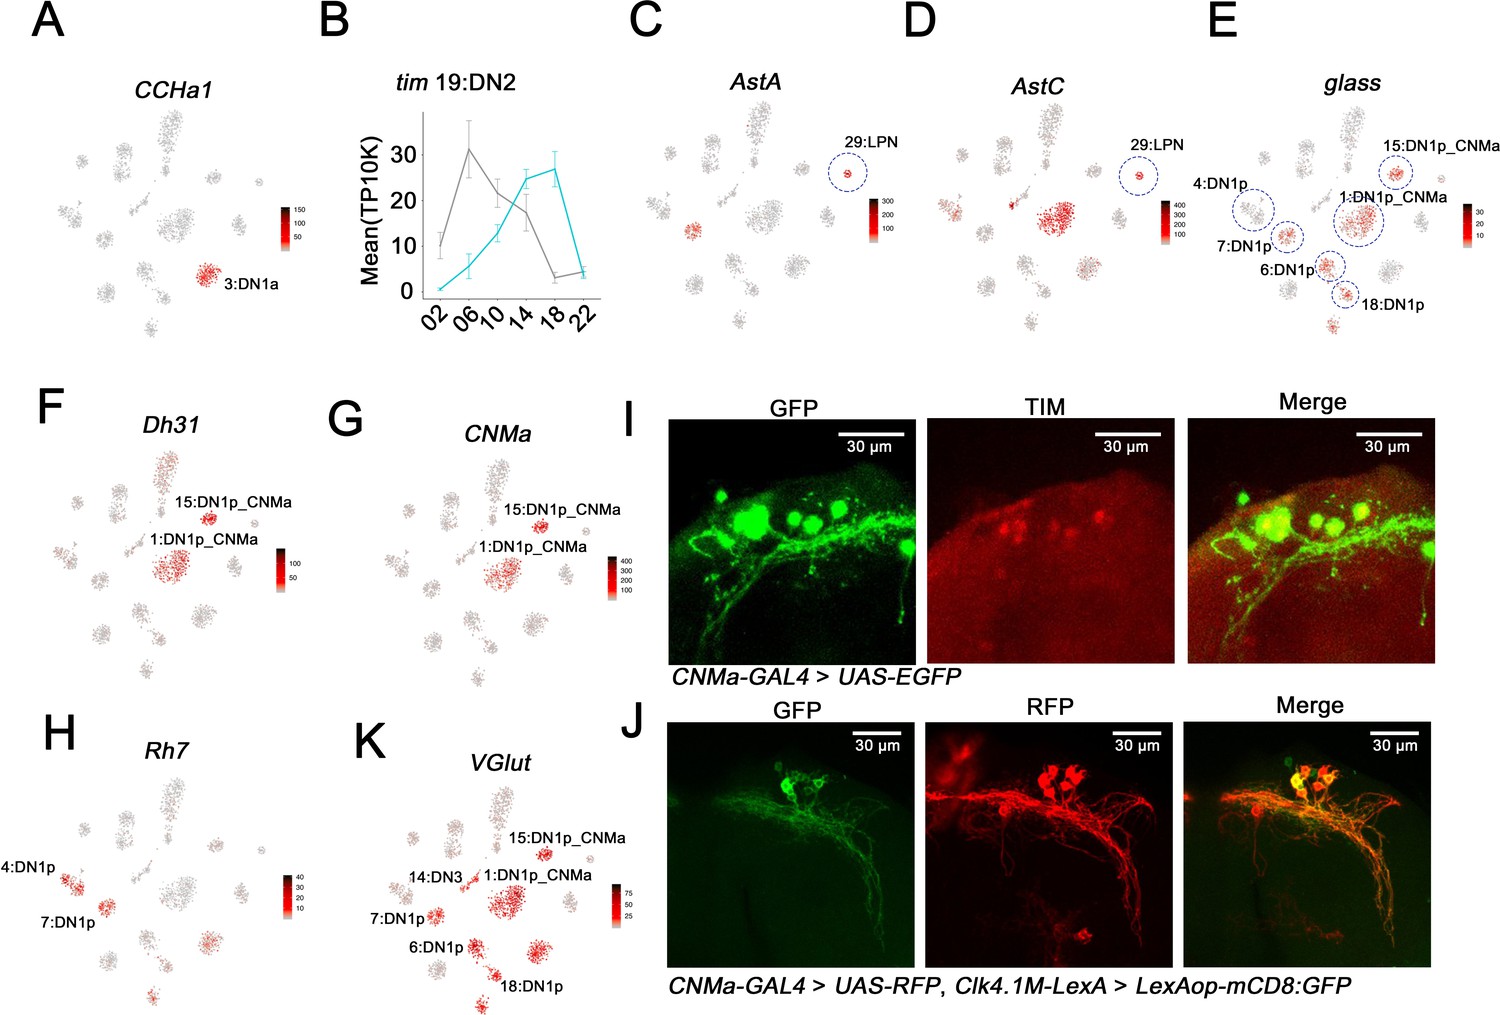
(A) t-SNE plots showing CCHa1 expression. Red indicates higher expression (color bar, TP10K). Light:dark (LD) and constant darkness (DD) data are plotted together. CCHa1 expression is specific to cluster 3 and thus identifies the DN1a neurons. (B) tim expression in cluster 19 in LD and DD conditions. The phase of tim cycling shifts in DD to be approximately antiphase to LD cycling. DN2s assigned to Cluster 19. Error bars represent mean ± SEM. Cyan and gray lines indicate the gene expression in LD and DD conditions, respectively. (C–D) t-SNE plot showing AstA (C) and AstC (D) expression. Red indicates higher expression (color bar, TP10K). LD and DD data are plotted together. The LPN cluster is highlighted by the blue circle. (E–H) t-SNE plot showing glass (E), Dh31 (F), CNMa (G), and Rh7 (H) expression. Red indicates higher expression (color bar, TP10K); LD and DD data are plotted together. The identified DN1p neuron clusters are highlighted by blue circles showing in (E). (I) Confocal stack of images showing antibody staining for GFP (left) and TIM (middle) and the merge (right) in the dorsal brain of CNMa-GAL4 > UAS-EGFP flies. (J) Confocal stack of images showing antibody staining for GFP (left) and RFP (middle) and the merge (right) in the dorsal brain of Clk4.1M-LexA > LexAop-mCD8: GFP; CNMa-GAL4 > UAS-RFP flies. (K) t-SNE plot showing VGlut expression. Red indicates higher expression (color bar, TP10K), LD and DD data are plotted together.
Figure 4—figure supplement 1

Mapping the dorsal clock neurons.
(A) Confocal stack of images showing antibody staining for GFP (top) and TIM (middle) and the merge (bottom) in CCHa1-LexA > LexAop-FLP; Clk856-GAL4 > UAS-FRT-STOP-FRT-Cschrimson.venus fly brains. Only two clock neurons are GFP- and TIM-positive indicating two CCHa1-positive neurons in the clock network. (B) Confocal stack of images showing antibody staining for GFP (top), PER (second panel), PDF (third panel), and the merge (bottom) in R14F03-p65.AD, VT029514-GAL4.DBD > UAS-EGFP fly brains. R14F03-p65.AD (period AD fusion) VT029514-GAL4.DBD (Rh7 DNA-binding domain fusion). (C) Confocal stack of images showing antibody staining for GFP (top), PER (second panel), PDF (third panel), and the merge (bottom) in R18H11-p65.AD, R51H05-GAL4.DBD > UAS-EGFP fly brains. R18H11-p65.AD (Pdfr AD fusion) R51H05-GAL4.DBD (VGlut DNA-binding domain fusion). (D) A summary table showing number of cells from light:dark (LD) and constant darkness (DD) conditions in each DN1p clusters. The marker genes that were used to annotate the clusters are listed in the last column.
Figure 5 with 1 supplement
Enriched transcripts in identified clock neuron clusters.
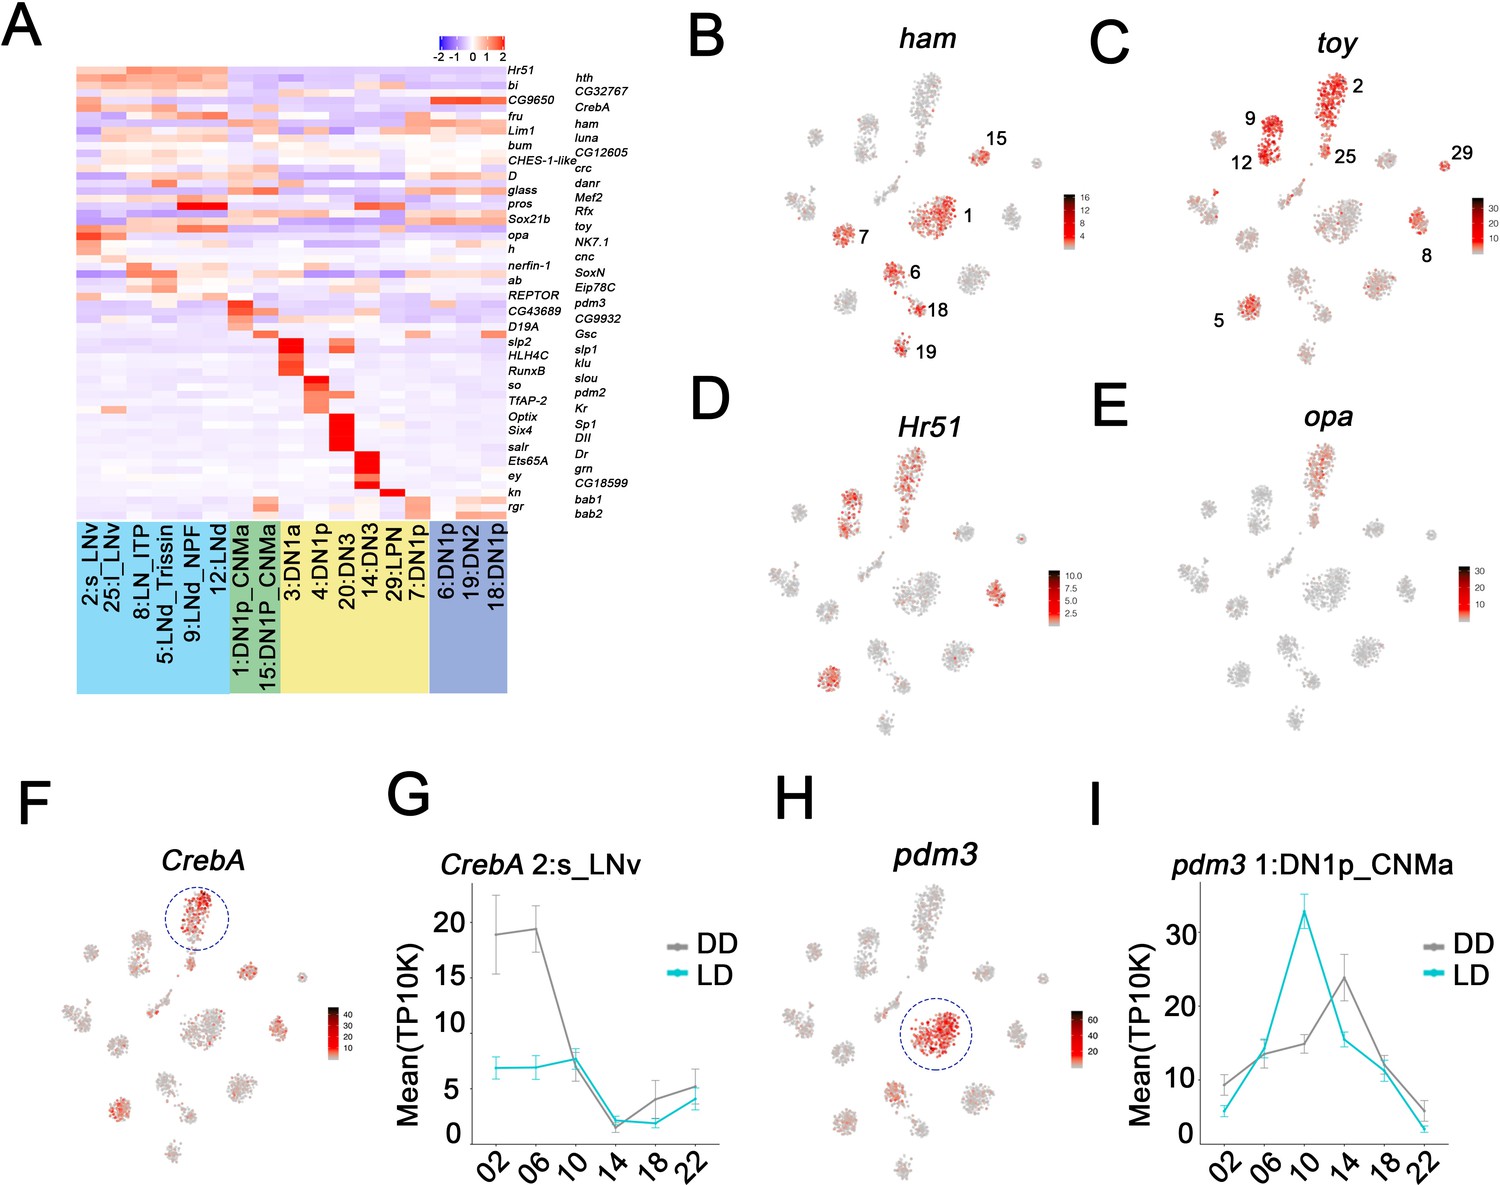
(A) Heatmap showing the enriched transcription factors expression in each cluster. (B–E) t-SNE plot showing ham (B), toy (C), Hr51 (D), and opa (E) expression in clock neurons. Red indicates higher expression (color bar, TP10K). (F) t-SNE plot showing CrebA expression in clock neurons. Red indicates higher expression (color bar, TP10K). (G) Mean CrebA expression in 2:s_LNv neurons throughout the day in light:dark (LD) and constant darkness (DD) conditions. Error bars represent mean ± SEM. Cyan and gray lines indicate the gene expression in LD and DD conditions, respectively. (H) t-SNE plot showing pdm3 expression in clock neurons. Red indicates higher expression (color bar, TP10K). (I) Mean pdm3 expression in 1:DN1p_CNMa neurons at different times in LD and DD conditions. Error bars represent mean ± SEM. Cyan and gray lines indicate the gene expression in LD and DD conditions, respectively.
Figure 5—figure supplement 1
Enriched transcripts in identified clock neuron clusters.
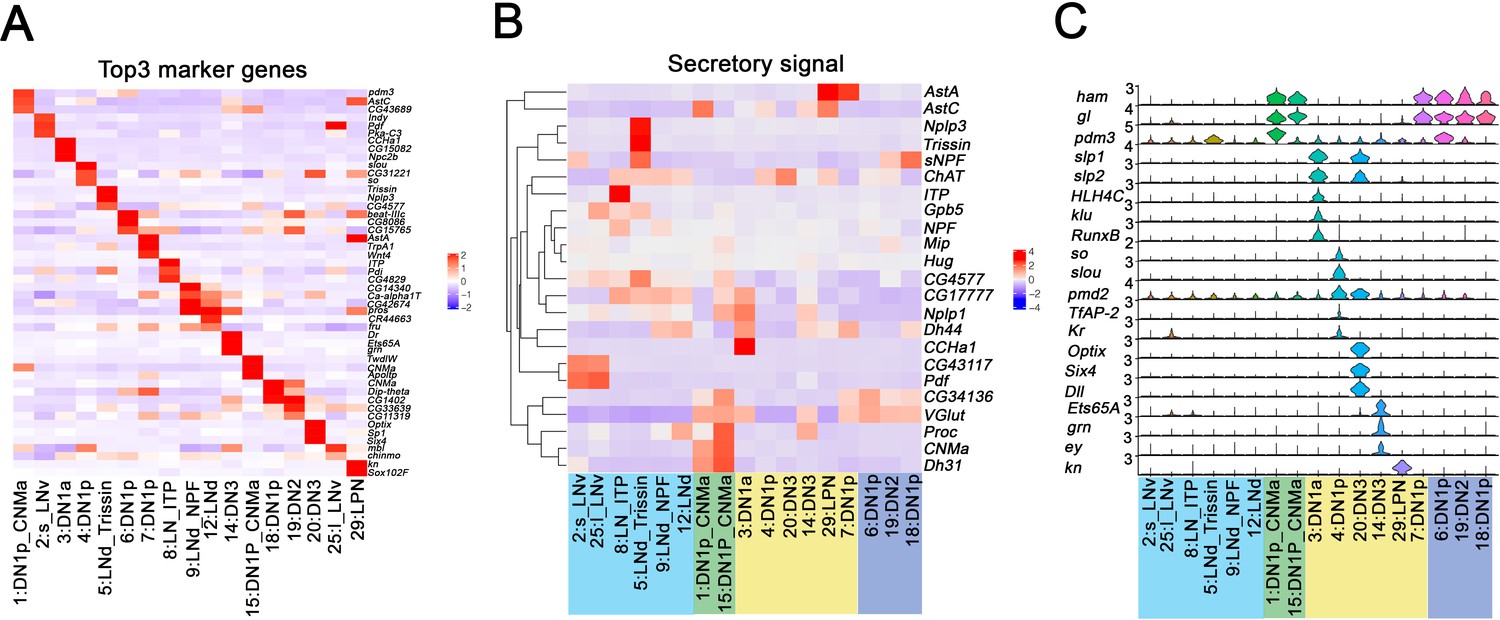
(A) Heatmap showing the enriched marker genes expression in each cluster. (B) Heatmap showing the enriched secretory gene expression in each cluster. (C) Violin plot showing the expression of DN1p- and LPN-enriched transcription factors. Light:dark (LD) and constant darkness (DD) data are plotted together, the y axis represents log normalized gene expression level.
Figure 6 with 1 supplement
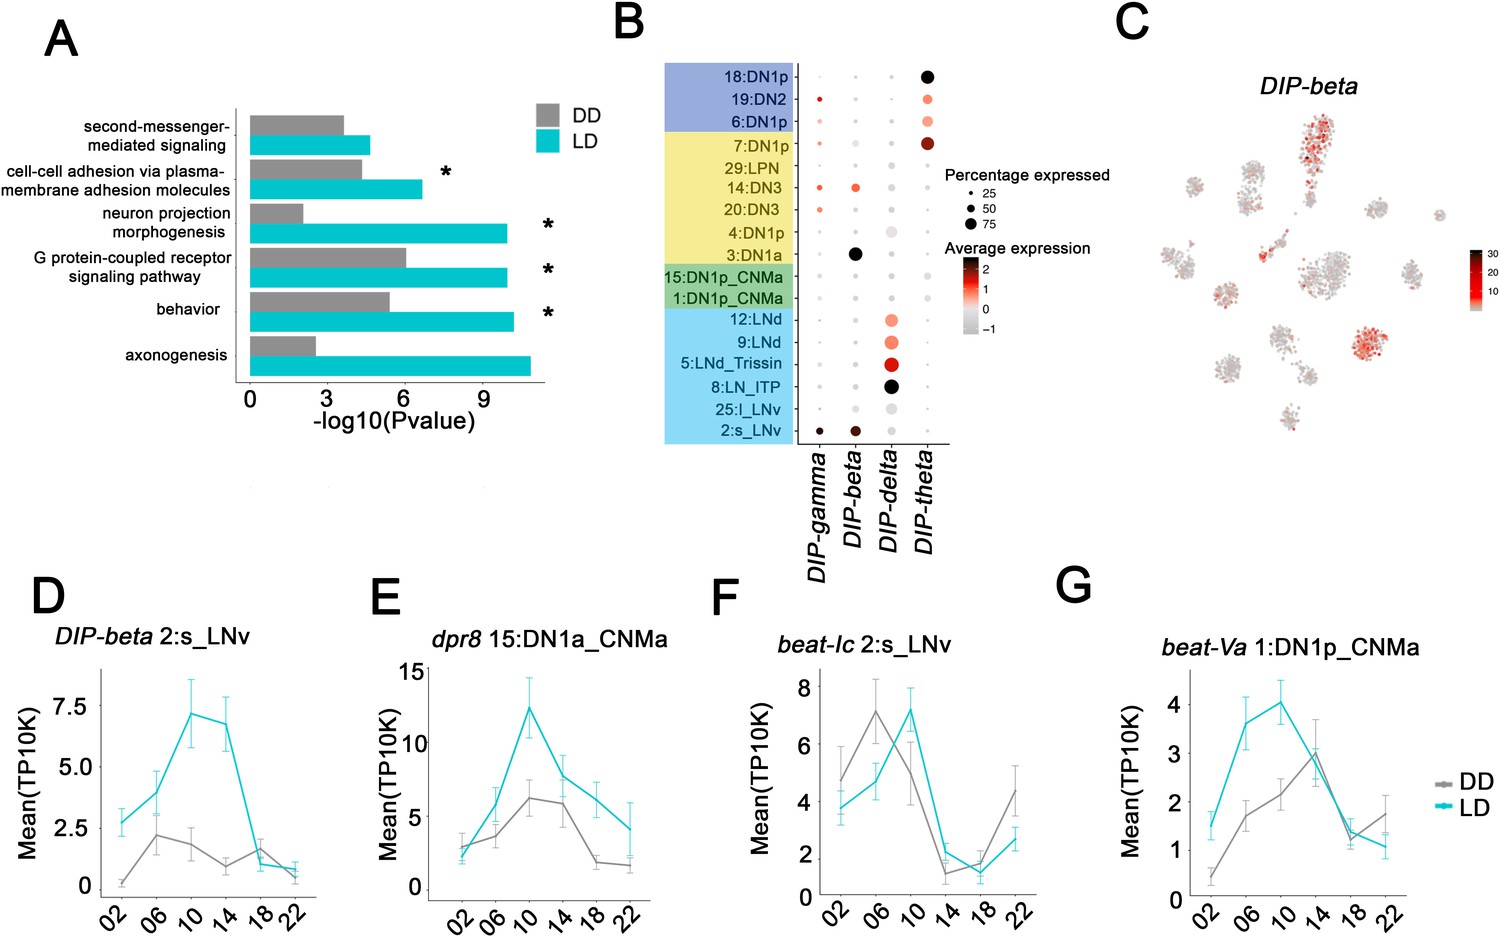
Neuron-specific cycling gene expression.
(A) Gene ontology (GO) analysis of the all the cycling genes found in all the clock neuron clusters. GO terms that were also identified in cluster-specific GO term analysis are indicated by asterisks. (B) Dot plot showing the Dpr interacting protein (DIP) family gene expression in clock neuron clusters. Size of dot indicates what percentage of cells in a particular cluster that express the indicated DIP-family member. Color indicates the mean expression within that cluster. (C) t-SNE plot showing DIP-beta expression in clock neurons. Red indicates higher expression (color bar, TP10K). (D–G) Mean cell-cell adhesion gene expression throughout the day in different neuron clusters. DIP-beta expression in 2:s_LNv (D), dpr8 expression in 15:DN1p_CNMa (E), beat-Ic expression in 2:s_LNv (F) and beat-Va expression in 1:DN1p_CNMa (G). Error bars represent mean ± SEM. Average gene expression shown in constant darkness (DD) (gray) and light:dark (LD; cyan).
Figure 6—figure supplement 1
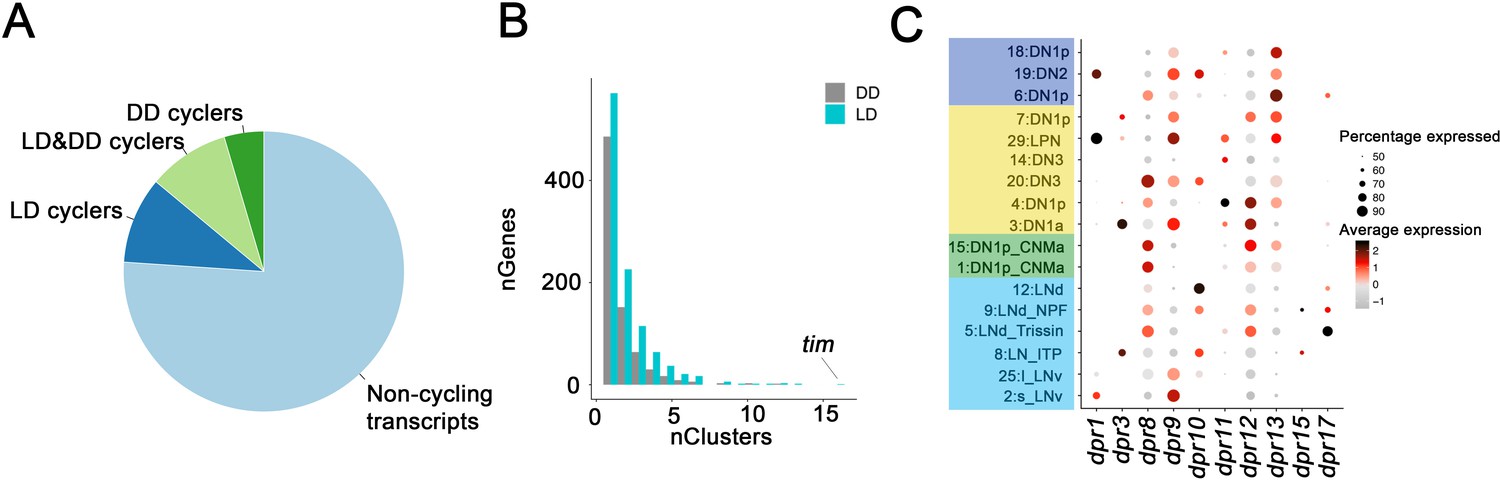
Oscillating transcripts in Drosophila clock neurons.
(A) Pie chart of cycling transcripts in clock neurons in light:dark (LD) and constant darkness (DD) conditions. (B) Most cycling transcripts are specific to one or two clock neuron clusters. Bar graph shows how many transcripts were identified in 1, 2, 3, etc. clock neuron clusters. Only the core clock gene, tim, was found to be cycling in all 17 clusters. (C) Dot plot showing the gene expression of dpr family gene expression in clock neuron clusters. The size of the dot indicates what percentage of cells in a particular cluster that express the indicated Dpr interacting protein (DIP)-family member. Color indicates the mean expression within that cluster.
Tables
Key resources table
| Reagent type (species) or resource | Designation | Source or reference | Identifiers | Additional information |
|---|---|---|---|---|
| Genetic reagent (D. melanogaster) | UAS-Stinger | BDSC | RRID:BDSC_84277 | |
| Genetic reagent (D. melanogaster) | R14F03-p65.AD | BDSC | RRID:BDSC_70551 | |
| Genetic reagent (D. melanogaster) | VT029514-GAL4.DBD | BDSC | RRID:BDSC_75062 | |
| Genetic reagent (D. melanogaster) | R18H11-p65.AD | BDSC | RRID:BDSC_68852 | |
| Genetic reagent (D. melanogaster) | R51H05-GAL4.DBD | BDSC | RRID:BDSC_69036 | |
| Genetic reagent (D. melanogaster) | P{10XUAS-IVS-myr::GFP}attP2 | BDSC | RRID:BDSC_32197 | |
| Genetic reagent (D. melanogaster) | Clk856-GAL4 | Gummadova et al., 2009 | Flybase: FBtp0069616 | |
| Genetic reagent (D. melanogaster) | Clk4.1M-LexA | Guo et al., 2016 | Flybase: FBtp0093698 | |
| Genetic reagent (D. melanogaster) | UAS-EGFP | BDSC | RRID:BDSC_5428 | |
| Genetic reagent (D. melanogaster) | UAS-FRT-STOP-FRT-CsChrimson.mVenus and LexAop-FLP | Guo et al., 2018 | ||
| Genetic reagent (D. melanogaster) | Trissin-LexA | Deng et al., 2019 | ||
| Genetic reagent (D. melanogaster) | Trissin-GAL4 | Deng et al., 2019 | ||
| Genetic reagent (D. melanogaster) | CCHa1-GAL4 | Deng et al., 2019 | ||
| Genetic reagent (D. melanogaster) | CNMa-GAL4 | Deng et al., 2019 | ||
| Antibody | Anti-PER Rabbit polyclonal | Laboratory of Michael Rosbash | 1:1000 | |
| Antibody | Anti-TIM Rat monoclonal | Laboratory of Michael Rosbash | RRID: AB_2753140 | 1:200 |
| Antibody | Anti-PDF Mouse monoclonal | DSHB | RRID: AB_760350 | 1:500 |
| Antibody | Anti-GFP Mouse monoclonal | Sigma-Aldrich | RRID: AB_390913 | 1:1000 |
| Antibody | Chicken anti-GFP | Abcam | RRID: AB_300798 | 1:1000 |
| Antibody | Rabbit anti-DsRed | Takara Bio USA | RRID: AB_10013483 | 1:200 |
| Antibody | Goat anti-mouse polyclonal | ThermoFisher | RRID: AB_2536185 | 1:200 |
| Antibody | Goat anti-rabbit polyclonal | ThermoFisher | RRID: AB_2576217 | 1:200 |
| Antibody | Goat anti-rabbit polyclonal | ThermoFisher | RRID: AB_2633281 | 1:200 |
| Antibody | Anti-PDF Mouse monoclonal | DSHB | RRID: AB_760350 | 1:500 |
| Software, algorithm | FIJI | https://fiji.sc/ | RRID: SCR_002285 | |
| Software, algorithm | Microsoft Office Excel | |||
| Software, algorithm | RStudio | https://rstudio.com | RRID: SCR_000432 | Version 1.2.5033 |
| Software, algorithm | Adobe Photoshop CC | RRID: SCR_014199 | ||
| Software, algorithm | Code for clustering and rhythmic gene expression analysis | This paper | R code Ma and Przybylski, 2020) |
Additional files
-
Source data 1
List of identified marker genes in each cluster.
Table displaying the average log-fold change values, percentage of expression and p-value for the list of differentially expressed genes among clusters.
- https://cdn.elifesciences.org/articles/63056/elife-63056-data1-v2.xlsx
-
Supplementary file 1
List of identified rhythmic genes in each cluster.
Table displaying the minimum and maximum gene expression level, phase, and p-value for the list of rhythmically expressed genes among clusters in light:dark (LD) and constant darkness (DD) conditions.
- https://cdn.elifesciences.org/articles/63056/elife-63056-supp1-v2.xlsx
-
Supplementary file 2
Gene ontology (GO) term analysis of the cyclers in each cluster.
Table displaying p-value for the GO term analysis of the rhythmically expressed genes among clusters in light:dark (LD) condition.
- https://cdn.elifesciences.org/articles/63056/elife-63056-supp2-v2.xlsx
-
Supplementary file 3
Gene ontology (GO) term analysis for all cyclers.
Table displaying the GO terms and their p-values of the pooled rhythmically expressed genes.
- https://cdn.elifesciences.org/articles/63056/elife-63056-supp3-v2.xlsx
-
Transparent reporting form
- https://cdn.elifesciences.org/articles/63056/elife-63056-transrepform-v2.docx
Download links
A two-part list of links to download the article, or parts of the article, in various formats.
Downloads (link to download the article as PDF)
Open citations (links to open the citations from this article in various online reference manager services)
Cite this article (links to download the citations from this article in formats compatible with various reference manager tools)
A transcriptomic taxonomy of Drosophila circadian neurons around the clock
eLife 10:e63056.
https://doi.org/10.7554/eLife.63056


