Genetic association and causal inference converge on hyperglycaemia as a modifiable factor to improve lung function
- School of Biomedical Sciences and Pharmacy, The University of Newcastle, Australia
- Hunter Medical Research Institute, Australia
- School of Medicine and Public Health, The University of Newcastle, Australia
Figures
Figure 1 with 1 supplement

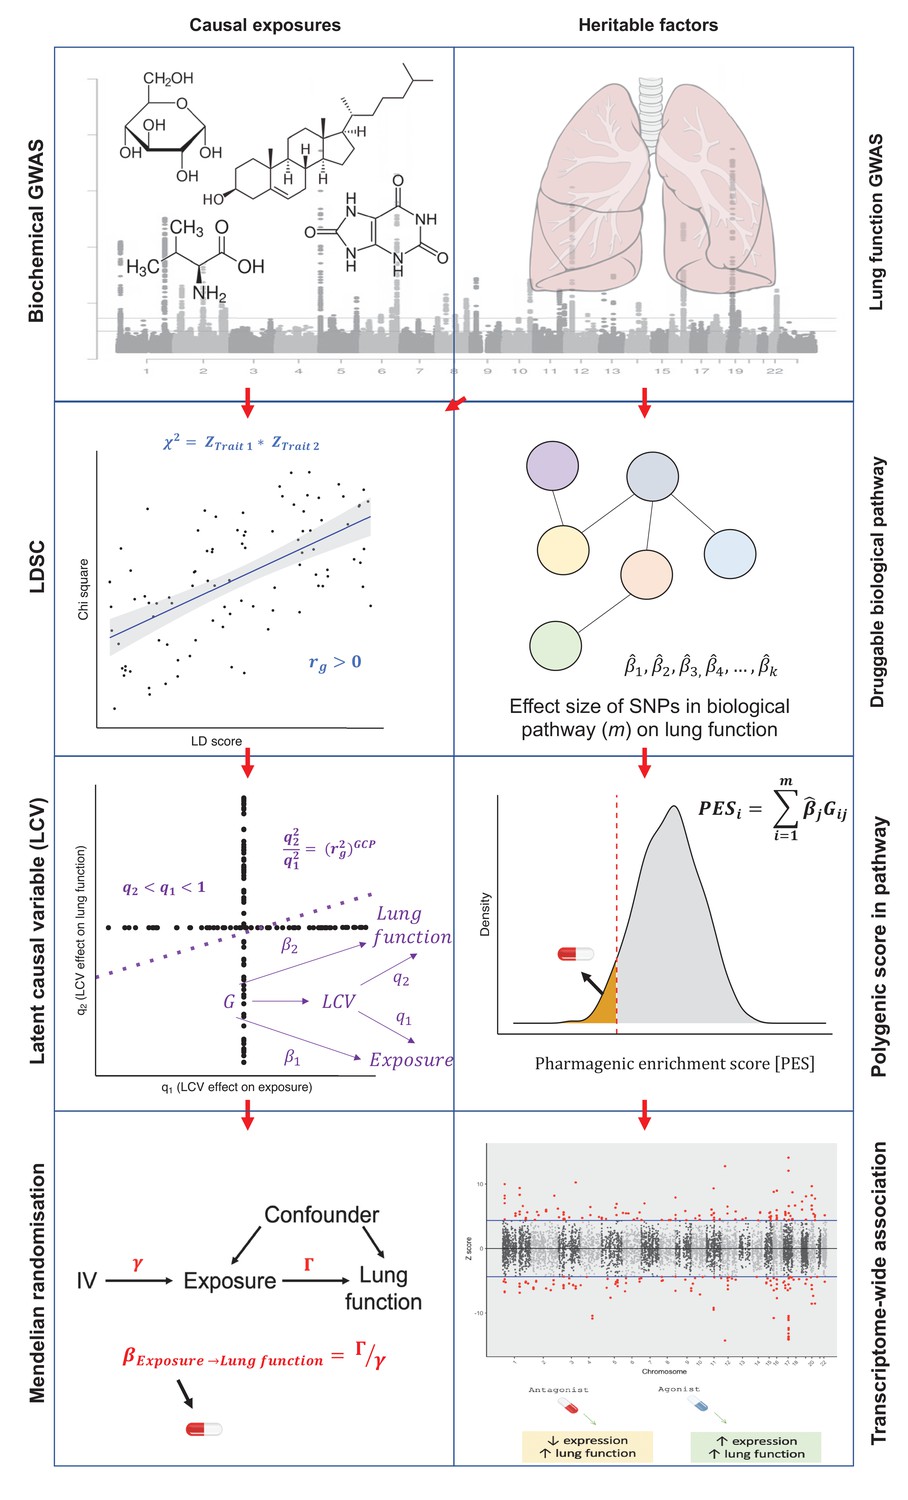
Overview of strategies for genetically informed drug repurposing to improve lung function.
The left flow chart outlines our workflow for using causal inference to identify drug targets, while the right flow chart shows the workflow for functionally partitioning the heritable component into drug targets. In both cases, we utilise or integrate genome-wide association studies (GWAS) data for lung function (including three spirometry phenotypes: forced expiratory volume in 1 s [FEV1], forced vital capacity [FVC], and their ratio [FEV1/FVC]) and quantitative biochemical traits (e.g. hormones and metabolites) which can be pharmacologically modulated. Using this data, we established genetic correlation between lung function and the biochemical traits using linkage disequilibrium score regression (LDSC). We then constructed a latent causal variable (LCV) model to investigate evidence of causality for significantly correlated biochemical–lung function trait pairs. To further support causal inference between significant pairs, we implemented Mendelian randomisation. Where a causal relationship between a modifiable biochemical trait and lung function is established, we can infer a novel treatment. The right flow chart shows the workflow for utilising heritable components for drug repurposing. Specifically, polygenic scores for lung function were calculated using lung function GWAS single nucleotide polymorphisms (SNPs) within biological pathways that can be targeted by approved drugs, rather than a genome-wide score. Individuals with low genetically predicted lung function by a pharmagenic enrichment score (PES) (low PES) relative to a reference population may benefit from a compound which modulates said pathway. To further support putative genetically predicted targets for drug repositioning a transcriptome-wide association study of lung function was performed. Druggable genes for which genetically predicted expression was correlated with a spirometry measure. Genes with positive genetic covariance between imputed expression and lung function (i.e. increased expression associated with increased lung function) could be modulated by an agonist compound, whilst genes for which decreased predicted expression is associated with improved lung function could be targeted by an antagonist compound.
Figure 1—figure supplement 1
Diagrammatic overview of strategies for genetically informed drug repurposing to improve lung function.
The left column outlines our workflow for using causal inference to identify drug targets, while the right side shows the workflow for functionally partitioning the heritable component into drug targets. In both cases, we utilise or integrate genome-wide association studies (GWAS) data for lung function (including three spirometry phenotypes: forced expiratory volume in 1 s [FEV1], forced vital capacity [FVC], and their ratio [FEV1/FVC]) and quantitative biochemical traits (e.g. hormones and metabolites) which can be pharmacologically modulated. Using this data, we established genetic correlation between lung function and the biochemical traits using linkage disequilibrium score regression (LDSC) (left column). We then constructed a latent causal variable (LCV) model to investigate evidence of causality for significantly correlated biochemical–lung function trait pairs. To further support causal inference between significant pairs, we implemented Mendelian randomisation. Where a causal relationship between a modifiable biochemical trait and lung function is established, we can infer a novel treatment. The right column shows the workflow for utilising the pharmagenic enrichment score (PES) framework for precision drug repositioning. Specifically, polygenic scores for lung function were calculated using lung function GWAS SNPs within biological pathways that can be targeted by approved drugs, rather than a genome-wide score. Individuals with low genetically predicted lung function by a PES (low PES) relative to a reference population (orange shaded distribution in right panel 3) may benefit from a compound which modulates said pathway. To further support putative genetically predicted targets for drug repositioning, a transcriptome-wide association study of lung function was performed. Druggable genes for which genetically predicted expression was correlated with a spirometry measure. Genes with positive genetic covariance between imputed expression and lung function (i.e. increased expression associated with increased lung function) could be modulated by an agonist compound, whilst genes for which decreased predicted expression is associated with improved lung function could be targeted by an antagonist compound.
Figure 2 with 1 supplement

Genome-wide investigation of biochemical traits related to lung function.
(a) Heatmap of genetic correlations (rg) between three spirometry measures (forced expiratory volume in 1 s [FEV1], forced vital capacity [FVC], and their ratio [FEV1/FVC]) and a number of European ancestry genome-wide association studies. Genetic correlation estimates were plotted if the trait was significantly correlated with at least one of the lung function traits after Bonferroni correction. Hierarchical clustering was applied to the rows and utilised Pearson’s correlation distance. (b) Latent causal variable models between correlated biochemical traits (selected by linkage disequilibrium score regression) that are potentially drug targets (metabolite or hormone traits) and each measure of lung function. The posterior mean genetic causality proportion (GCP) is plotted, with the error bars representing the upper and lower limits defined by its posterior mean standard error. A positive GCP estimate significantly different than zero indicates partial genetic causality of the biochemical trait on the spirometry measure.
Figure 2—figure supplement 1
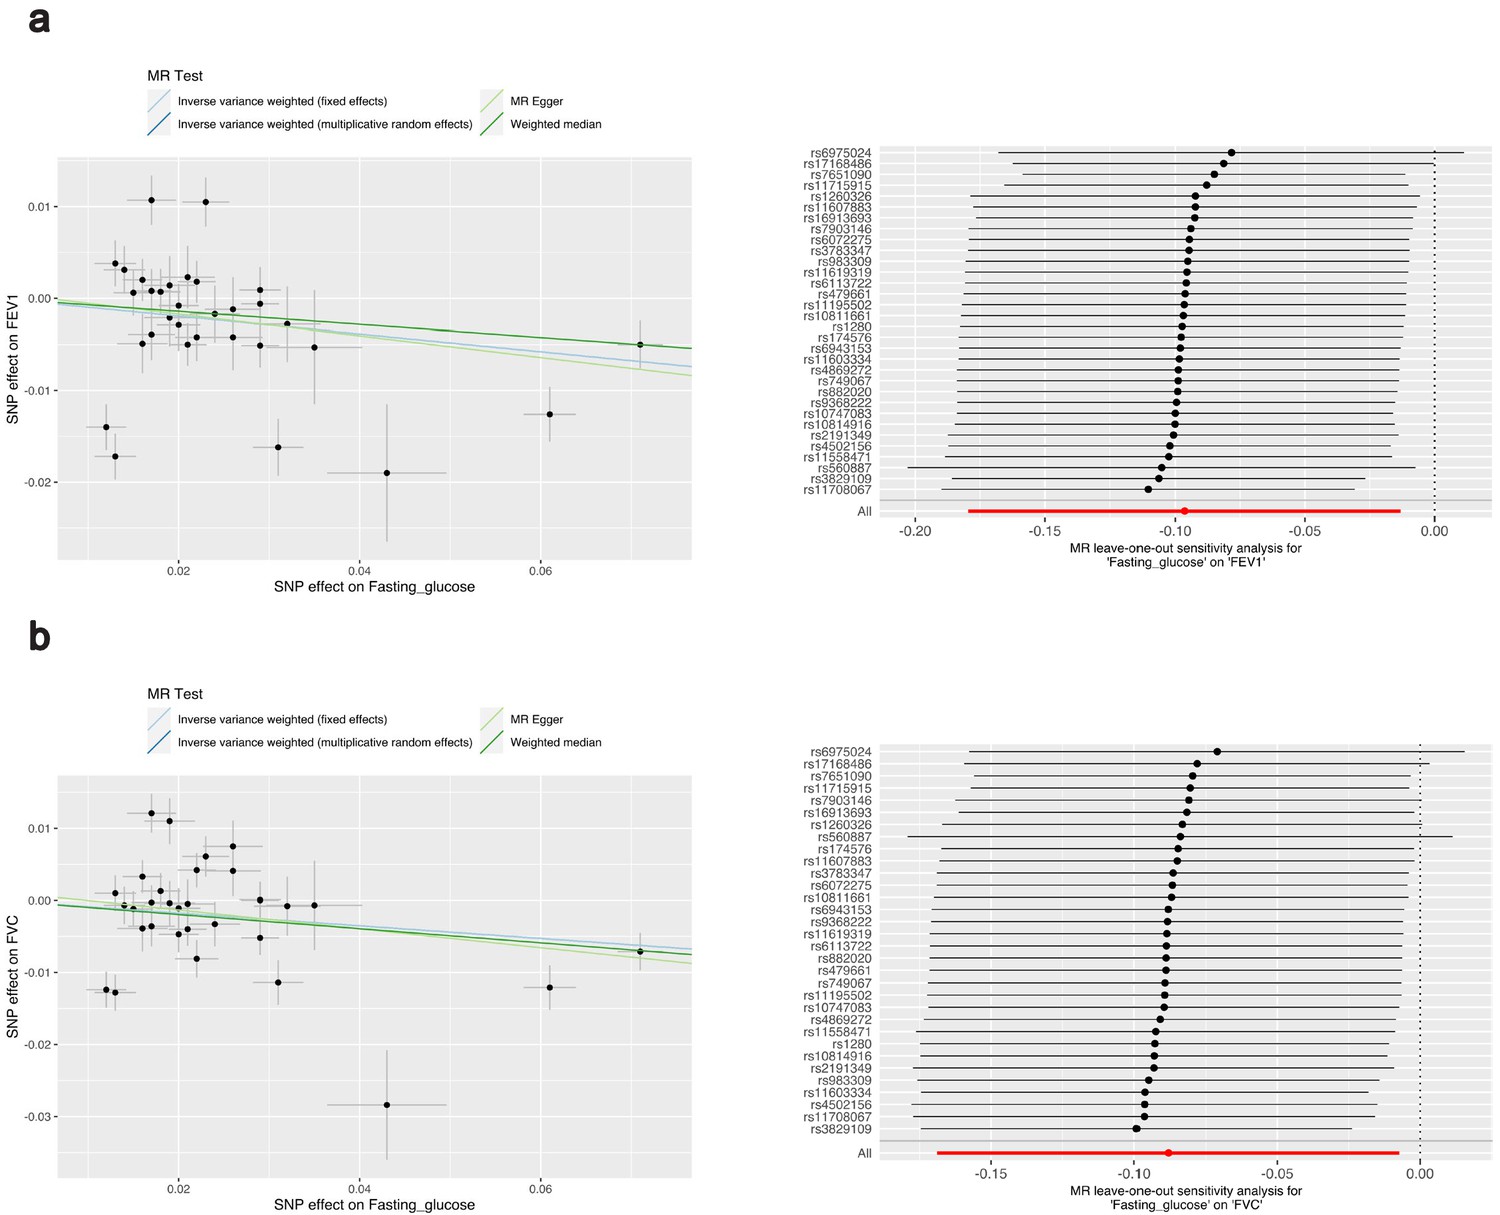
Investigation of the effect of fasting glucose on lung function using two-sample Mendelian randomisation (MR).
MR results for (a) forced expiratory volume in 1 s (FEV1) and (b) forced vital capacity (FVC). The left scatter plot indicates the effect size of the instrumental variable (IV) SNP effects on fasting glucose (mmol/L) and FEV1 or FVC, respectively (standard deviation units). Each regression slope corresponds to the causal estimate between fasting glucose and each lung function measure, with the slopes shaded by the MR method used to calculate the causal estimate. The forest plot on the right indicates the results of the ‘leave-one-out analysis’. Each black point represents the causal estimate (inverse variance weighted [IVW] estimator with multiplicative random effects) of fasting glucose on each lung function measure with the SNP (IV) labelled on the y-axis removed; error bars represent upper and lower confidence intervals. The combined IVW estimate with all IVs is represented by the red point (‘All’).
Figure 3 with 2 supplements
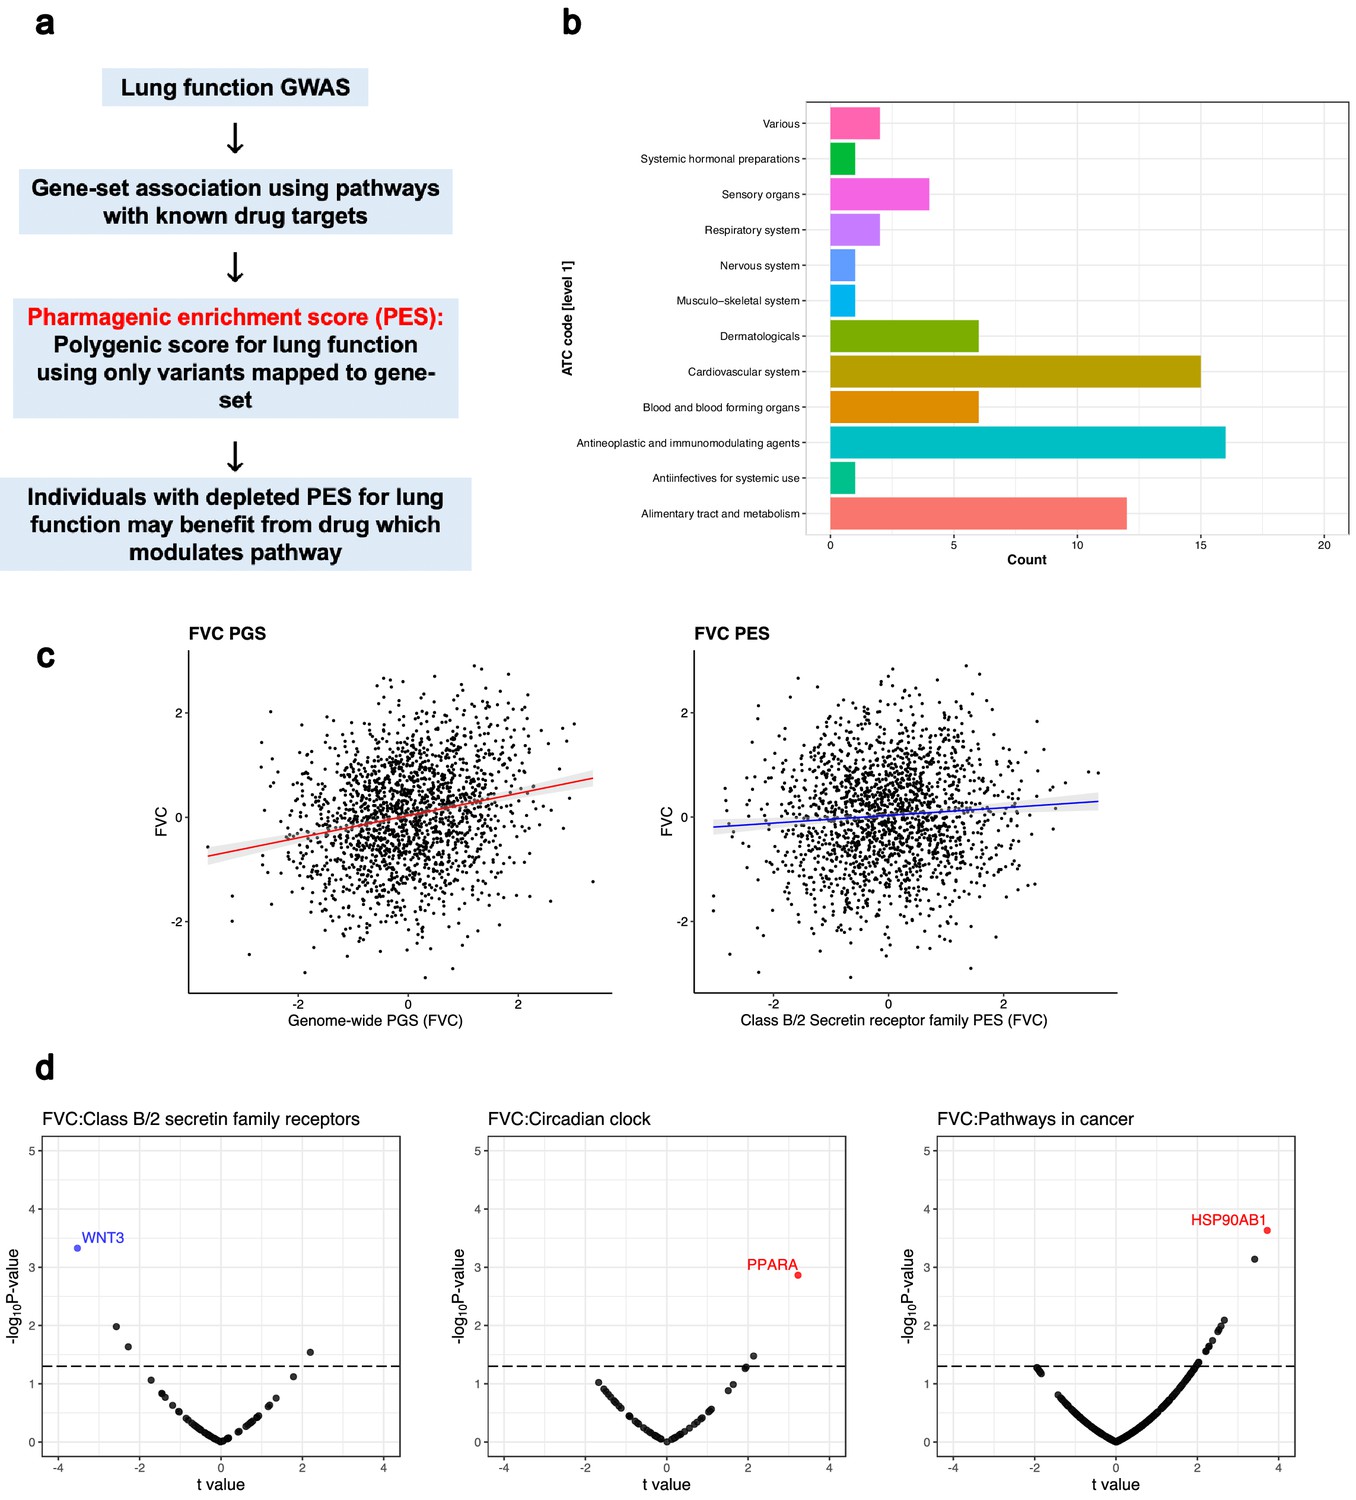
The pharmagenic enrichment score (PES) framework to identify and implement drug-repurposing candidates for lung function.
(a) Overview of the PES approach, whereby polygenic scores of lung function measures are constructed using variants specifically within druggable pathways. Individuals with a depleted PES, that is, lower genetically predicted spirometry measures using variants in the gene-set, may benefit from a drug which modulates the pathway in question. (b) The number of U.S. Food and Drug Administration-approved drugs with overrepresented targets in at least one candidate PES gene-sets per Anatomical Therapeutic Classification (ATC) level 1 code. Each ATC level 1 code is shaded a different colour with its frequency on the x-axis. (c) The phenotypic association between a polygenic score (PGS) of forced vital capacity (FVC) and an FVC PES which was nominally significant (p<0.05) but did not survive multiple testing correction after adjustment for genome-wide PGS. The relationship between the PES/PGS and normalised residual FVC in an independent cohort is plotted, with 95% confidence intervals of the regression trendline indicated by shading. (d) Significant correlations between the expression of genes in a candidate PES and three lung function PES (FVC): class B/2 secretin family receptors, circadian clock, and pathways in cancer. The relationship between PES and gene expression is presented as a volcano plot, where the x-axis is the t value (coefficient divided by standard error) and the y-axis is the –log10p-value, with higher points more significant. Genes which are associated after multiple testing correction for the number of genes in the pathway are coloured blue (strict FDR < 0.05) or red (lenient FDR < 0.1). The dotted line denotes an uncorrected nominally significant association (p<0.05).
Figure 3—figure supplement 1
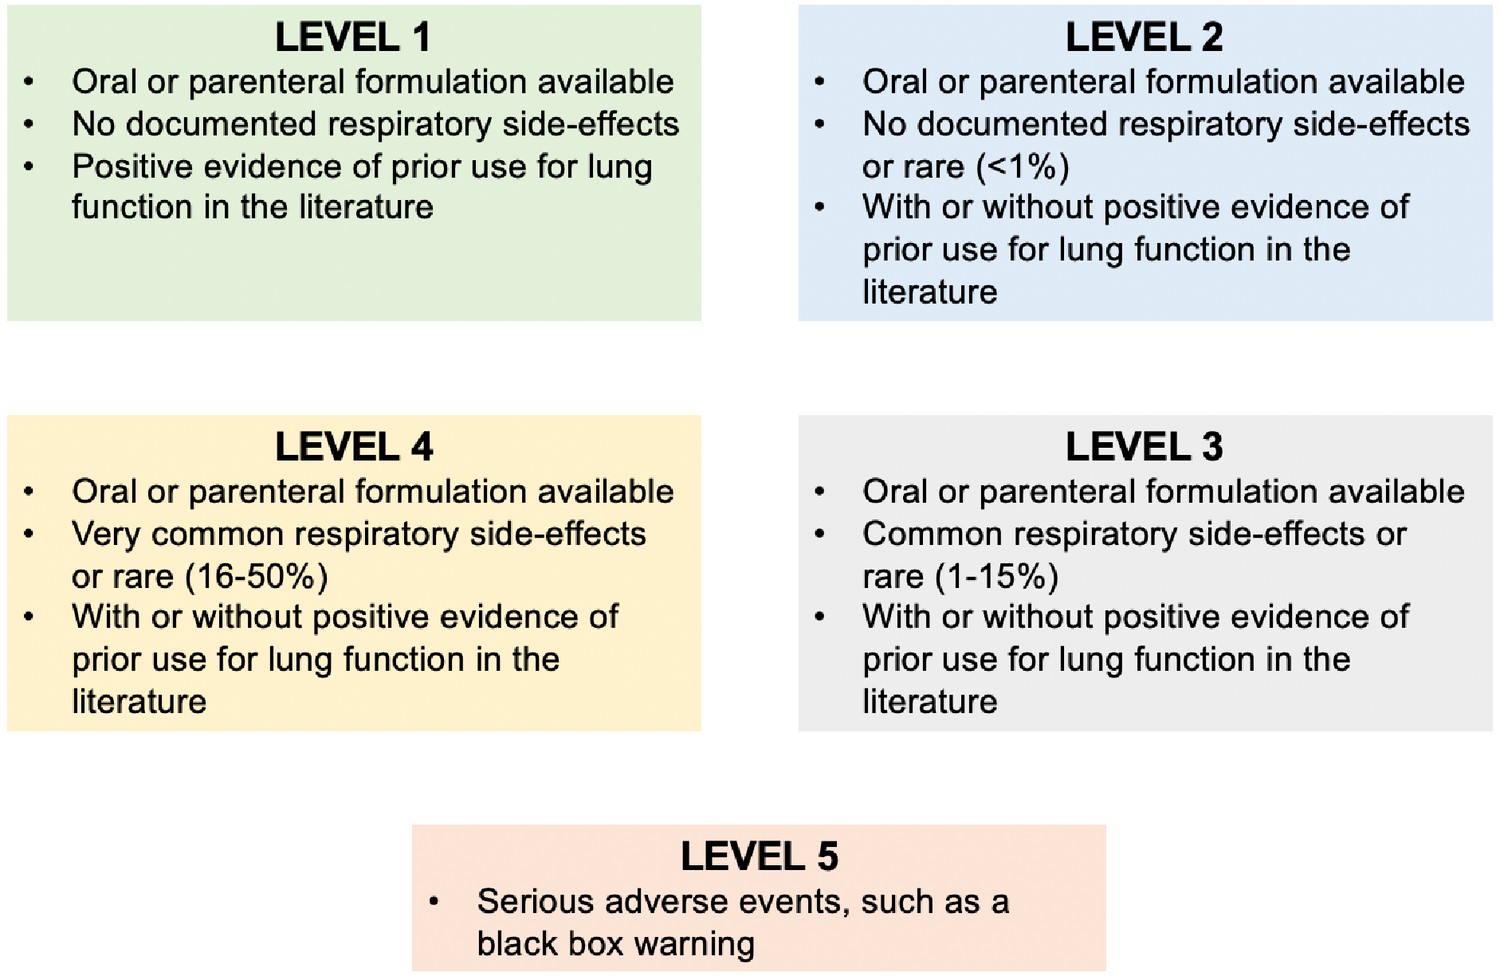
Schematic for the prioritisation of drug-repurposing candidates.
The criteria for each ranking category are detailed in their respective boxes.
Figure 3—figure supplement 2
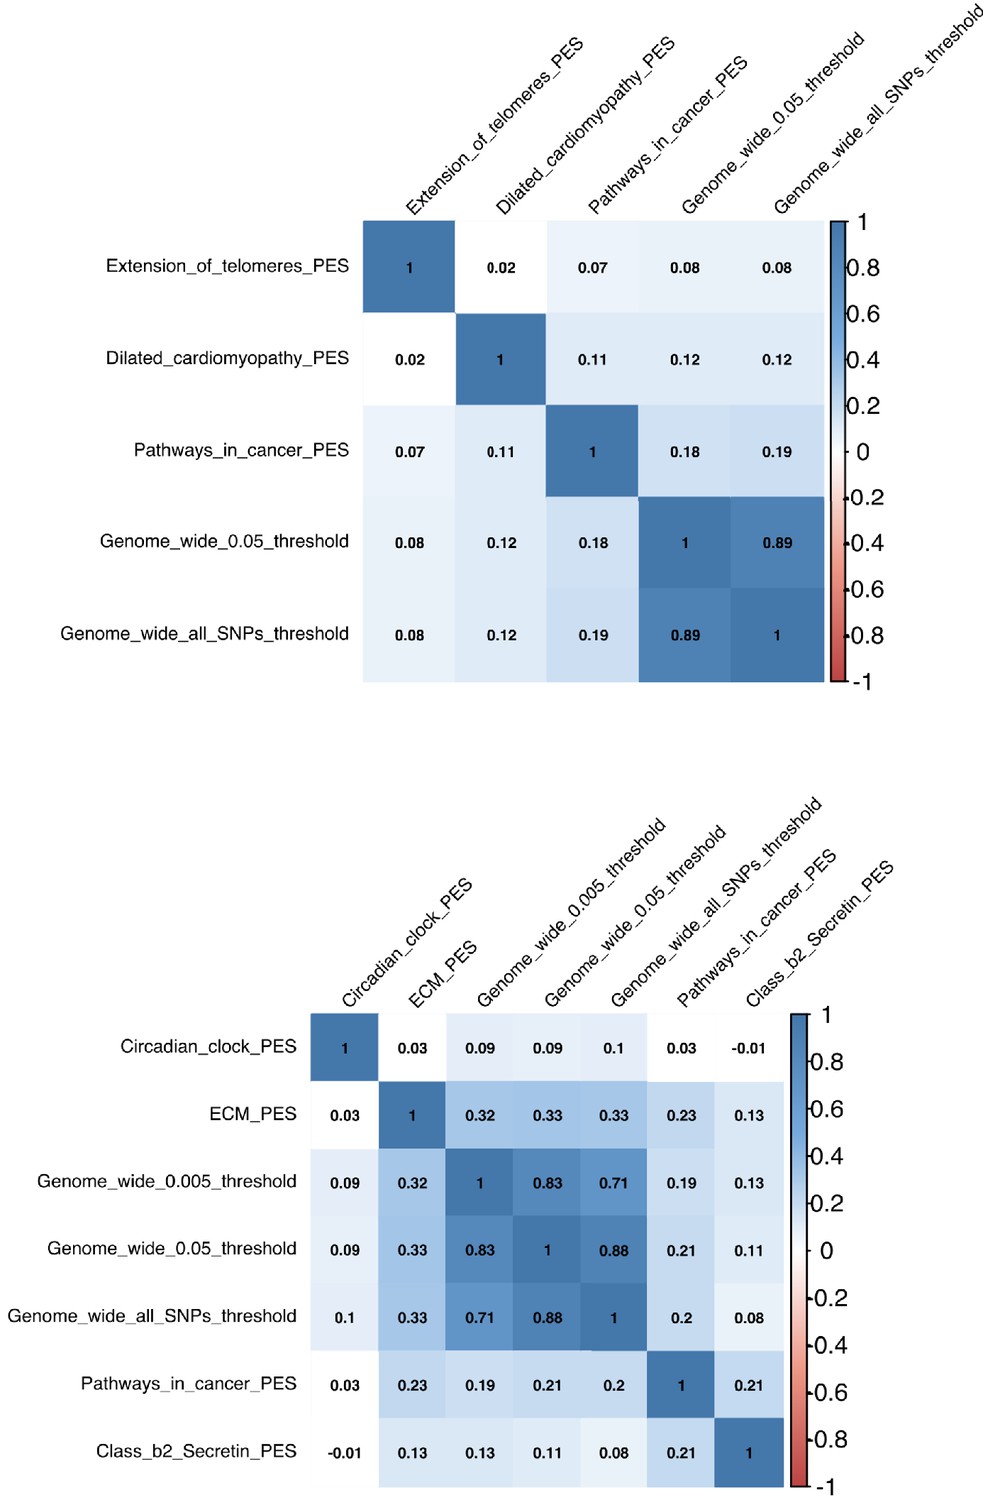
Correlations between genome-wide polygenic scores (PGS) and pharmagenic enrichment score (PES).
Each box denotes the correlation coefficient between one of the following: (a) two PGS at different p-value thresholds, (b) two PES, or (c) a PGS and PES. Shaded boxes represent variables significantly correlated after the application of multiple testing correction. The top plot is for forced expiratory volume in 1 s, followed by forced vital capacity represented by the lower correlation plot.
Figure 4
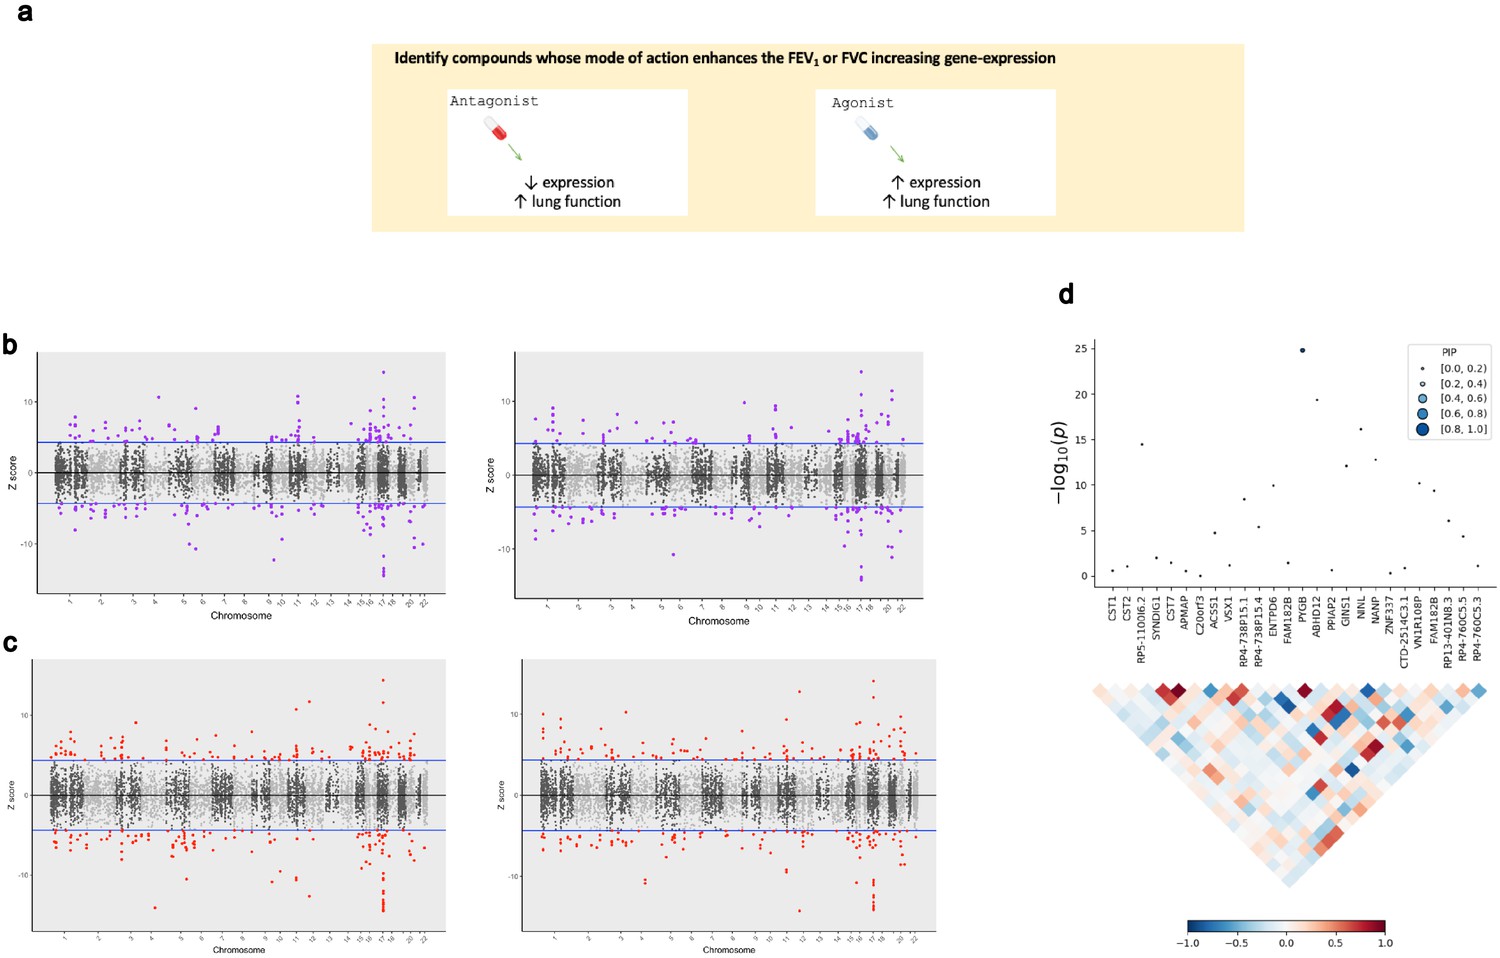
The application of transcriptome-wide association to identify drug-repurposing candidates for lung function.
(a) Schematic outlining the use of transcriptome-wide association study (TWAS) to reveal clinically actionable drug–gene interactions. Druggable genes with lung function-associated imputed expression can be finemapped to prioritise a credible set of a causal genes at the TWAS locus, that is, a high posterior inclusion probability (PIP). We seek to identify drugs with a mode of action which match the TWAS Z value, that is, compounds which may increase lung function. (b, c) Miami plots of a TWAS of forced expiratory volume in 1 s (left) and forced vital capacity (right) using whole blood (b) and lung (c) SNP weights. TWAS Z > 0 denotes a gene for which increased predicted expression is associated with increased lung function and vice versa. The highlighted genes survived multiple testing correction for the number of genes tested. (d) Probabilistic finemapping of the PYGB TWAS locus. The points denoting each gene are sized and coloured by their PIP for causality, with higher PIP denoted by larger, darker points as represented on the scale. The correlation plot below each region represents the covariance of predicted expression between gene.
Figure 5
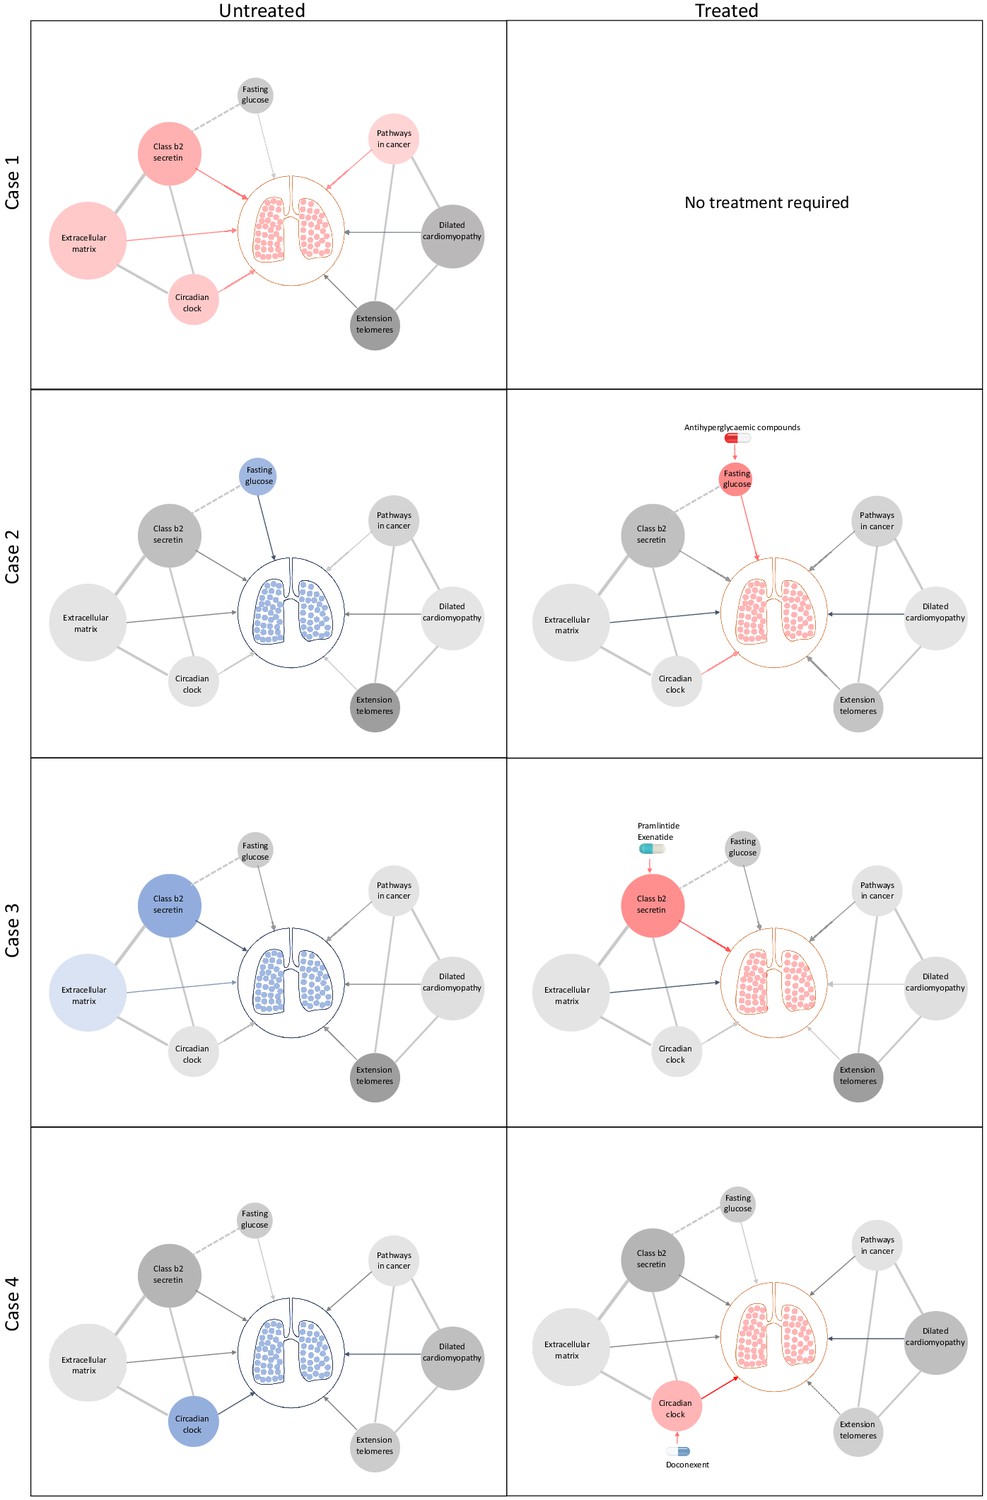
Schematic representation of drug repositioning and precision implementation in lung function deficits directed by causal enrichment of environmental and genetic risk factors.
Each row represents a simulated individual with a heterogeneous presentation of risk factors related to lung function. Case 1 (top row) represents an individual with good lung function (pink lung tissue) and genomic and environmental components consistent with healthy lung function (grey to red nodes). These have a neutral to positive influence on lung function represented by the grey and red edges (arrow), respectively. Case 2 has high fasting glucose and neutral (grey) loading of genetic variants (pharmagenic enrichment score [PES]) associated with lung function pathways. After treatment with antihyperglycaemic agents, or some other intervention to lower blood glucose, lung function is improved (red edge) sufficiently for therapeutic effect, represented by pink lungs. Case 3 has enrichment of genetic variants (PES) associated with poorer lung function in the class b2 secretin pathway. To improve lung function, they are treated with drugs, such as pramlintide (which targets RAMP1, RAMP2, and RAMP3) and exenatide (GLP1R agonist), which works by modulating genes in the class b2 secretin pathway to ameliorate the enrichment of poor lung function variants in that pathway. The broken edge between fasting glucose and the class b2 secretin pathway represents the probable connection or shared genes between these nodes as receptors in this pathway are involved in glycaemic regulation. Case 4 also presents with poor lung function (blue lung tissue) and enrichment of poor lung function-associated variants in the circadian clock pathway (blue node). This individual’s lung function was then treated by compounds, such as doconexent, which act on the circadian clock pathway. This schematic is only representative of many thousands of treatment scenarios potentially informed by this treatment decision tool, which could be applied to any phenotype with large genome-wide association studies available.
Tables
Table 1
Significant genetic correlations between lung function measures and metabolite and hormone GWAS.
| Lung function trait | Biochemical trait | Genetic correlation (rg)* | p-Value |
|---|---|---|---|
| FEV1 | Fasting insulin | −0.23 (0.04) | 6.61 × 10⁻⁸ |
| Leptin (BMI unadjusted) | −0.25 (0.05) | 3.74 × 10⁻⁷ | |
| Leptin (BMI adjusted) | −0.24 (0.05) | 9.13 × 10⁻⁷ | |
| Urate | −0.12 (0.03) | 9.46 × 10⁻⁶ | |
| Fasting glucose | −0.13 (0.03) | 1 × 10⁻⁴ | |
| FVC | Fasting insulin | −0.31 (0.04) | 6.98 × 10⁻¹⁴ |
| Leptin (BMI unadjusted) | −0.33 (0.05) | 2.85 × 10⁻¹² | |
| Leptin (BMI adjusted) | −0.27 (0.05) | 1.21 × 10⁻⁸ | |
| HDL cholesterol | 0.14 (0.03) | 9.97 × 10⁻⁷ | |
| Urate | −0.12 (0.02) | 9.54 × 10⁻⁷ | |
| Triglycerides | −0.11 (0.03) | 1.53 × 10⁻⁵ | |
| Fasting glucose | −0.12 (0.03) | 1 × 10⁻⁴ | |
| FEV1/FVC | HDL cholesterol | −0.11 (0.03) | 2 × 10⁻⁴ |
-
*Genetic correlations which survived multiple testing correction for each lung function trait individually are reported with their respective standard error.
Evidence of a causal relationship between fasting glucose and lung function supports antihyperglycaemic compounds as drug-repurposing candidates.
-
FEV1: forced expiratory volume in 1 s; FVC: forced vital capacity; FEV1/FVC: ratio of FEV1 to FVC; HDL: high-density lipoprotein; BMI: body mass index; GWAS: genome-wide association studies.
Table 2
Gene-sets with known drug targets enriched with lung function-associated common variation after the application of multiple testing correction (FDR < 0.05).
| Phenotype | Gene-set | Lowest p* | Genic boundaries |
|---|---|---|---|
| FVC | Hedgehog signalling pathway (KEGG) | 6.66 × 10⁻⁹ | Liberal |
| BMP receptor signalling | 4.08 × 10⁻⁷ | Liberal | |
| FEV1 | Signalling events mediated by the Hedgehog family | 9.30 × 10⁻⁷ | Conservative |
| Hedgehog signalling pathway (KEGG) | 3.45 × 10⁻⁶ | Liberal | |
| FVC | ALK in cardiac myocytes | 4.57 × 10⁻⁶ | Liberal |
| Pathways in cancer | 5.43 × 10⁻⁶ | Liberal | |
| FEV1 | Basal cell carcinoma | 8.86 × 10⁻⁶ | Liberal |
| FVC | TGF-β signalling pathway | 1.21 × 10⁻⁵ | Liberal |
| Circadian clock | 3.00 × 10⁻⁵ | Liberal | |
| Class B/2 (secretin family receptors) | 8.08 × 10⁻⁵ | Liberal | |
| FEV1 | TGF-β signalling pathway | 8.15 × 10⁻⁵ | Liberal |
| Extension of telomeres | 8.59 × 10⁻⁵ | Liberal | |
| Pathways in cancer | 8.94 × 10⁻⁵ | Liberal | |
| Dilated cardiomyopathy | 9.54 × 10⁻⁵ | Liberal | |
| FVC | ECM/ECM-associated proteins | 2.28 × 10⁻⁴ | Liberal |
-
*The lowest p is the most significant gene-set association p-value across all the p-value thresholds (PT) and genic boundary configurations tested.
ECM: extracellular matrix; FVC: forced vital capacity; FEV1: forced expiratory volume in 1 s: TGF-transforming growth factor; ALK: activin receptor-like kinase; BMP: bone morphogenetic protein.
Table 3
The association between lung function PES and spirometry measures in the Hunter Community Study cohort.
| Phenotype | PES | Z value | p | PES R2 | NSNP |
|---|---|---|---|---|---|
| FEV1 | Dilated cardiomyopathy | 0.15 | 0.889 | 1.3 × 10⁻⁵ | 2404 |
| Extension of telomeres | −0.18 | 0.861 | 1.7 × 10⁻⁵ | 44 | |
| Pathways in cancer | 2.98 | 0.003 | 0.005 | 6214 | |
| FVC | Circadian clock | 2.14 | 0.033 | 0.003 | 230 |
| Class B/2 secretin family receptors | 3.14 | 0.002 | 0.005 | 76 | |
| Extracellular matrix proteins | 3.50 | 5 × 10⁻⁴ | 0.007 | 16,390 | |
| Pathways in cancer | 2.64 | 0.008 | 0.004 | 6212 | |
| PES: pharmagenic enrichment score; FVC: forced vital capacity; FEV1: forced expiratory volume in 1 s. |
-
The Z value is the PES model coefficient divided by its standard error. The variance explained (R2) was the null model R2 subtracted from the full model with the PES as a predictor. The number of independent SNPs used to calculate the PES in this cohort is reported in the NSNP column. The reported results are from models unadjusted for genome-wide PGS.
Table 4
Overrepresentation of proteins which interact with viral severe acute respiratory syndrome coronavirus 2-expressed proteins within glycaemic-related pathways.
| Glycaemic gene-set | p-Value |
|---|---|
| Glucagon-like peptide-1 regulates insulin secretion | 7.02 × 10⁻⁴ |
| Glucagon signalling in metabolic regulation | 2.33 × 10⁻⁴ |
| Glucose metabolism | 2.69 × 10⁻⁵ |
| Regulation of insulin secretion | 2.13 × 10⁻³ |
Additional files
-
Supplementary file 1
Genetic correlation and causal inference results.
(a) Genetic correlations between FEV1 and 172 GWAS from the LDhub library. (b) Genetic correlations between FVC and 172 GWAS from the LDhub library. (c) Genetic correlations between FEV1/FVC and 172 GWAS from the LDhub library. (d) Latent casual variable models constructed between metabolic/hormonal traits and measures of lung function. (e) Two-sample Mendelian randomisation models testing the effect of fasting glucose on lung function. (f) Two-sample Mendelian randomisation models testing the effect of fasting glucose on lung function: sensitivity and pleiotropy analyses. (g) Two-sample Mendelian randomisation models testing the effect of fasting glucose on lung function: leave-one-out analyses. (h) Phenome-wide association study of rs17168486 using GWAS atlas summary statistics. (i) Phenome-wide association study of rs7903146 using GWAS atlas summary statistics. (j) Phenome-wide association study of rs6975024 using GWAS atlas summary statistics. (k) Phenome-wide association study of rs1260326 using GWAS atlas summary statistics. (l) Phenome-wide association study of rs560887 using GWAS atlas summary statistics. (m) Association of fasting glucose IV SNPs with smoking behaviour phenotypes – ever vs. never smoked. (n) Association of fasting glucose IV SNPs with smoking behaviour phenotypes – cigarettes smoked per day.
- https://cdn.elifesciences.org/articles/63115/elife-63115-supp1-v2.xlsx
-
Supplementary file 2
Pharmagenic enrichment score gene-sets.
(a) Candidate PES gene-set identification for FEV1 and FVC – FDR < 0.1 (conservative genic boundaries). (b) Candidate PES gene-set identification for FEV1 and FVC – FDR < 0.1 (liberal genic boundaries). (c) FDA-approved DrugBank compounds with overrepresented targets in a PES candidate gene-set. (d) Evaluation of FDA-approved DrugBank compounds with overrepresented targets in a PES candidate gene-set. (e) Single drug–gene interactions in the ALK pathway gene-set. (f) Single drug–gene interactions in the basal cell carcinoma gene-set. (g) Single drug–gene interactions in the dilated cardiomyopathy gene-set. (h) Single drug–gene interactions in the Hedgehog signalling pathway gene-set (KEGG). (i) Single drug–gene interactions in the pathways in cancer gene-set (j) Single drug–gene interactions in the TGF-beta signalling pathway gene-set. (k) Single drug–gene interactions in the ECM (NABA matrisome) gene-set. (l) Single drug–gene interactions in the BMP pathway gene-set. (m) Single drug–gene interactions in the Hedgehog signalling pathway (PID) gene-set. (n) Single drug–gene interactions in the circadian clock gene-set. (o) Single drug–gene interactions in the class b2 secretin family receptors gene-set. (p) Single drug–gene interactions in the extension of telomeres gene-set.
- https://cdn.elifesciences.org/articles/63115/elife-63115-supp2-v2.xlsx
-
Supplementary file 3
Pharmagenic enrichment score profiles and transcriptome-wide association study results.
(a) Genome-wide polygenic score (PGS) of lung function in the Hunter Community Study cohort. (b) Pharmagenic enrichment scores tested in the Hunter Community Study cohort (unadjusted for genome-wide PGS). (c) Association of pharmagenic enrichment scores (PES) with lung function in the Hunter Community Study cohort – covariation for genome-wide PGS. (d) Correlation between the FEV1pathways in cancer PES and gene expression in the Geuvadis cohort. (e) Correlation between the FVC pathways in cancer PES and gene expression in the Geuvadis cohort. (f) Correlation between the FVC ECM PES and gene expression in the Geuvadis cohort. (g) Correlation between the FEV1extension of telomeres PES and gene expression in the Geuvadis cohort. (h) Correlation between the FEV1dilated cardiomyopathy PES and gene expression in the Geuvadis cohort. (i) Correlation between the FVC class b2 secretin PES and gene expression in the Geuvadis cohort. (j) Correlation between the FVC circadian clock PES and gene expression in the Geuvadis cohort. (k) Transcriptome-wide association study (TWAS) of FEV1 using lung tissue-derived SNP weights. (l) Transcriptome-wide association study (TWAS) of FVC using lung tissue-derived SNP weights. (m) Transcriptome-wide association study (TWAS) of FEV1 using whole blood-derived SNP weights. (n) Transcriptome-wide association study (TWAS) of FVC using whole blood-derived SNP weights. (o) Transcriptome-wide association study (TWAS) of cigarettes per day using whole blood-derived SNP weights. (p) Transcriptome-wide association study (TWAS) of ever vs. never smoked using whole blood-derived SNP weights. (q) Transcriptome-wide association study (TWAS) of cigarettes per day using brain (DLPFC)-derived SNP weights. (r) Transcriptome-wide association study (TWAS) of ever vs. never smoked using brain (DLPFC)-derived SNP weights. (s) Transcriptome-wide association study (TWAS) of cigarettes per day using lung tissue-derived SNP weights. (t) Transcriptome-wide association study (TWAS) of ever vs. never smoked using lung tissue-derived SNP weights. (u) Transcriptome-wide association study (TWAS) of cigarettes per day using brain (Nucleus accumbens)-derived SNP weights. (v)Transcriptome-wide association study (TWAS) of ever vs. never smoked using brain (Nucleus accumbens)-derived SNP weights. (w) Candidate drug–gene interactions with lung function increasing potential based on the sign of the TWAS Z value.
- https://cdn.elifesciences.org/articles/63115/elife-63115-supp3-v2.xlsx
-
Supplementary file 4
Host-viral interactome results.
(a) SARS-CoV2 host–viral interactome – human genes which putatively interact with a viral SARS-CoV2 protein (Gordon et al.). (b) Influenza host–viral interactome – human genes which putatively interact with a viral influenza protein (Watanabe et al, top 91 interacting proteins). (c) Human adenovirus host–viral interactome – human genes which putatively interact with a viral adenovirus protein (Martinez-Martin et al). (d) SARS-CoV2 viral prey proteins which overlap a glycaemic gene ontology pathway. (e) SARS-CoV2 viral prey proteins overlapping glycaemic pathways that demonstrate a high-confidence interaction with an antidiabetic drug target. (f) List of putative antidiabetic compound target genes (DGIdb).
- https://cdn.elifesciences.org/articles/63115/elife-63115-supp4-v2.xlsx
-
Transparent reporting form
- https://cdn.elifesciences.org/articles/63115/elife-63115-transrepform-v2.docx
Download links
A two-part list of links to download the article, or parts of the article, in various formats.
Downloads (link to download the article as PDF)
Open citations (links to open the citations from this article in various online reference manager services)
Cite this article (links to download the citations from this article in formats compatible with various reference manager tools)
Genetic association and causal inference converge on hyperglycaemia as a modifiable factor to improve lung function
eLife 10:e63115.
https://doi.org/10.7554/eLife.63115


