Hormone-sensitive lipase couples intergenerational sterol metabolism to reproductive success
- Institute of Molecular Biosciences, University of Graz, Austria
- BioTechMed-Graz, Austria
- Max Planck Institute of Molecular Cell Biology and Genetics, Germany
- Field of Excellence BioHealth - University of Graz, Austria
- Max Planck Institute for Biophysical Chemistry, Germany
Figures
Figure 1
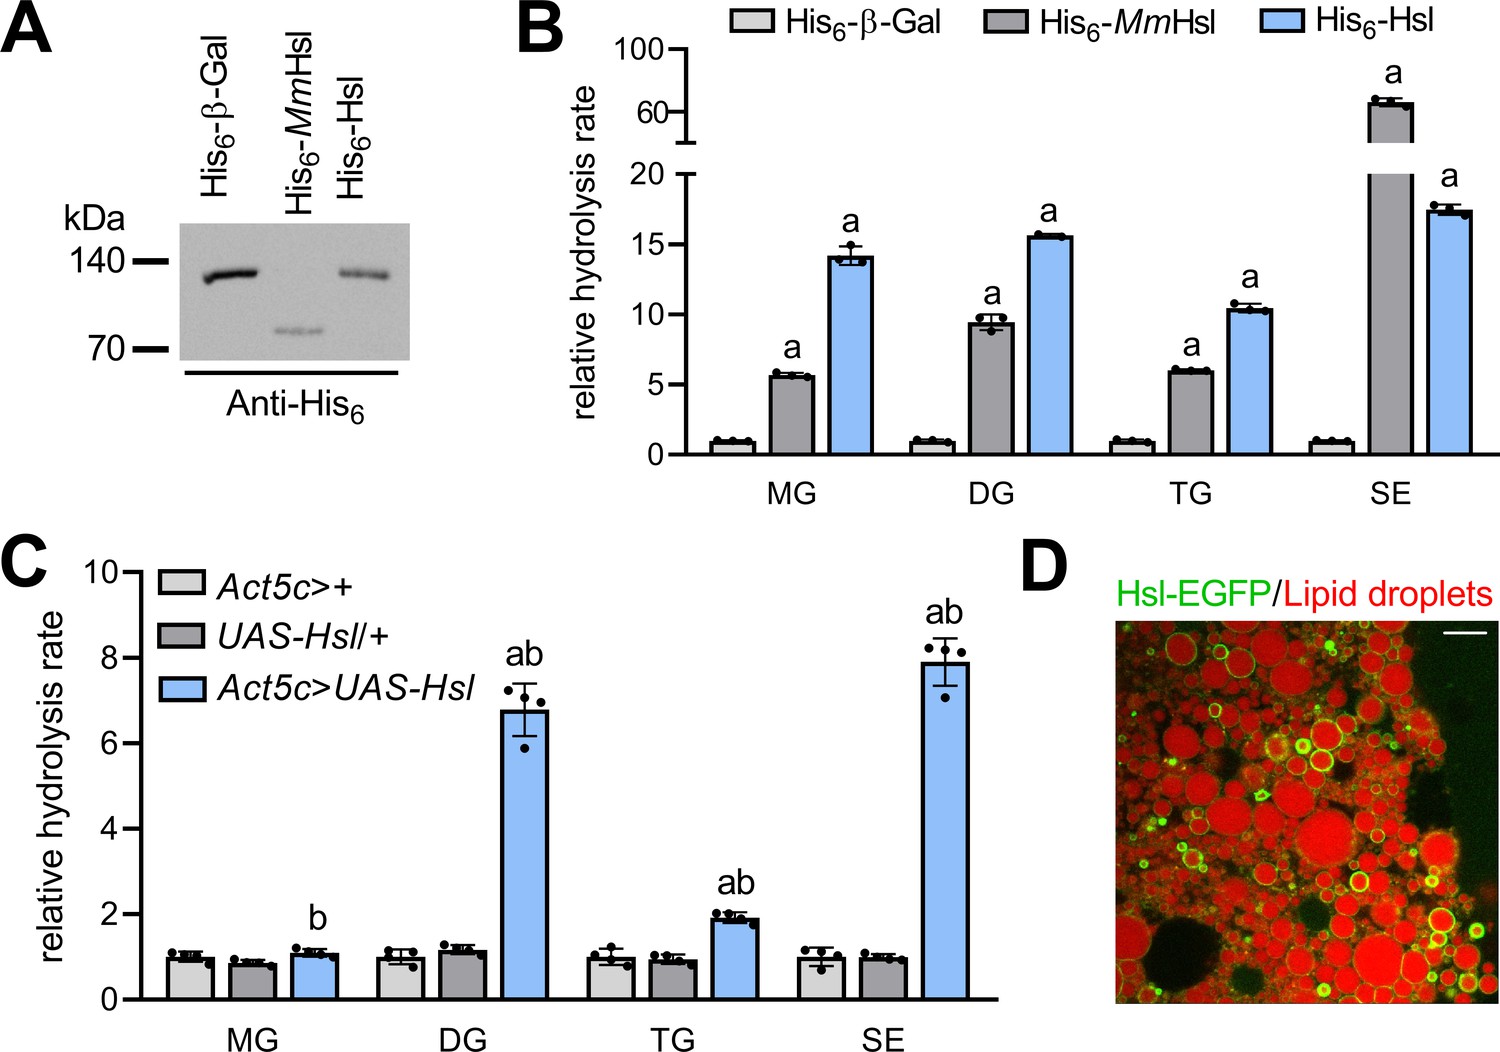
Enzyme activities and subcellular localization of Drosophila Hsl.
(A) Immunoblotting analysis of His6-tagged proteins in COS-7 cell extracts expressing His6-Hsl, His6-MmHsl, or His6-β-Gal. (B) Lipid hydrolase activities of recombinant Hsl. Cell extracts expressing His6-Hsl or His6-MmHsl were incubated with different lipids, the release of FAs was measured and normalized to the His6-β-Gal control (n = 3). (C) Lipid hydrolase activities of Hsl gain-of-function flies. UAS-Hsl transgene expression was ubiquitously driven in vivo using the Act5c-GAL4 driver. Lipid hydrolase activities of abdominal extracts were determined as in (B). Flies harboring either the Act5c-GAL4 transgene or the non-induced UAS-Hsl transgene only served as controls and data were normalized to Act5c-GAL4>+ samples (n = 4). (D) Lipid droplet-associated localization of Hsl-EGFP in fat body cells. Fat body tissue expressing a UAS-Hsl-EGFP transgene driven by Act5c-GAL4 was stained with LipidTOX Deep Red to detect lipid droplets and imaged by confocal fluorescence microscopy. Scale bar: 10 µm. All data are presented as means and SD. Statistical significance was determined by (B) one-way ANOVA (a, p>0.05 vs His6-β-Gal) and (C) one-way ANOVA (a, p<0.05 Act5c>UAS-Hsl vs. UAS-Hsl/+ and b, p<0.05 Act5c>UAS-Hsl vs Act5c>+).
Figure 2 with 1 supplement
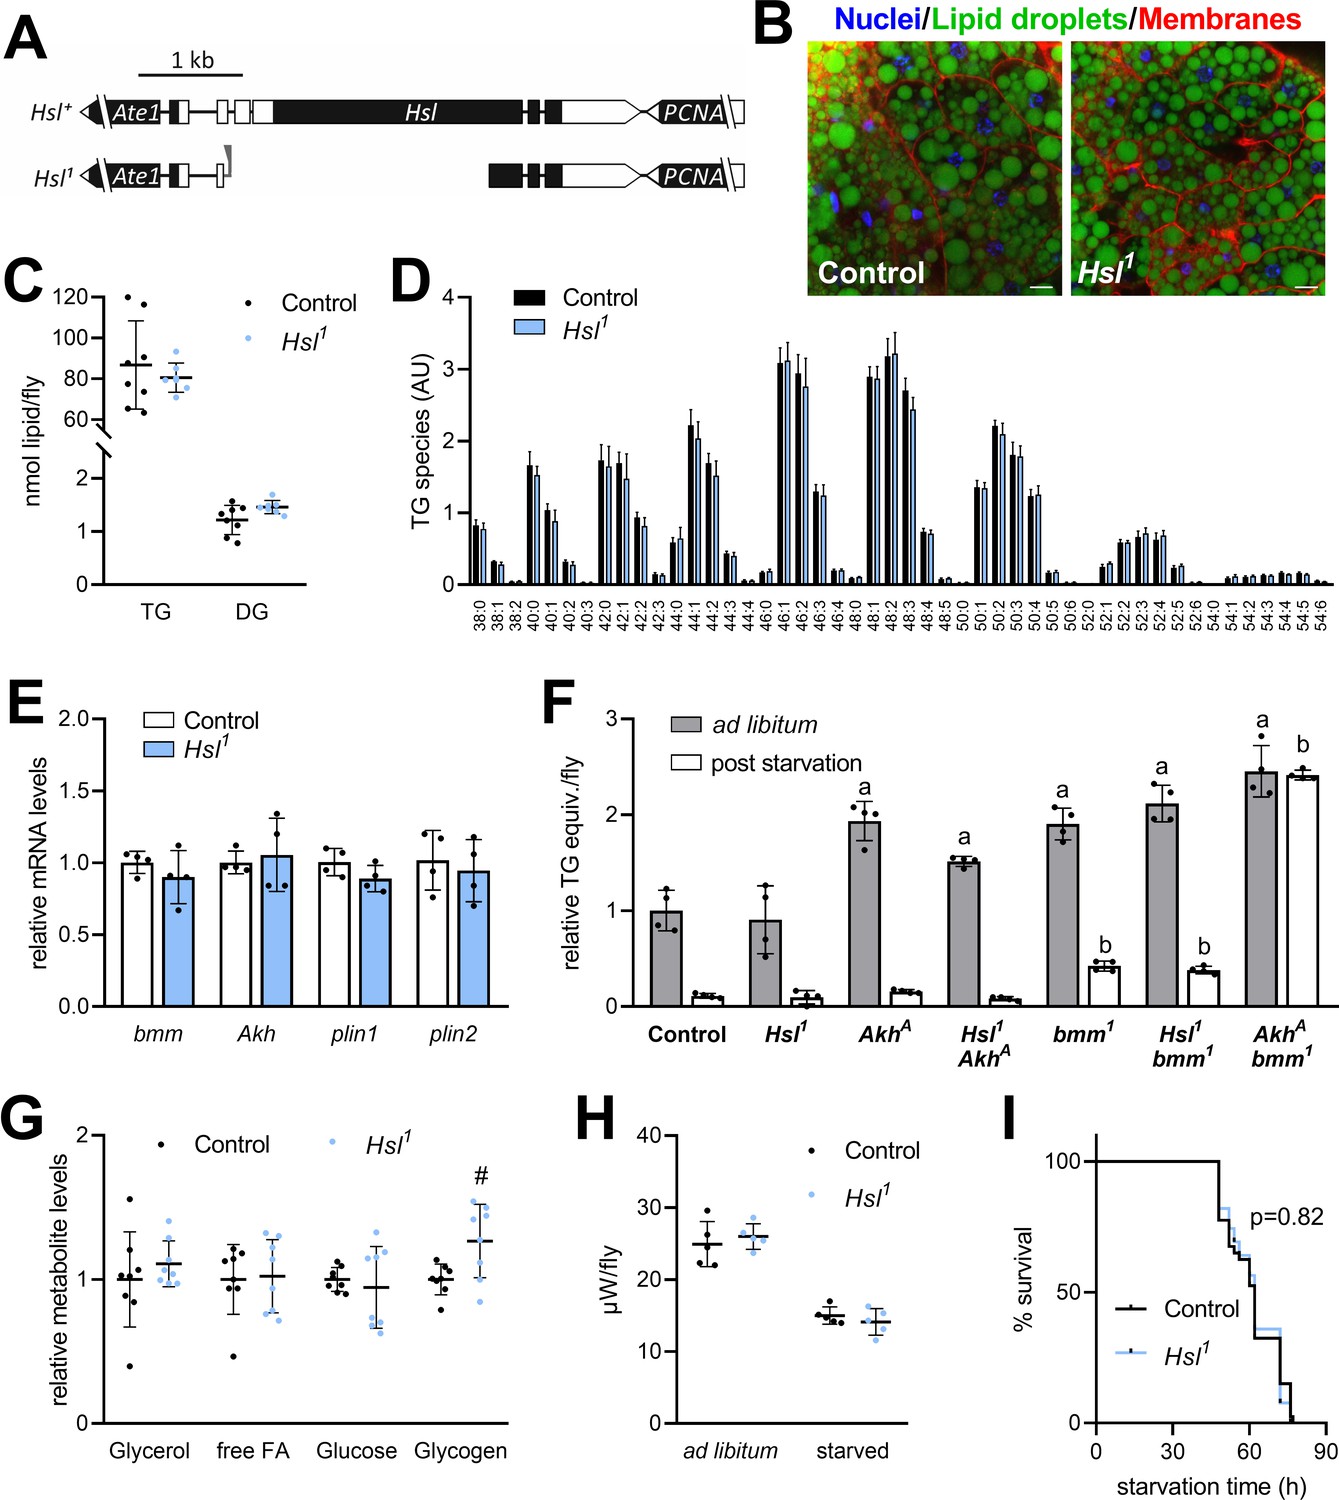
Normal TG and energy metabolism in Hsl1 mutant flies.
(A) Organization of the Hsl genomic region (including the neighboring genes Ate1 and PCNA), the Hsl gene locus and the Hsl1 deletion mutant allele. Black and white boxes represent coding and non-coding exons, respectively. Residual P-element sequences are indicated by a grey triangle. (B) Abdominal fat body tissue of ad libitum fed control and Hsl1 mutant animals was stained with Hoechst 33342, Cellmask Deep Red and BODIPY 493/503 to visualize nuclei, cell membranes and LDs, respectively, and imaged by confocal fluorescence microscopy. Scale bars: 10 µm. (C) Whole-body TG and DG levels of ad libitum fed Hsl1 mutant and control animals as determined by shotgun MS (n = 7–8). (D) TG composition of ad libitum fed Hsl1 and control animals as determined by UPLC-MS (n = 4). (E) Lipolytic gene expression in Hsl1 mutants. Relative mRNA concentrations were determined by qPCR and normalized to controls (n = 4). (F) TG equivalents of ad libitum fed and starved Drosophila mutants. Flies were fed ad libitum for 7 days and TG equivalents were determined by a coupled colorimetric assay either before or after starvation to death (n = 4). (G) Metabolite levels in ad libitum fed Hsl1 mutant and control flies were measured by colorimetric assays (n = 8). (H) Heat dissipation of ad libitum fed or starved Hsl1 mutant and control flies was determined by microcalorimetry (n = 5). (I) Starvation sensitivity of Hsl1 mutant flies. 7-days-old flies were subjected to starvation and survival was monitored every 2–12 hr (n = 39–40). Data are presented as mean and SD (C, D, E, F, G, H) or Kaplan-Meier curve (I). Statistical significance was determined by (C, D, E, G, H) unpaired t-tests (#, p>0.05 compared to control), (F) one-way ANOVA (a, p<0.05 compared to ad libitum fed control; b, p<0.05 compared to starved control) and (I) log-rank test.
Figure 2—figure supplement 1
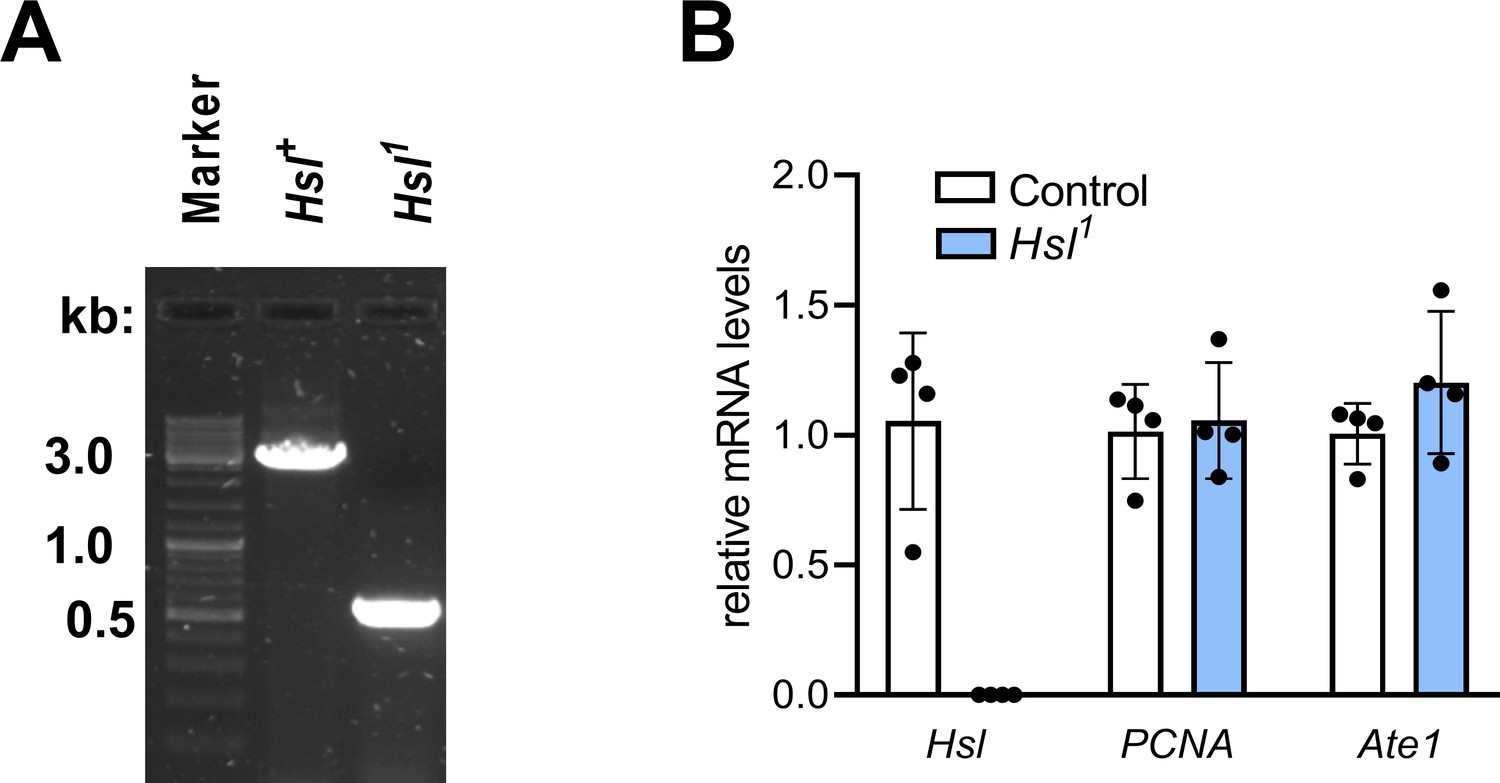
Molecular characterization of the Hsl1 mutant allele.
(A) 1% agarose gel electrophoresis of diagnostic DNA products derived from genotyping PCRs of Hsl+ control and Hsl1 mutant genomic loci. DNA was amplified from fly homogenates using primers flanking the deleted region of the Hsl1 allele. (B) Relative mRNA levels of Hsl, Ate1, and PCNA were determined by qPCR and are normalized to controls (n = 4). Data are presented as mean and SD. Statistical significance was determined by unpaired t-tests (#, p<0.05).
Figure 3
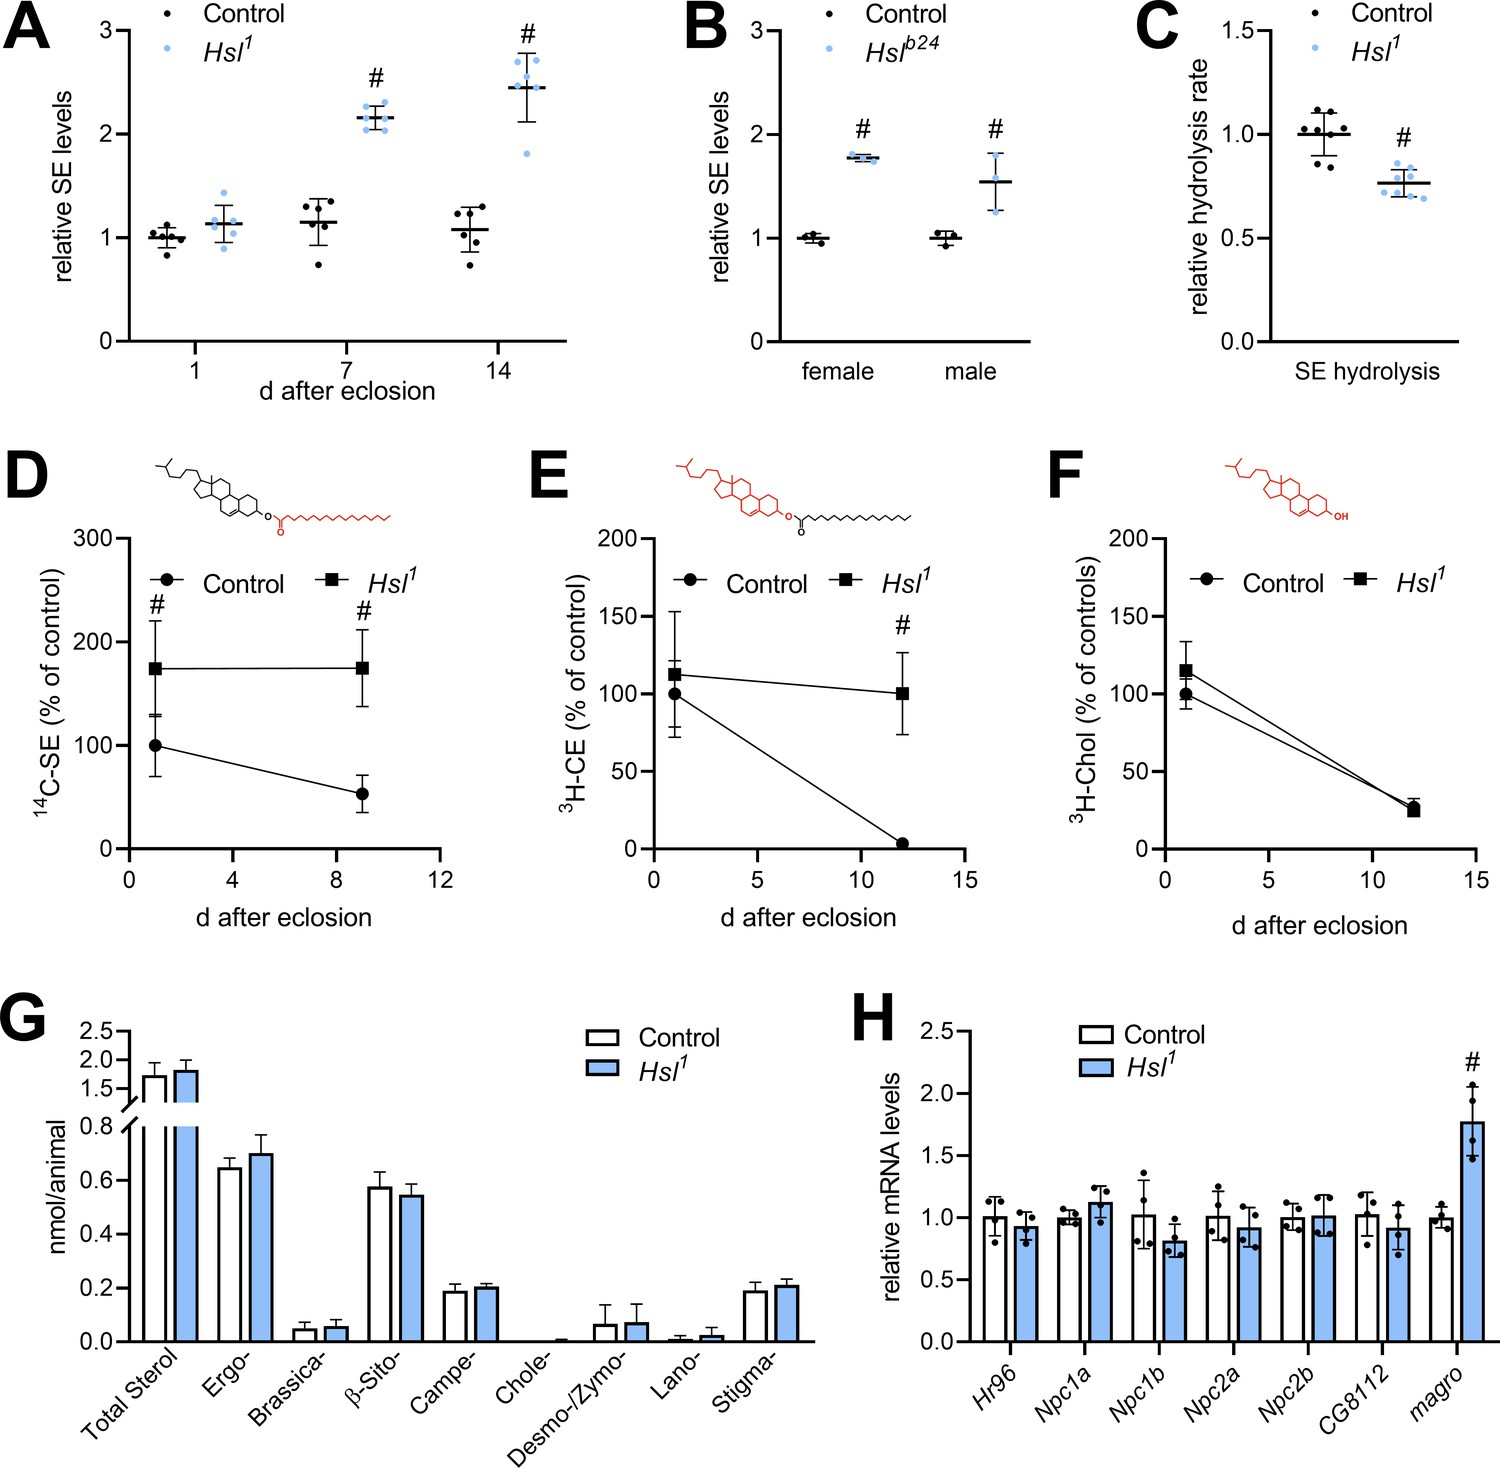
Sterol metabolism in Hsl1 mutant flies.
(A) SE levels in ad libitum fed control and Hsl1 mutant flies at different times after eclosion. Data are normalized to 1-day-old (1d) control animals (n = 6). (B) SE levels in Hslb24 mutant males and females 7 days after eclosion. Data are normalized to controls (n = 3). (C) Normalized neutral SE hydrolase activities of Hsl1 mutant and control abdominal extracts (n = 8). (D–F) Turnover of radiolabeled sterols in Hsl1 mutant animals. Larvae were reared on food containing (D) 14C-FA or (E) 3H-cholesterol, switched to non-labeled food after eclosion and radioactivity in (D, E) SE, and (F) free sterol fractions was determined at the indicated timepoints (n = 4–5). Red and black colors in chemical structures indicate radiolabeled and unlabeled lipid moieties, respectively. (G) Non-esterified sterols in ad libitum fed control and Hsl1 mutant animals as determined by shotgun MS (n = 7–8). (H) Relative mRNA levels of genes involved in sterol transport and metabolism. Relative mRNA levels were determined by qPCR and normalized to controls (n = 4). Data are presented as mean and SD. Statistical significance was determined by unpaired t-tests (#, p<0.05).
Figure 4
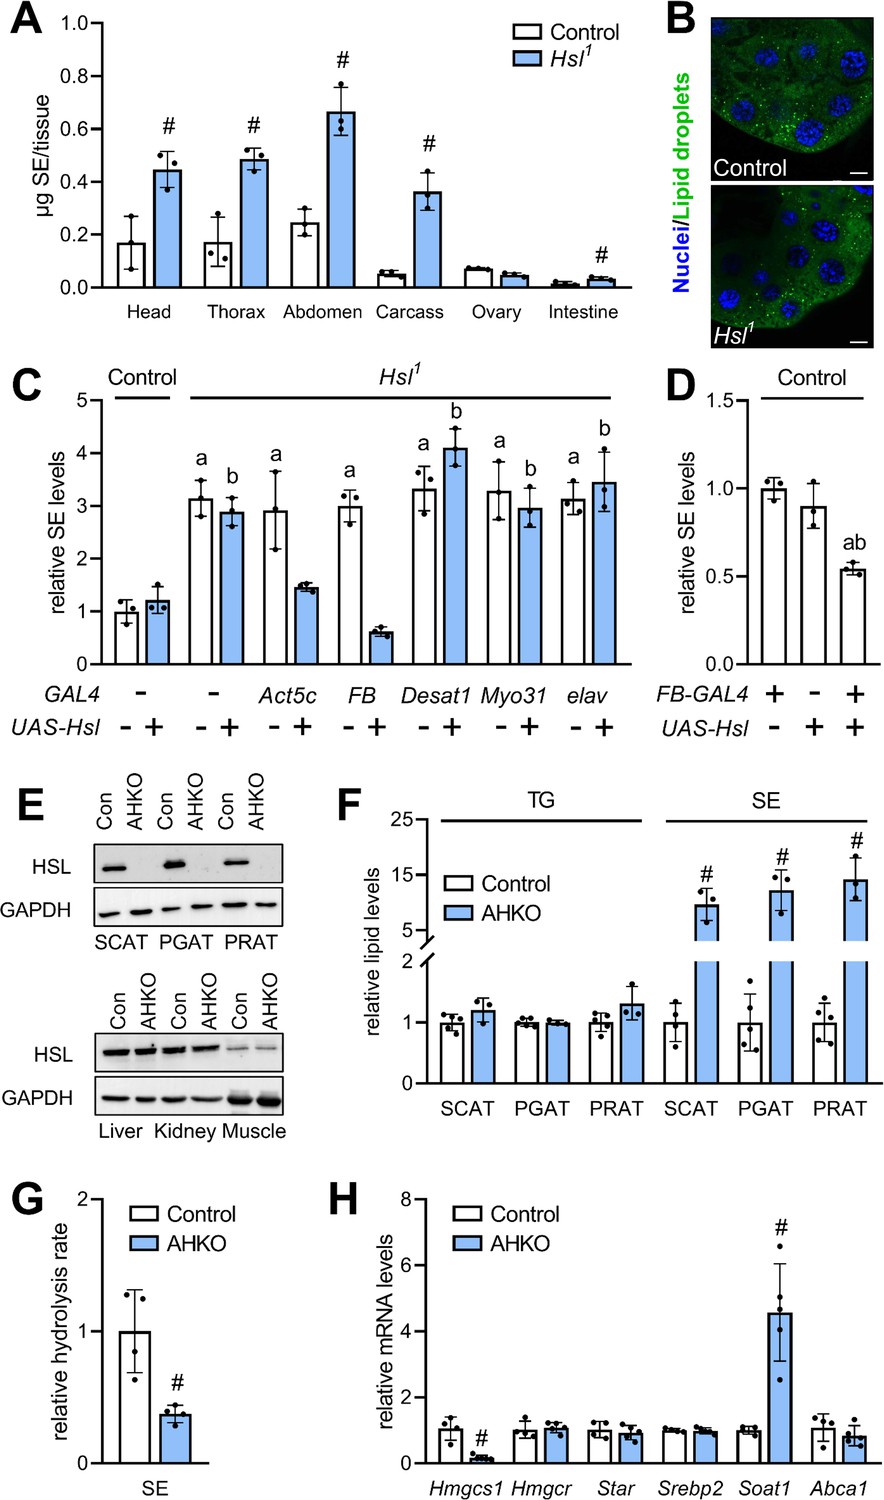
Adipocyte-autonomous control of organismal SE by Hsl.
(A) Distribution of SE in body segments and tissues of adult Hsl1 mutant and control animals (n = 3). (B) Lipid droplets in steroidogenic ring glands of Hsl1 mutant and control prepupae. (C) Whole body SE after GAL4-driven re-expression of UAS-Hsl in all tissues (Act5c), fat body (FB), intestine (Myo31DF), oenocytes (Desat1), or nervous system (elav) of Hsl1 mutant animals. Levels are normalized to controls (n = 3). (D) Relative whole-body SE levels after fat body-specific expression of Hsl in control animals (n = 3). (E) Immunoblotting analysis of HSL in tissues of mice with adipocyte-specific disruption of the HSL gene (AHKO) and controls. GAPDH was used as a control. (F) Relative TG and SE levels in SCAT, PGAT, and PRAT of AHKO and control mice (n = 3–5). (G) SE hydrolase activities in soluble PGAT extracts of control and AHKO mice (n = 4). (H) Relative mRNA levels of sterol metabolism genes in PGAT of control and AHKO mice. mRNA levels were measured by qPCR and are normalized to controls (n = 4–5). Data are presented as means and SD. Statistical significance was determined by (A, F, G, H) unpaired t-tests (#, p<0.05) and (C, D) one-way ANOVA (a, p<0.05 compared to control; b, p<0.05 compared to control + UAS-Hsl).
Figure 5
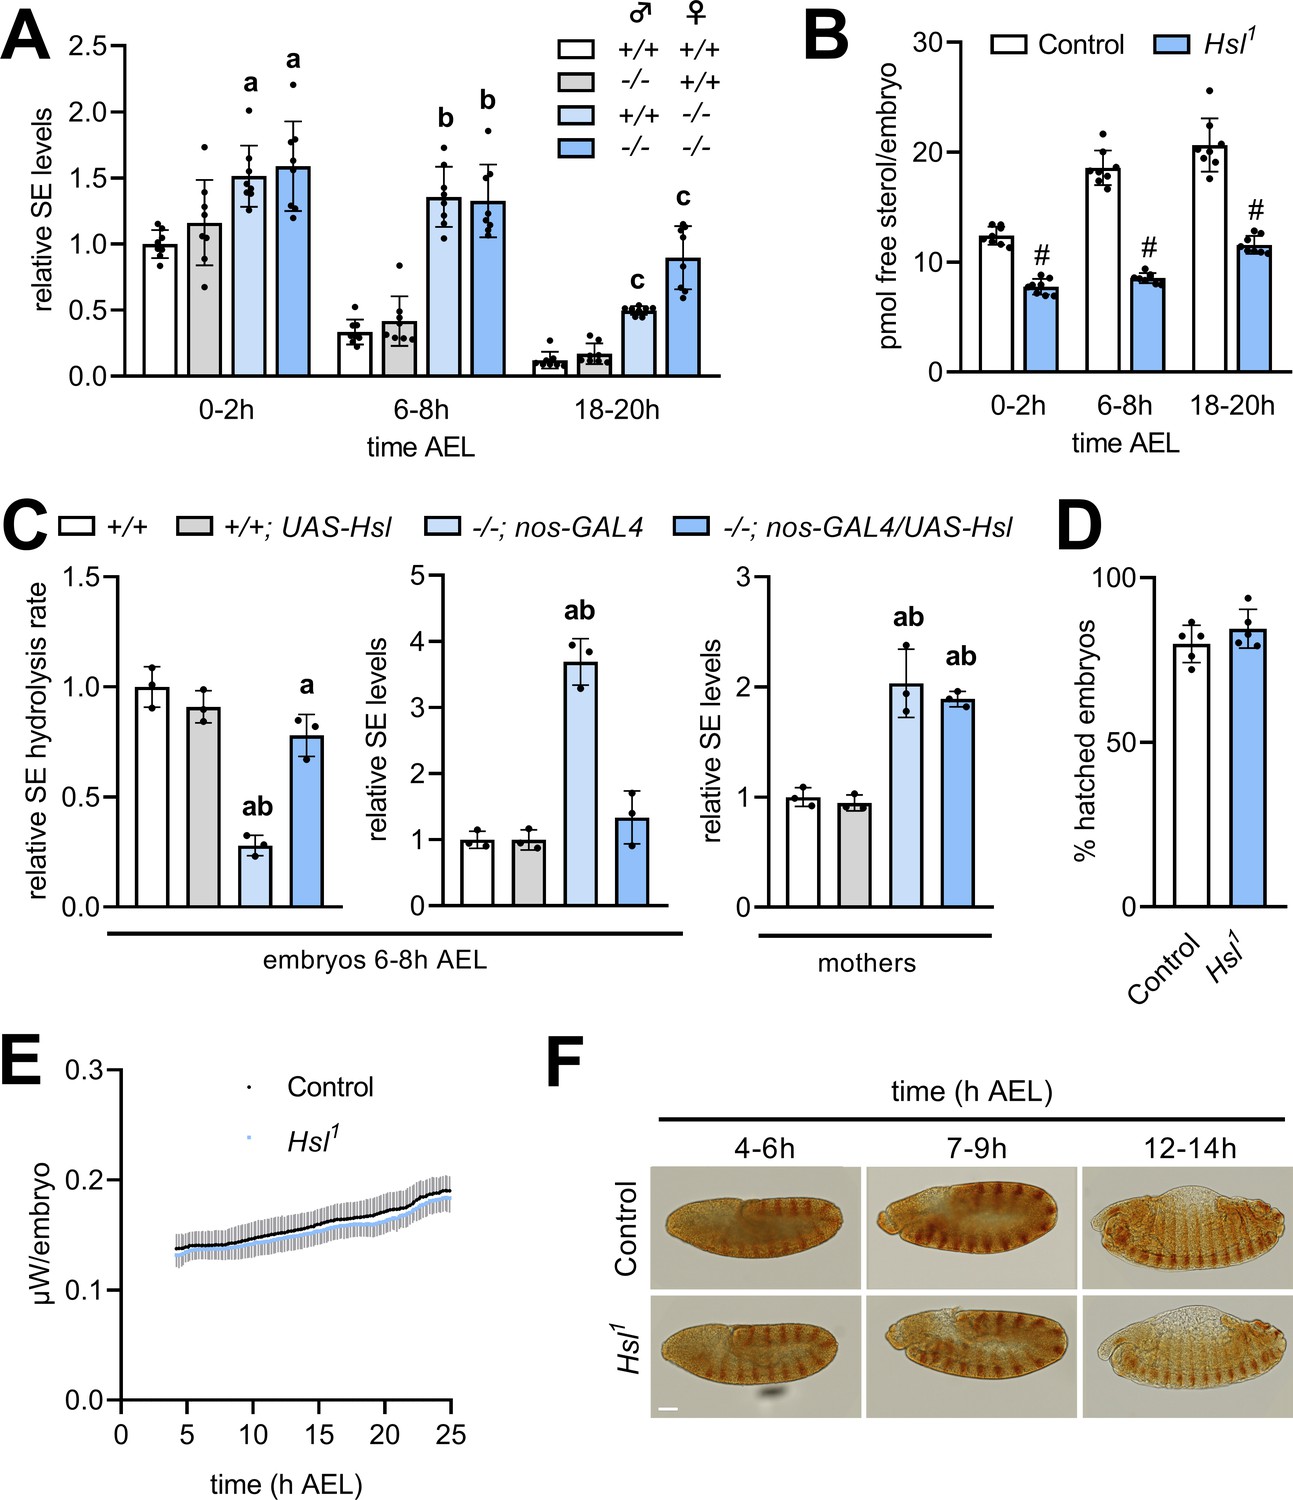
Maternal Hsl determines embryonic sterol homeostasis.
(A) Relative SE levels in embryos derived from reciprocal matings between Hsl1 (-/-) and control (+/+) animals at different times AEL (n = 8). (B) Free sterols in Hsl1 and control embryos at different times AEL (n = 8). (C) Relative SE hydrolysis rates and SE levels in control and Hsl1 mutant embryos and mothers after nos-GAL4-driven re-expression of UAS-Hsl in the germline (n = 3). (D) Hatching rates of control and Hsl1 mutant embryos (n = 5). (E) Heat dissipation rates of control and Hsl1 mutant embryos as determined by microcalorimetry (n = 12). (F) Immunohistochemical detection of Engrailed in control and Hsl1 mutant embryos at different times AEL. Scale bar: 50 µm. Data are presented as means and SD. Statistical significance was determined by (B, D) unpaired t-tests (#, p<0.05), (A) one-way ANOVA (a, b, c, p<0.05 vs +/+ at 0–2 hr, 6–8 hr and 18–20 hr AEL, respectively) and (C) one-way ANOVA (a, p>0.05 vs +/+ and b, p>0.05 vs +/+; UAS-Hsl).
Figure 6 with 1 supplement
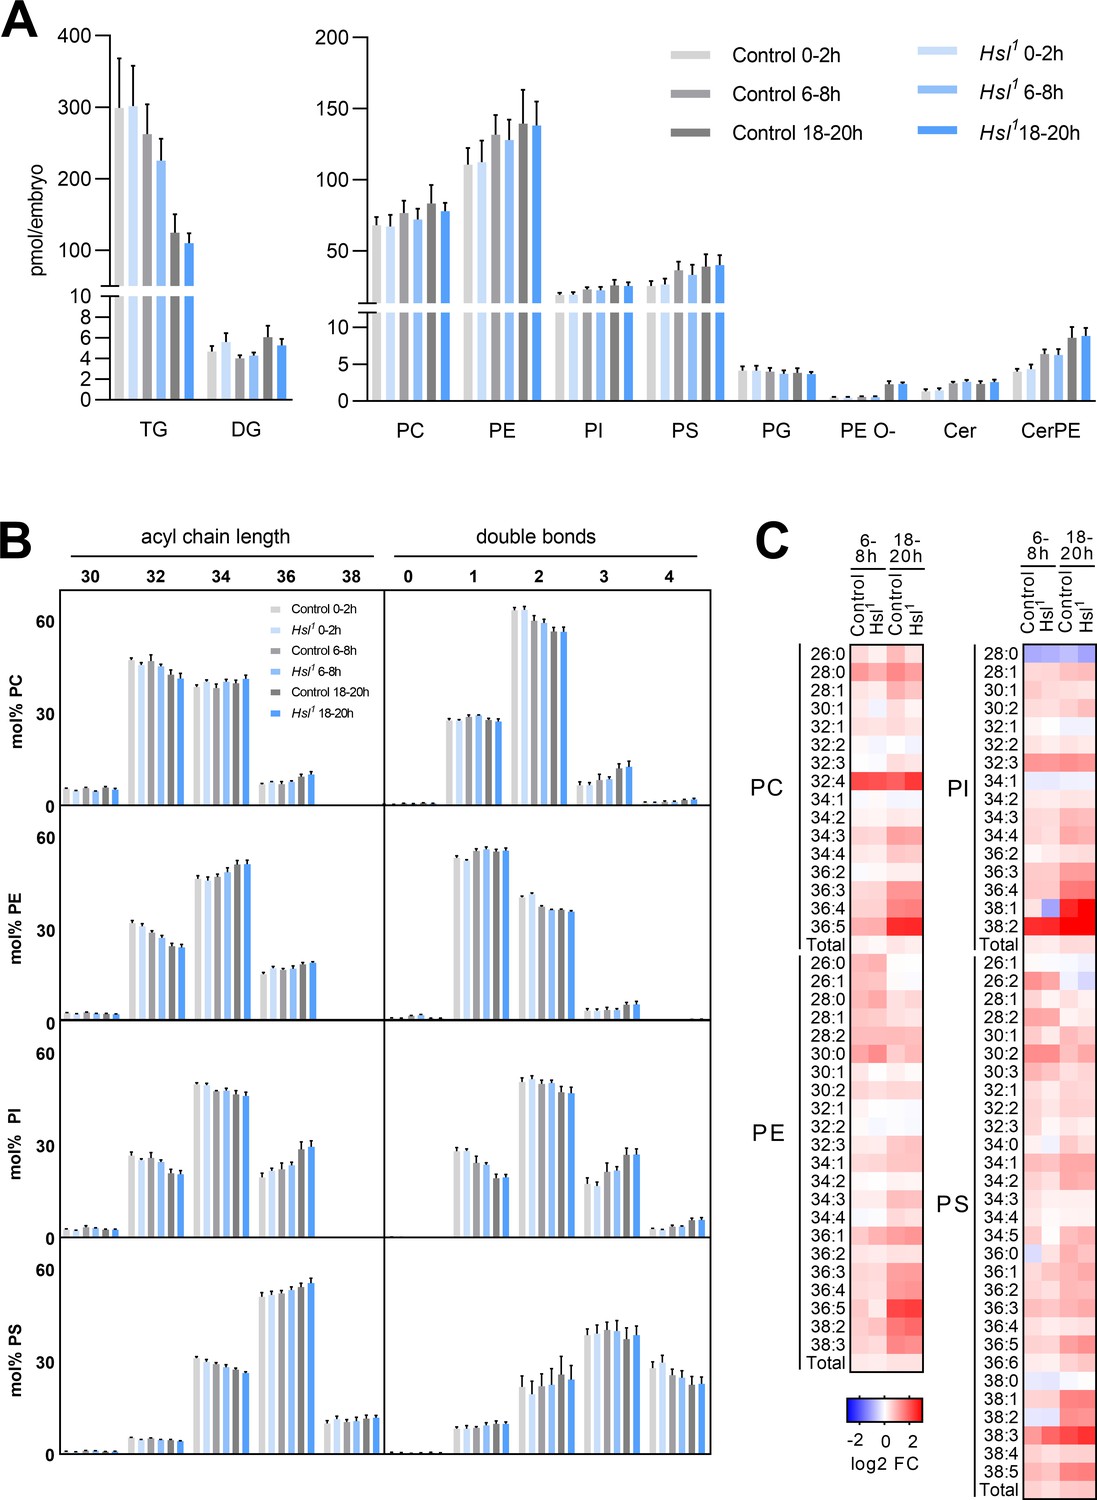
Differentiation of the embryo lipidome in control and Hsl1 mutants.
(A) Total levels of neutral (left panel) and polar (right panel) lipid classes during embryogenesis of control and Hsl1 animals (n = 8). (B) Combined acyl chain lengths and double bonds in major glycerophospholipid classes of control and Hsl1 mutant embryos at different timepoints during embryogenesis (n = 8). (C) Relative changes of individual glycerophospholipid species in control and Hsl1 animals between early (0–2 hr AEL) and mid (6–8 hr AEL) or late (18–20 hr AEL) embryogenesis (n = 8). Data are presented as (A, B) means and SD or (C) log2-transformed fold changes (FC) normalized to early (0–2 hr AEL) control embryos.
Figure 6—figure supplement 1
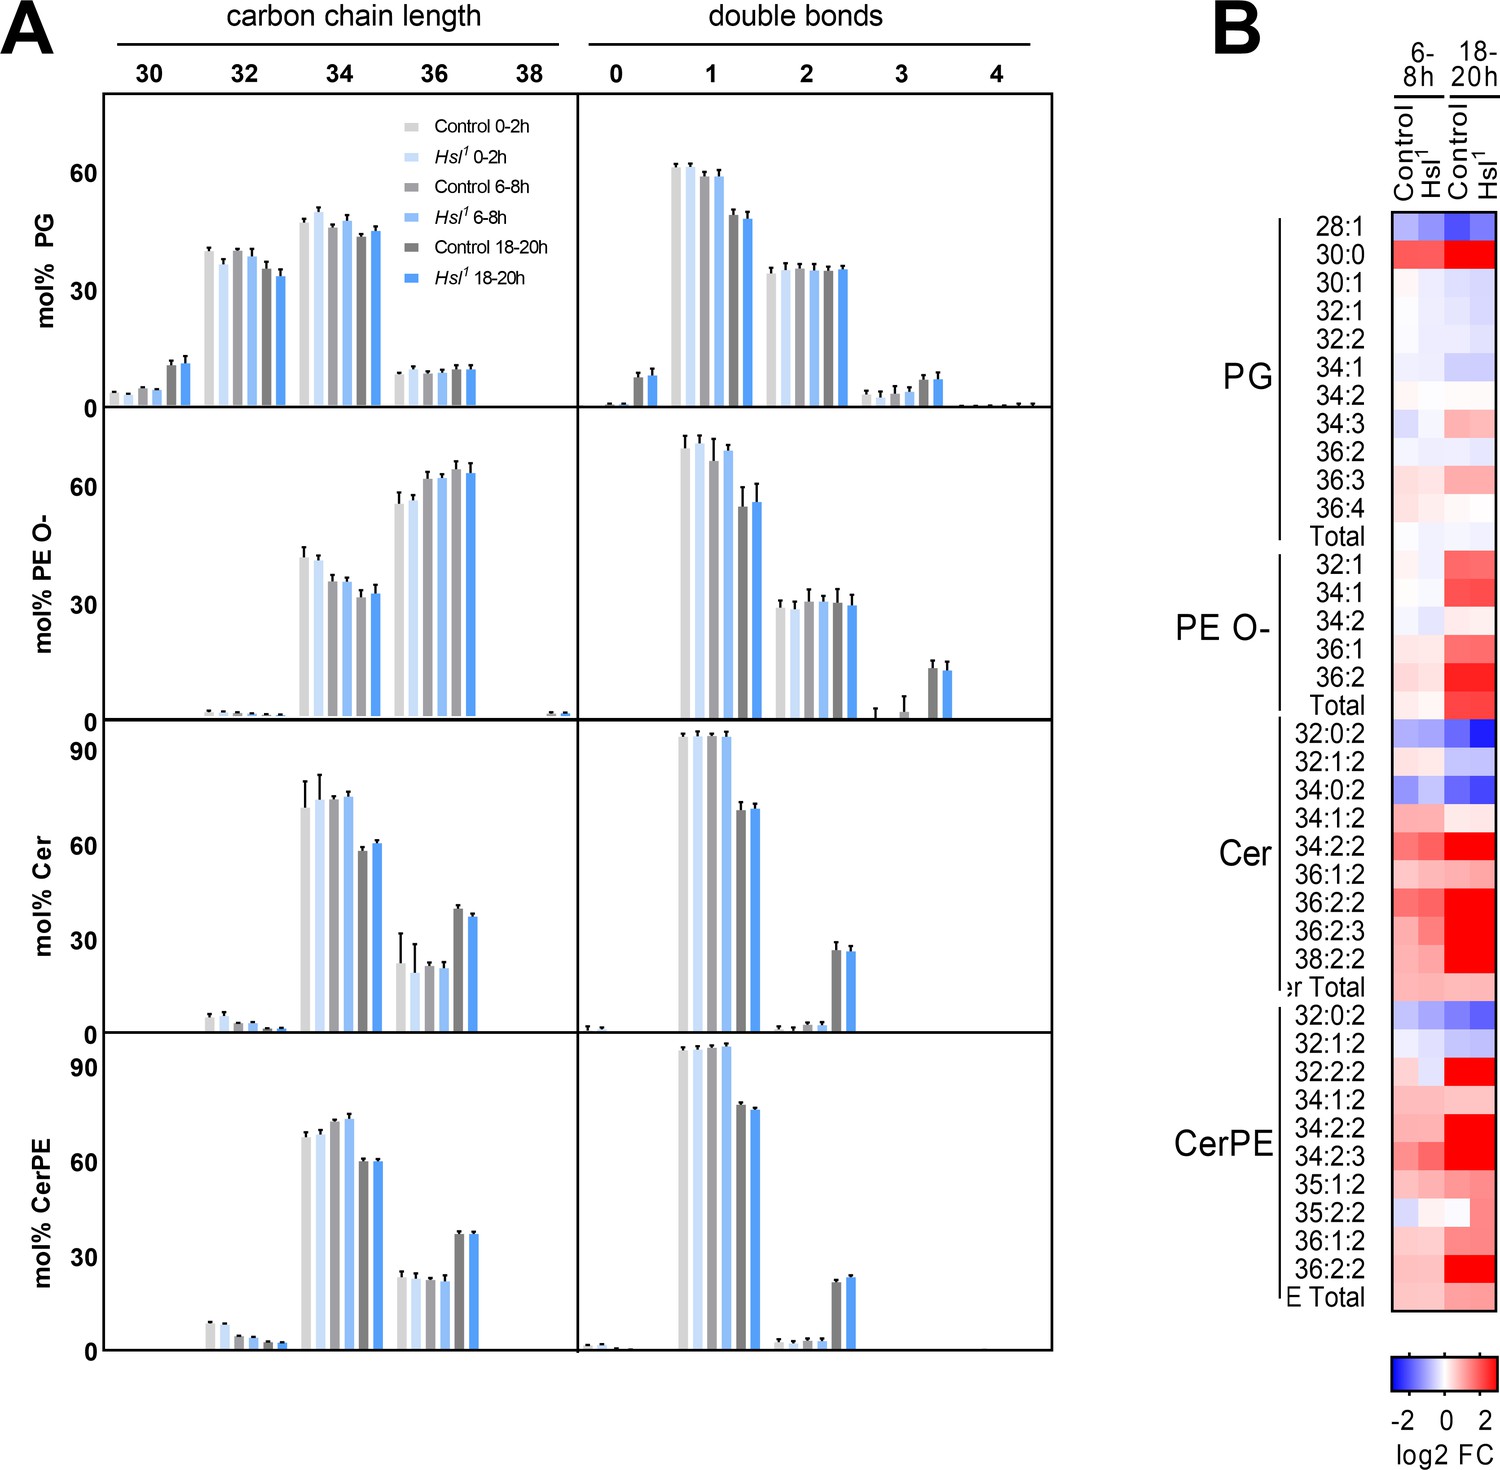
Changes in the lipidome during embryogenesis in control and Hsl1 mutants.
(A) Combined acyl chain lengths and double bonds in PG, PE O-, Cer, and CerPE (n = 8). Relative changes of individual glycerophospholipid species in control and Hsl1 animals between early (0–2 hr AEL) and mid (6–8 hr AEL) or late (18–20 hr AEL) embryogenesis (n = 8). Data are presented as (A, B) means and SD or (C) log2-transformed fold changes (FC) normalized to early (0–2 hr AEL) control embryos.
Figure 7 with 1 supplement

Impaired fecundity and egg loading in Hsl1 mutant flies.
(A, B) Cumulative numbers of eggs and hatched 1st instar larvae per female on (A) LDM (n = 25–28) or (B) LDM with 0.01% cholesterol (n = 29). Note that LDM contains only traces of sterols and other lipids. (C) Lipid loading in control and Hsl1 mutant oocytes. Stage 10 follicles were stained with Hoechst 33342, BODIPY 493/503, and Cellmask Deep Red to detect nuclei, lipid droplets, and cell membranes, respectively, and imaged by confocal fluorescence microscopy. Scale bars: 50 µm. (D) Transfer of 3H-cholesterol into control and Hsl1 mutant embryos collected at different times after mating (n = 9–10). (E, F) Cumulative numbers of eggs and hatched 1st instar larvae per female upon (E) fat-body-specific RNAi-mediated downregulation of Hsl expression by means of a Cg-GAL4-driven Hsl shRNA transgene (n = 32–34) and (F) fat-body-specific rescue of Hsl expression in Hsl1 mutants by means of a FB-GAL4-driven UAS-Hsl transgene (n = 33–34). Data are presented as means and SD. Statistical difference was determined by (A,B,D) unpaired t-tests (#, p<0.05 vs control), (E) one-way ANOVA (a, c, p<0.05 vs Cg>+ at 4 days and 7 days after mating; b, d, p<0.05 vs Hsl shRNA/+ at 4 days and 7 days after mating) and (F) one-way ANOVA (a,b,c p>0.05 vs FB>+ at 2 days, 4 days, and 7 days after mating, respectively).
Figure 7—figure supplement 1
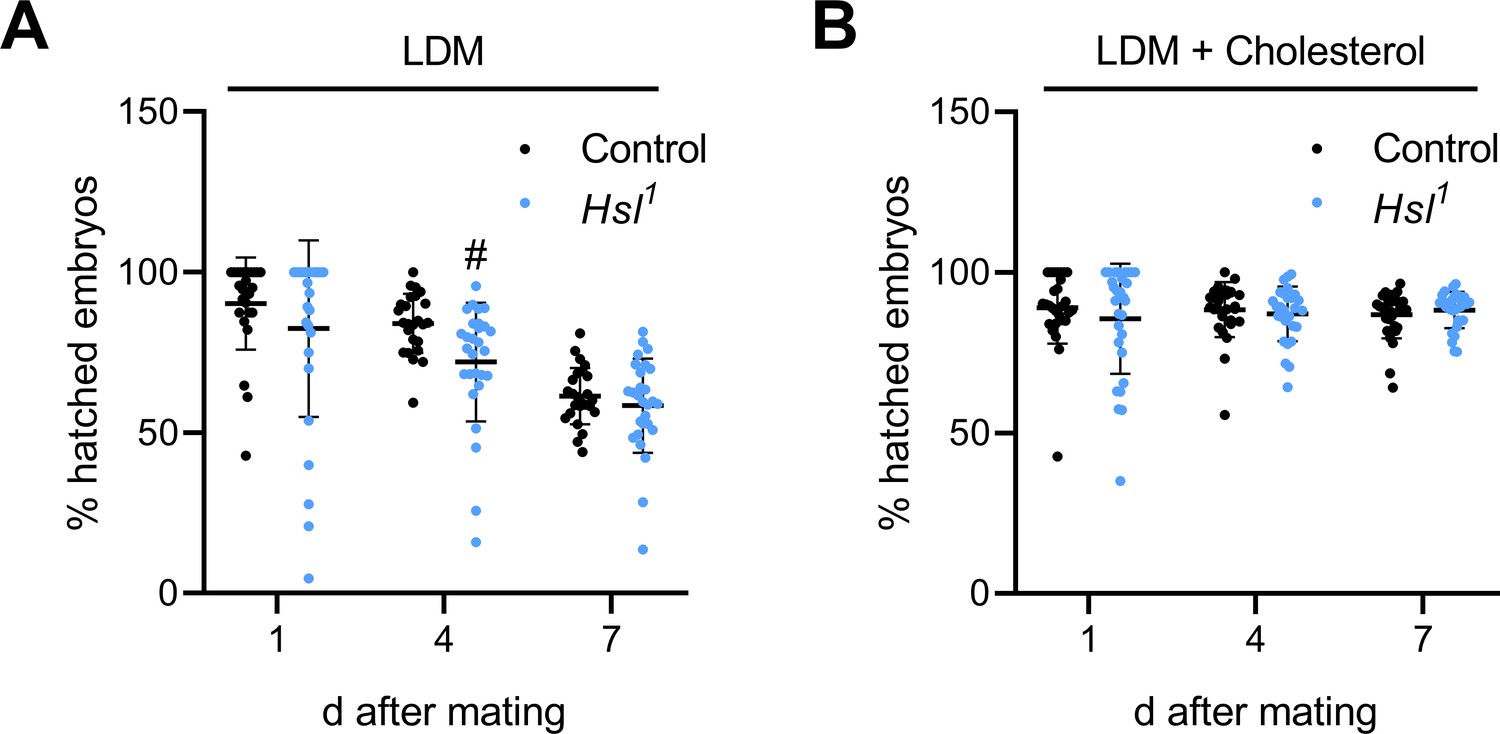
Hatching rates of control and Hsl1 mutant embryos.
Hatching rates of control and Hsl1 mutant embryos on (A) LDM (n = 25–28) and (B) LDM supplemented with 0.01% cholesterol (n = 29) were calculated from data depicted in Figure 7A,B. Data are presented as means and SD. Statistical difference was determined by unpaired t-tests (#, p<0.05 vs control).
Tables
Key resources table
| Reagent type (species) or resource | Designation | Source or reference | Identifiers | Additional information |
|---|---|---|---|---|
| Strain, strain background (Drosophila melanogaster) | w1118 | Vienna Drosophila Research Center (VDRC) | Cat#: 60000 | |
| Genetic reagent (Drosophila melanogaster) | Hsl1 | This study | See Materials and methods | |
| Genetic reagent (Drosophila melanogaster) | UAS-Hsl | This study | See Materials and methods | |
| Genetic reagent (Drosophila melanogaster) | UAS-Hsl-EGFP | This study | See Materials and methods | |
| Genetic reagent (Drosophila melanogaster) | bmm1 | Grönke et al., 2005 doi: 10.1016/j.cmet.2005.04.003 | FLYB: FBal0195572 | |
| Genetic reagent (Drosophila melanogaster) | AkhA | Gáliková et al., 2015 doi: 10.1534/genetics.115.178897 | FLYB: FBal0319563 | |
| Genetic reagent (Drosophila melanogaster) | FB-GAL4 | Grönke et al., 2003 doi: 10.1016/s0960-9822(03)00175–1 | ||
| Genetic reagent (Drosophila melanogaster) | Act5c-GAL4 | Bloomington Drosophila Stock Center (BDSC) | Cat#: 4414 FLYB: FBst0004414 | backcrossed to a w1118 strain |
| Genetic reagent (Drosophila melanogaster) | Cg-GAL4 | Bloomington Drosophila Stock Center (BDSC) | Cat#: 7011 FLYB: FBst0007011 | |
| Genetic reagent (Drosophila melanogaster ) | nos-GAL4 | Bloomington Drosophila Stock Center (BDSC) | Cat#: 64277 FLYB: FBst0064277 | |
| Genetic reagent (Drosophila melanogaster) | Hsl shRNA | Bloomington Drosophila Stock Center (BDSC) | Cat#: 65148 FLYB: FBst0065148 | |
| Cell line (Chlorocebus aethiops) | COS-7 | American Type Culture Collection (ATCC) | Cat#: CRL-1651 RRID: CVCL_0224 | |
| Antibody | Anti-Mouse IgG-Horseradish Peroxidase antibody; sheep | GE Healthcare | Cat#:NA931 RRID: AB_772210 | WB (1:5,000) |
| Antibody | Anti-Rabbit IgG (H+L)-Horseradish Peroxidase antibody; goat polyclonal | Vector Laboratories | Cat#: PI-1000 RRID: AB_2336198 | WB (1:5,000) |
| Antibody | Anti-engrailed/invected antibody; mouse monoclonal | Developmental Studies Hybridoma Bank (DSHB) | Cat#: 4D9 RRID: AB_528224 | IHC (1:100) |
| Antibody | HSL antibody; rabbit polyclonal | Cell Signaling Technology | Cat#: 4107 RRID: AB_2296900 | WB (1:1,000) |
| Antibody | Rabbit Anti-GAPDH antibody, unconjugated, clone 14C10; rabbit monoclonal | Cell Signaling Technology | Cat#: 2118 RRID: AB_561053 | WB (1:10,000) |
| Antibody | Anti-His antibody, unconjugated; mouse monoclonal | GE Healthcare | Cat#: 27-4710-01 RRID: AB_771435 | WB 1:5000 |
| Recombinant DNA reagent | pFLC-1 [Hsl] | Drosophila Genomics Resource Center (DGRC) | Cat#: RE52776 | Used for amplification of Hsl cDNA |
| Transfected construct (D. melanogaster) | pcDNA4/Hismax C [His6-Hsl] | This study | See Materials and methods | |
| Recombinant DNA reagent | pUAST [Hsl] | This study | See Materials and methods | |
| Recombinant DNA reagent | pUAST [Hsl-EGFP] | This study | See Materials and methods | |
| Sequence-based reagent | Oligonucleotides, Primers | Thermo Fisher Scientific Invitrogen | See Materials and methods | |
| Commercial assay or kit | Triglycerides reagent | Thermo Fisher Scientific | Cat#: 981786 | |
| Commercial assay or kit | NEFA-HR(2) | Fujifilm Wako Diagnostics | Cat#: 999–34691, Cat#: 995–34791 Cat#: 991–34891 Cat#: 993–35191 Cat#: 276–76491 | |
| Commercial assay or kit | Glucose (GO) Assay kit | Sigma Aldrich | Cat#: GAGO20-1KT | |
| Commercial assay or kit | RNeasy Mini kit | QIAGEN | Cat#: 74104 | |
| Commercial assay or kit | QIAGEN Plasmid Midi Kit | QIAGEN | Cat#: 12143 | |
| Commercial assay or kit | TRIzol | Thermo Fisher Scientific Invitrogen | Cat#: 15596026 | |
| Commercial assay or kit | SuperScript III First-Strand Synthesis Supermix | Thermo Fischer Scientific Invitrogen | Cat#: 18080051 | |
| Commercial assay or kit | QuantiTect Reverse Transcription Kit | QIAGEN | Cat#: 205313 | |
| Commercial assay or kit | iTaq Universal SYBR Green Supermix | Bio-Rad | Cat#: 1725120 | |
| Chemical compound, drug | BODIPY 493/503 | Thermo Fisher Scientific Invitrogen | Cat#: B2103 | 5 µg/ml |
| Chemical compound, drug | Hoechst 33342 | Sigma Aldrich | Cat#: 14533 | 5 µg/ml |
| Chemical compound, drug | CellMask Deep Red | Thermo Fisher Scientific Life Technologies | Cat#: C10046 | 1 µg/ml |
| Chemical compound, drug | LipidTOX Deep Red | Thermo Fisher Scientific Life Technologies | Cat#: H3477 | (1:1,000) |
| Chemical compound, drug | Lipid standards | Avanti Polar Lipids Sigma Aldrich Toronto Research Chemicals | See Materials and methods | |
| Chemical compound, drug | Cholesterol | Sigma Aldrich | Cat#: C3045 | |
| Chemical compound, drug | Cholesterol [25,26–3H] | American Radiolabeled Chemicals | Cat#: ART-1987 | |
| Software, algorithm | LipidXplorer 1.2.7 | Herzog et al., 2012 doi:10.1371/journal.pone.0029851 | ||
| Software, algorithm | Lipid Data Analyzer | Hartler et al., 2011 doi:10.1093/bioinformatics/btq699 |
Table 1
Drosophila strains used in the study.
| Name in text/figure | Full genotype | ID/Reference |
|---|---|---|
| Control or +/+ | w1118; +; + | VDRC 60000 |
| Hsl1 or -/- | w1118; Hsl1; + | This study |
| Hslb24 | w1118; Hslb24; + | Bi et al., 2012 |
| AkhA | w1118; +; AkhA | Gáliková et al., 2015 |
| bmm1 | w1118; +; bmm1 | Gáliková et al., 2017 |
| AkhA bmm1 | w1118; +; AkhA bmm1 | This study |
| Hsl1 bmm1 | w1118; Hsl1; bmm1 | This study |
| Hsl1 AkhA | w1118; Hsl1; AkhA | This study |
| UAS-Hsl or +/+; UAS-Hsl | w1118; +; P{w+mC Hsl [Scer\UAS]=UAS-Hsl}/+ | This study |
| Act5c> | w*; P{w+mC=Act5C-GAL4}25FO1/+; + | BDSC 4414 |
| Act5c>UAS-Hsl | w*; P{w+mC=Act5C-GAL4}25FO1/+; P{w+mC Hsl [Scer\UAS]=UAS-Hsl}/+ | This study, BDSC 4414 |
| Hsl1 UAS-Hsl or -/- UAS-Hsl | w1118; Hsl1; P{w+mC Hsl [Scer\UAS]=UAS-Hsl}/+ | This study |
| Hsl1 Act5c | w*; Hsl1 P{w+mC=Act5C-GAL4}25FO1/Hsl1; + | This study, BDSC 4414 |
| Hsl1 Act5c UAS-Hsl | w*; Hsl1 P{w+mC=Act5C-GAL4}25FO1/Hsl1; P{w+mC Hsl [Scer\UAS]=UAS-Hsl}/+ | This study, BDSC 4414 |
| FB>+ or FB-GAL4 | w*; P{w+mW.hs=GawB}FB/+; + | Grönke et al., 2003 |
| Hsl1 FB | w*; Hsl1 P{w+mW.hs=GawB}FB/Hsl1; + | This study |
| Hsl1 FB UAS-Hsl | w*; Hsl1 P{w+mW.hs=GawB}FB/Hsl1; P{w+mC Hsl [Scer\UAS]=UAS-Hsl}/+ | This study |
| Hsl1 Myo31DF | w*; Hsl1 P{w+mW.hs=GawB}Myo31DFNP0001/Hsl1; + | This study, BDSC 67088 |
| Hsl1 Myo31DF UAS-Hsl | w*; Hsl1 P{w+mW.hs=GawB}Myo31DFNP0001/Hsl1; P{w+mC Hsl [Scer\UAS]=UAS-Hsl}/+ | This study, BDSC 67088 |
| Hsl1 Desat1 | w*; Hsl1 P{w+mC=Desat1-GAL4.E800}2M/Hsl1; + | This study, BDSC 65404 |
| Hsl1 Desat1 UAS-Hsl | w*; Hsl1 P{w+mC=Desat1-GAL4.E800}2M/Hsl1; P{w+mC Hsl [Scer\UAS]=UAS-Hsl}/+ | This study, BDSC 65404 |
| Hsl1 elav | w*; Hsl1; P{w+mC=GAL4-elav.L}3/+ | This study, BDSC 8760 |
| Hsl1 elav UAS-Hsl | w*; Hsl1; P{w+mC=GAL4-elav.L}3/ P{w+mC Hsl [Scer\UAS]=UAS-Hsl} | This study, BDSC 8760 |
| -/-; nos-GAL4 | w*; Hsl1; P{w+mC=GAL4::VP16-nos.UTR}1C/+ | This study, BDSC 64277 |
| -/-; nos-GAL4/UAS-Hsl | w*; Hsl1; P{w+mC=GAL4::VP16-nos.UTR}1C/ P{w+mC Hsl [Scer\UAS]=UAS-Hsl} | This study, BDSC 64277 |
| Cg>+ | w[1118]/y[1] v[1]; P{w[+mC]=Cg-GAL4.A}2/ P{y[+t7.7]=CaryP}attP40; + | BDSC 7011 and BDSC 36304 |
| Hsl shRNA/+ | w[1118]/y[1] sc[*] v[1] sev[21]; P{y[+t7.7] v[+t1.8]=TRiP.HMC05951}attP40/+; + | BDSC 65148 and VDRC 60000 |
| Cg>Hsl shRNA | w[1118]/y[1] sc[*] v[1] sev[21]; P{y[+t7.7] v[+t1.8]=TRiP.HMC05951}attP40/ P{w[+mC]=Cg-GAL4.A}2; + | BDSC 7011 and BDSC 65148 |
Table 2
List of primers used for RT-qPCR.
| Gene symbol | Primer sequences | ID/Reference |
|---|---|---|
| rp49/RpL32 | fw: 5‘-CTTCATCCGCCACCAGTC-3‘ rv: 5‘-CGACGCACTCTGTTGTCG-3‘ | |
| plin1 | fw: 5‘-GCGCGAATTCTGGCGCCCCTAGATG-3‘ rv: 5‘-CACAGAAGTAAGGTTCCTTCACAAAGATCC-3‘ | |
| plin2 | fw: 5’-TCAAATTGCCCGTGGTAAA-3’ rv: 5’-CCCATTCGAAGACACGATTT-3’ | |
| Akh | - | QIAGEN QuantiTect QT00957859 |
| bmm | - | QIAGEN QuantiTect QT00964460 |
| Hr96 | fw: 5’-CCAGCGAGGCTCTTTATGAT-3’ rv: 5’-GGTTGTGGCGAGTGTCGT-3’ | |
| Npc1a | fw: 5’-GTCGAGGAACTTTGCAGGGA-3’ rv: 5’-TCATCGAAACAGGACTGCGT-3’ | |
| Npc1b | fw: 5’-CGGATTTTGTTCCAGCAACT-3’ rv: 5’-CCATTCTCAGTAAATCCTCGTTC-3’ | |
| Npc2a | fw: 5’-ACAGTCGTCCACGGCAAG-3’ fw: 5’-ACACAGGCATCGGGATTG-3’ | |
| Npc2b | fw: 5‘-GGAGATCCACTGGGGATTG-3‘ rv: 5‘-CCTTGATTTTGGCGGGTAT-3‘ | |
| CG8112 | fw: 5’-CACAAACTGAAACCGCACAG-3’ rv: 5’-CGACACGAAACAGAAGACCA-3’ | |
| magro | fw: 5’-ACACCGAACTGATTCCGAAC-3’ rv: 5’-ATCCACCATTGGCAAACATT-3’ | |
| Hsl | fw: 5‘-CTGGAGGCGACCTATGGAAC-3‘ rv: 5‘-GCTCGTCAAAATCGTACTCGTG-3‘ | |
| PCNA | fw: 5‘-GCGACCGCAATCTCTCCAT-3‘ rv: 5‘-CGCCTTCATCGTCACATTGT-3‘ | |
| Ate1 | fw: 5‘-GCATACTTCGCCGCATAAATCG-3‘ rv: 5‘-CTATGGCGTAATCGGCATCGG-3‘ | |
| MmAbca1 | fw: 5’-GATGTGGAATCGTCCCTCAGTTC-3’ rv: 5’-ACTGCTCTGAGAAACACTGTCCTCC-3’ | |
| MmSoat1 | fw: 5’-GAAACCGGCTGTCAAAATCTGGR-3’ rv: 5’-TGTGACCATTTCTGTATGTGTCC-3’ | |
| MmHmgcs1 | fw: 5’-GACAAGAAGCCTGCTGCCATA-3’ rv: 5’-CGGCTTCACAAACCACAGTCT-3’ | |
| MmHmgcr | fw: 5’-TGCACGGATCGTGAAGACA-3’ rv: 5’-GTCTCTCCATCAGTTTCTGAACCA-3’ | |
| MmSrebp2 | fw: 5’-GCGCCAGGAGAACATGGT-3’ rv: 5’-CGATGCCCTTCAGGAGCTT-3’ | |
| MmStar | fw: 5’-TTGGGCATACTCAACAACCA-3’ rv: 5’-GAAACACCTTGCCCACATCT-3’ | |
| Mm36B4 | fw: 5’-GCTTCATTGTGGGAGCAGACA-3’ rv: 5’-CATGGTGTTCTTGCCCATCAG-3’ |
Additional files
-
Supplementary file 1
Composition of the lipidome.
- https://cdn.elifesciences.org/articles/63252/elife-63252-supp1-v2.xlsx
-
Transparent reporting form
- https://cdn.elifesciences.org/articles/63252/elife-63252-transrepform-v2.docx
Download links
A two-part list of links to download the article, or parts of the article, in various formats.
Downloads (link to download the article as PDF)
Open citations (links to open the citations from this article in various online reference manager services)
Cite this article (links to download the citations from this article in formats compatible with various reference manager tools)
Hormone-sensitive lipase couples intergenerational sterol metabolism to reproductive success
eLife 10:e63252.
https://doi.org/10.7554/eLife.63252


