Nano-scale architecture of blood-brain barrier tight-junctions
- Department of Developmental Biology and Cancer Research, Hebrew University of Jerusalem, Israel
- Racah Institute of Physics, Hebrew University of Jerusalem, Israel
- Department of Physiology and Cell Biology, Ben-Gurion University of the Negev, Israel
- Theodor Kocher Institute, University of Bern, Switzerland
- Department of Microbiology and Molecular Genetics, Hebrew University of Jerusalem, Israel
Figures
Figure 1 with 1 supplement
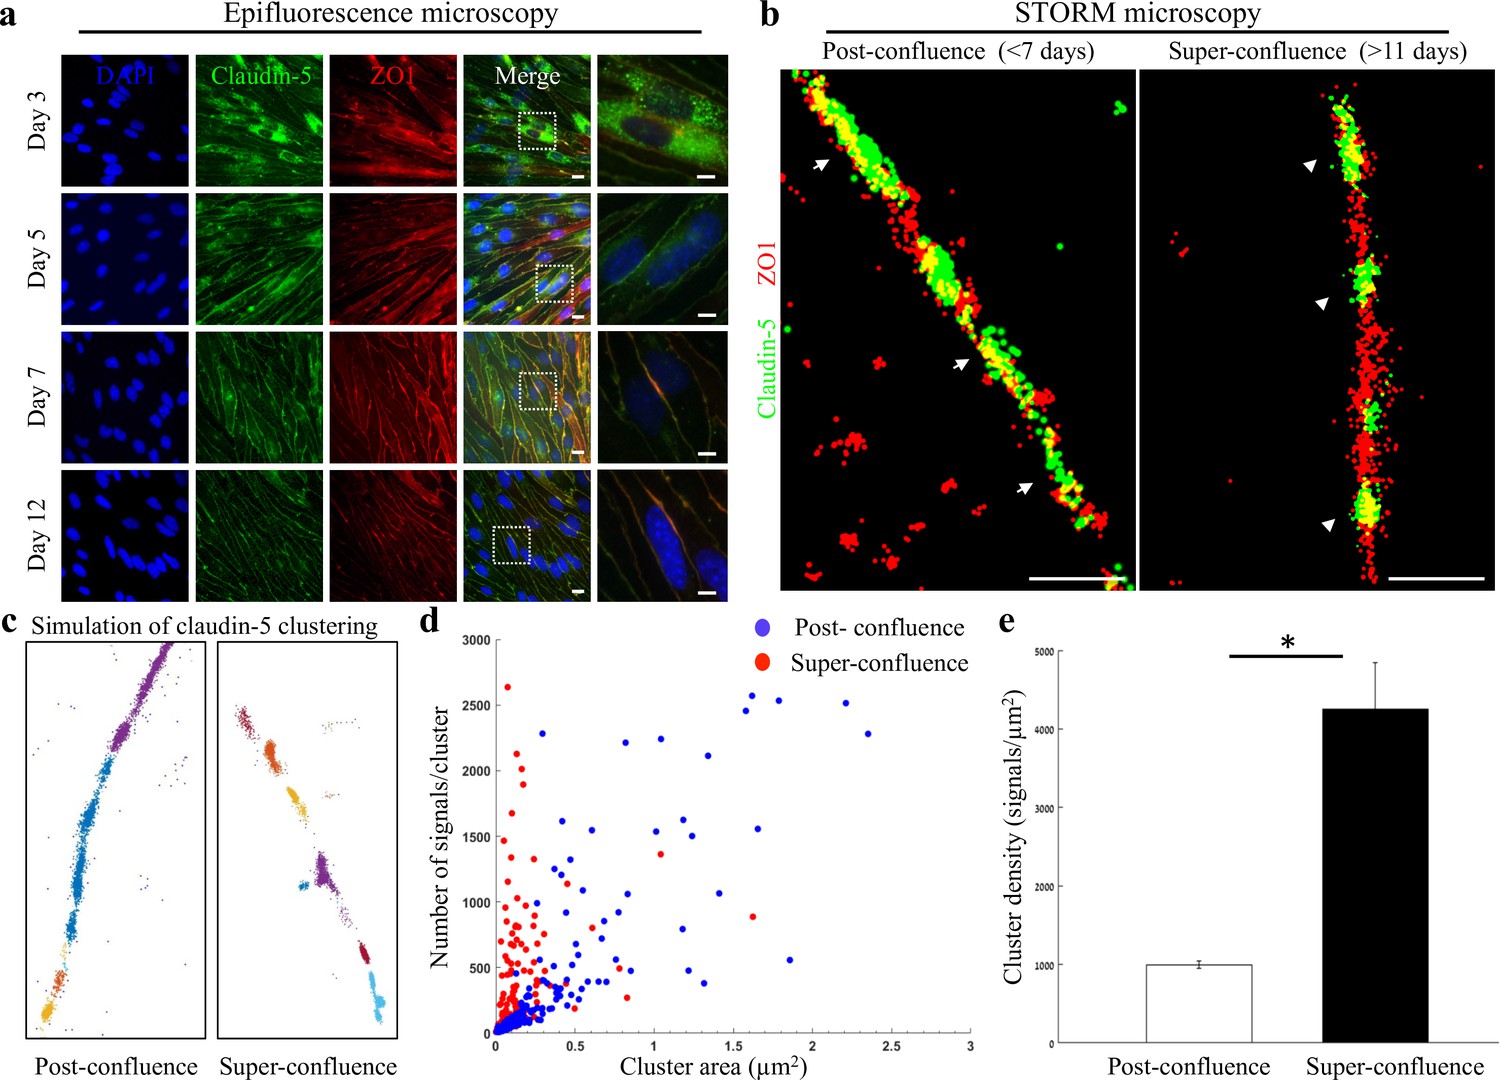
Super-resolution microscopy of endothelial tight junctions.
In vitro process of TJ maturation is accompanied by TJ architectural changes characterized by the formation of smaller, denser and more discrete clusters of TJ proteins. (a) Epi-fluorescent imaging of claudin-5 (green) and ZO1 (red) immunostaining of bEND.3 cells in indicated time points after the cultures reached confluence state. Note translocation of claudin-5 from cytoplasmic localizations into continuous lines around the boundaries of the cells (known as ‘strands’), along the in vitro maturation process. Scale bars, 10 µm and 5 µm in insets. (b) dSTORM imaging (Gaussian visualization) of claudin-5 (green) and ZO1 (red) immunostaining of bEND.3 cells confluent monolayers. TJ proteins form bead-like structures, especially in the super-confluence state. Claudin-5 signals are more concentrated in discrete and shorter foci (flanking ZO1 signals, arrowheads, right) than in the post-confluence state (arrows, left). During maturation TJ proteins translocate from different cellular locations (left) almost exclusively into the lateral cell membranes (right). Scale bar, 1 µm. (c) Examples of dSTORM imaging simulation of claudin-5 in bEND.3 cells used for quantifications of clustering properties (produced by a custom clustering Matlab code, see Materials and methods for details). Signals were defined to be clustered if their 2D location was smaller than 70 nm threshold distance. Cluster pattern visualization showing all points that belong to the same cluster with the same identifying color. (d) Quantifications of claudin-5 clustering properties showed a shift towards smaller clusters with more claudin-5 signals per cluster at the super-confluence state. Clusters with higher numbers of signals were more abundant at this late state, especially in clusters with area smaller than 0.3 μm2. (e) Average claudin-5 cluster density was ~4 fold higher at the super-confluence state than in the post-confluence state (n = 183 clusters (post-confluence) and 281 clusters (super-confluence) in five independent experiments). Data are mean ± s.e.m. *p < 0.05 (Two tailed Mann–Whitney U-test).
-
Figure 1—source data 1
Related to analyses sumirezed in Figure 1d, e.
- https://cdn.elifesciences.org/articles/63253/elife-63253-fig1-data1-v2.xlsx
Figure 1—figure supplement 1
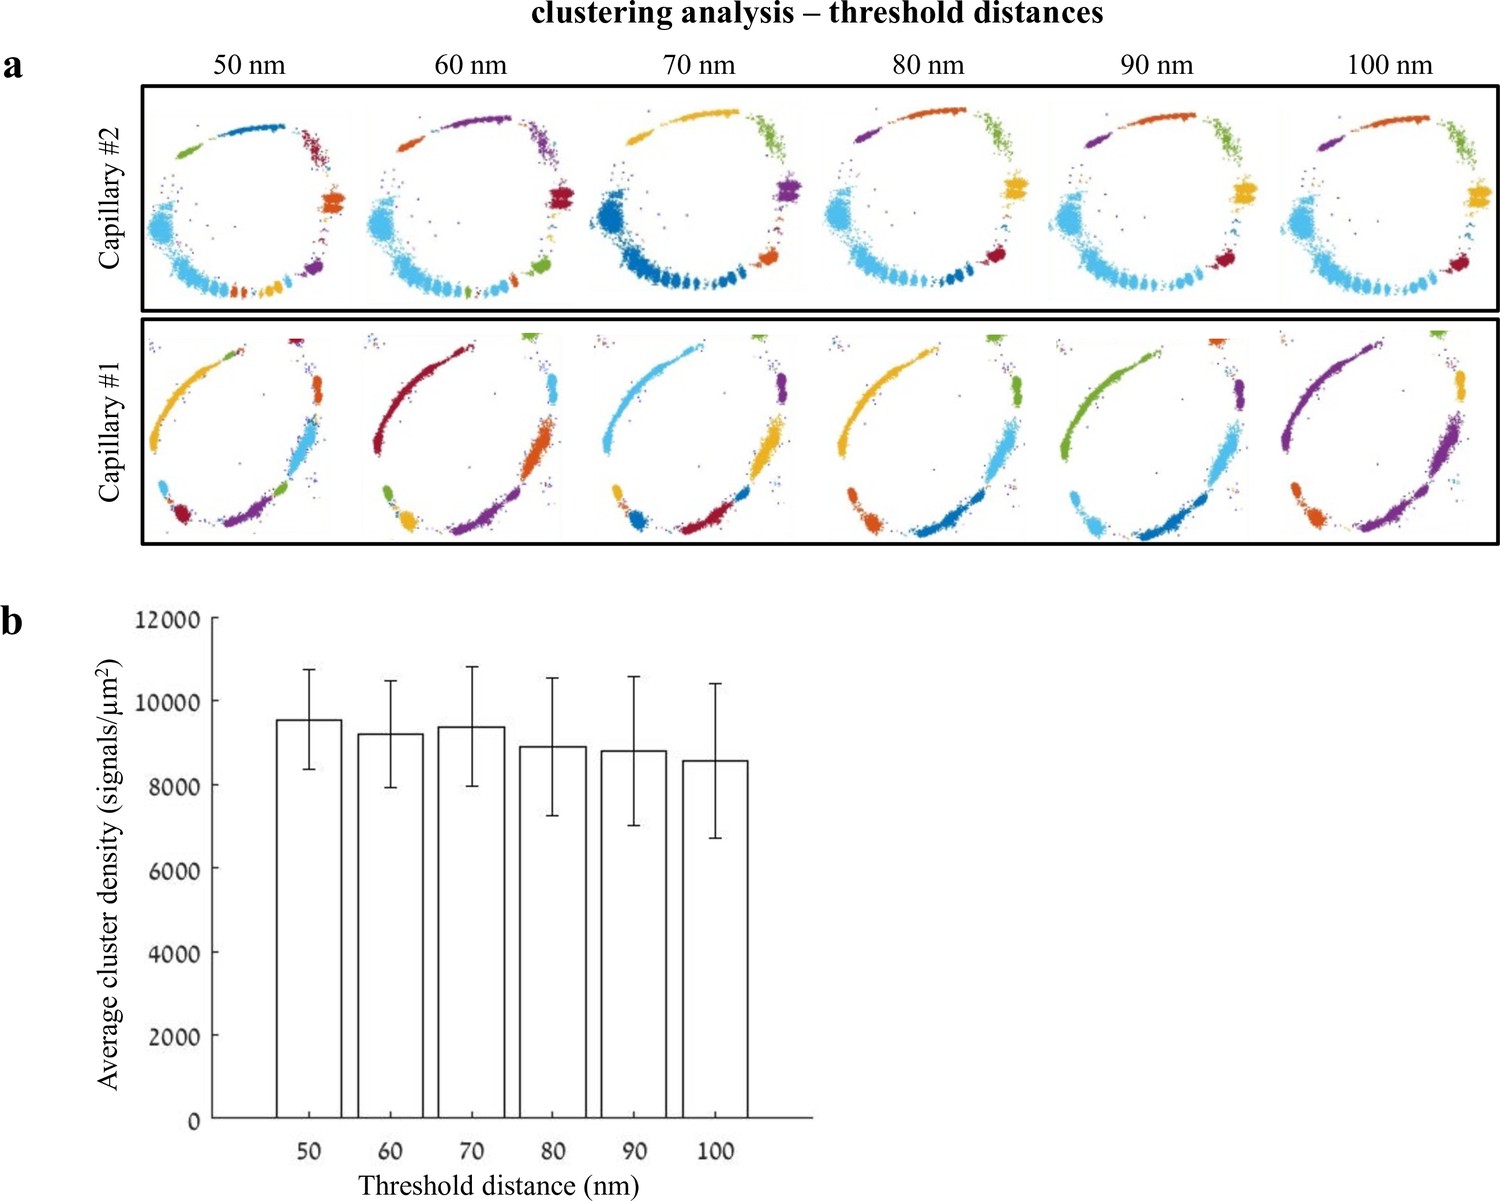
Distance threshold used for quantifications of clustering properties.
Analysis of claudin-5 clustering properties was done using a custom clustering Matlab code (see Materials and methods for details); our code calculated distances between each point and all other points in the point pattern of a Single molecule localization microscopy (SMLM) image. Then, we set a 70-nm distance threshold for defining molecules that belong to the same cluster. This distance threshold used for quantifications was determined based on the following parameters: minimal distance could not be below 40 nm (see Materials and methods for antibody labeling strategy); BBB TJs covering continuous contact points, as we evaluated in published TEM imaging data, range approximately up to 100 nm. Finally, we preformed simulation of claudin-5 density in clusters, measured in different threshold distances between 50 and 100 nm. (a) Two examples of simulations for claudin-5 cluster densities with different distance thresholds in P9 capillaries. Point patterns are visualized, while showing all points that belong to the same cluster with the same identifying color. Note that while clusters colors might change, the overall cluster organization is similar across tested threshold distances. (b) Claudin-5 cluster densities quantified using different distance thresholds did not yield significant differences. n = 8 capillaries. Data are mean ± s.e.m.
-
Figure 1—figure supplement 1—source data 1
Related to analyses sumirezed in Figure 1—figure supplement 1b.
- https://cdn.elifesciences.org/articles/63253/elife-63253-fig1-figsupp1-data1-v2.xlsx
Figure 2 with 2 supplements

Changes in nano-scale architecture correlates with tight junction function.
Enhanced TJ function is accompanied by formation of smaller and denser clusters of claudin-5. (a) Enhanced TJ function demonstrated by increase in TEER, along the first days of induced human brain microvascular endothelial-like cell (iBMEC) culture (n = 3 experiments/7 inserts. TEER here shows data of a representative experiment. For average change in TEER across all experiments see Figure 2—figure supplement 2. n = 4 inserts for permeability). (b) Enhanced TJ function demonstrated by reduced permeability to sodium fluorescein (T0 represents low TEER and T1 represents high TEER states, n = 4 inserts). Data are mean ± SD. *** p < 0.0003 (two tailed pair t- test). (c) dSTORM imaging (Gaussian visualization) of claudin-5 (green) and ZO1 (red) immunostaining in iBMEC confluent monolayers. Claudin-5 signals are concentrated in discrete and short foci at both time points. Scale bar, 1 µm. (d) Examples of dSTORM imaging simulation of claudin-5 in iBMECs used for quantifications of clustering properties (produced by a custom clustering Matlab code, see Materials and methods for details). Cluster pattern visualization showing all points that belong to the same cluster with the same identifying color. (e) Quantifications of claudin-5 clustering properties showed a shift towards smaller clusters with more claudin-5 signals per cluster along the improvement in TJ function. (f) Average claudin-5 cluster density more than doubled (from 14,341–33,141 signals/µm2) with the improvement in TJ function (n = 90 clusters [in lower TEER] and 278 clusters [in higher TEER] in triplicate cultures of two independent experiments). Data are mean ± s.e.m. *p < 0.01 (two-tailed Mann–Whitney U-test).
-
Figure 2—source data 1
Related to analyses sumirezed in Figure 2a, b, e, f.
- https://cdn.elifesciences.org/articles/63253/elife-63253-fig2-data1-v2.xlsx
Figure 2—figure supplement 1
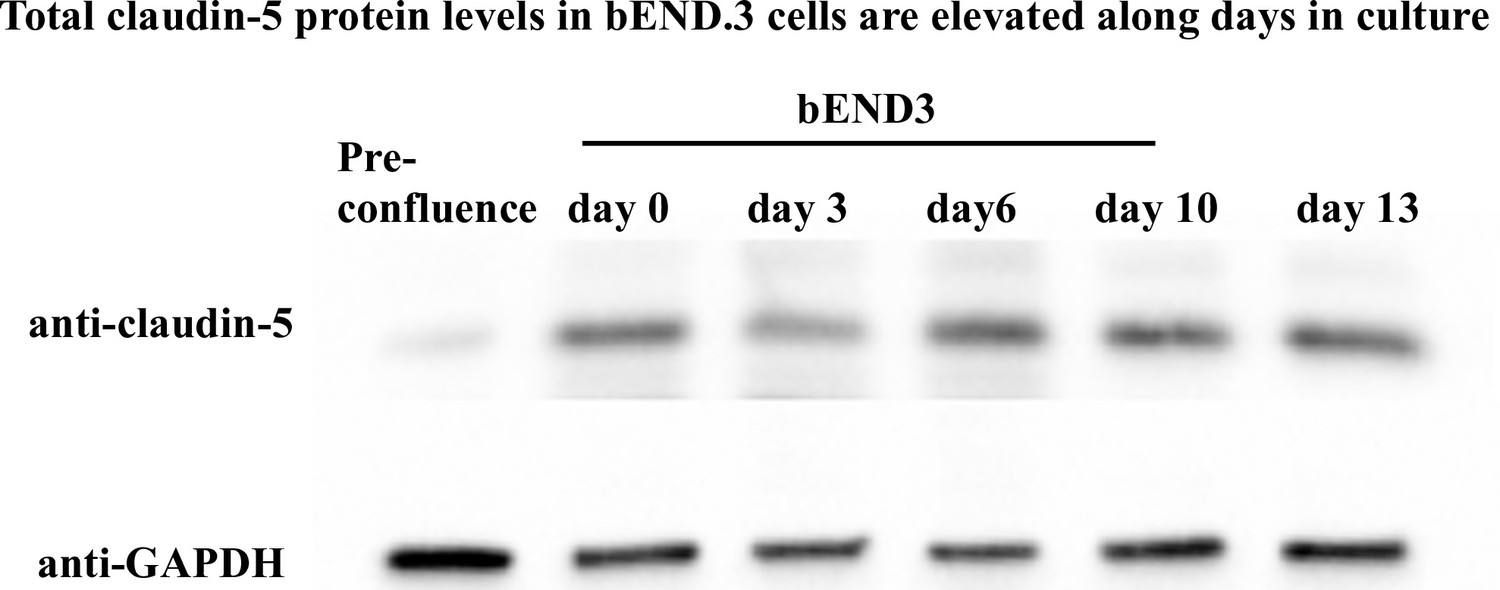
Total claudin-5 protein levels in bEND.3 cells are levated along days in culture.
Total claudin-5 protein levels in bEND.3 cells is elevated with time in culture. Total claudin-5 protein levels in bEND.3 cells rise with time in culture as shown in a representative western blot analysis. n = 4.
-
Figure 2—figure supplement 1—source data 1
Raw images of data preesented in Figure 2—figure supplement 1.
- https://cdn.elifesciences.org/articles/63253/elife-63253-fig2-figsupp1-data1-v2.zip
Figure 2—figure supplement 2
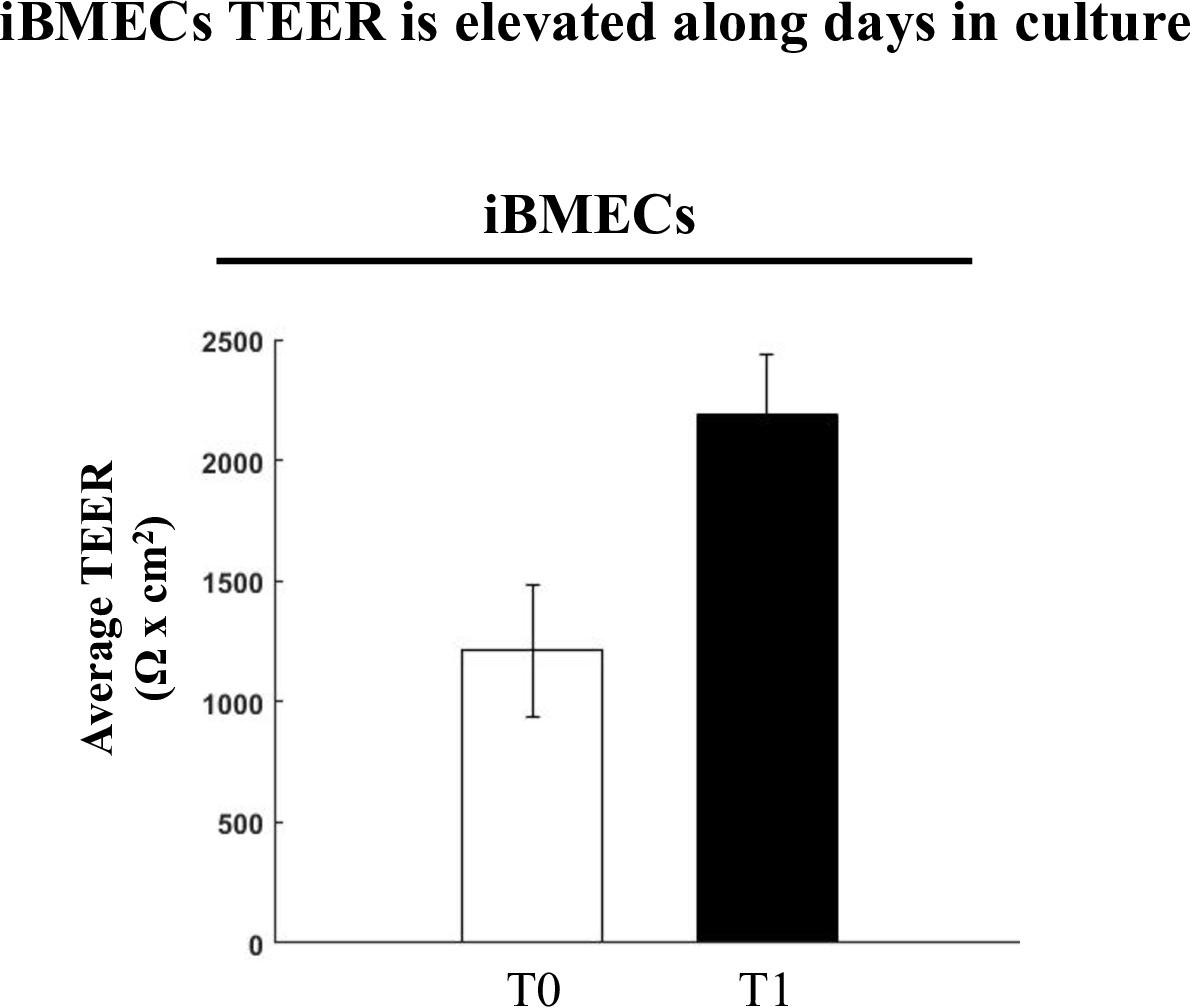
iBMECs TEER is elevated with time in culture.
Enhanced TJ function demonstrated by doubling of TEER (average change in TEER across all experiments) along 2–3 days of human brain microvascular endothelial-like cell (iBMECs) culture (n = 3 experiments/7 inserts).
-
Figure 2—figure supplement 2—source data 1
Related to analyses sumirezed in Figure 2—figure supplement 2.
- https://cdn.elifesciences.org/articles/63253/elife-63253-fig2-figsupp2-data1-v2.xlsx
Figure 3
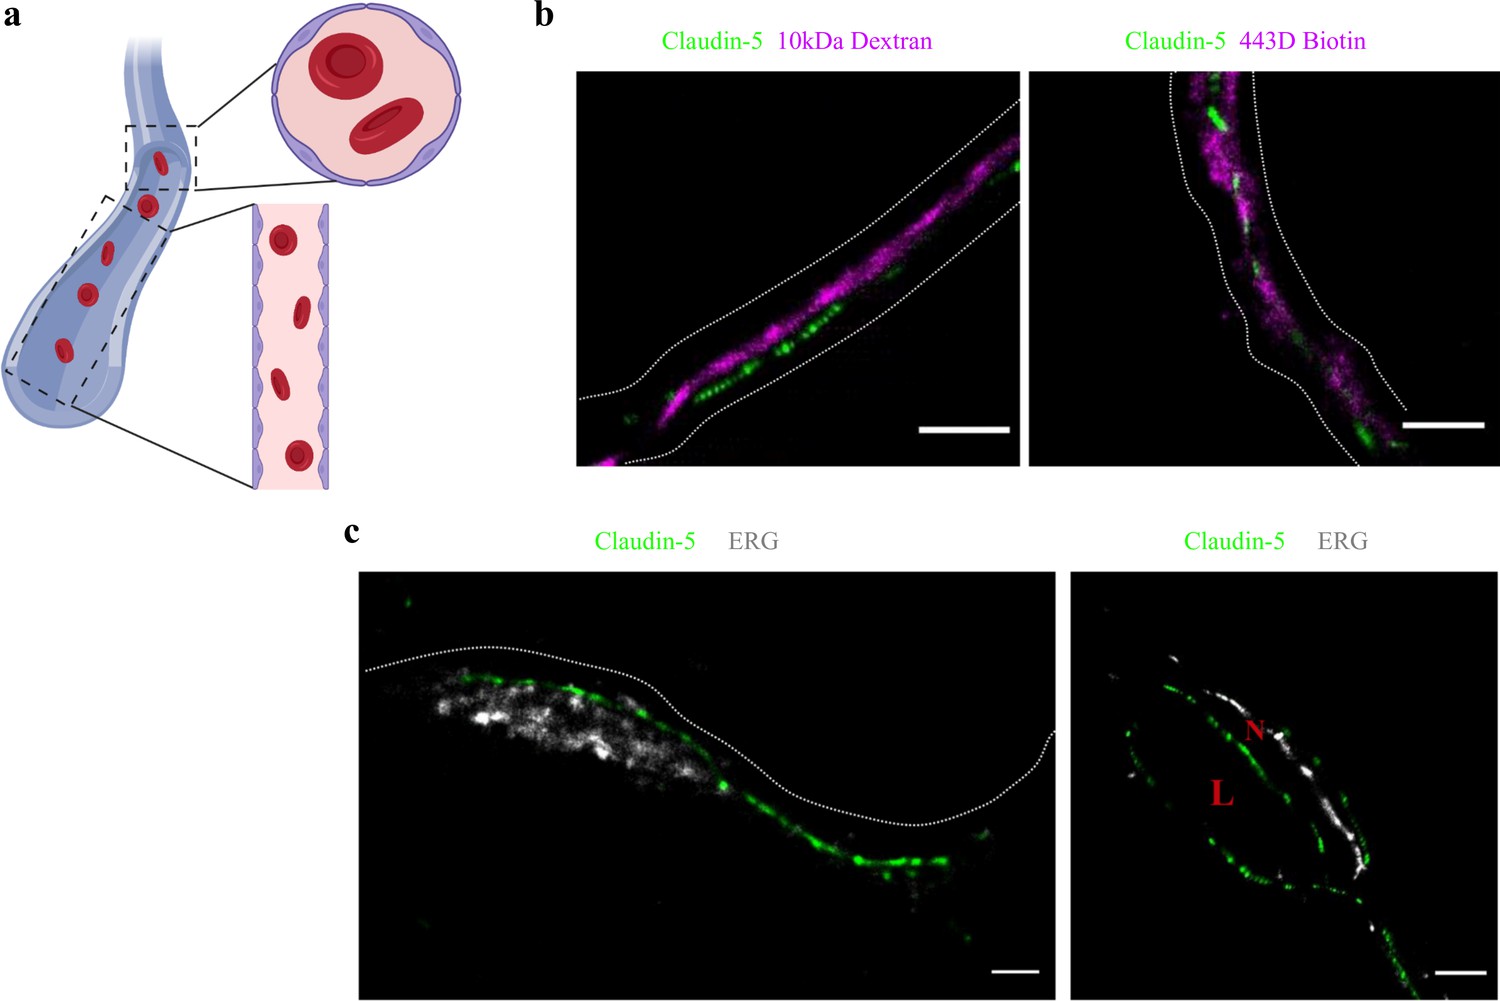
Claudin-5 signals in dSTORM imaging are exclusively localized to vascular structures.
dSTORM imaging in cortical fixed tissue sections of post-natal day 9 mice. (a) Illustration of a vascular structure with cross versus sagittal section directions, and the projected orientation of endothelial cells contact points (Created with https://biorender.com/). (b) Claudin-5 staining (green) together with fluorescent circulating tracers (10 kDa dextran, and ~443 Dalton sulfo-NHS-biotin, magenta) are used to demarcate sagittal views of elongated vessels (dashed line, Scale bars, 1 μm). (c) Staining for claudin-5 (green) together with the endothelial-specific transcription factor ERG (gray) showing capillary cross and sagittal sections (Scale bars, 1 μm). L – capillary lumen, N – endothelial nucleus. n > 30 capillaries.
Figure 4
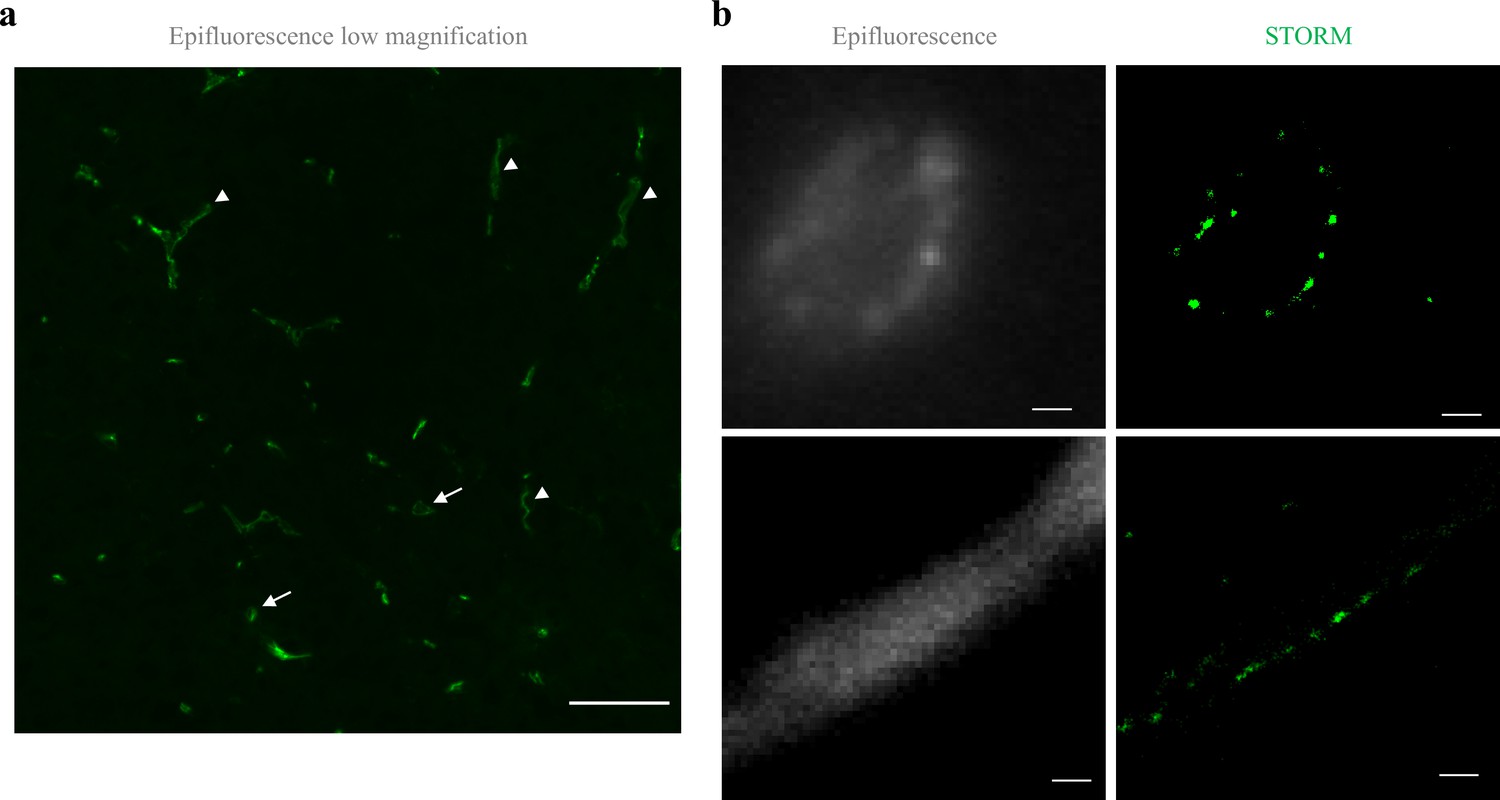
Claudin-5 exhibits clustered organization in cortical capillaries.
Imaging in cortical fixed tissue sections of post-natal day 9 mice. (a) Low-magnification view of claudin-5 staining imaged by epi-fluorescent microscopy showing vascular fragments in cross-sections (arrows) or in sagittal-sections (arrowheads, scale bar, 50 μm). (b) Claudin-5 exhibits clustered organization in vivo; dSTORM (right) compared to epi-fluorescent images (left) of claudin-5 immunostaining in P9 cortical capillary cross-section (upper panel) or sagittal- section (lower panel) (scale bars, 1 μm), n > 30 capillaries.
Figure 5 with 1 supplement
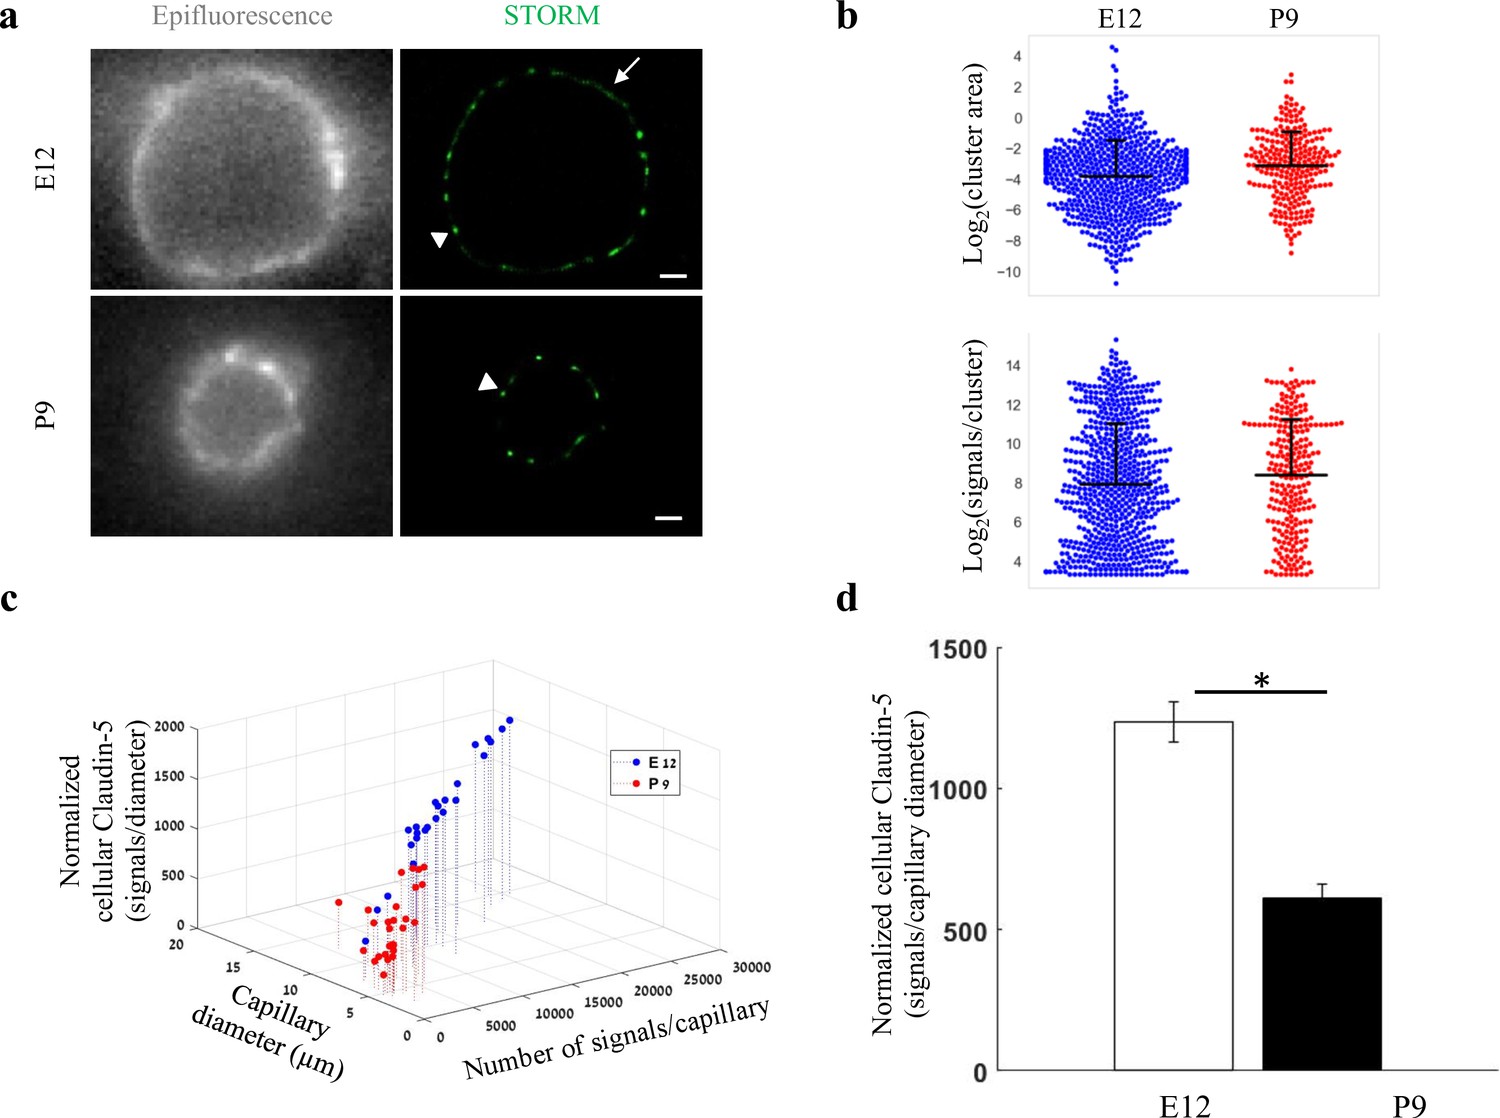
Total cellular claudin-5 abundance does not correlate with BBB restrictive properties.
Quantifications of claudin-5 levels and clustering properties along developmental BBB maturation (a) dSTORM (right) compared to epi-fluorescent images (left) of claudin-5 immunostaining in E12 and P9 cortical capillary cross-sections. Two distinct claudin-5 organizations could be observed; discrete clusters (arrowheads) and a more defused claudin-5 appearance composed of many small clusters with relatively small gaps between them, evident only in E12 capillaries (arrow, see Extended Data Figure 5—figure supplement 1a for further analysis). Scale bars, 1 μm. (b) Claudin-5 clustering-properties analysis showed that there were about 2.6 times more discrete clusters per capillary at E12 than at P9 (a set of 20 capillaries of each age). Distribution of claudin-5 clusters area in E12 capillaries was skewed toward smaller clusters and the average cluster area was slightly smaller in E12 with no dramatic difference between the distributions (average of 0.309 μm2 (E12) vs. 0.3413 μm2 (P9)). There was no dramatic difference in the distribution of signals per cluster or signal densities between the two groups (see Figure 5—figure supplement 1b). n = 3 pups/embryos, 20 capillaries, 657 clusters (E12) and 246 clusters (P9). Data are mean ± s.e.m. (c) Quantifications of total cellular claudin-5 per capillary crosssection shows a shift towards lower claudin-5 levels and smaller capillary diameter in P9 than in E12 vasculature. Capillary diameter was significantly smaller (5.9 ± 0.39 μm [P9], 11.1 ± 0.47 μm [E12]), total number of claudin-5 signals per capillary was significantly lower (3590 ± 372 (P9), 14,341 ± 1257 [E12]) .(d) Normalizing the total number of signals per capillary to its diameter shows the average claudin-5 cellular abundance is significantly lower at P9. n = 25 capillaries (E12) and 27 capillaries (P9) of 3 embryos/pups. Data are mean ± s.e.m. *p < 0.05 (Two tailed Mann–Whitney U-test).
-
Figure 5—source data 1
Related to analyses sumirezed in Figure 5b-d.
- https://cdn.elifesciences.org/articles/63253/elife-63253-fig5-data1-v2.xlsx
Figure 5—figure supplement 1
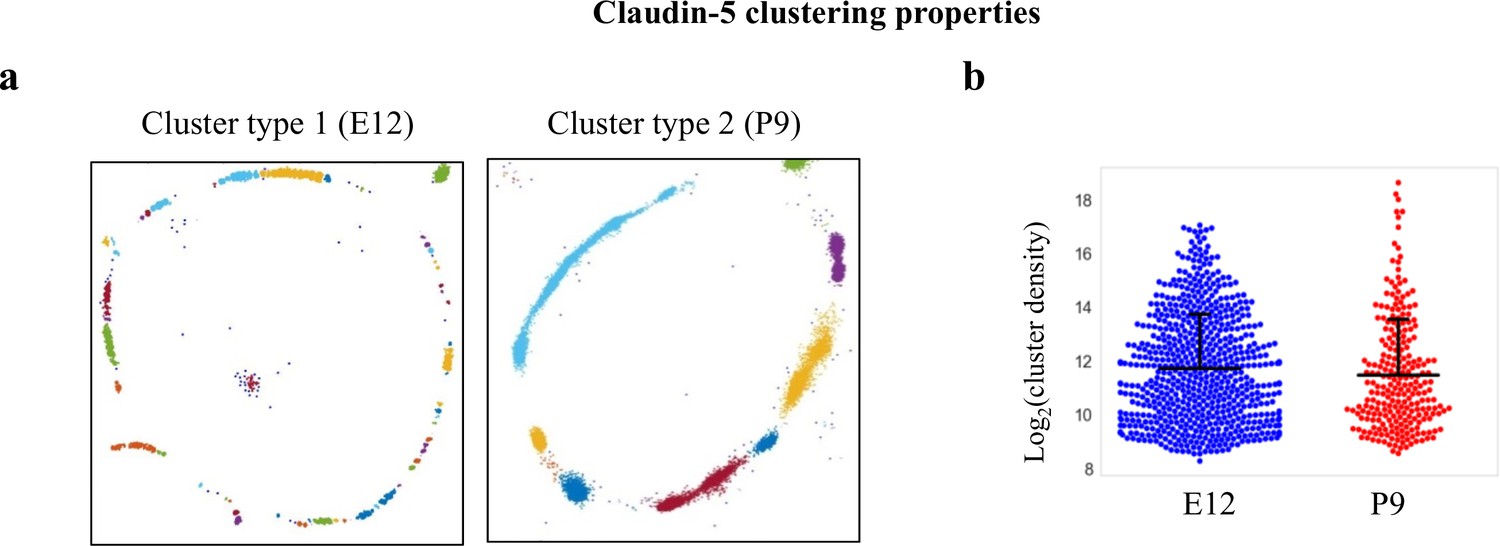
Claudin-5 clustering properties.
Analysis of Claudin-5 clustering properties along the developmental BBB maturation axis, using custom clustering Matlab code (see methods for details). (a) dSTORM imaging simulation of claudin-5 immunostaining of E12 and P9 cortical capillary cross-sections (example of the two types of clustering simulations). We assumed that E12 capillaries had a more defused claudin-5 appearance with longer clusters, but further analysis revealed that these are composed of many small clusters with relatively small gaps between them. Signals were defined to be clustered if their 2D location was smaller than 70 nm threshold distance. Cluster pattern visualization showing all points that belong to the same cluster with the same identifying color. (b) Claudin-5 clustering-properties analysis showed that there were about 2.6 times more discrete clusters per capillary at E12 than at P9 (a set of 20 capillaries of each age). There was no dramatic difference in the distribution of signal densities between the two groups. n = 3 pups/embryos, 20 capillaries, 657 clusters (E12), and 246 clusters (P9). Data are mean ± s.e.m.
Figure 6 with 2 supplements
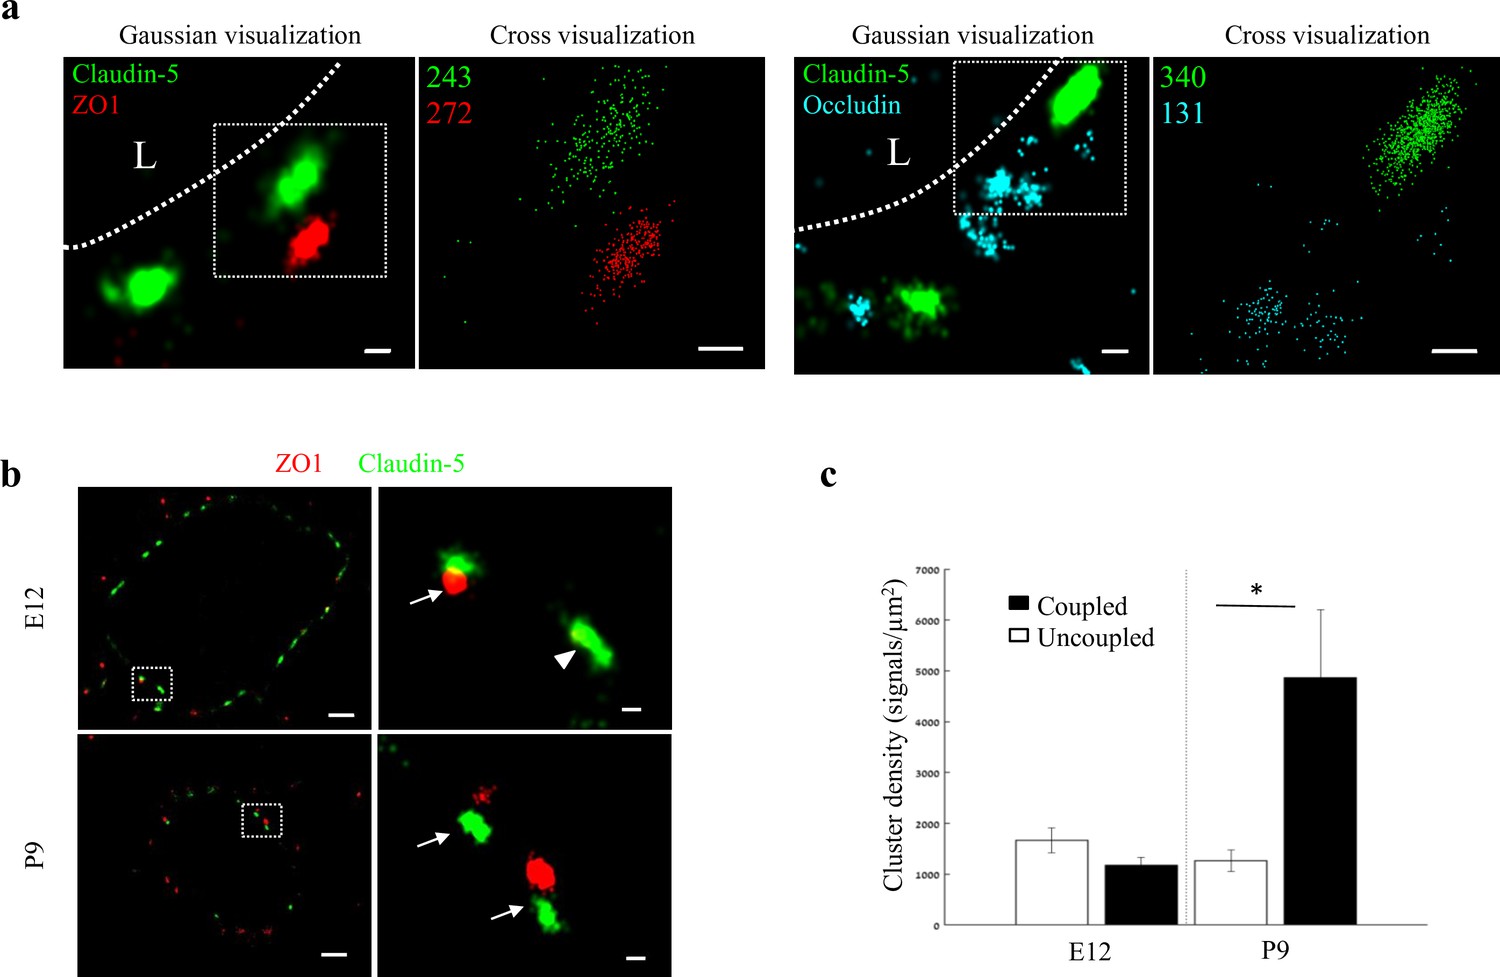
Molecular organization of mouse cortical BBB TJs.
Nano-scale molecular organization of TJ proteins in cortical capillaries of postnatal wild-type mice (P9). (a) Claudin-5 and ZO1 display clustered organization (left) whereas occludin was much less organized in discrete clusters and had more dispersed organization patterns (right). 2D-STORM imaging data demonstrates that signals of all three TJ proteins are in close proximity (‘Gaussian visualization’ in which signal intensity correlates with localization precision). An inset with magnifications of each cluster (right images) demonstrates the very high-molecular density of TJ proteins (‘Cross-visualization’ shows all resolved signals where each single-molecule signal displays as a cross). Scale bars, 100 nm. Representative signal numbers are shown. n = 40 capillaries of 4 wild-type pups. L – capillary lumen. (b) dSTORM imaging (Gaussian visualization) of claudin-5 (green) and ZO1 (red) immunostaining of E12 and P9 cortical capillary cross-sections. Note that some claudin-5 clusters are coupled with ZO1 clusters (high magnification insets, arrows) while some are independent claudin-5 clusters (arrowhead). Scale bars, 1 μm and 100 nm in insets. (c) Average density of P9 claudin-5 clusters that were coupled with ZO1 clusters was ~5 fold higher than independent claudin-5 clusters. The average density of E12 claudin-5 clusters was similar regardless of proximity to ZO1 clusters, and was low compared to P9-independent claudin-5 clusters. n = 40 clusters from 11 capillaries and 43 clusters from 11 capillaries (of three embryos/pups, P9 and E12, respectively). Data are mean ± s.e.m. *p < 0.05 (Two tailed Mann–Whitney U-test).
-
Figure 6—source data 1
Related to analyses sumirezed in Figure 6c.
- https://cdn.elifesciences.org/articles/63253/elife-63253-fig6-data1-v2.xlsx
Figure 6—figure supplement 1
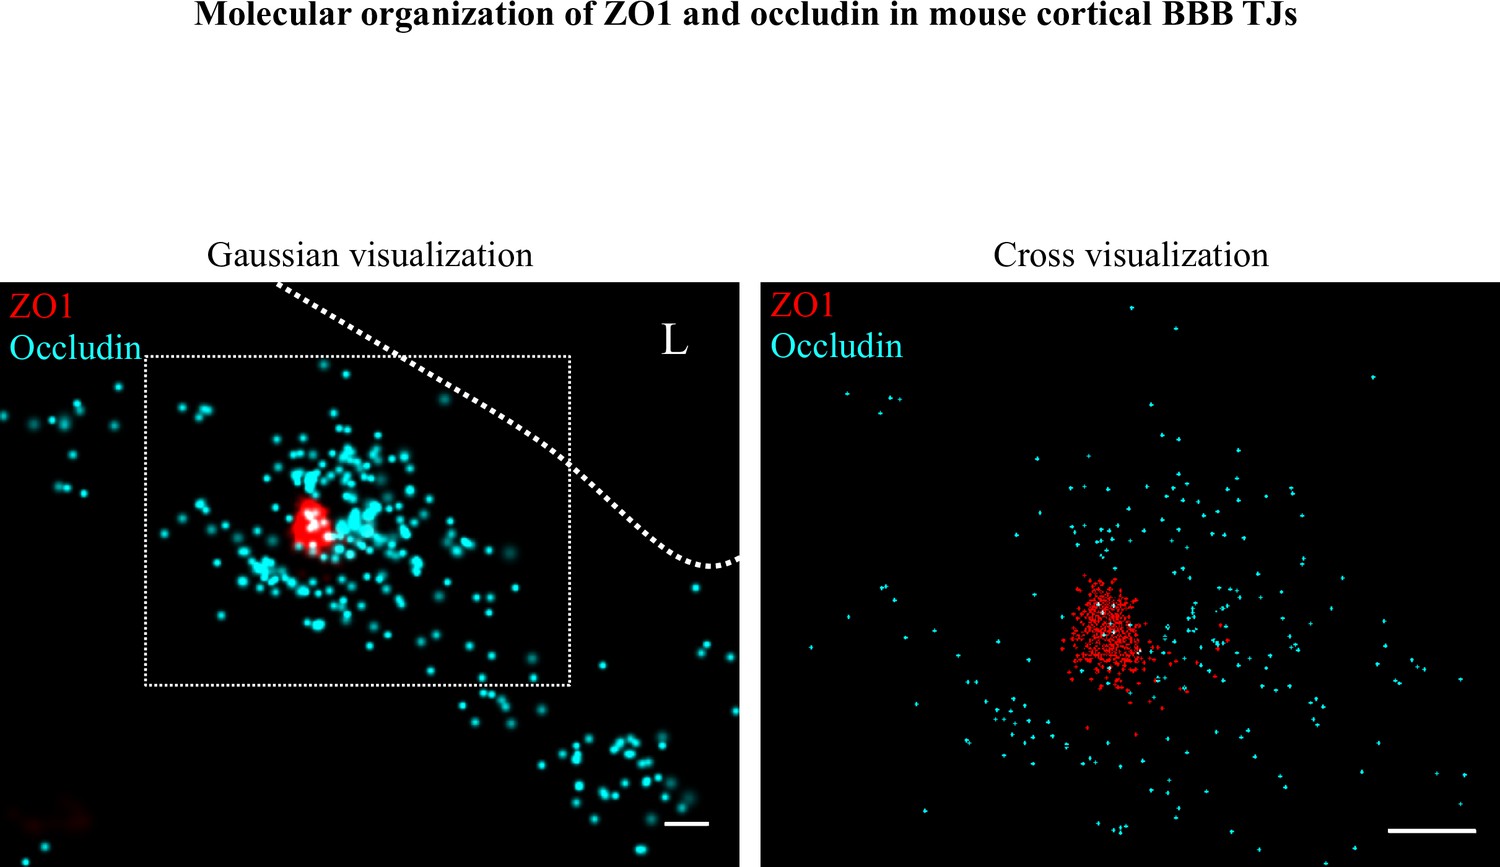
Molecular organization of ZO1 and occludin in mouse cortical BBB TJs.
Nano-scale molecular organization of TJ proteins in cortical capillaries of wild-type mice (E16). ZO1 display clustered organization (red) whereas occludin (cyan) was much less organized in discrete clusters and had more dispersed organization patterns. 2D-STORM imaging data (left) demonstrates that signals of TJ proteins are in close proximity and sometimes overlap (‘Gaussian visualization’ in which signal intensity correlates with localization precision). An inset with magnification (right) demonstrates the very high-molecular density of ZO1 and the more diffuse organization of occludin (‘Cross-visualization’ shows all resolved signals where each single-molecule signal displays as a cross). Scale bars, 100 nm. n = 40 capillaries of 4 wild-type pups. L – capillary lumen.
Figure 6—figure supplement 2
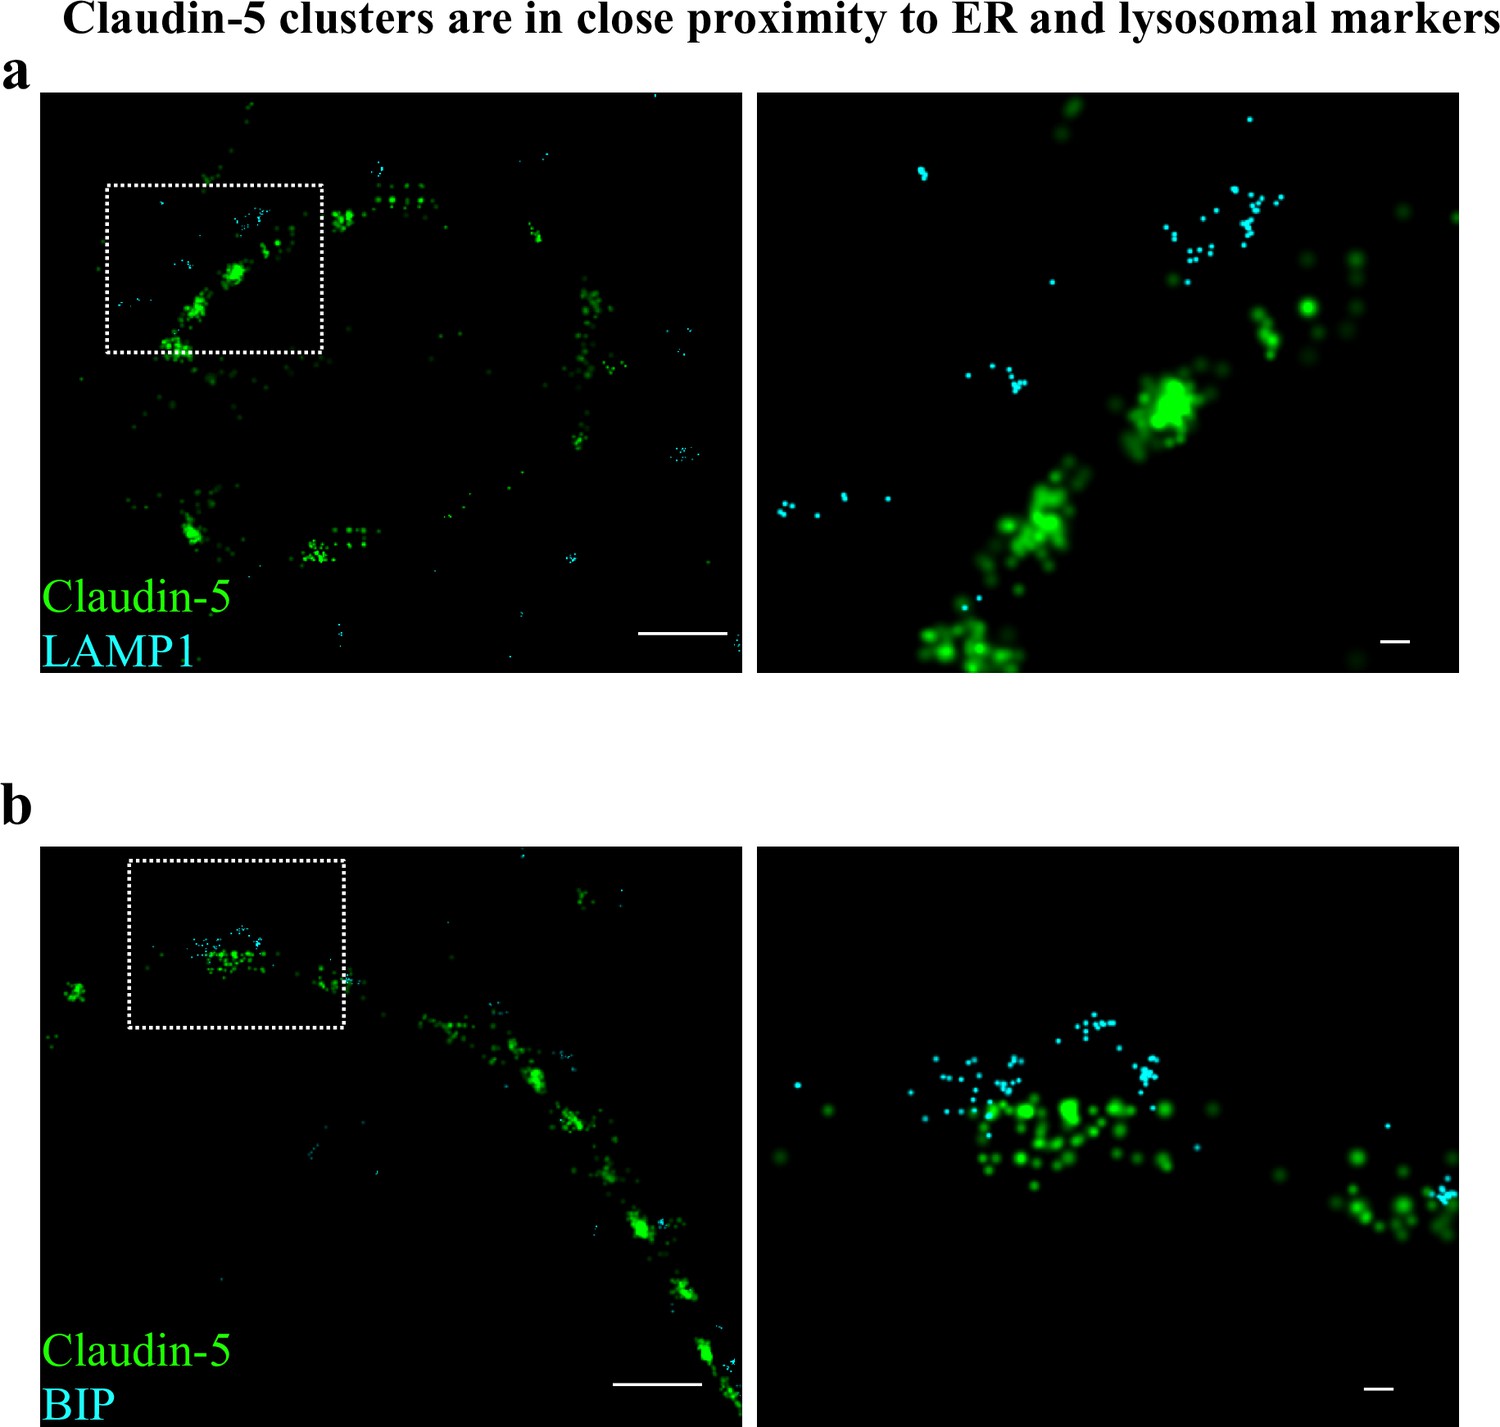
Claudin-5 clusters are in close proximity to ER and lysosomal markers.
Capillary cross-sections presented multiple claudin-5 clusters, therefore we tested potential claudin-5 localization to different cellular compartments. (a) Claudin-5 clusters in close proximity with the lysosomal marker LAMP1, suggesting lysosome localization. (b) Claudin-5 clusters in close proximity with the ER marker BiP, suggesting ER localization. Scale bars, 1 µm and 0.1 µm in insets. n = 8 capillaries.
Figure 7
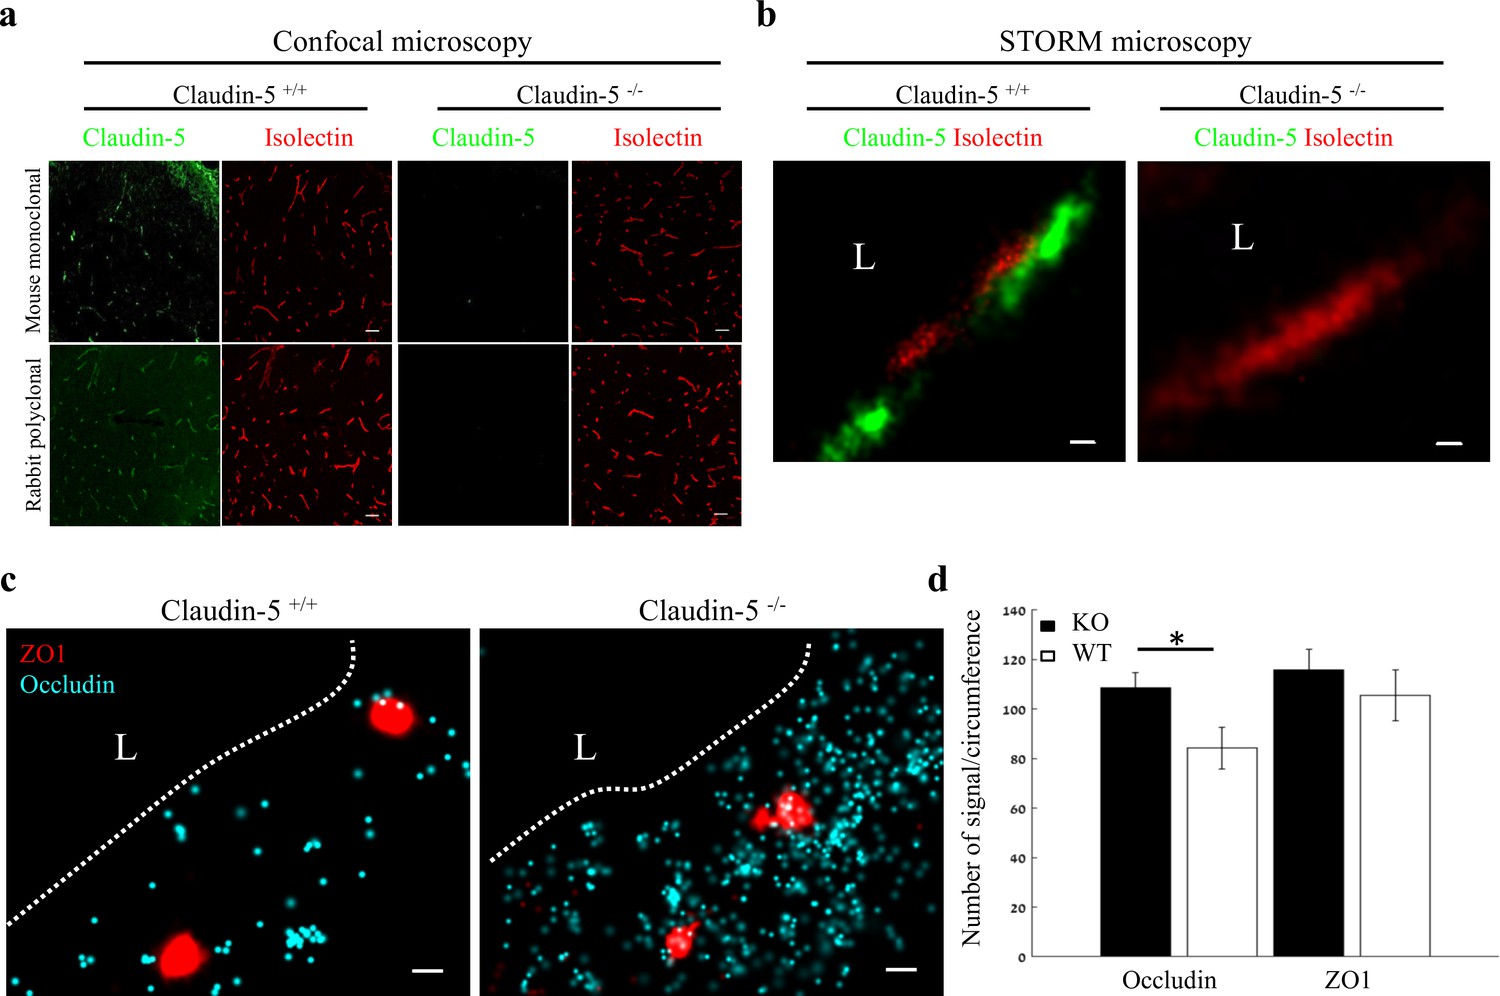
Nano-scale organization of both ZO1 and occludin are independent of claudin-5 expression.
(a-b) Claudin-5 antibodies specificity was confirmed by both confocal microscopy (a) Scale bars, 50 µm and dSTORM microscopy (b) Scale bars, 0.1 µm, with no detectable staining in E16 cortical null tissues (Isolectin staining used to localize vasculature, n = 4 wild-type, 4 claudin-5 null embryos). (c) E16 claudin-5 null and wild-type littermates cortical capillaries imaged with dSTORM display unaltered ZO1 clustering organization and occludin dispersed organization patterns. Scale bars, 100 nm. (d) Total cellular signal quantifications revealed that occludin levels were ~1.29 fold higher in claudin-5 null capillaries compared to wild-type. Total cellular ZO1 signal levels were also higher in claudin-5 null capillaries (not statistically significant). Data are mean ± s.e.m. *p < 0.05 (Two tailed Mann–Whitney U-test). L – capillary lumen. n = 48 capillaries of 4 wild-type embryos and 56 capillaries of 4 claudin-5 null embryos.
-
Figure 7—source data 1
Related to analyses sumirezed in Figure 7d.
- https://cdn.elifesciences.org/articles/63253/elife-63253-fig7-data1-v2.xlsx
Figure 8
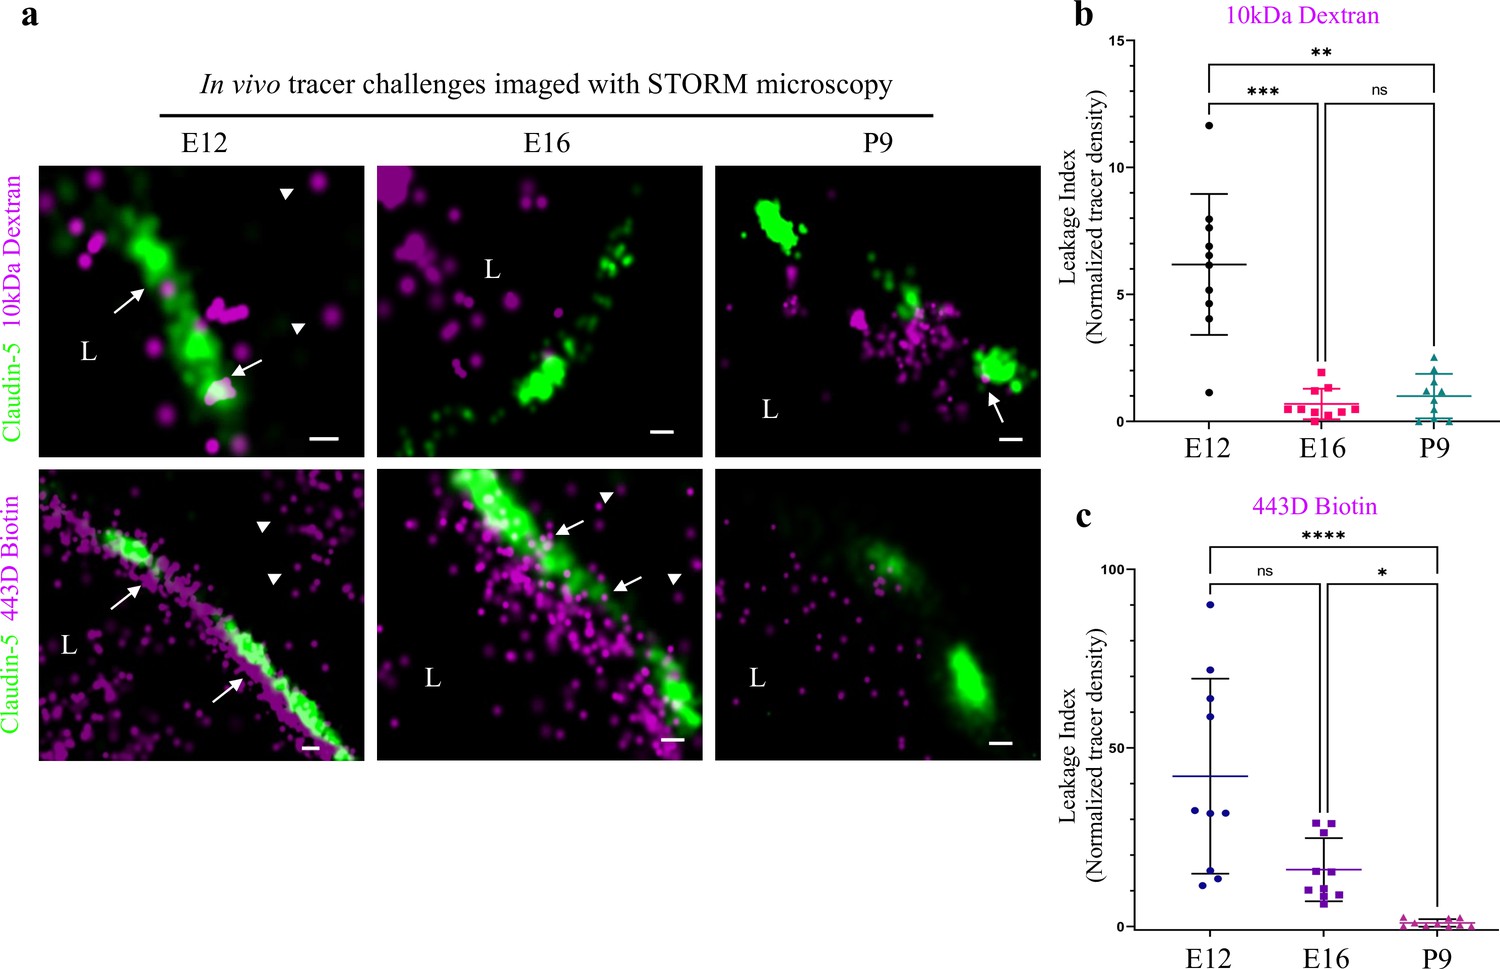
Investigating BBB TJ function using super-resolution microscopy.
Tracer challenges testing cortical capillaries permeability with dSTORM imaging, provides evidence of leakage across immature TJs. (a) E12 TJ function tested with an in utero embryonic liver tracer injection method (Ben-Zvi et al., 2014). 10 kDa dextran signals (upper-left) and ~443 Dalton sulfo-NHS-biotin signals (lower-left) were found in the luminal side, intermingling with claudin-5 clusters (arrows) and in the abluminal side and further away (presumably brain tissue, arrowheads). These were interpreted as evidence of tracer leakage across immature TJs. Following trans-cardiac tracer challenges, dSTORM imaging shows P9 capillaries can restrict movement of tracer molecules from the lumen to the brain side (10 kDa dextran upper-right, and ~443 Dalton sulfo-NHS-biotin lower-right). E16 cortical capillaries were previously found to prevent leakage of 10 kDa tracers (Ben-Zvi et al., 2014; Licht et al., 2015), also validated here with dSTORM imaging (middle-upper). Surprisingly, at this stage sulfo-NHS-biotin was not restricted to the vessels’ lumen, evident also on the brain side (middle-lower arrowheads) and intermingling with claudin-5 clusters (arrows). Scale bars, 100 nm. L – capillary lumen. n = 40 capillaries for each tracer of 3 pups/embryos. (b–c), Developmental changes in permeability are reflected in quantification of tracer signal density at the abluminal side of the junctions (10 kDa dextran at b, and 443 Dalton sulfo-NHS-biotin at c). Relative leakage index was calculated as tracer signal density (signals/area) in a fixed area and distance from the abluminal side of the claudin-5 signal, and was normalized to the average signal density at P9 (set as leakage index = 1). n = 10 capillaries for each tracer of 3 pups/embryos, *p < 0.0123, **p < 0.0031,***p < 0.0006, ****p < 0.0001, Kruskal-Wallis test and Dunn’s test for multiple comparisons.
-
Figure 8—source data 1
Related to analyses sumirezed in Figure 8b,c.
- https://cdn.elifesciences.org/articles/63253/elife-63253-fig8-data1-v2.xlsx
Author response image 1
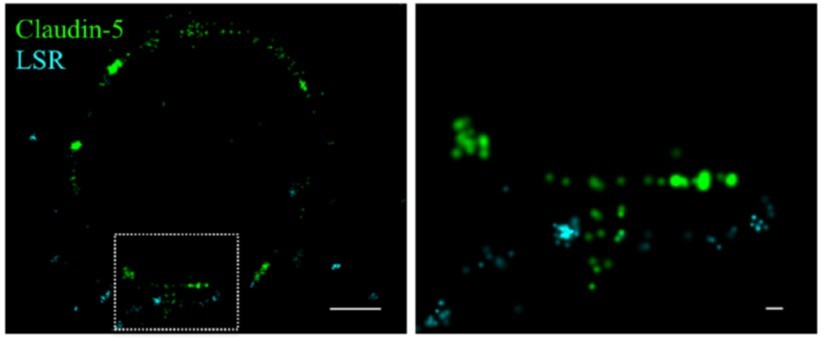
Claudin-5 signals in close proximity to the tricellular marker LSR.
Cortical capillary cross-sections of P9 mice presented multiple claudin-5 clusters, of which the minority was in close proximity with the tricellular marker LSR. The majority of LSR signals were diffused and only rare images included clusters of LSR adjacent to what appears as a ‘T shaped’ claudin-5 distribution. Scale bars, 1 µm and 0.1 µm in inset.
Author response image 2
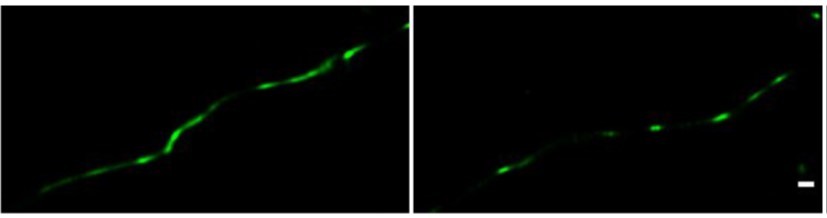
Direct STORM imaging of EYFP-fused claudin-5, overexpressed in bEND.
3 cells. bEND.3 cells were infected with a lenti-viral vector to stably express ctermini EYFP-tagged human claudin-5. Super-confluent monolayers were imaged with STORM to localize the EYFP signals. About half of the samples were found to exhibit interrupted junction patterns (e.g right) and the other half exhibited more continuous patterns (e.g. left). No significant difference in signal density was found between the two patterns. Scale bar, 100 mm.
Additional files
Download links
A two-part list of links to download the article, or parts of the article, in various formats.
Downloads (link to download the article as PDF)
Open citations (links to open the citations from this article in various online reference manager services)
Cite this article (links to download the citations from this article in formats compatible with various reference manager tools)
Nano-scale architecture of blood-brain barrier tight-junctions
eLife 10:e63253.
https://doi.org/10.7554/eLife.63253


