Dissecting the DNA binding landscape and gene regulatory network of p63 and p53
- Computational Biology Group, Leibniz Institute on Aging – Fritz Lipmann Institute (FLI), Germany
- Department of Genome Regulation, Max Planck Institute for Molecular Genetics, Germany
- Patrick G Johnston Centre for Cancer Research, Queen's University Belfast, United Kingdom
Figures
Figure 1

Meta-analysis of p63-dependent gene regulation.
(A) Distribution of the number of genes found in each of the p63 Expression Score groups. Because p63 Expression Score group ‘14’ and ‘−12’ contained only two genes they were included in group ‘13’ and ‘−11’, respectively, for further analyses. (B) 16 datasets on p63-dependent gene expression from 11 studies. EE – exogenous p63 expression; sh KD – shRNA-mediated knockdown; si KD – siRNA-mediated knockdown; KO - sgRNA-mediated knockout (C) A heatmap displaying the regulation of 15 genes with positive and 15 genes with negative p63 Expression Scores. GAPDH and GAPDHS represent negative controls.
Figure 2
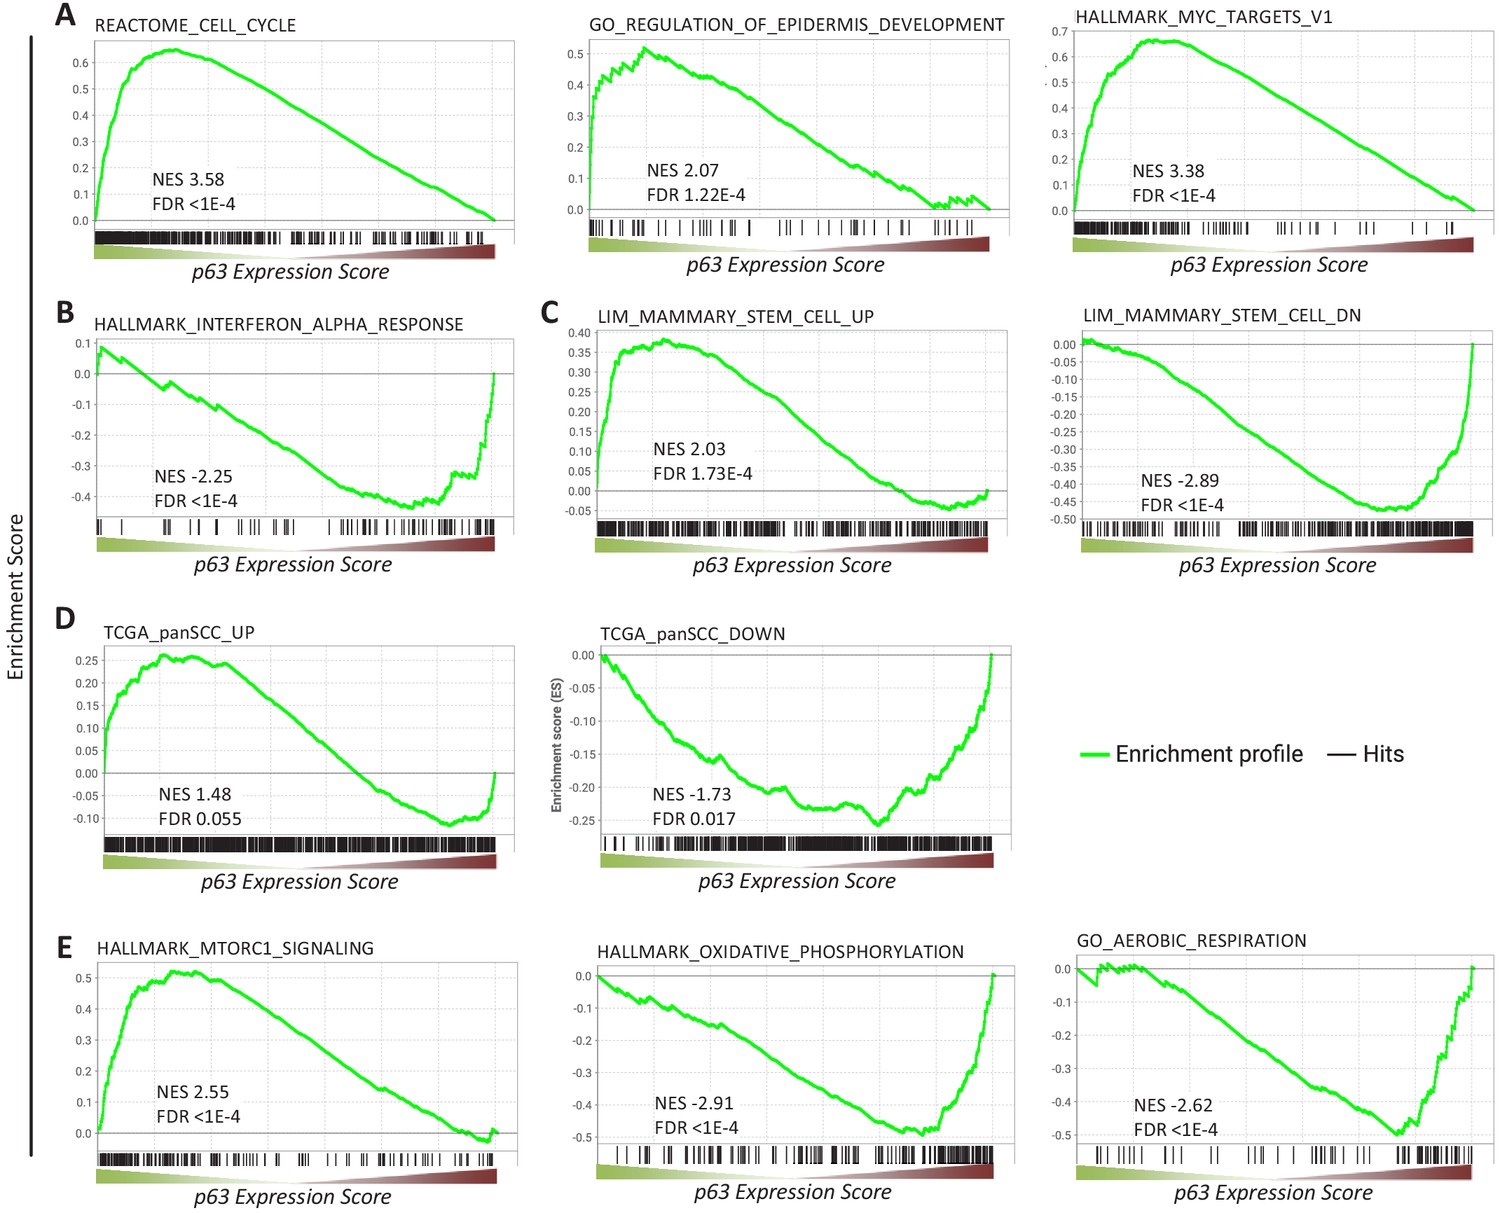
Gene sets enriched among genes commonly regulated by p63.
Enrichment of (A, B, C, E) MSigDB gene sets or (D) genes up- and down-regulated across squamous cell cancers (SCC) (Cancer Genome Atlas Research Network et al., 2018) among genes ranked by the p63 Expression Score.
Figure 3
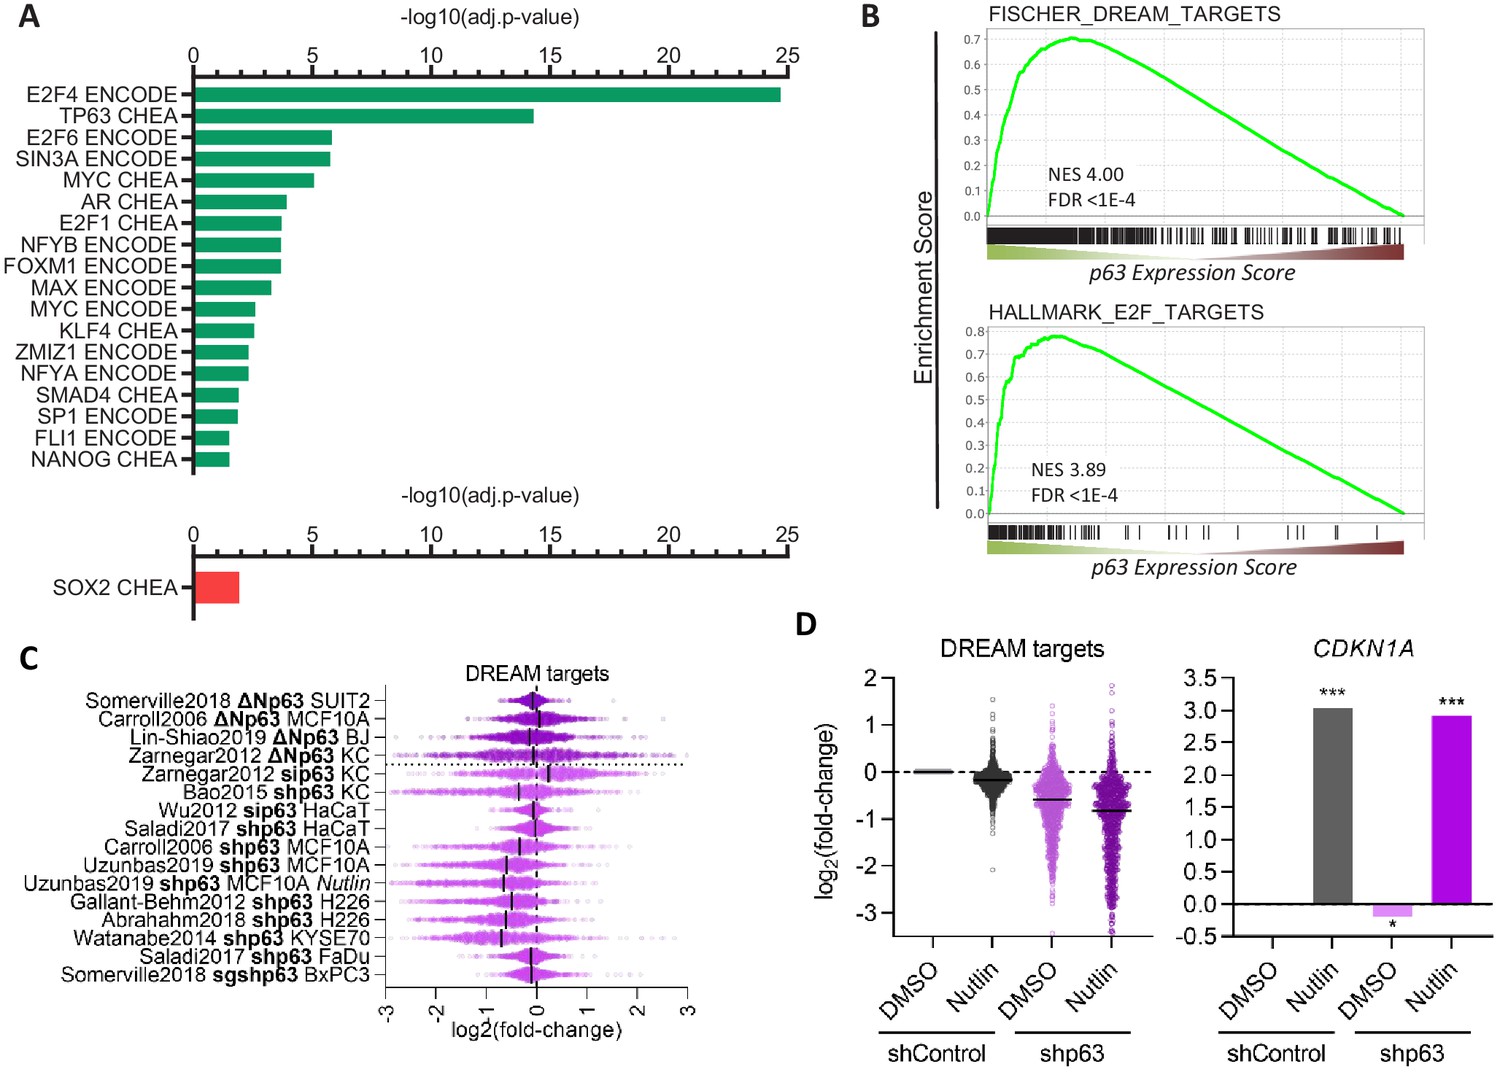
Transcription factors in the p63 GRN.
(A) Significant (adj.p-value≤0.05) enrichment of TF binding at genes with a p63 Expression Score ≥8 (green) or ≤ −8 (red) as identified by Enrichr (Kuleshov et al., 2016). (B) Enrichment of MSigDB gene sets among genes ranked by the p63 Expression Score. Scatter plots displays the log2(fold-change) of previously collected high confidence DREAM target genes (Fischer et al., 2016a) (C) across the 16 p63-dependent gene expression profiling datasets and (D) MCF10A cells treated with DMSO or Nutlin in addition to shControl and shp63 (Karsli Uzunbas et al., 2019). CDKN1A levels serve as control. The black line indicates the median.
Figure 4
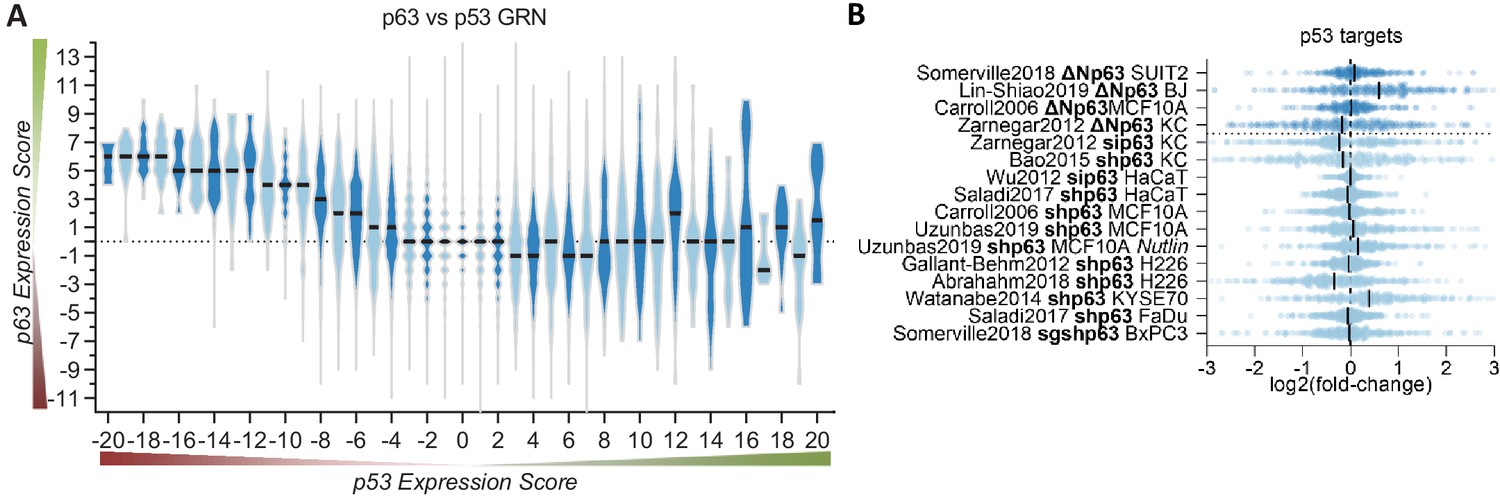
p63 and p53 regulate largely distinct target gene sets.
(A) The p63 Expression Score compared to the previously published p53 Expression Score that was generated using the same meta-analysis approach (Fischer et al., 2016a) for all 16,198 genes for which both scores were available. (B) The scatter plot displays the log2(fold-change) of previously collected high confidence direct p53 target genes (Fischer, 2017) across the 16 p63-dependent gene expression profiling datasets. The black line indicates the median. The data indicates a large degree of independence of p53 targets from p63-dependent expression.
Figure 5 with 4 supplements
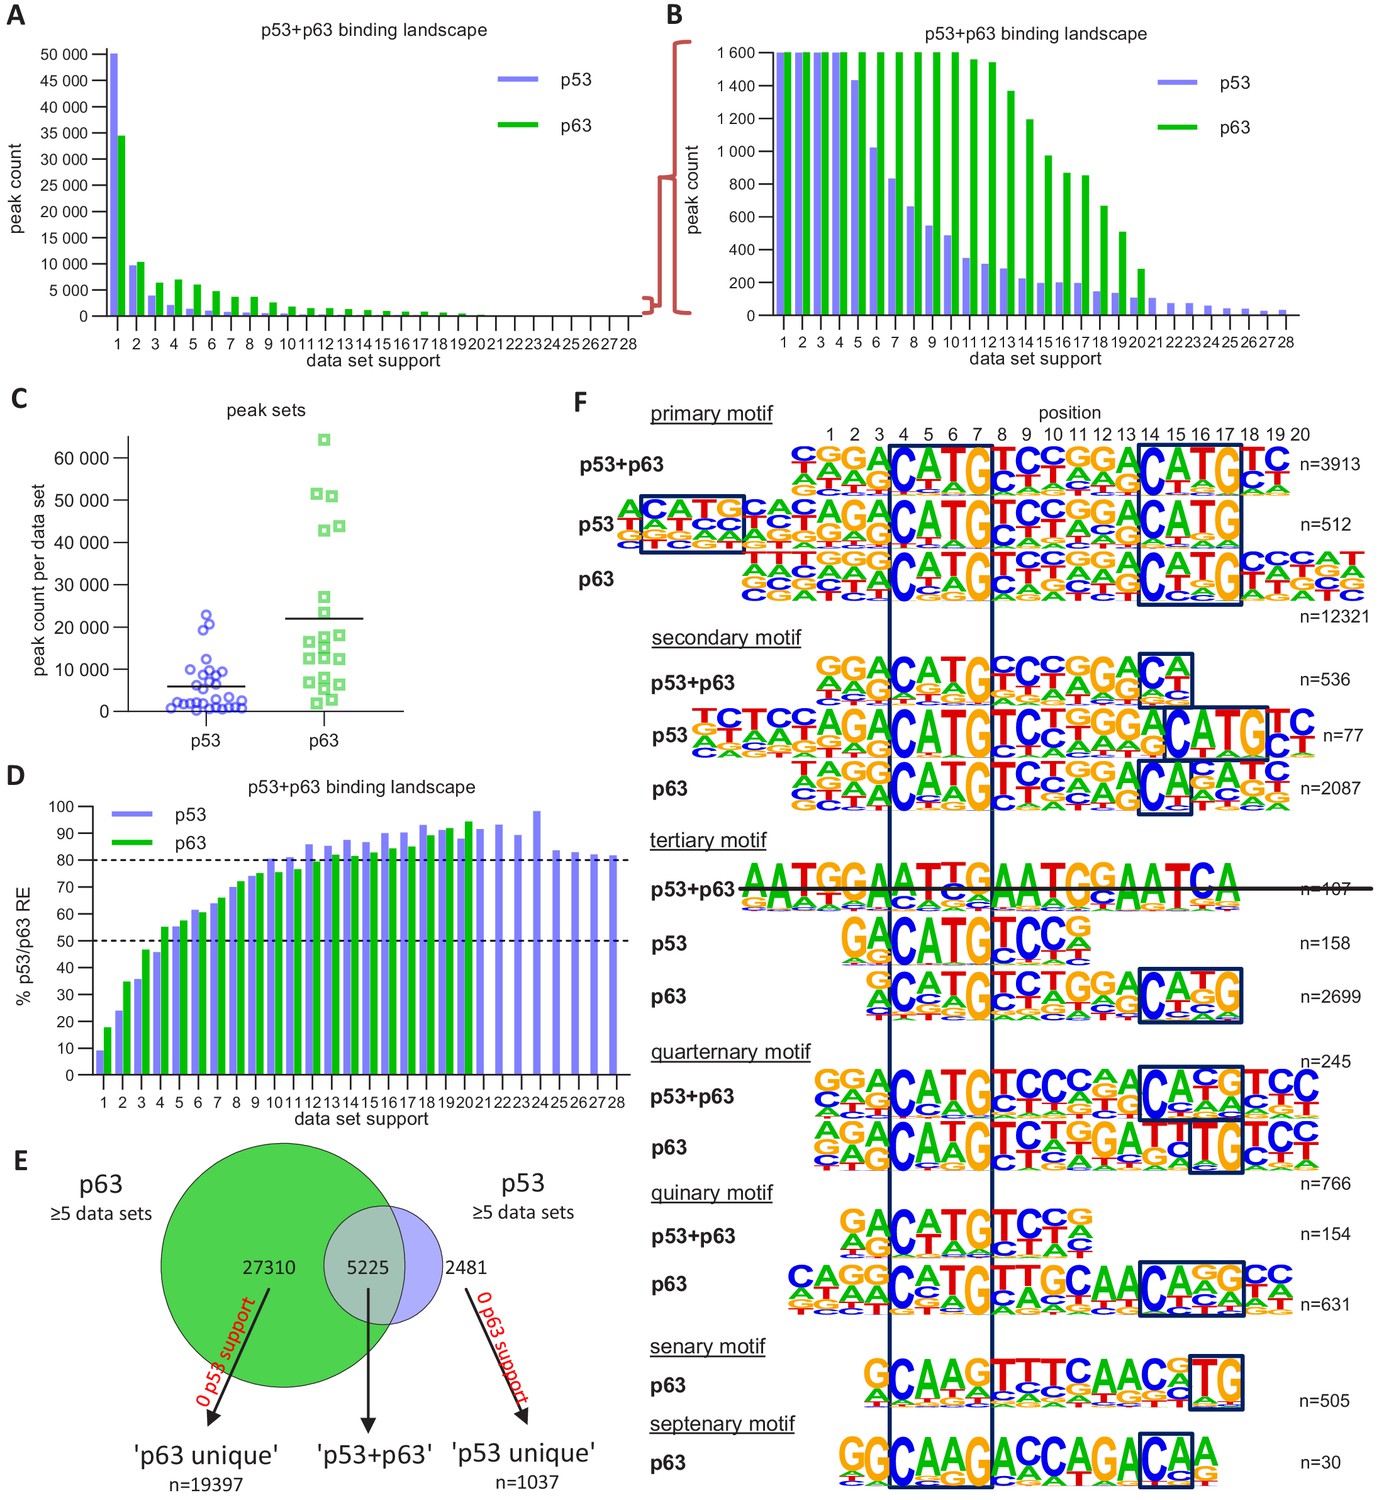
The p63 and p53 DNA-binding landscape.
(A and B) The number of p63 and p53 binding peaks sorted by the number of datasets that commonly identified/support the peak. (C) The number of p53 and p63 peaks identified in the 28 p53 and 20 p63 ChIP-seq datasets, respectively. (D) The relative number of ‘known’ p53 and p63 motifs found by HOMER v4.10 (Heinz et al., 2010) under p53 and p63 peaks, respectively, with increasing dataset support. (E) Schematic of ‘p53’, ‘p63’ and ‘p53+p63’ peak selection for further analyses. (F) De novo motif search results from HOMER v4.10 for the ‘p53+p63’, ‘p53’, and ‘p63’ peak sets. The first round of motif search identified the ‘primary’ motif in each peak set. Using an iterative approach, all peaks that contained the ‘primary’ motif were removed and the de novo motif search was repeated. This iterative approach was followed until no more p53/p63-like motif was identified.
Figure 5—figure supplement 1
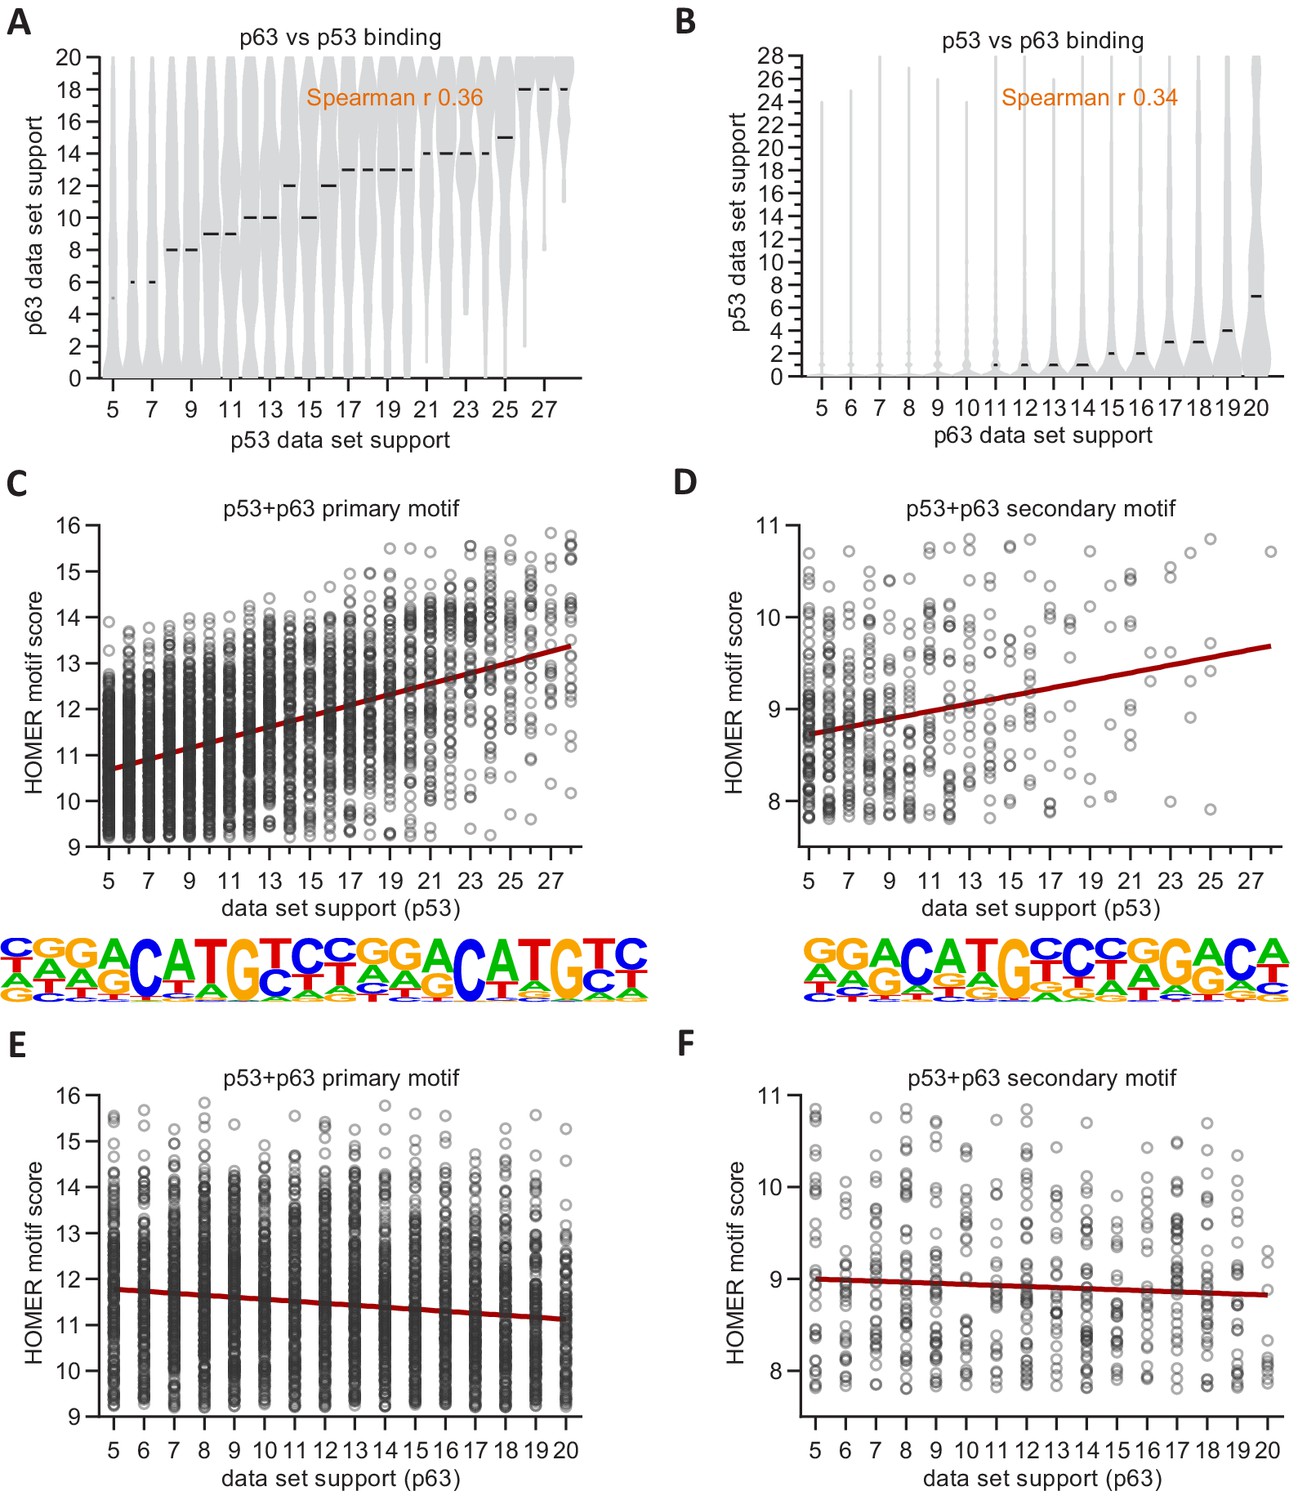
Correlation between p53 and p63 binding frequency and motif consensus.
(A and B) Correlation between dataset support for p53 and p63 binding. (C to F) Correlation between HOMER motif score for primary and secondary ‘p53+p63’ motifs and dataset support for (C and D) p53 binding or (E and F) p63 binding.
Figure 5—figure supplement 2
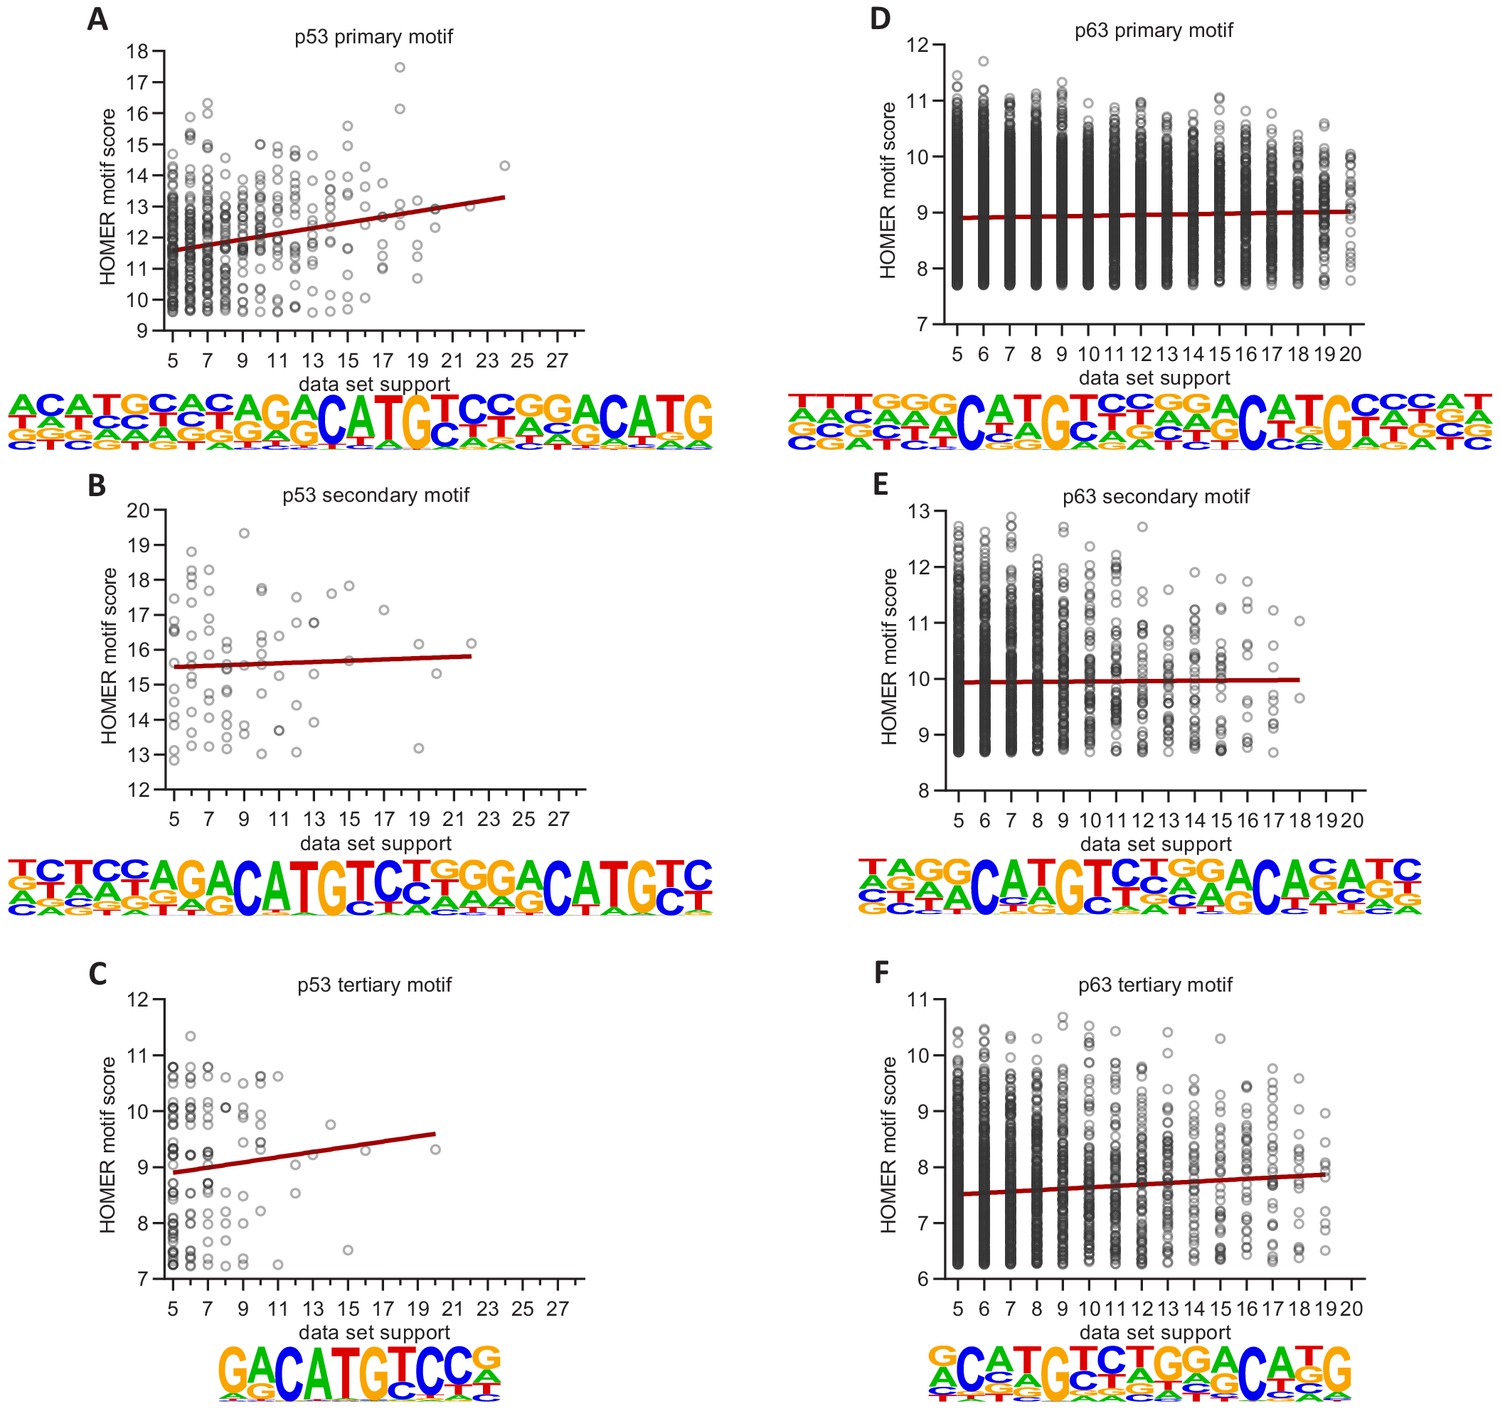
Correlation between p53 and p63 binding frequency and motif consensus.
Correlation between HOMER motif score for primary, secondary, and tertiary (A to C) ‘p53’ motifs or (D to F) ‘p63’ motifs and dataset support for (A to C) p53 binding or (D to F) p63 binding.
Figure 5—figure supplement 3
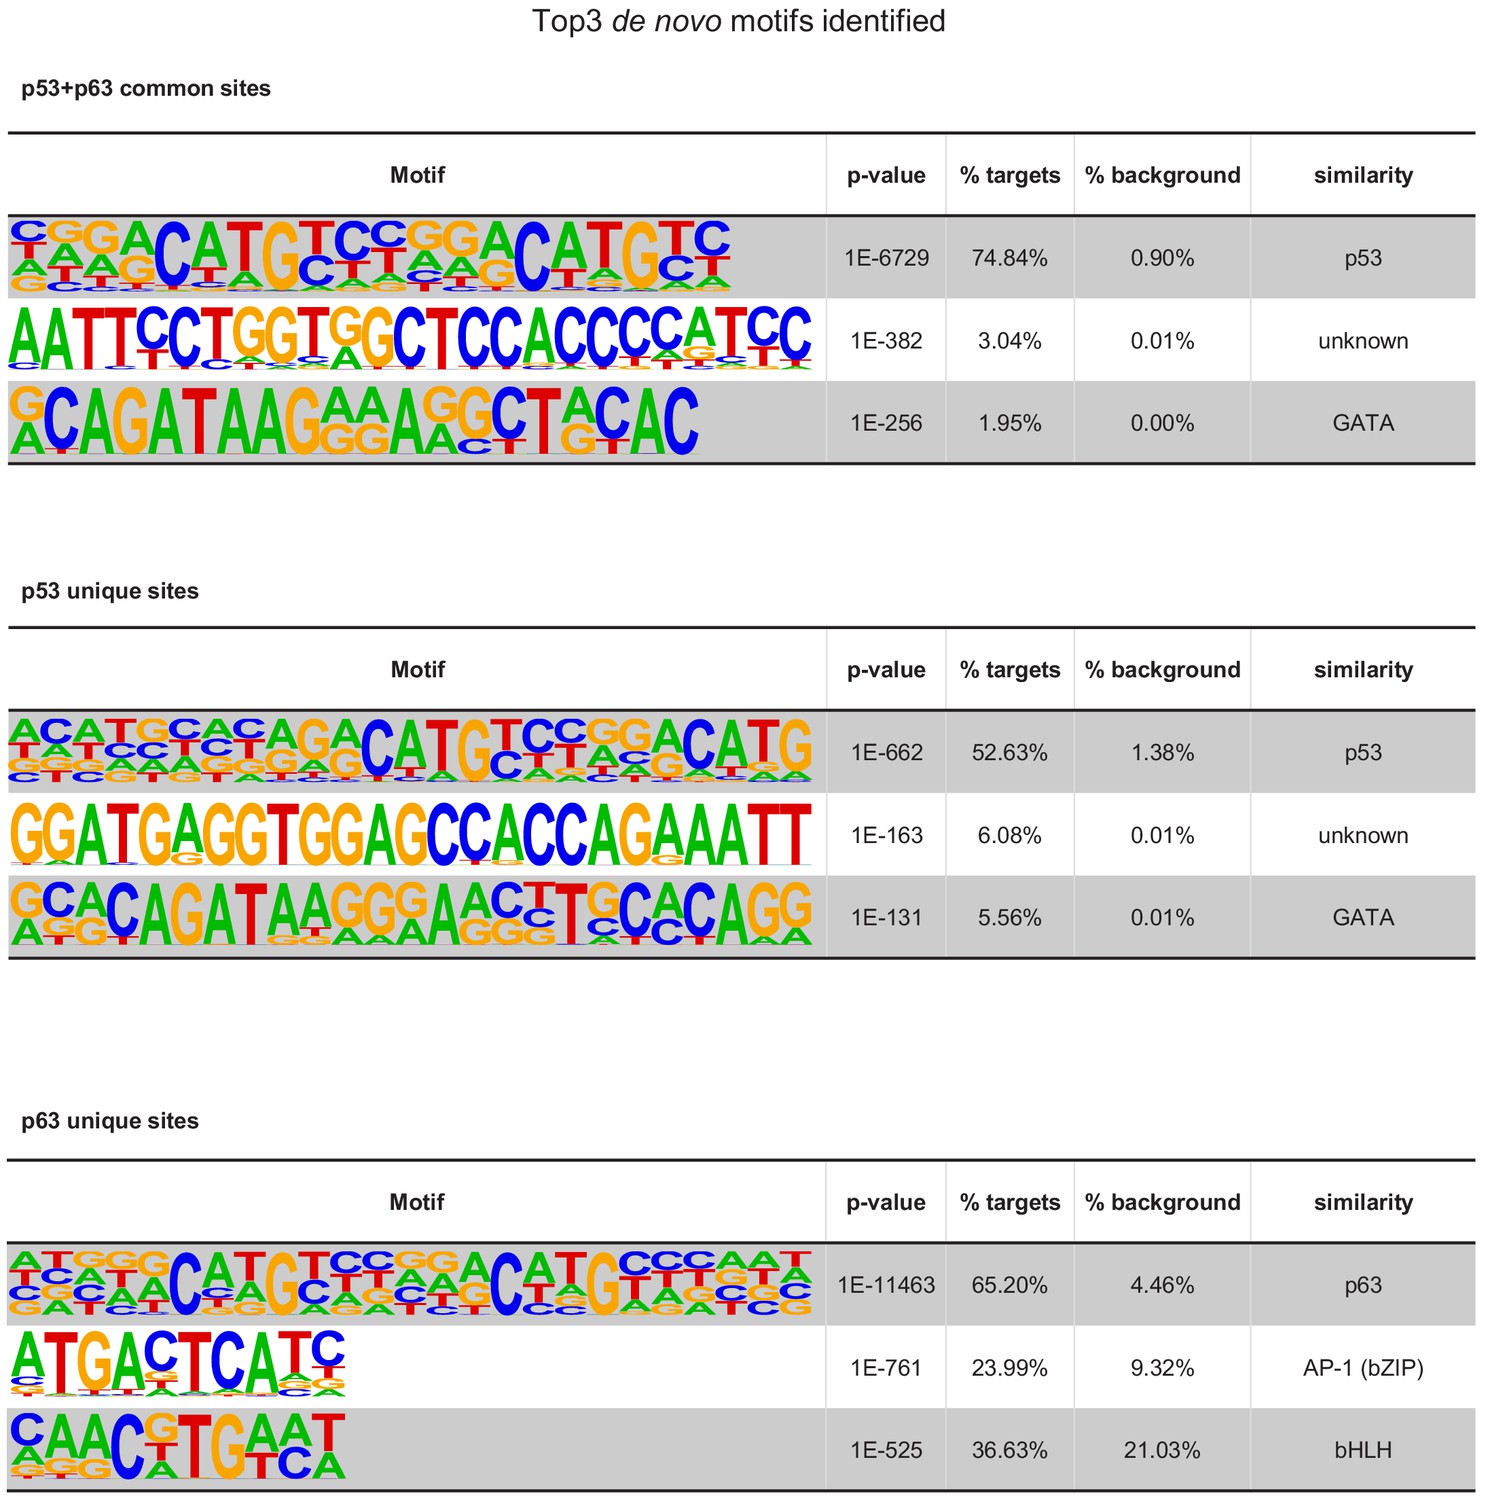
Top motifs co-enriched with primary ‘p53+p63’, ‘p53’, and ‘p63’ motifs at the respective DNA sites.
Figure 5—figure supplement 4
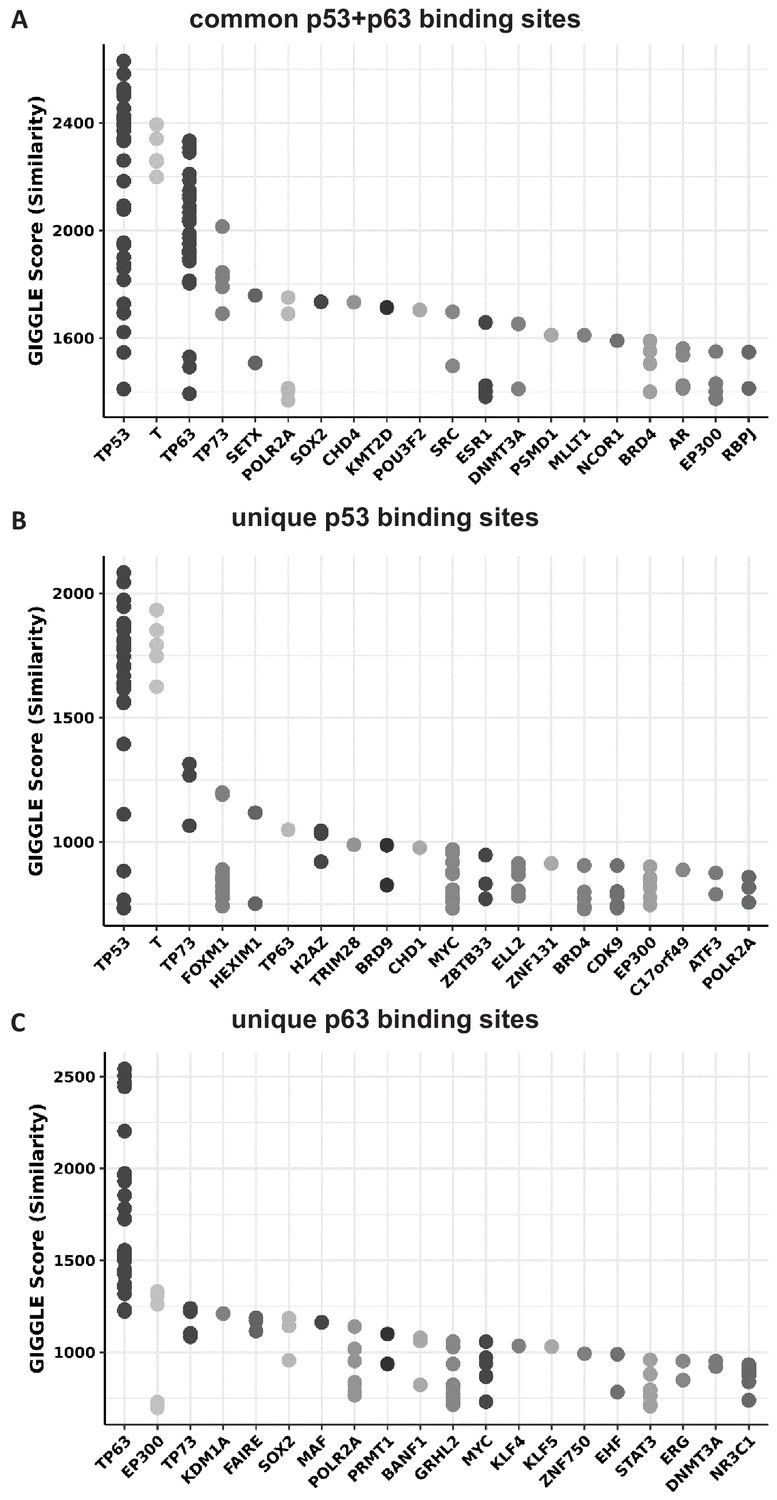
TFs with significantly similar binding repertoirs.
Top 20 TFs with ChIP-seq peak sets similar to (A) the common p53+p63 sites, (B) the unique p53 sites, and (C) the unique p63 sites (Figure 5E) as identified using CistromeDB toolkit.
Of note, some TP53 ChIP-seq datasets are wrongly labeled ‘T’ in the database.
Figure 6
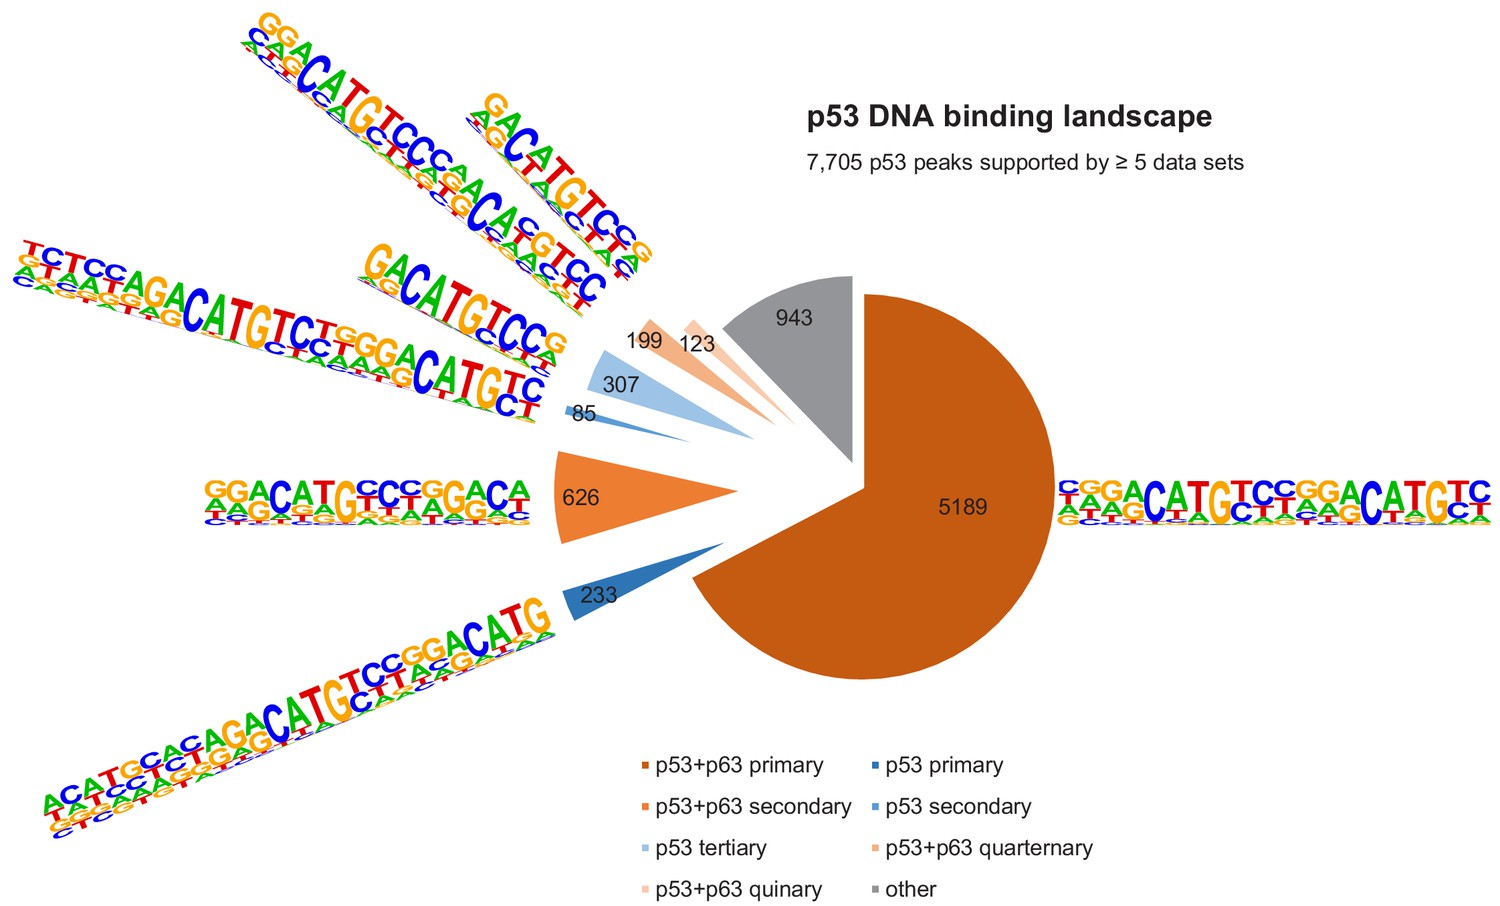
The DNA-binding landscape of p53.
DNA sites occupied by p53 in at least five datasets were searched iterative with the motifs identified by our iterative de novo search (Figure 5F). We searched first for the primary ‘p53+p63’ motif and among all remaining sites for the primary ‘p53’ motif. All other ‘p53+p63’ and ‘p53’ motifs were searched subsequently.
Figure 7 with 1 supplement
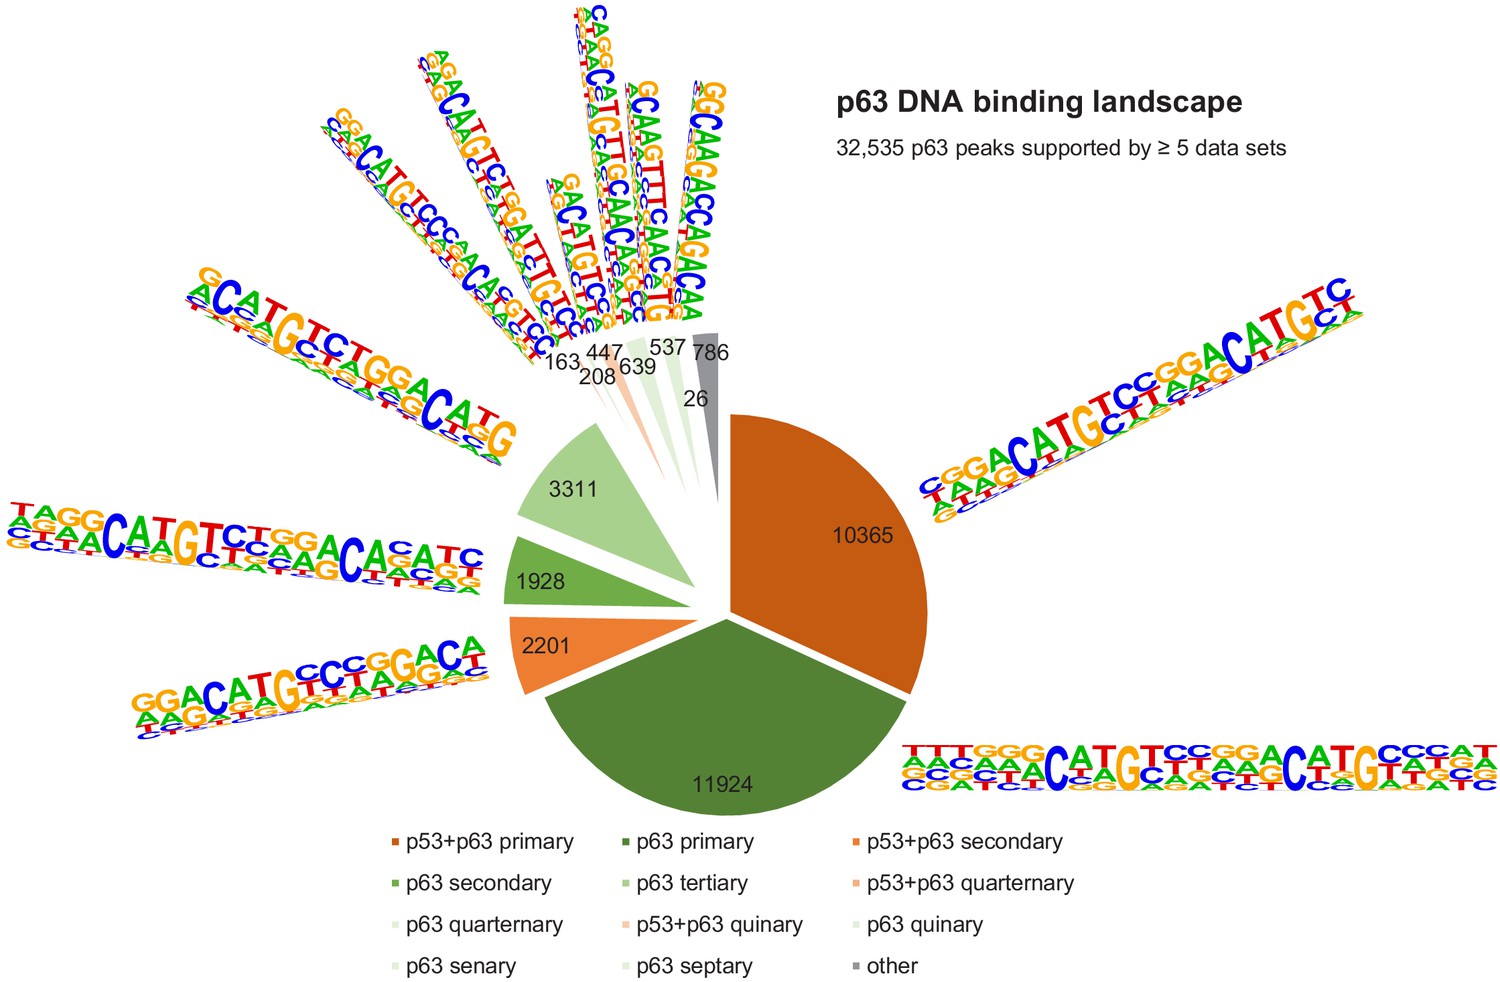
The DNA-binding landscape of p63.
DNA sites occupied by p63 in at least five datasets were searched iterative with the motifs identified by our iterative de novo search (Figure 5F). We searched first for the primary ‘p53+p63’ motif and among all remaining sites for the primary ‘p63’ motif. All other ‘p53+p63’ and ‘p63’ motifs were searched subsequently (Supplementary file 3).
Figure 7—figure supplement 1
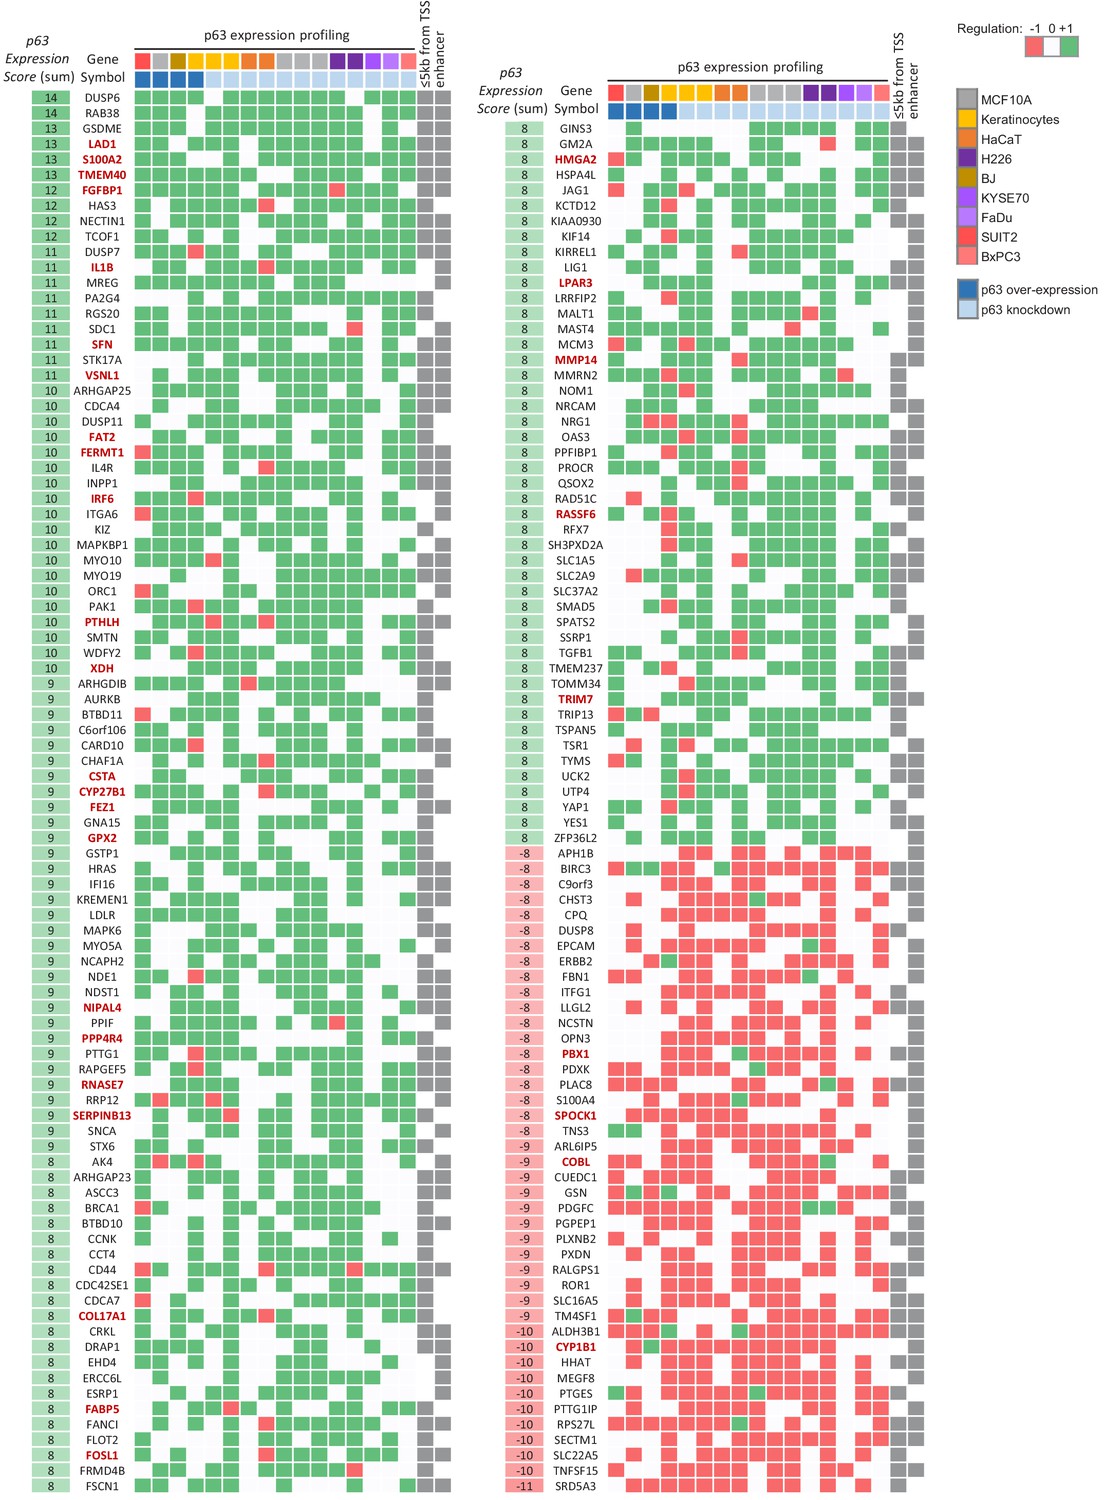
Complement to Table 1.
Genes identified as significantly up- or down-regulated in at least the half of all datasets (|p63 Expression Score|| ≥ 8) that are linked to p63-binding sites supported by at least half of all datasets (≥10) through binding within 5 kb from their TSS or through double-elite enhancer:gene associations (Fishilevich et al., 2017). Using these thresholds we identified 138 and 42 high-probability candidates as directly up- and down-regulated by p63, respectively. Gene names marked in red are also up- or down-regulated across SCCs (Cancer Genome Atlas Research Network et al., 2018).
Figure 8 with 1 supplement
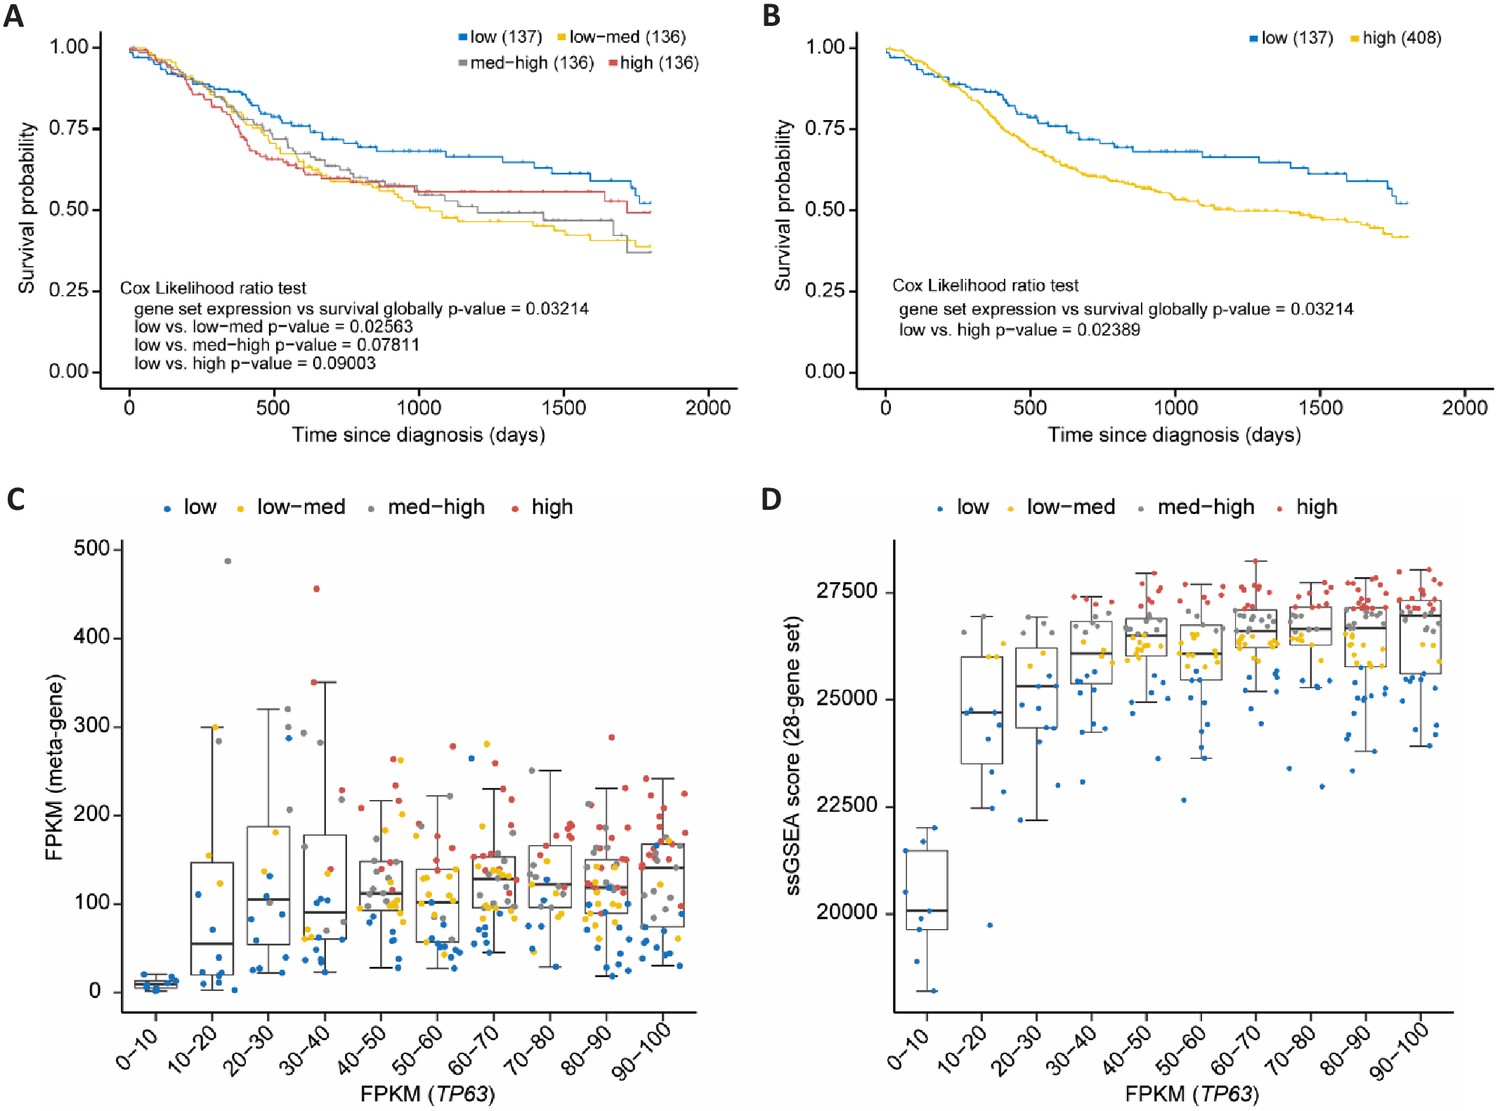
p63/SCC 28-gene set correlates with poorer survival in HNSC.
Kaplan-Meier plots of TCGA HNSC patient survival data. (A) Patients were subdivided in four equally sized subgroups based on expression levels of the 28-gene set. The results suggest a poorer survival of patients with an up-regulated expression of the set genes. (B) To corroborate this finding patients of the subgroups low-med, med-high, and high from (A) were joined to form a new high group. Boxplot in bins of 10 of TP63 FPKM expression values in TCGA HNCS patient sample data compared to (C) FPKM values of a meta-gene comprising the 28-gene set and (D) ssGSEA scores of the 28-gene set. X-axis is right-censored at 100 to better visualize the effect. The full graph is displayed in Figure 8—figure supplement 1.
Figure 8—figure supplement 1
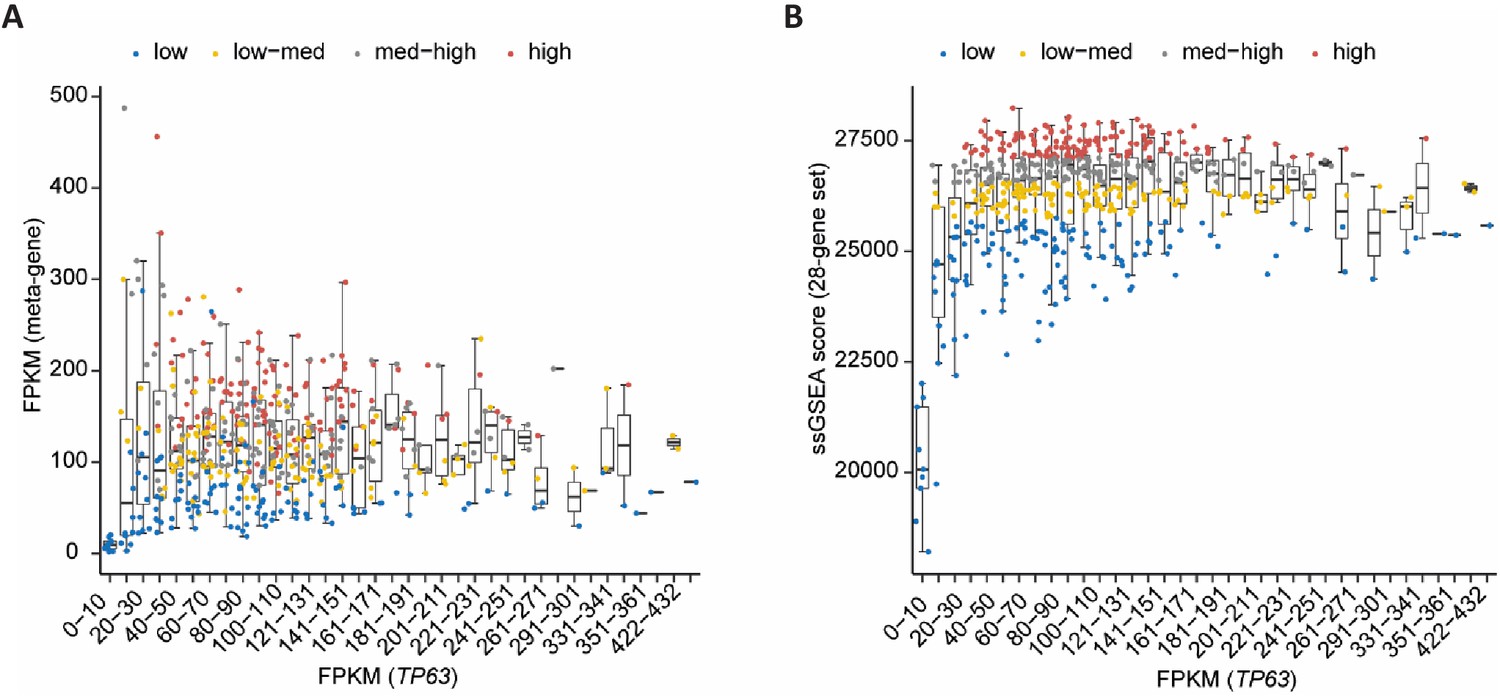
Extension of Figure 8C and D.
Boxplot in bins of 10 of TP63 FPKM expression values in TCGA HNCS patient sample data compared to (A) FPKM values of a meta-gene comprising the 28-gene set and (B) ssGSEA scores of the 28-gene set. Complementary to Figure 8C and D.
Tables
Table 1
High-probability direct p63 target genes.
Genes identified as significantly up- or down-regulated in at least the half of all datasets (|p63 Expression Score| ≥ 8) that are linked to p63-binding sites supported by at least half of all datasets (≥10) through binding within 5 kb from their TSS or through double-elite enhancer-gene associations (Fishilevich et al., 2017). Using these thresholds we identified 138 and 42 high-probability candidates as directly up- and down-regulated by p63, respectively. Gene names marked in bold are also up- or down-regulated across SCCs (Cancer Genome Atlas Research Network et al., 2018).
| Gene symbol | p63 Expression Score | p63 binding within 5 kb from TSS | p63 binding linked through enhancer | Gene symbol | p63 Expression Score | p63 binding within 5 kb from TSS | p63 binding linked through enhancer |
|---|---|---|---|---|---|---|---|
| DUSP6 | 14 | yes | yes | FSCN1 | 8 | yes | yes |
| RAB38 | 14 | yes | yes | GINS3 | 8 | yes | no |
| GSDME | 13 | yes | yes | GM2A | 8 | yes | yes |
| LAD1 | 13 | yes | yes | HMGA2 | 8 | yes | yes |
| S100A2 | 13 | yes | yes | HSPA4L | 8 | yes | yes |
| TMEM40 | 13 | yes | yes | JAG1 | 8 | yes | yes |
| FGFBP1 | 12 | yes | yes | KCTD12 | 8 | yes | no |
| HAS3 | 12 | yes | no | KIAA0930 | 8 | yes | yes |
| NECTIN1 | 12 | yes | yes | KIF14 | 8 | no | yes |
| TCOF1 | 12 | yes | yes | KIRREL1 | 8 | no | yes |
| DUSP7 | 11 | yes | yes | LIG1 | 8 | yes | yes |
| IL1B | 11 | no | yes | LPAR3 | 8 | yes | yes |
| MREG | 11 | no | yes | LRRFIP2 | 8 | no | yes |
| PA2G4 | 11 | yes | no | MALT1 | 8 | no | yes |
| RGS20 | 11 | yes | no | MAST4 | 8 | no | yes |
| SDC1 | 11 | no | yes | MCM3 | 8 | no | yes |
| SFN | 11 | yes | yes | MMP14 | 8 | yes | yes |
| STK17A | 11 | yes | yes | MMRN2 | 8 | yes | no |
| VSNL1 | 11 | yes | yes | NOM1 | 8 | yes | no |
| ARHGAP25 | 10 | yes | yes | NRCAM | 8 | yes | yes |
| CDCA4 | 10 | yes | yes | NRG1 | 8 | no | yes |
| DUSP11 | 10 | yes | no | OAS3 | 8 | yes | yes |
| FAT2 | 10 | yes | no | PPFIBP1 | 8 | yes | yes |
| FERMT1 | 10 | yes | yes | PROCR | 8 | yes | no |
| IL4R | 10 | yes | yes | QSOX2 | 8 | yes | yes |
| INPP1 | 10 | yes | yes | RAD51C | 8 | yes | yes |
| IRF6 | 10 | no | yes | RASSF6 | 8 | no | yes |
| ITGA6 | 10 | no | yes | RFX7 | 8 | yes | no |
| KIZ | 10 | yes | no | SH3PXD2A | 8 | no | yes |
| MAPKBP1 | 10 | no | yes | SLC1A5 | 8 | yes | yes |
| MYO10 | 10 | yes | yes | SLC2A9 | 8 | yes | yes |
| MYO19 | 10 | yes | yes | SLC37A2 | 8 | yes | no |
| ORC1 | 10 | no | yes | SMAD5 | 8 | yes | no |
| PAK1 | 10 | yes | no | SPATS2 | 8 | no | yes |
| PTHLH | 10 | yes | yes | SSRP1 | 8 | no | yes |
| SMTN | 10 | yes | no | TGFB1 | 8 | yes | yes |
| WDFY2 | 10 | yes | no | TMEM237 | 8 | yes | no |
| XDH | 10 | yes | yes | TOMM34 | 8 | yes | no |
| ARHGDIB | 9 | yes | yes | TRIM7 | 8 | yes | yes |
| AURKB | 9 | yes | no | TRIP13 | 8 | yes | no |
| BTBD11 | 9 | yes | no | TSPAN5 | 8 | yes | no |
| C6orf106 | 9 | yes | no | TSR1 | 8 | no | yes |
| CARD10 | 9 | yes | yes | TYMS | 8 | yes | yes |
| CHAF1A | 9 | no | yes | UCK2 | 8 | yes | yes |
| CSTA | 9 | yes | no | UTP4 | 8 | no | yes |
| CYP27B1 | 9 | yes | no | YAP1 | 8 | yes | no |
| FEZ1 | 9 | yes | yes | YES1 | 8 | yes | yes |
| GNA15 | 9 | yes | no | ZFP36L2 | 8 | no | yes |
| GPX2 | 9 | yes | no | APH1B | -8 | no | yes |
| GSTP1 | 9 | yes | no | BIRC3 | -8 | yes | yes |
| HRAS | 9 | yes | yes | C9orf3 | -8 | yes | yes |
| IFI16 | 9 | yes | yes | CHST3 | -8 | no | yes |
| KREMEN1 | 9 | yes | yes | CPQ | -8 | no | yes |
| LDLR | 9 | yes | no | DUSP8 | -8 | yes | no |
| MAPK6 | 9 | yes | yes | EPCAM | -8 | no | yes |
| MYO5A | 9 | no | yes | ERBB2 | -8 | no | yes |
| NCAPH2 | 9 | yes | no | FBN1 | -8 | no | yes |
| NDE1 | 9 | yes | yes | ITFG1 | -8 | yes | no |
| NDST1 | 9 | yes | yes | LLGL2 | -8 | yes | yes |
| NIPAL4 | 9 | yes | yes | NCSTN | -8 | no | yes |
| PPIF | 9 | no | yes | OPN3 | -8 | no | yes |
| PPP4R4 | 9 | yes | no | PBX1 | -8 | yes | yes |
| PTTG1 | 9 | yes | yes | PDXK | -8 | no | yes |
| RAPGEF5 | 9 | yes | yes | PLAC8 | -8 | yes | yes |
| RNASE7 | 9 | yes | yes | S100A4 | -8 | no | yes |
| RRP12 | 9 | no | yes | SPOCK1 | -8 | no | yes |
| SERPINB13 | 9 | yes | no | TNS3 | -8 | no | yes |
| SNCA | 9 | no | yes | ARL6IP5 | -9 | no | yes |
| STX6 | 9 | yes | no | COBL | -9 | no | yes |
| AK4 | 8 | no | yes | CUEDC1 | -9 | yes | yes |
| ARHGAP23 | 8 | yes | yes | GSN | -9 | yes | no |
| ASCC3 | 8 | yes | yes | PDGFC | -9 | yes | yes |
| BRCA1 | 8 | yes | no | PGPEP1 | -9 | no | yes |
| BTBD10 | 8 | yes | yes | PLXNB2 | -9 | yes | yes |
| CCNK | 8 | yes | no | PXDN | -9 | no | yes |
| CCT4 | 8 | yes | no | RALGPS1 | -9 | yes | yes |
| CD44 | 8 | yes | yes | ROR1 | -9 | yes | no |
| CDC42SE1 | 8 | yes | no | SLC16A5 | -9 | yes | yes |
| CDCA7 | 8 | yes | no | TM4SF1 | -9 | yes | yes |
| COL17A1 | 8 | yes | no | ALDH3B1 | −10 | yes | yes |
| CRKL | 8 | yes | yes | CYP1B1 | −10 | no | yes |
| DRAP1 | 8 | yes | yes | HHAT | −10 | yes | yes |
| EHD4 | 8 | no | yes | MEGF8 | −10 | no | yes |
| ERCC6L | 8 | no | yes | PTGES | −10 | yes | no |
| ESRP1 | 8 | no | yes | PTTG1IP | −10 | no | yes |
| FABP5 | 8 | yes | no | RPS27L | −10 | yes | yes |
| FANCI | 8 | yes | yes | SECTM1 | −10 | yes | yes |
| FLOT2 | 8 | yes | no | SLC22A5 | −10 | yes | no |
| FOSL1 | 8 | yes | yes | TNFSF15 | −10 | yes | yes |
| FRMD4B | 8 | yes | no | SRD5A3 | −11 | yes | no |
Additional files
-
Supplementary file 1
Detailed information on publicly available p63-dependent gene expression profiling and p63 ChIP-seq datasets that were integrated in this study.
- https://cdn.elifesciences.org/articles/63266/elife-63266-supp1-v2.xlsx
-
Supplementary file 2
Meta-analysis from 16 p63-dependent gene expression information datasets (listed in Suppelemtary File 1) to generate the p63 Expression Score for 19,156 human genes.
- https://cdn.elifesciences.org/articles/63266/elife-63266-supp2-v2.xlsx
-
Supplementary file 3
p63- and p53-binding sites identified in at least 5 out of 20 and 28 ChIP-seq datasets, respectively.
Binding sites are listed with their ChIP-seq dataset support and highest scoring p63 response elements (p63REs) or p53REs. Genes associated with p63-binding sites through proximal TSS binding or enhancers are listed.
- https://cdn.elifesciences.org/articles/63266/elife-63266-supp3-v2.xlsx
-
Transparent reporting form
- https://cdn.elifesciences.org/articles/63266/elife-63266-transrepform-v2.docx
Download links
A two-part list of links to download the article, or parts of the article, in various formats.
Downloads (link to download the article as PDF)
Open citations (links to open the citations from this article in various online reference manager services)
Cite this article (links to download the citations from this article in formats compatible with various reference manager tools)
Dissecting the DNA binding landscape and gene regulatory network of p63 and p53
eLife 9:e63266.
https://doi.org/10.7554/eLife.63266


