Adipocyte NR1D1 dictates adipose tissue expansion during obesity
- Centre for Biological Timing, Faculty of Biology, Medicine and Health, University of Manchester, United Kingdom
- Oxford Centre for Diabetes, Endocrinology and Metabolism, University of Oxford, and NIHR Oxford Biomedical Research Centre, John Radcliffe Hospital, United Kingdom
- Digital Insights, Qiagen, United States
- Stoller Biomarker Discovery Centre, Division of Cancer Sciences, Faculty of Biology, Medicine and Health, University of Manchester, United Kingdom
- Division of Informatics, Imaging and Data Sciences, Faculty of Biology, Medicine and Health, University of Manchester, United Kingdom
Figures
Figure 1 with 1 supplement
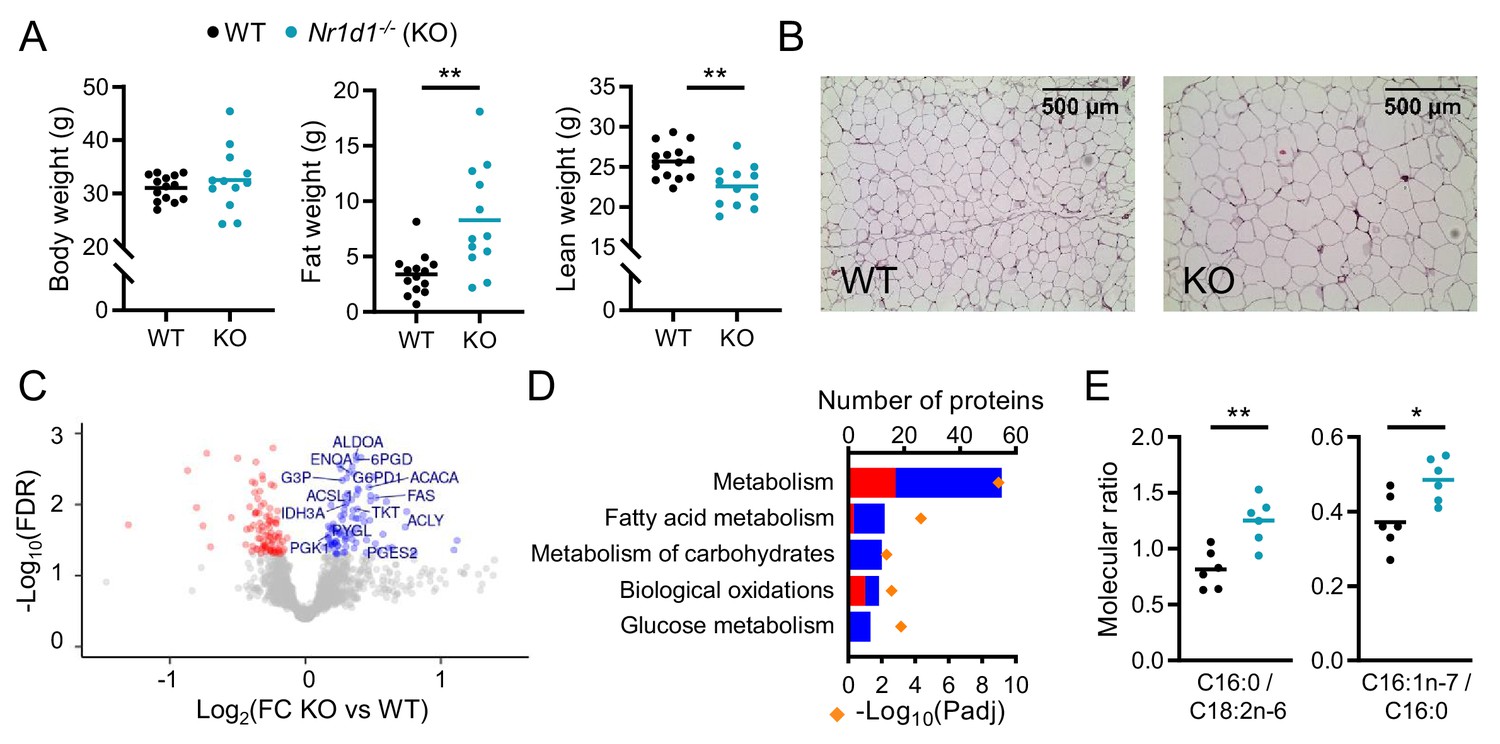
Global deletion of Nr1d1 results in obesity and increased adipose lipid synthesis.
(A) Nr1d1-/- mice exhibit significantly greater fat mass relative to wild-type (WT) littermate controls. Body weight, fat mass, and lean mass of 13-week-old males (n=12–14/group). (B) Increased fat mass in Nr1d1-/- mice is reflected in adipocyte hypertrophy in gonadal white adipose tissue (gWAT) (representative 10× H and E images shown). (C, D) gWAT from Nr1d1-/- mice exhibits a programme of increased lipid synthesis. Proteomic profiling of gWAT depots (Nr1d1-/- mice plotted relative to their respective weight-matched littermate controls, n=6/group (C)) shows deregulation of metabolic regulators and enrichment (D) of metabolic pathways (up- and down-regulated proteins shown in blue and red, respectively). Top five (by protein count) significantly enriched Reactome terms shown. (E) Analyses of fatty acid (FA) composition reveal increased de novo lipogenesis (reflected by C16:0/C18:2 n ratio) and FA desaturation (reflected by C16:1 n-7/C16:0 ratio) in gWAT of Nr1d1-/-. n=6/group. Data presented as mean with individual data points (A, E). *p<0.05, **p<0.01, unpaired two-tailed t-test (A, E). Source data for panels C, D available in Figure 1—source data 1.
-
Figure 1—source data 1
Source data (protein lists) for Figure 1, panels C, D.
- https://cdn.elifesciences.org/articles/63324/elife-63324-fig1-data1-v2.xlsx
Figure 1—figure supplement 1
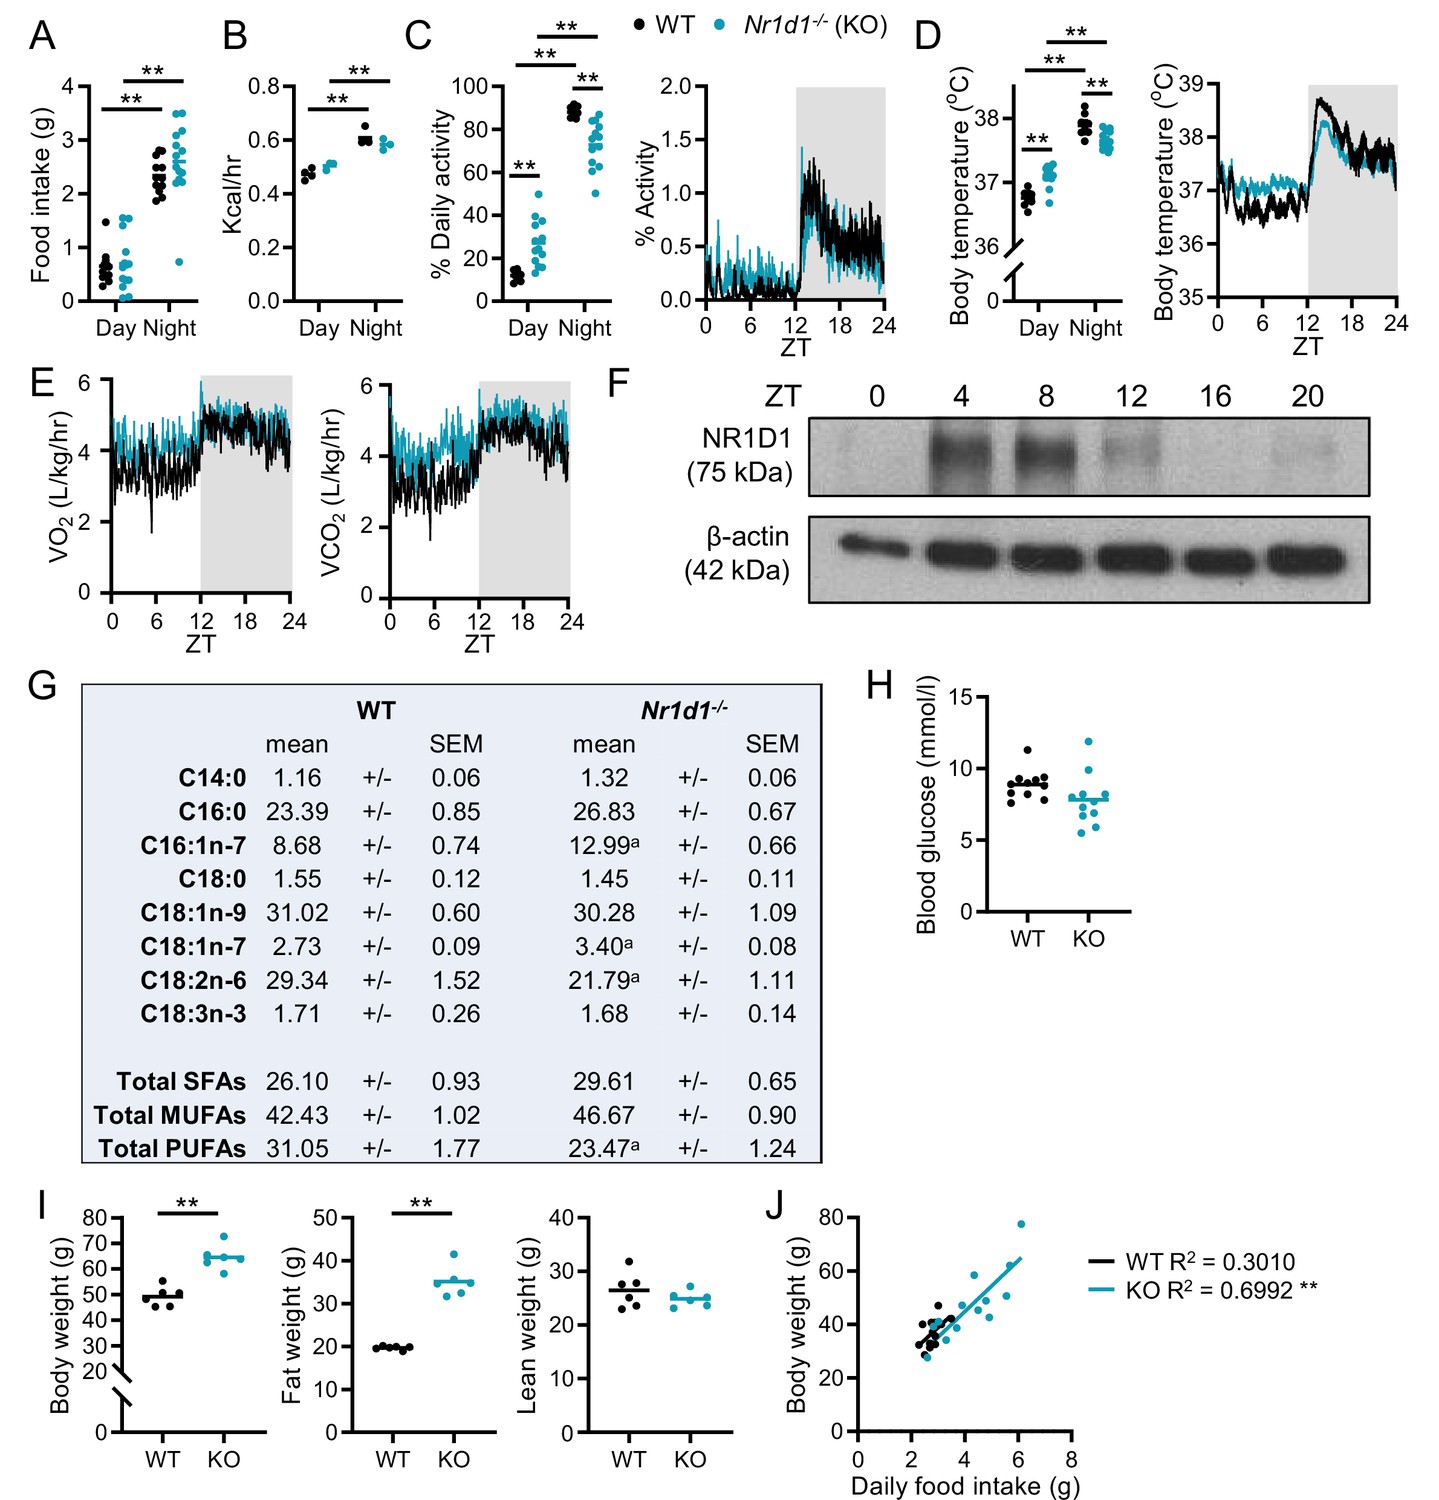
Rhythmic physiology and susceptibility to diet-induced obesity in Nr1d1-/- mice.
(A–E) Under light:dark conditions, Nr1d1-/- maintain robust diurnal rhythms in physiology and behaviour. Day/night food intake (A) (n=12–14/group) and energy expenditure (B) (n=3–4/group). Diurnal activity profile, mean activity (C), and body temperature (D) of adult male Nr1d1-/- mice (activity is reported as the percentage of daily activity, n=9–13/group). Diurnal profiles in oxygen consumption (VO2) and carbon dioxide production (VCO2) (E) (n=9–13/group). (F) Western blot showing NR1D1 expression in adipose tissue over 24 hr. (G) Molar percentages of fatty acid species in wild-type (WT) and Nr1d1-/- gonadal white adipose tissue (gWAT). n=6/group. ap<0.05. (H) Daytime (ZT6) fasted blood glucose levels (n=11/group). (I) Nr1d1-/- mice are highly susceptible to diet-induced obesity, showing significantly higher body weights and fat mass than control mice after 10 weeks of high-fat diet (HFD) feeding (n=6/group). (J) In a separate study, food intake was tracked for individual mice over 3 weeks of HFD feeding (n=13/group). Mean daily food intake in Nr1d1-/- mice showed a significant positive correlation with body weight. Data presented as individual data points with mean (A–D, H, I), as mean ± SEM (E), or as individual data points with line of best fit (J). **p<0.01, two-way ANOVA with Tukey’s multiple comparisons tests (A–D), unpaired t-tests with correction for multiple testing (G), unpaired two-tailed t-tests (H, I), linear regression (J).
-
Figure 1—figure supplement 1—source data 1
Raw uncropped and annotated blot images for Figure 1—figure supplement 1, panel F.
- https://cdn.elifesciences.org/articles/63324/elife-63324-fig1-figsupp1-data1-v2.zip
Figure 2 with 1 supplement

Impact of adipose Nr1d1 deletion is limited under normal conditions.
(A) Nr1d1 and Arntl (Bmal1) gene expression in gonadal white adipose tissue (gWAT), brown adipose (BAT), liver and lung in Nr1d1Flox2-6 (Cre-ve), and Nr1d1Flox2-6:AdipoqCre (Cre+ve) mice (n=4–5/group). (B) NR1D1 protein expression (arrowhead) in Cre-ve and targeted Cre+ve mice. Lower blot shows Ponceau S protein staining. (C) Body weight, fat mass, and lean mass in 13-week-old Cre-ve and Cre+ve male mice (n=7/group). (D–F) Both Nr1d1Flox2-6:AdipoqCre Cre+ve and Cre-ve mice demonstrate diurnal rhythms in behaviour and physiology, with no genotype differences observed in food intake (D), energy expenditure and daily activity (E) or body temperature (F) in 13-week-old males (n=4–7/group). Data presented as mean ± SEM (A) or as mean with individual data points (C–F). *p<0.05, **p<0.01, unpaired t-tests corrected for multiple comparisons (A), unpaired t-tests (C), two-way ANOVA with Tukey’s multiple comparisons tests (D–F).
-
Figure 2—source data 1
Raw uncropped and annotated blot images for Figure 2, panel B.
- https://cdn.elifesciences.org/articles/63324/elife-63324-fig2-data1-v2.zip
Figure 2—figure supplement 1
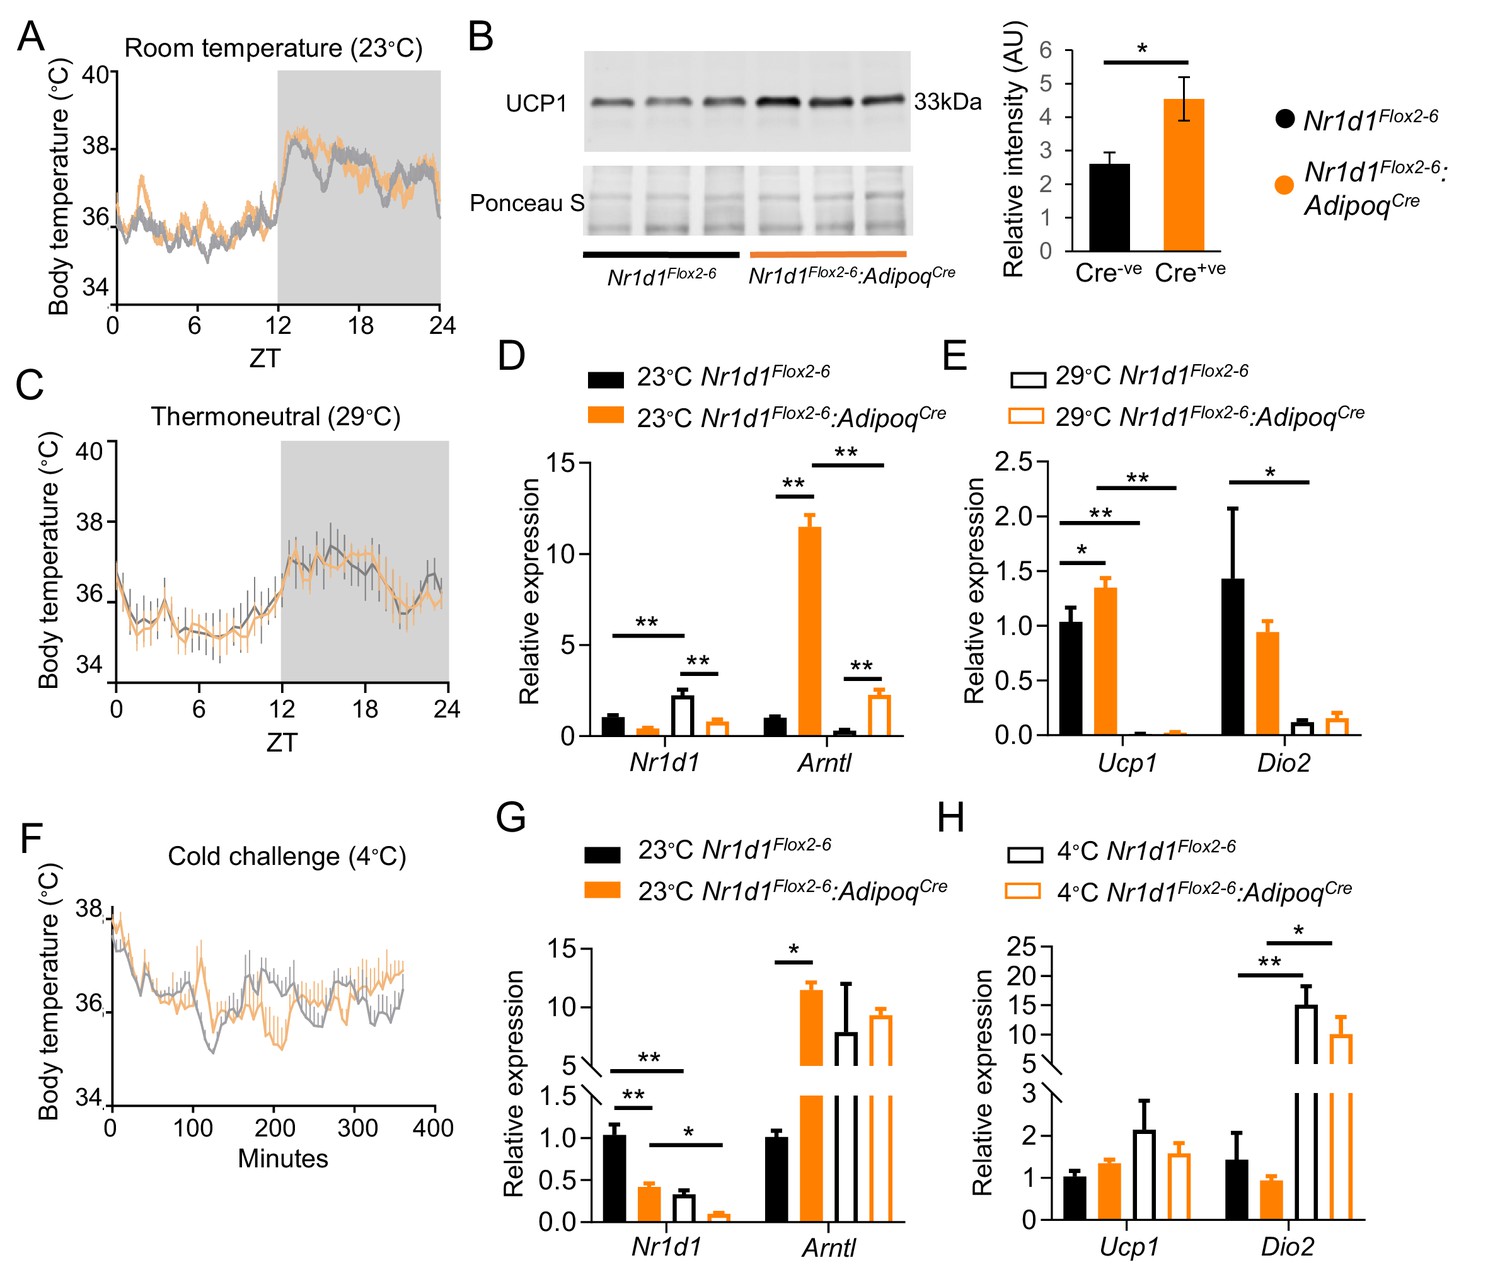
Loss of Nr1d1 expression in brown adipocytes does not alter body temperature.
(A–B) Housing under standard laboratory conditions did not alter daily profiles in body temperature in the Nr1d1Flox2-6:AdipoqCre Cre+ve mice, when compared to control Cre-ve littermate controls (A; n=5–6/group), despite showing increased uncoupling protein 1 (UCP1) expression (B; n=3/group). (C) No genotype differences were observed in body temperature profiles recorded from mice housed under thermoneutral conditions (28–30°C) for 3 weeks (n=5–6/group). (D–E) Brown adipose tissue (BAT) gene expression studies (qPCR) demonstrated expected de-repression of Arntl expression in Cre+ve mice, and expected reduction in Ucp1 expression at thermoneutral conditions in both genotypes (compared to room temperature) (n=5–6/group). (F) Nr1d1Flox2-6:AdipoqCre Cre+ve mice and control littermates were exposed to an acute cold challenge (4°C for 6 hr) with body temperature recording throughout (n=5–6/group). No genotype difference in thermogenic response was observed. (G–H) As previously reported, Nr1d1 expression was reduced by cold exposure; however, no genotype differences were observed cold-induced increases in Ucp1 or Dio2 gene expression (n=5–6/group). Data presented as mean ± SEM. *p<0.05, **p<0.01, Student’s t-test (B), two-way ANOVA with Tukey’s multiple comparisons tests (D, E, G, H).
-
Figure 2—figure supplement 1—source data 1
Raw uncropped and annotated blot images for Figure 2—figure supplement 1, panel B.
- https://cdn.elifesciences.org/articles/63324/elife-63324-fig2-figsupp1-data1-v2.zip
Figure 3 with 1 supplement
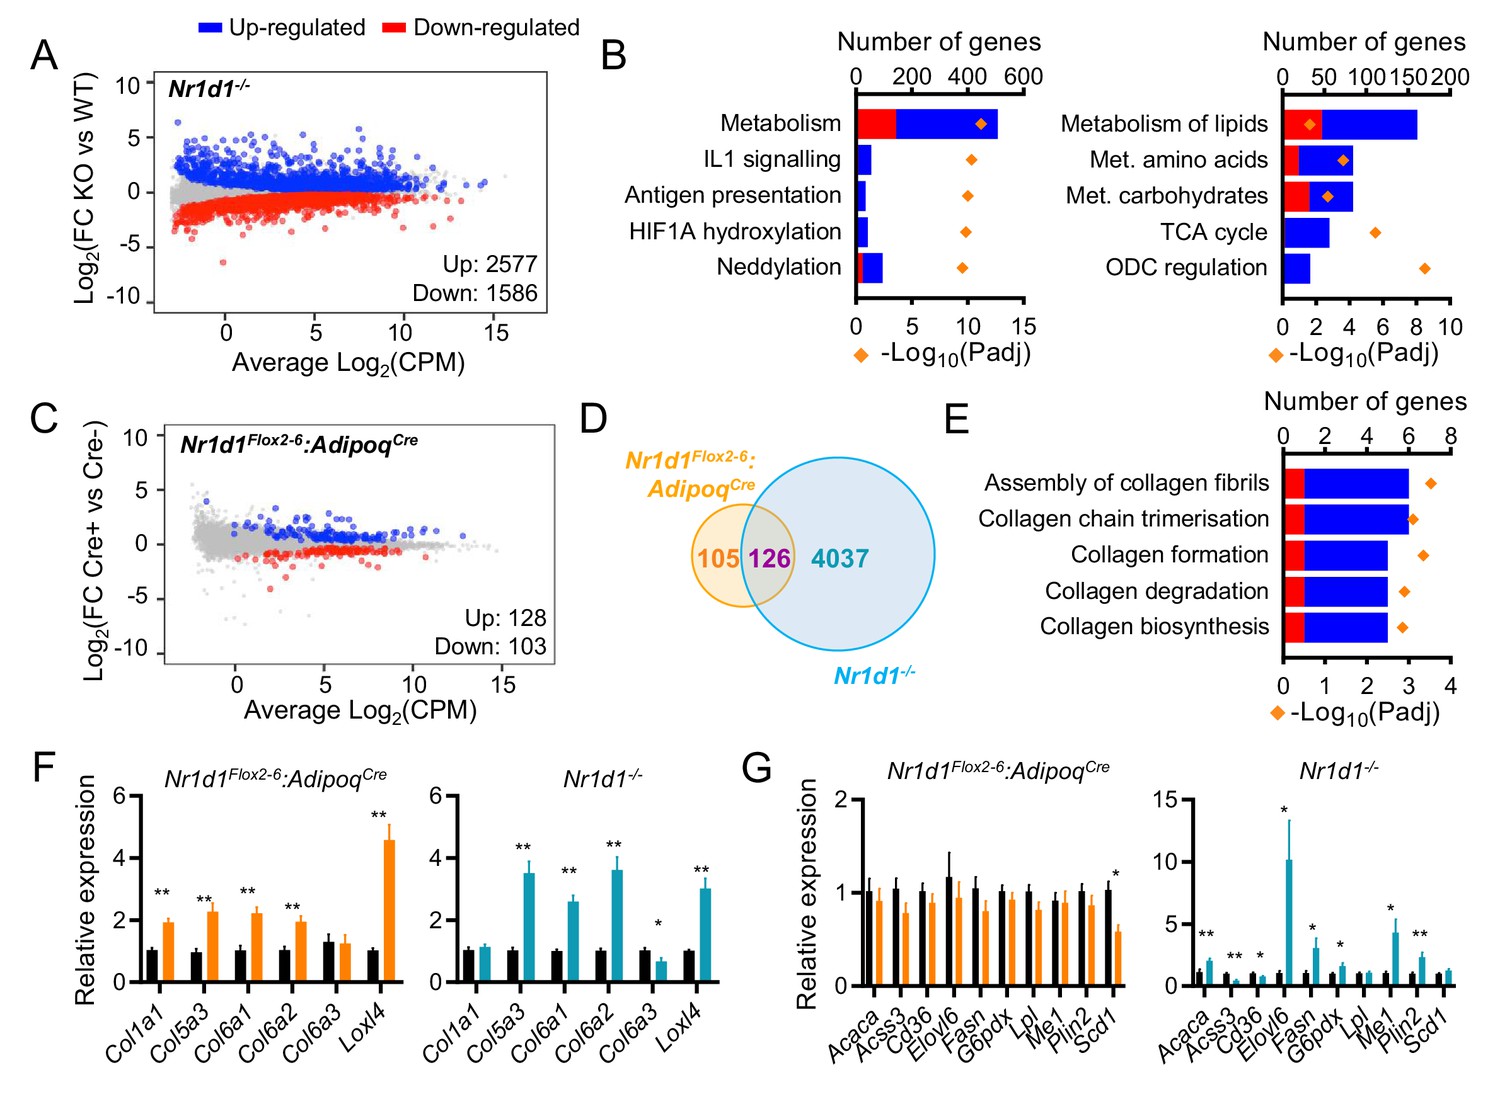
Global or adipose-specific Nr1d1 deletion produces distinctive gene expression profiles.
(A, B) Nr1d1-/- gonadal white adipose tissue (gWAT) demonstrates extensive remodelling of the transcriptome and up-regulation of metabolic pathways. Mean difference (MD) plot (A) showing significantly (FDR<0.05) up- (blue) and down- (red) regulated genes in gWAT of Nr1d1-/- mice compared to littermate controls (n=6/group). Pathway analysis (B) of significantly differentially expressed (DE) genes (FDR<0.05): top five (by gene count) significantly enriched Reactome terms shown (left panel), top five (by gene count) metabolic pathways shown (right panel). Up-regulated genes in blue, down-regulated in red. ODC = ornithine decarboxylase. (C) By contrast, RNA-seq demonstrates modest remodelling of the transcriptome in gWAT of Nr1d1Flox2-6:AdipoqCre mice. MD plot, n=6/group. (D) Venn diagram showing overlap of DE genes in Nr1d1Flox2-6:AdipoqCre and Nr1d1-/- gWAT. (E) Pathway analysis of 126 commonly DE genes. Top five (by gene count) significantly enriched Reactome terms shown. (F, G) Collagen genes are commonly up-regulated in both genotypes (F), whilst genes of lipid metabolism are not DE in Nr1d1Flox2-6:AdipoqCre (G). gWAT qPCR, n=6–7/group. Data presented as mean ± SEM (F, G). *p<0.05, **p<0.01, unpaired t-tests corrected for multiple comparisons (F, G). Source data for panels A–E available in Figure 3—source data 1.
-
Figure 3—source data 1
Source data (lists of differentially expressed genes, pathway lists) for Figure 3, panels A–E.
- https://cdn.elifesciences.org/articles/63324/elife-63324-fig3-data1-v2.xlsx
Figure 3—figure supplement 1
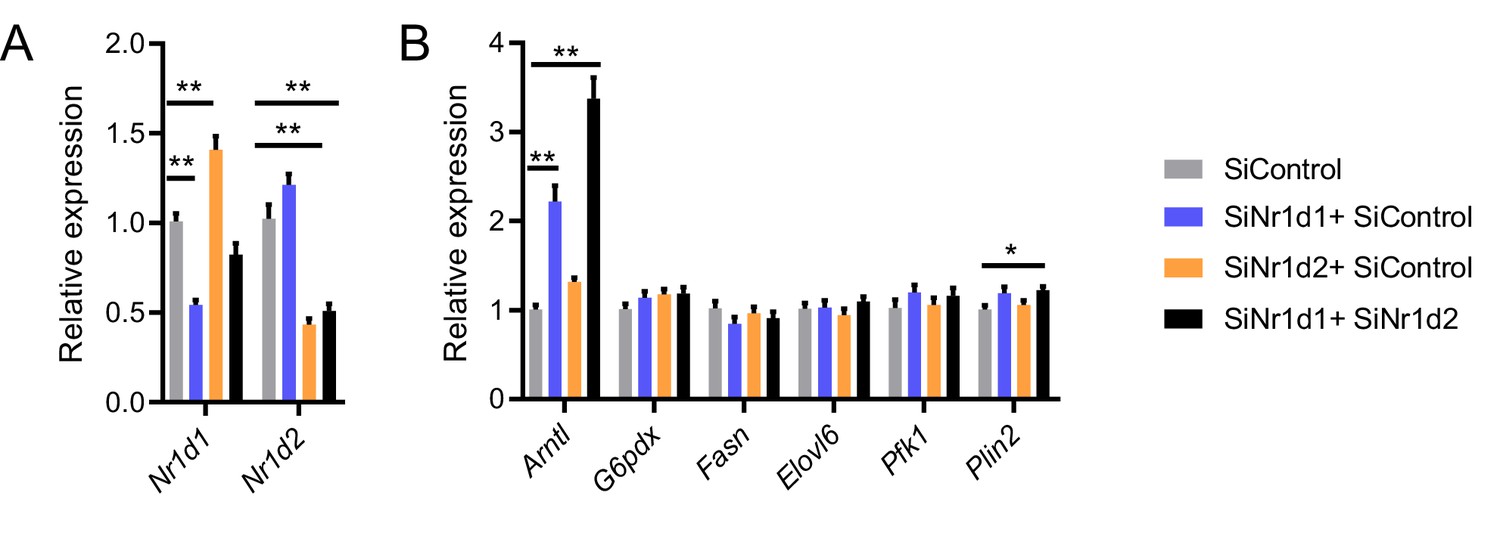
Impact of Nr1d1 and Nr1d2 loss in vitro.
(A, B) Double knockdown of Nr1d1 and Nr1d2 in differentiated 3T3-L1 cells (A) results in marked de-repression of Arntl expression but minimal effects on expression of typically pro-lipogenic genes (B) (data compiled from three replicated knockdown experiments, n=8–9/treatment group). Data presented as mean ± SEM. *p<0.05, **p<0.01, one-way ANOVA with Dunnett’s multiple comparisons tests (A, B).
Figure 4 with 1 supplement
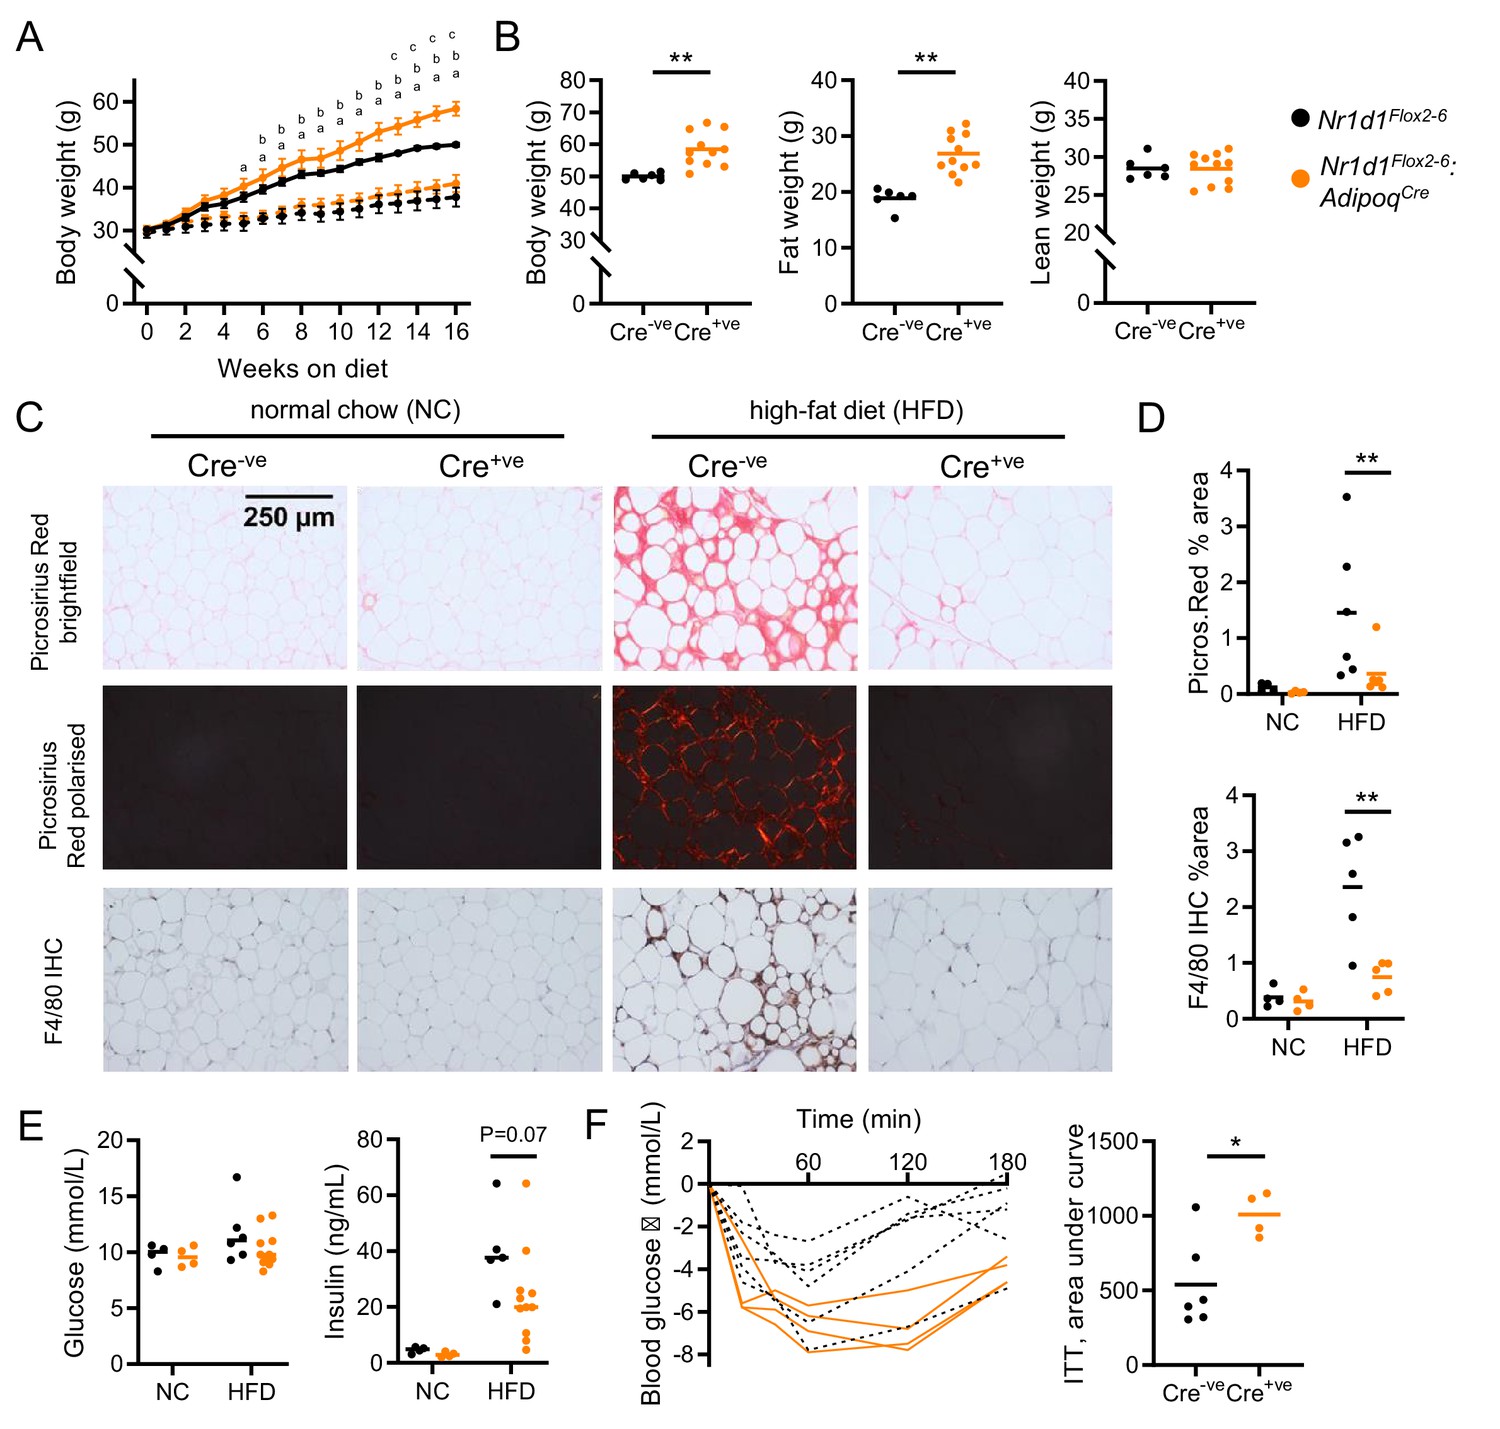
Diet-induced obesity unmasks a role for NR1D1 in the regulation of adipose expansion.
(A, B) High-fat diet (HFD) leads to exaggerated adiposity in Nr1d1Flox2-6:AdipoqCre mice. Body weight track of Cre-ve and Cre+ve male mice on HFD (solid line) or normal chow (NC) (dashed line) (A) (ap<0.05: Cre+ve NC vs. HFD; bp<0.05, Cre-ve NC vs. HFD; cp<0.05, Cre+ve HFD vs. Cre-ve HFD); total body, fat, and lean weight after 16 weeks in the high-fat diet group (B). (C, D) On histological examination of gonadal white adipose tissue (gWAT), HFD-fed Cre+ve mice display less fibrosis and inflammation than Cre-ve littermates. Representative Picrosirius Red and F4/80 immunohistochemistry images (20× magnification) (C), quantification of staining across groups, each data point represents the mean value for each individual animal (D). (E, F) Despite increased adiposity, HFD-fed Cre+ve mice display greater insulin sensitivity than Cre-ve controls. Terminal blood glucose and insulin levels (animals culled 2 hr after food withdrawal) in NC and HFD-fed in Nr1d1Flox2-6:AdipoqCre Cre-ve (black) and Cre-ve (orange) mice (E). Blood glucose values for individual animals and area under curve (change from baseline) for 16-week HFD-fed Nr1d1Flox2-6:AdipoqCre Cre-ve and Cre-ve mice undergoing insulin tolerance testing (ITT) (F). Data presented as mean ± SEM (A) or as individual data points with mean (B, D, E, F). *p<0.05, **p<0.01, two-way repeated-measures ANOVA with Tukey’s multiple comparisons tests (A), two-way ANOVA with Sidak’s multiple comparisons tests (D, E), unpaired two-tailed t-test (B, F). n=4–11/group for all panels. Picrosirius Red images for each animal available in Figure 4—source data 1.
-
Figure 4—source data 1
Source data (Picrosirius Red images, one per animal) for Figure 4, panel C.
- https://cdn.elifesciences.org/articles/63324/elife-63324-fig4-data1-v2.pdf
Figure 4—figure supplement 1
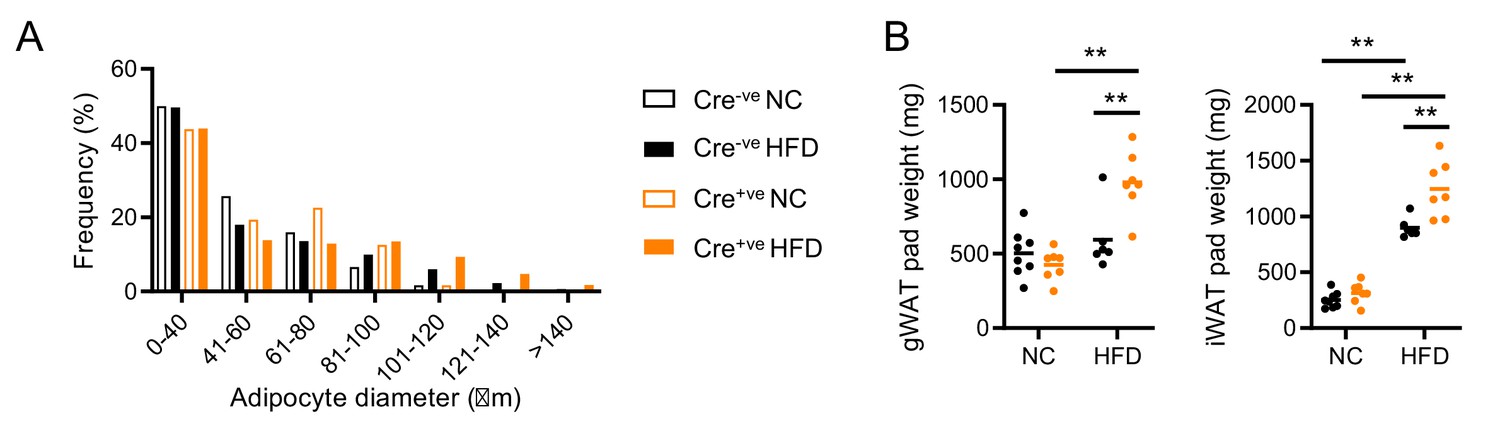
Adipose characteristics in Nr1d1Flox2-6 and Nr1d1Flox2-6:AdipoqCre mice.
(A) Quantification of gonadal white adipose tissue (gWAT) adipocyte size in normal chow (NC)- and high-fat diet (HFD)-fed Nr1d1Flox2-6 (Cre-ve) and Nr1d1Flox2-6:AdipoqCre (Cre+ve) mice demonstrates no between-genotype differences in size distribution. n=4–6/group. (B) Wet pad weights for gWAT and subcutaneous inguinal WAT (iWAT) for NC- and HFD-fed Cre-ve and Cre+ve mice. n=6–8/group. Data presented as mean (A), or as individual data points plus mean (B). Two-way ANOVA with Tukey’s multiple comparisons tests (A, B).
Figure 5
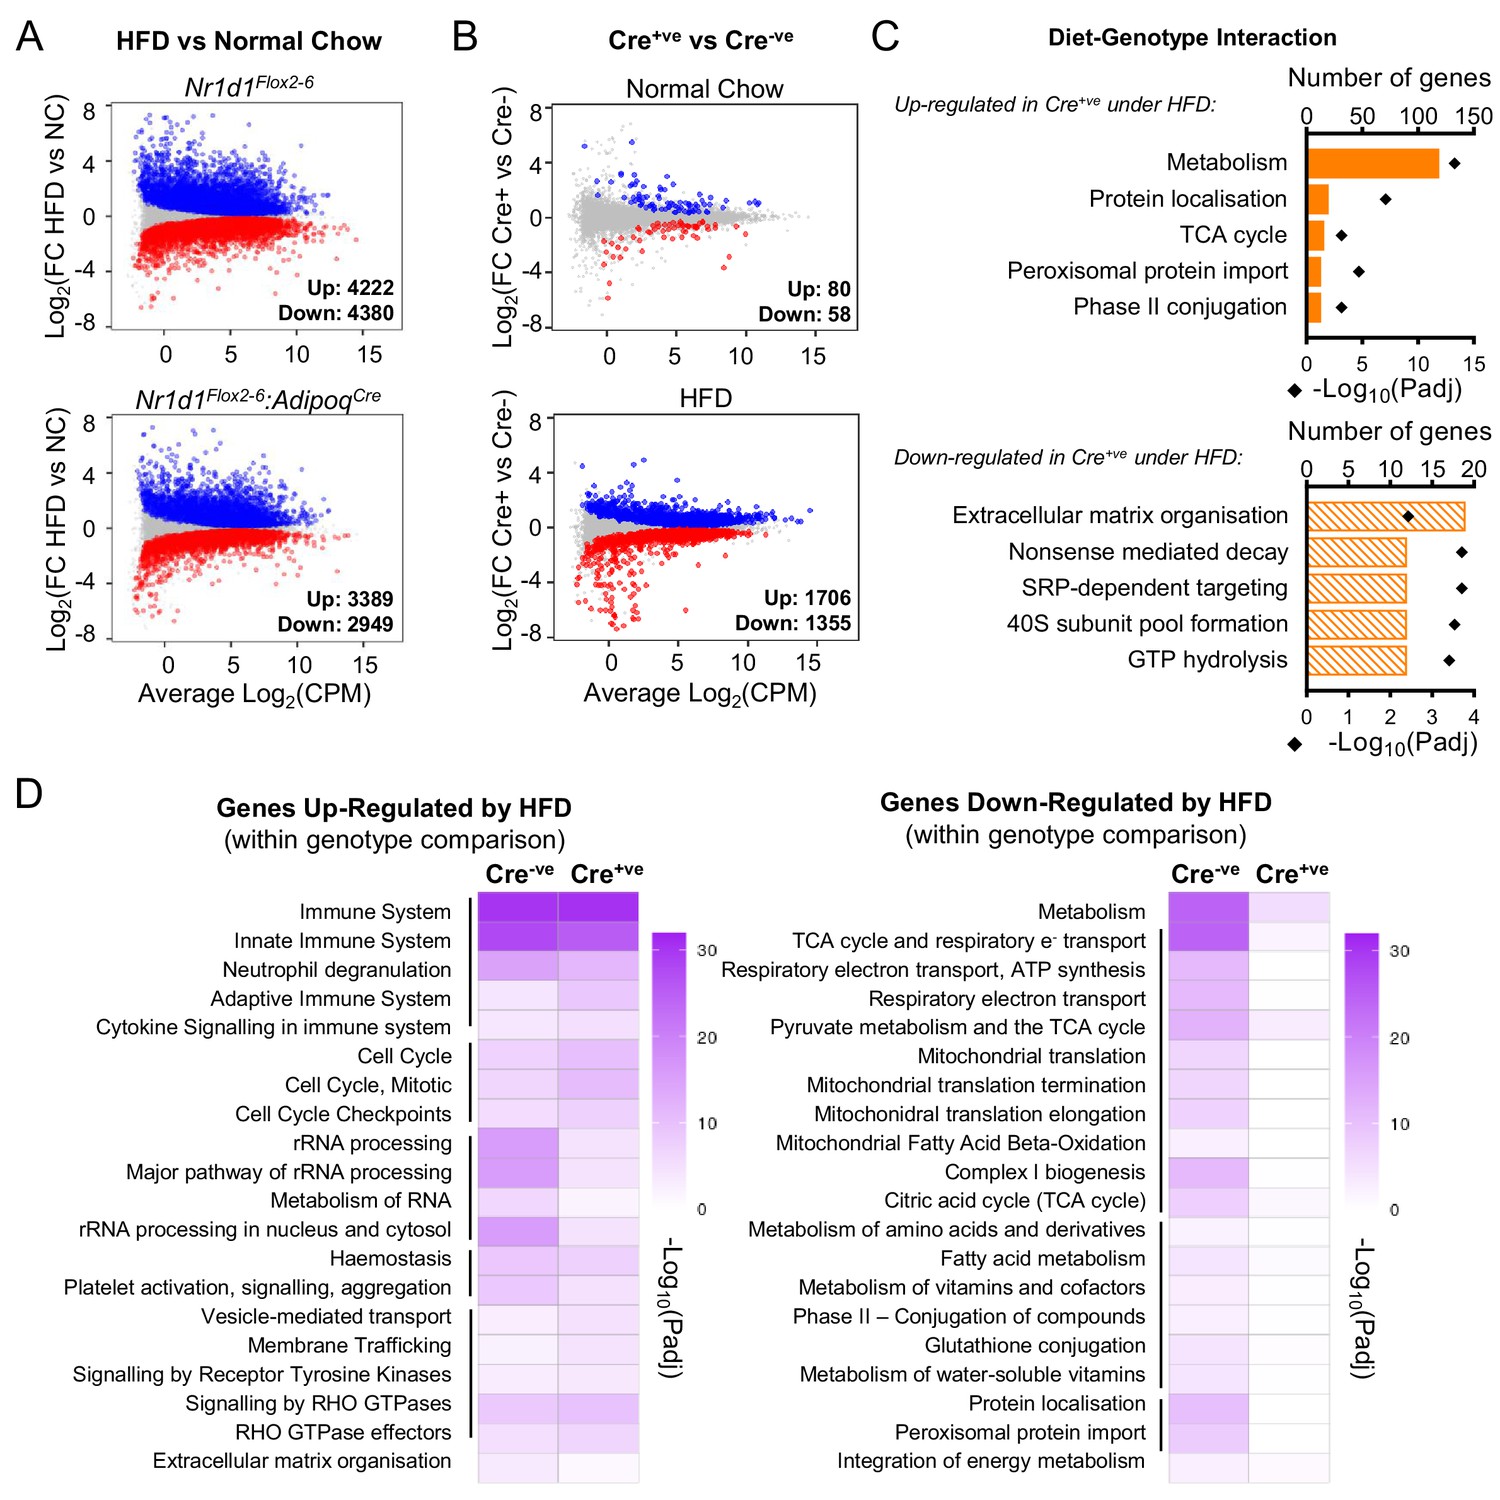
Under conditions of obesity, a broader programme of NR1D1 repression is seen.
(A) High-fat diet (HFD) dramatically remodels the white adipose tissue (WAT) transcriptome. RNA-seq (n=4–6/group) was performed in gonadal WAT (gWAT) from Cre-ve and Cre+ve male mice fed normal chow (NC) or HFD for 16 weeks. Mean difference (MD) plots show genes significantly (FDR<0.05) up-regulated (blue) or down-regulated (red) by HFD in each genotype. (B) With HFD, the NR1D1-responsive gWAT transcriptome broadens. MD plots show effect of genotype in NC (top panel) and HFD (lower panel) feeding conditions. Genes where stageR detects a significant (α=0.05) genotype-diet interaction highlighted in orange. (C) Reactome pathway analysis of genes up- or down-regulated in Cre+ve gWAT under HFD conditions, where this diet-genotype interaction is also detected. Top five (by gene count) significantly enriched terms shown. (D) Adipose-targeted deletion of Nr1d1 attenuates the normal HFD-induced down-regulation of metabolic pathways. Heatmaps show enrichment (-log10(padj)) of Reactome pathways in genes up-regulated (left) or down-regulated (right) by HFD feeding in Cre-ve and Cre+ve gWAT. Top 20 (by gene count in Cre-ve group) significantly enriched terms shown. Lines indicate related terms. Source data for panels A–D available in Figure 5—source data 1.
-
Figure 5—source data 1
Source data (lists of differentially expressed genes, pathway lists) for Figure 5, panels A–D, plus IPA.
- https://cdn.elifesciences.org/articles/63324/elife-63324-fig5-data1-v2.xlsx
Figure 6 with 1 supplement
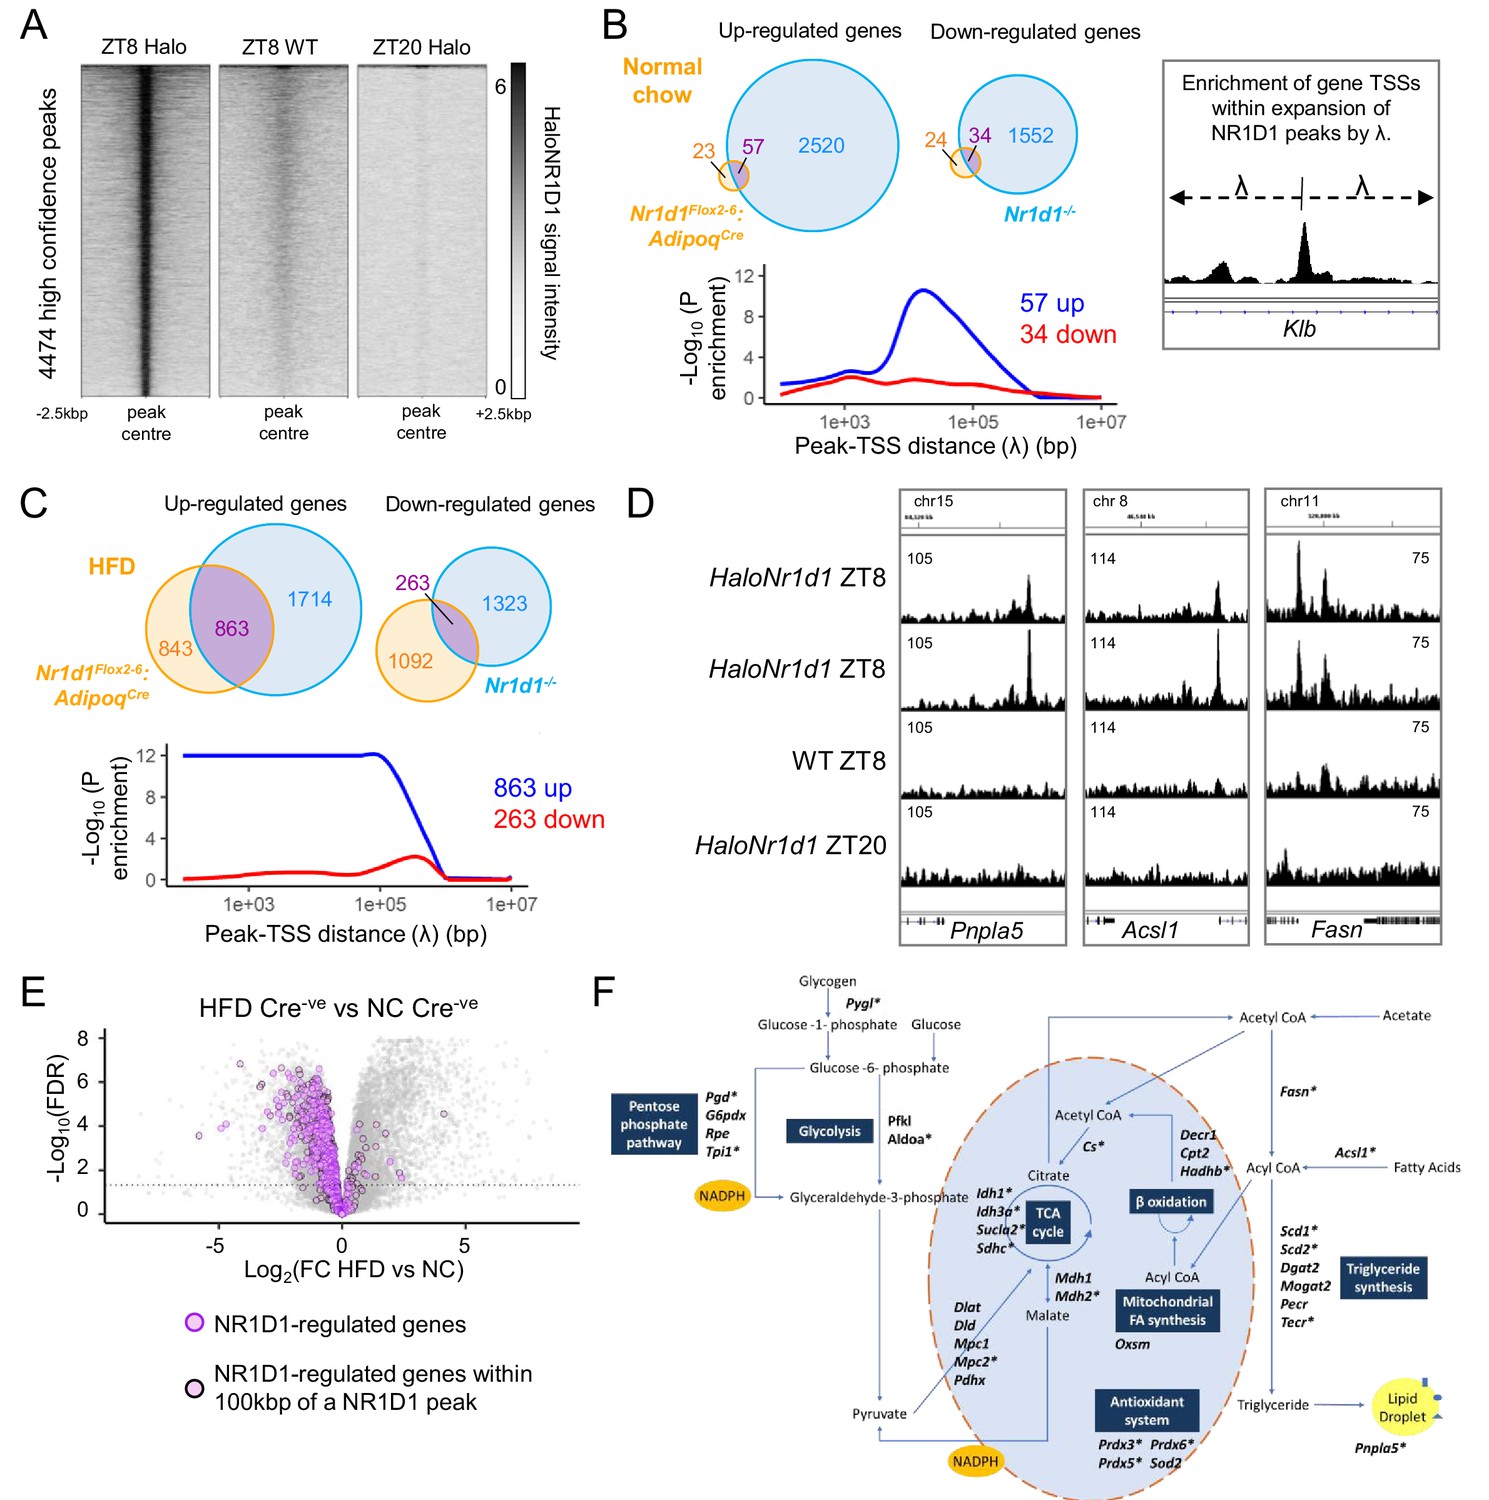
NR1D1 binding sites associate with genes of lipid and mitochondrial metabolism normally repressed in obese adipose.
(A) Calling peaks against both wild-type (WT) ZT8 (zeitgeber time, 8 hr after lights on) and HaloNr1d1 ZT20 samples detects 4474 high-confidence regions of HaloNR1D1 binding in gonadal white adipose tissue (gWAT). (B, C) Genes commonly up-regulated in normal chow (NC)-fed Nr1d1Flox2-6:AdipoqCre and Nr1d1-/- gWAT (compared to littermate controls) are significantly enriched in proximity to HaloNR1D1 ChIP-seq peaks (B), as too are genes commonly up-regulated in high-fat diet (HFD)-fed Nr1d1Flox2-6:AdipoqCre and Nr1d1-/- gWAT (C). Genes commonly down-regulated are not. Venn diagrams show intersection of up- and down-regulated genes in the two models of Nr1d1 deletion. Plots shows enrichment (over all genes in the genome) of gene clusters of interest at increasing distances (λ) from HaloNR1D1 peaks. Up-regulated genes in blue, down-regulated in red. (D) Integrative Genomics Viewer (IGV) visualisations show HaloNR1D1 peaks in proximity to exemplar genes only up-regulated by Nr1d1 deletion in obese adipose. Uniform y-axes within each panel. (E) NR1D1 targets are also down-regulated in obesity. Volcano plot highlighting effect of HFD (in intact (Cre-ve) animals) of the 863 NR1D1 target genes from (C). NR1D1 target genes shown in purple; 495 NR1D1 target genes also within 100 kbp of a HaloNR1D1 peak outlined in black. (F) Metabolic map illustrating NR1D1 targets. Genes with a transcription start site (TSS) within 100 kbp of a HaloNR1D1 ChIP-seq peak are starred*. Source data for panels A–C available in Figure 6—source data 1.
-
Figure 6—source data 1
Source data (peak list, gene lists underlying Venn diagrams) for Figure 6, panels A–C.
- https://cdn.elifesciences.org/articles/63324/elife-63324-fig6-data1-v2.xlsx
Figure 6—figure supplement 1
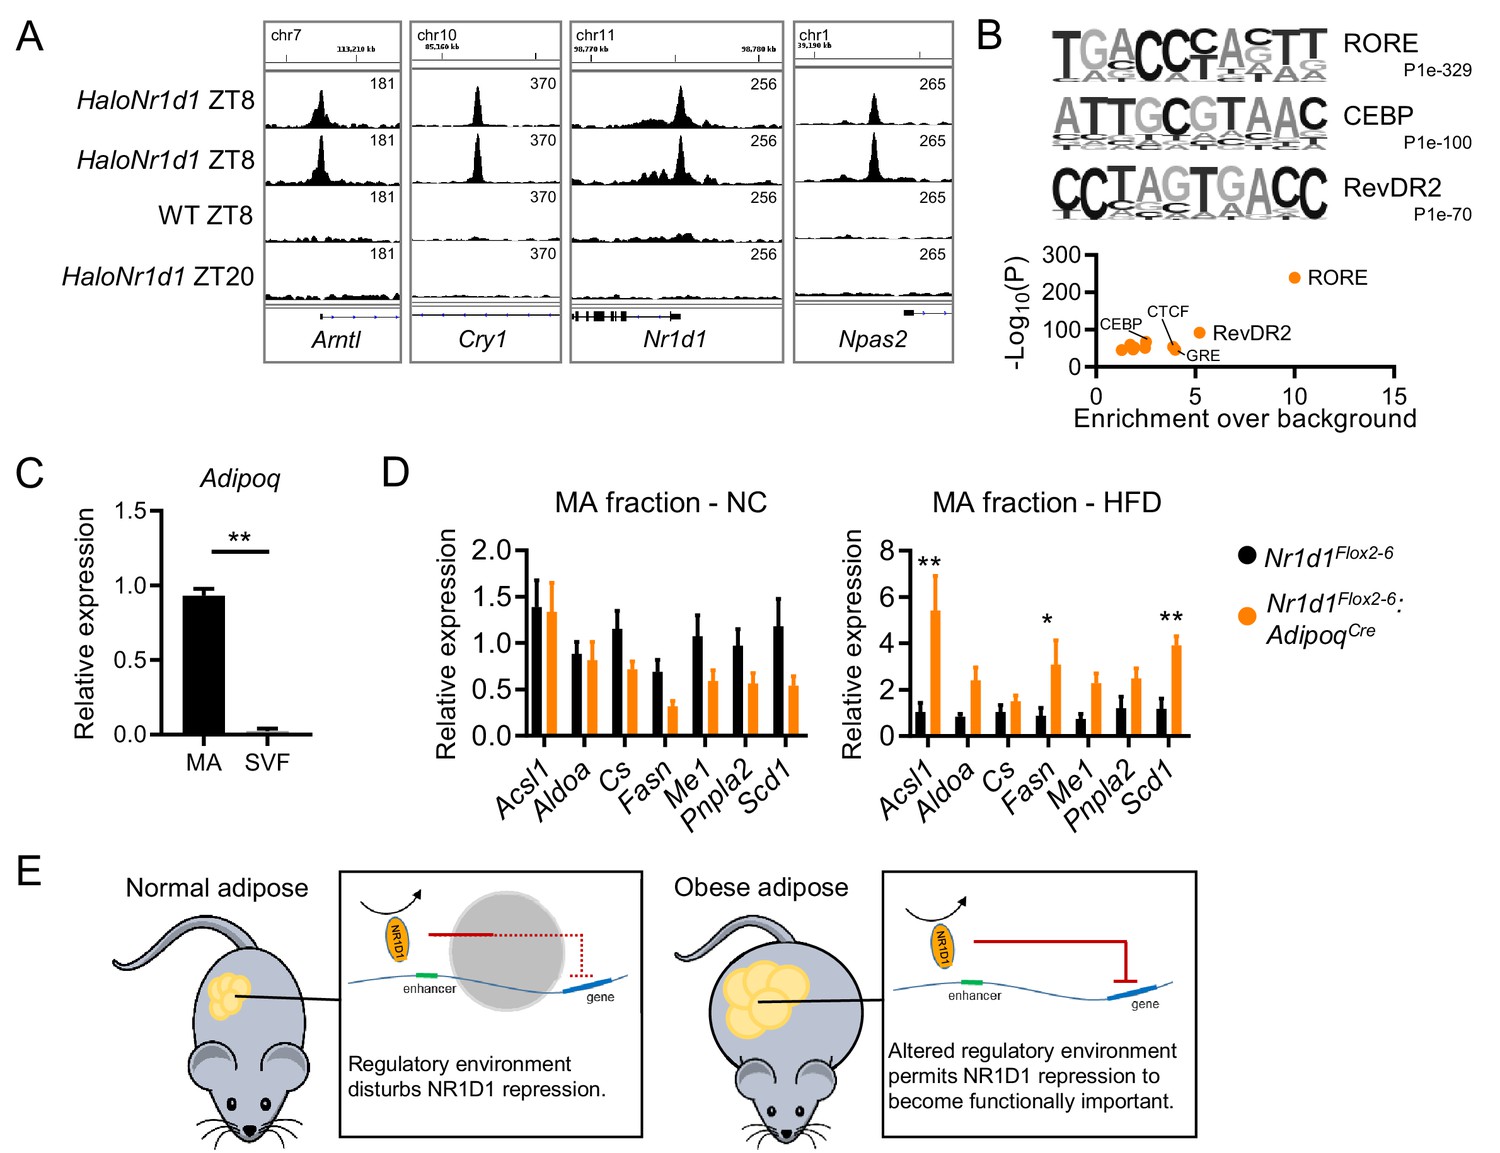
NR1D1 binding sites and gene expression changes in Nr1d1Flox2-6:AdipoqCre mature adipocytes.
(A) Gonadal white adipose tissue (gWAT) ChIP-seq demonstrates HaloNR1D1 binding in proximity to core clock genes in HaloNr1d1 mice at ZT8 (zeitgeber time, 8 hr after lights on), but not in wild-type mice nor in HaloNr1d1 mice at ZT20. Integrative Genomics Viewer (IGV) visualisations show HaloNR1D1 signal in the four libraries sequenced; uniform y-axes within each panel. (B) De novo motif analysis (top) of the 4474 high-confidence HaloNR1D1 peaks finds enrichment of RORE, CEBP, and RevDR2-like motifs (three motifs with lowest p-values); these results are echoed by known motif analysis (bottom). (C) Adiponectin gene expression in mature adipocyte (MA) and stromal vascular fractions (SVF) of collagenase-digested gWAT, as measured by qPCR. (D) De-repression of NR1D1 metabolic target genes (compared to Cre-ve controls) is evident in the mature adipocyte fraction of Nr1d1Flox2-6:AdipoqCre Cre+ve mice under high-fat diet conditions, but not with normal chow feeding. qPCR, n=5–8/group. (E) Proposed model. In normal conditions, there is a large number of genes over which NR1D1 repressive control is not apparent, likely because the regulatory environment (chromatin state, presence of other regulators) blocks this interaction or renders it redundant. In obese adipose, alterations to the regulatory environment (e.g. chromatin remodelling) are permissive to NR1D1 activity. Data shown as mean ± SEM (C D). Unpaired t-test (C), unpaired t-tests corrected for multiple comparisons (FDR) (D). *p<0.05, **p<0.01.
Author response image 1

Western blot (top panel) showing NR1D1 protein expression in NC and HFD gWAT.
Corresponding Ponceau stain (bottom panel).
Author response image 2
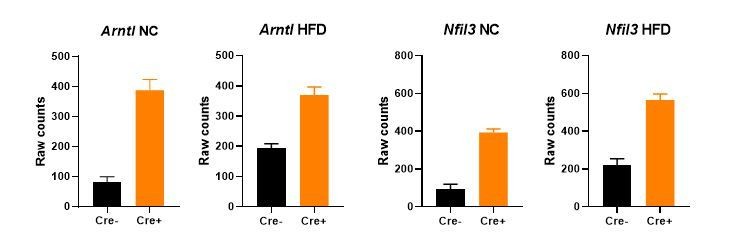
Gene expression (mean +/- SEM of raw counts) of core clock genes Arntl and Nfil3 in bulk gWAT RNA-seq from NC- or HFD-fed Nr1d1Flox2-6:AdipoqCre mice and Nr1d1Flox2-6controls.
A significant difference (FDR<0.05) between genotypes is detected for each comparison. N=4-6/group.
Author response image 3
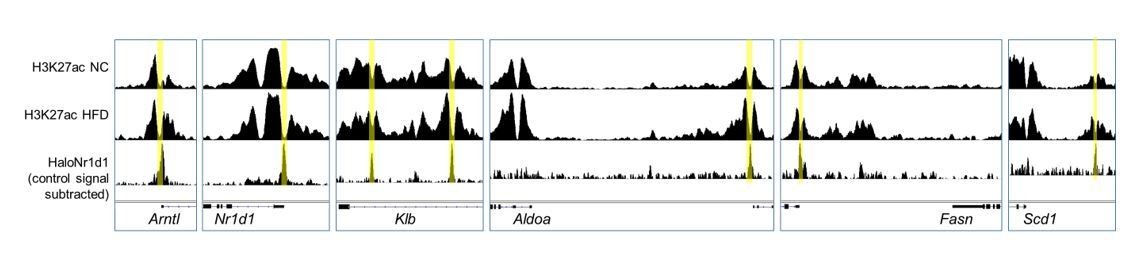
Adipocyte H3K27ac ChIP-seq signal, collected in NC (top row) and HFD (middle row) conditions, aligned with adipose HaloNR1D1 ChIP-seq signal (bottom row).
Author response image 4

Collagen gene expression in gWAT, as measured by qPCR.
2-way ANOVA with Tukey's multiple comparison tests. *P<0.05, **P<0.01.
Author response image 5

No change in metabolic parameters in Nr1d1Flox2-6:AdipoqCre mice.
Representative two day recordings of metabolic gas exchange parameters of oxygen consumption (VO2), carbon dioxide production (VCO2), energy expenditure (kcal/hr) and respiratory exchange ratio (RER) in male mice. Average day and night readings from 5 days of recordings showed no alterations in metabolic parameters in Nr1d1Flox2-6:AdipoqCre mice compared to Nr1d1Flox2-6controls. Data shown as mean +/-SEM, or as individual values and mean. **P<0.01, indicating a difference due to time-of-day on 2-way ANOVA with Sidak’s multiple comparisons.
Tables
Author response table 1
ReactomePA pathway analysis for genes commonly dysregulated by HFD (FDR<0.05, HFD vs NC) in our study, and an adipocyte-only RNA-seq study.
| Top 5 ReactomePA pathways (by gene count) for 749 genes up-regulated by HFD in both our data (Cre-) and Roh et al. adipocyte-only RNA-seq: | |||||
|---|---|---|---|---|---|
| ID | Description | GeneRatio | BgRatio | p.adjust | Count |
| R-MMU-168256 | Immune System | 463/438 | 1691/8733 | 1.90E-16 | 163 |
| R-MMU-168249 | Innate Immune System | 108/438 | 911/8733 | 5.32E-16 | 108 |
| R-MMU-109582 | Hemostasis | 70/438 | 505/8733 | 4.92E-13 | 70 |
| R-MMU-1280218 | Adaptive Immune System | 65/438 | 667/8733 | 5.89E-06 | 65 |
| R-MMU-6798695 | Neutrophil degranulation | 62/438 | 514/8733 | 6.32E-09 | 62 |
| Top 5 ReactomePA pathways (by gene count) for 826 genes down-regulated by HFD in both our data (Cre-) and Roh et al., adipocyte-only RNA-seq: | |||||
| ID | Description | GeneRatio | BgRatio | p.adjust | Count |
| R-MMU-1430728 | Metabolism | 177/421 | 1727/8733 | 4.85E-24 | 177 |
| R-MMU-556833 | Metabolism of lipids | 52/421 | 594/8733 | 0.000992 | 52 |
| R-MMU-1428517 | The citric acid (TCA) cycle and respiratory electron transport | 37/421 | 143/8733 | 3.61E-15 | 37 |
| R-MMU-71291 | Metabolism of amino acids and derivatives | 33/421 | 247/8733 | 9.30E-06 | 33 |
| R-MMU-8978868 | Fatty acid metabolism | 25/421 | 172/8733 | 5.83E-05 | 25 |
Additional files
Download links
A two-part list of links to download the article, or parts of the article, in various formats.
Downloads (link to download the article as PDF)
Open citations (links to open the citations from this article in various online reference manager services)
Cite this article (links to download the citations from this article in formats compatible with various reference manager tools)
Adipocyte NR1D1 dictates adipose tissue expansion during obesity
eLife 10:e63324.
https://doi.org/10.7554/eLife.63324


