Estrogen receptor alpha in the brain mediates tamoxifen-induced changes in physiology in mice
- Department of Integrative Biology and Physiology, University of California Los Angeles, United States
- Laboratory of Neuroendocrinology of the Brain Research Institute, University of California Los Angeles, United States
Figures
Figure 1 with 1 supplement
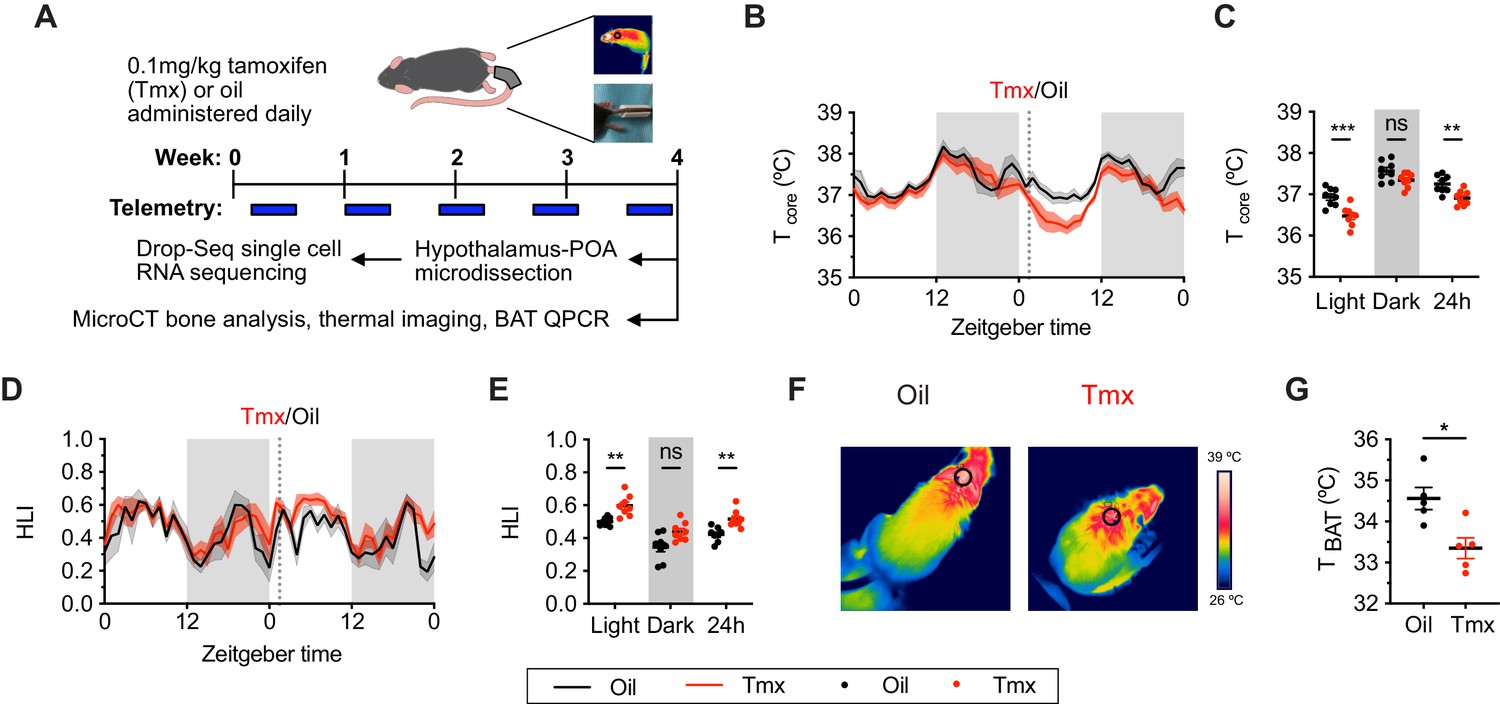
Tamoxifen treatment decreases core body temperature and increases heat dissipation.
(A) Strategy to measure the physiological and gene expression effects of long-term tamoxifen (Tmx) treatment. Mice were treated by daily subcutaneous injection of 0.1 mg/kg tamoxifen or corn oil for 4 weeks. Core and tail temperature were measured every 5 min using telemetry probes. Snapshot of thermographic images for brown adipose tissue (BAT) temperature was obtained in last week of treatment. At the conclusion of 4-week treatment, experimental mice were sacrificed for bone analysis or single-cell RNA sequencing. (B) Hourly average of core body temperature over 3 days before and 3 weeks after injections (dotted line). (C) Average core body temperature from mice shown in panel (B) highlighting per animal averages in light (7:00 to 19:00), dark (19:00 to 7:00), and total 24 hr periods (n = 8, treatment: F1,14=11.92, p=0.0039). (D) Heat loss index (HLI) calculated from continuous measurements of core and tail temperature. (E) Average HLI from mice shown in panel (D) (n = 7, treatment: F1,14=15.52, p=0.0015). (F) Thermographic images of interscapular skin above BAT depots in mice injected with either oil or tamoxifen. (G) Quantification of temperature of skin above interscapular BAT depots (n = 5, t8 = 3.255, p=0.0116). In (B and D), line shading width represents standard error of the mean (SEM). ns, not significant, *, p<0.05; **, p<0.01; ***, p<0.001 for Sidak’s multiple comparison tests (C and E) following a significant effect of treatment in a two-way repeated measures ANOVA or two-tailed t-tests (G).
-
Figure 1—source data 1
Source data for Figure 1, panel b.
Hourly average of core body temperature over 3 days before and 3 weeks after injections. Each column is an independent mouse.
- https://cdn.elifesciences.org/articles/63333/elife-63333-fig1-data1-v1.xlsx
-
Figure 1—source data 2
Source data for Figure 1, panel c.
Average core body temperature in light, dark, and total 24 hr periods. Each column is an independent mouse.
- https://cdn.elifesciences.org/articles/63333/elife-63333-fig1-data2-v1.xlsx
-
Figure 1—source data 3
Source data for Figure 1, panel d.
Hourly heat loss index (HLI) calculated from continuous measurements of core and tail temperature. Each column is an independent mouse.
- https://cdn.elifesciences.org/articles/63333/elife-63333-fig1-data3-v1.xlsx
-
Figure 1—source data 4
Source data for Figure 1, panel e.
Average HLI over the light, dark, and 24 hr periods. Each column is an independent mouse.
- https://cdn.elifesciences.org/articles/63333/elife-63333-fig1-data4-v1.xlsx
-
Figure 1—source data 5
Source data for Figure 1, panel g.
Quantification of temperature of skin above interscapular brown adipose tissue (BAT) depots. Each row is an independent mouse.
- https://cdn.elifesciences.org/articles/63333/elife-63333-fig1-data5-v1.xlsx
Figure 1—figure supplement 1
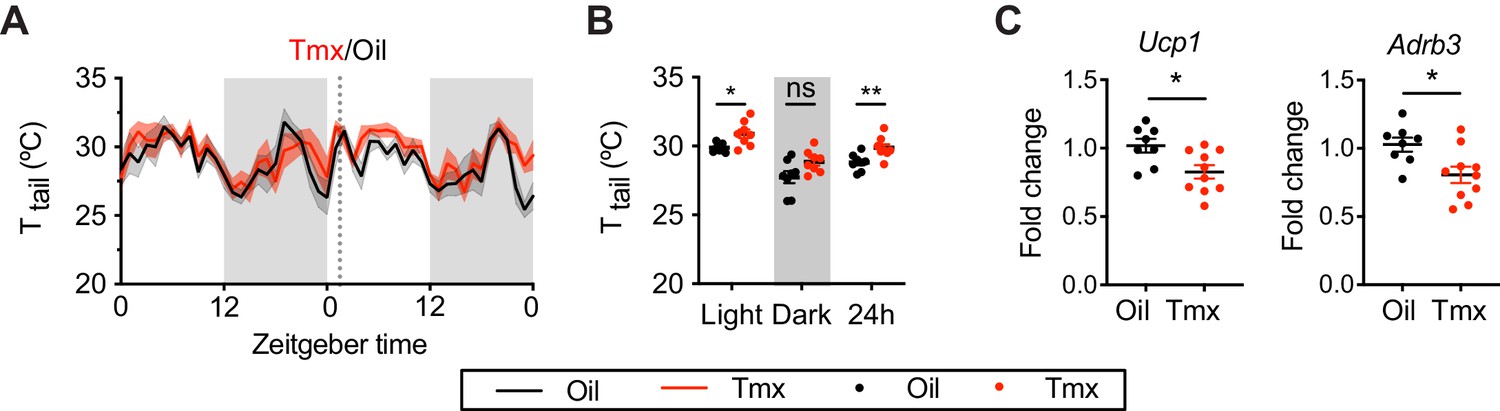
Tamoxifen increases temperature in tail and suppresses thermogenic gene expression in brown adipose tissue (BAT).
(A) Hourly average of tail skin temperature (Ttail) over 3 days before and 3 weeks after injections (dotted line) measured every 5 min using attached thermal logger. (B) Average Ttail from mice shown in panel (A) highlighting per animal averages in light, dark, and total 24 hr periods (n = 8, treatment: F1,14=12.87, p=0.003). (C) Relative mRNA expression from BAT (n = 8–10) of Ucp1 (t16 = 2.738, p=0.0146) and Adrb3 (t16 = 2.732, p=0.0148) following oil or tamoxifen (Tmx) treatment. ns, not significant; *, p<0.05; **, p<0.01 for Sidak’s multiple comparison tests (B) following a significant effect of treatment in a two-way repeated measures ANOVA or two-tailed t-tests (C).
-
Figure 1—figure supplement 1—source data 1
Source data for Figure 1—figure supplement 1, panel a.
Hourly average of tail skin temperature (Ttail) over 3 days before and 3 weeks after injections measured every 5 min using attached thermal logger. Each column is an independent mouse.
- https://cdn.elifesciences.org/articles/63333/elife-63333-fig1-figsupp1-data1-v1.xlsx
-
Figure 1—figure supplement 1—source data 2
Source data for Figure 1—figure supplement 1, panel b.
Average Ttail in light, dark, and total 24 hr periods. Each column is an independent mouse.
- https://cdn.elifesciences.org/articles/63333/elife-63333-fig1-figsupp1-data2-v1.xlsx
-
Figure 1—figure supplement 1—source data 3
Source data for Figure 1—figure supplement 1, panel c.
Relative mRNA expression from brown adipose tissue (BAT) of Ucp1 and Adrb3 following oil or tamoxifen (Tmx) treatment. Each row is an independent mouse.
- https://cdn.elifesciences.org/articles/63333/elife-63333-fig1-figsupp1-data3-v1.xlsx
Figure 2
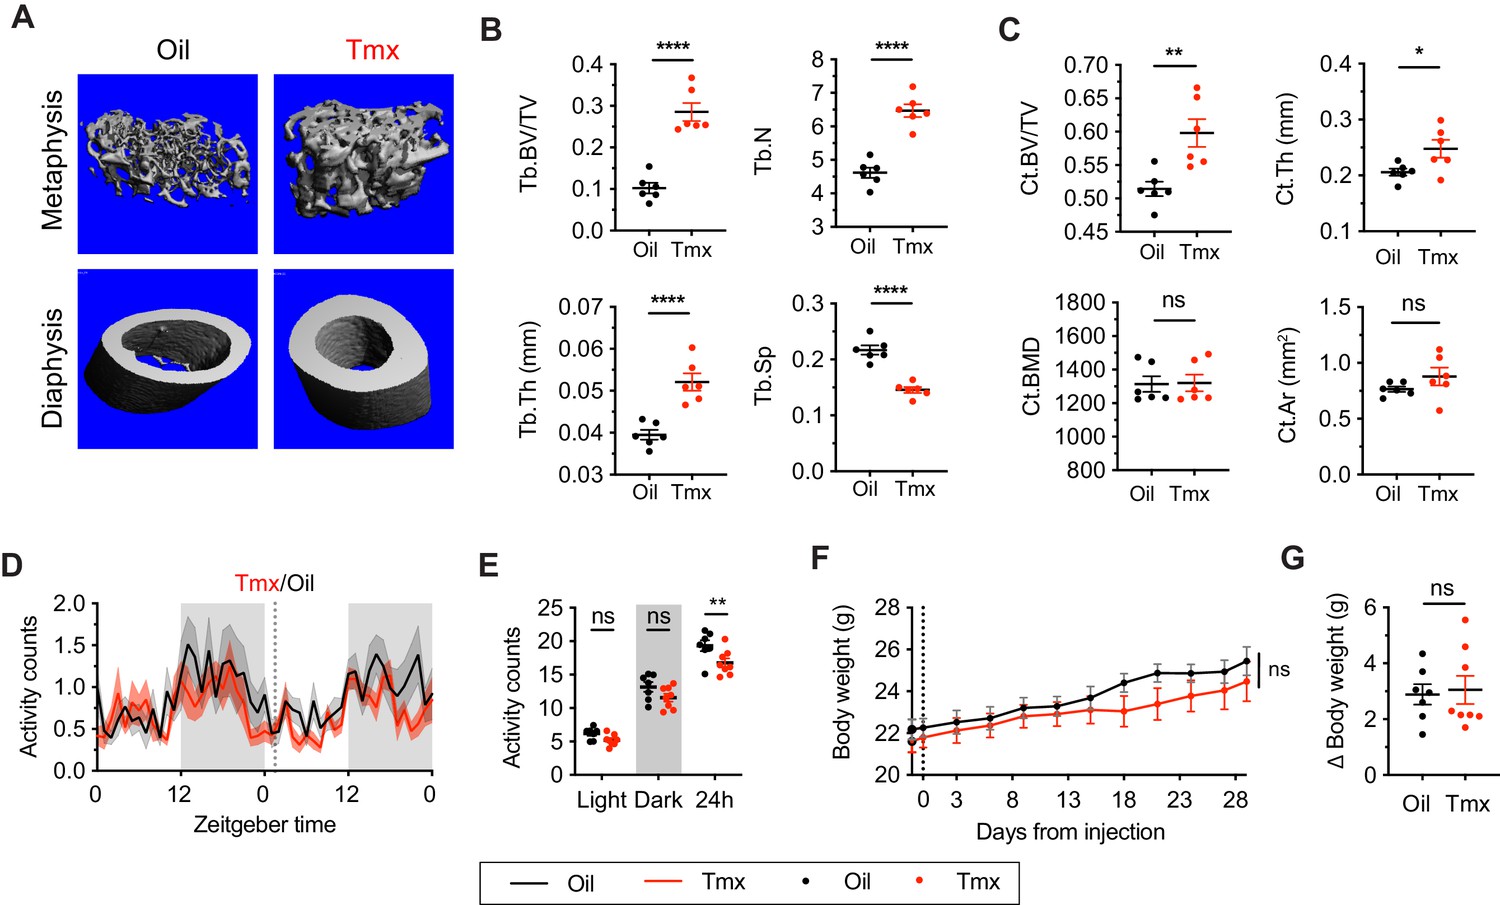
Tamoxifen treatment increases bone density and decreases movement.
(A) Representative micro-computed tomography (microCT) images showing bone density of the distal metaphysis and midshaft diaphysis of femurs from tamoxifen or oil treated female mice. Tamoxifen or vehicle was injected subcutaneously at 0.1 mg/kg for 28 days. (B) Trabecular bone volume fraction (BV/TV, t10 = 7.322, p<0.0001), trabecular numbers (Tb.N, t10 = 7.539, p<0.0001), trabecular thickness (Tb.Th, t10 = 5.303, p=0.0003), and trabecular separation (Tb.Sp, t10 = 7.331, p<0.0001) in distal metaphysis of femurs (n = 6). (C) Bone volume fraction (Ct.BV/TV, t10 = 3.557, p=0.0052), cortical thickness (Ct.Th, t10 = 2.451, p=0.0342), bone mineral density (Ct.BMD, t10 = 0.0926, p=0.928), and cortical area (Ct.Ar, t10 = 1.368, p=0.2013) in diaphysis of femurs (n = 6). (D) Hourly average of movement over 3 days before and 3 weeks after tamoxifen or oil injections (dotted line) measured every 5 min using an intraperitoneal telemetry probe. Line shading width represents standard error of the mean (SEM). (E) Average total movement from mice shown in panel (D) (n = 8, treatment: F1,14=6.182, p=0.0262). (F) Change of body weight over 28 days during tamoxifen or oil injection (n = 7–8, mixed-effects model, treatment: p=0.5468). Error bars represent SEM. (G) Total change in body weight over the course of the 28-day experiment (n = 8, t13 = 0.2572, p=0.8010). ns, non-significant; *, p<0.05; **, p<0.01; ***, p<0.001; ****, p<0.0001 for Sidak’s multiple comparison tests (E) following a significant effect of treatment in a two-way repeated measures ANOVA or two-tailed t-tests (B, C, and G).
-
Figure 2—source data 1
Source data for Figure 2, panel b.
Trabecular bone volume fraction, trabecular numbers, trabecular thickness, and trabecular separation in distal metaphysis of femurs. Each cell is an independent mouse.
- https://cdn.elifesciences.org/articles/63333/elife-63333-fig2-data1-v1.xlsx
-
Figure 2—source data 2
Source data for Figure 2, panel c.
Bone volume fraction (Ct.BV/TV), cortical thickness (Ct.Th), bone mineral density (Ct.BMD), and cortical area (Ct.Ar) in diaphysis of femurs. Each cell is an independent mouse.
- https://cdn.elifesciences.org/articles/63333/elife-63333-fig2-data2-v1.xlsx
-
Figure 2—source data 3
Source data for Figure 2, panel d.
Hourly average of movement over 3 days before and 3 weeks after tamoxifen or oil injections, measured every 5 min using an intraperitoneal telemetry probe. Each column is an independent mouse.
- https://cdn.elifesciences.org/articles/63333/elife-63333-fig2-data3-v1.xlsx
-
Figure 2—source data 4
Source data for Figure 2, panel e.
Average total movement in the light, dark, and total 24 hr periods. Each column is an independent mouse.
- https://cdn.elifesciences.org/articles/63333/elife-63333-fig2-data4-v1.xlsx
-
Figure 2—source data 5
Source data for Figure 2, panel f.
Body weight over 28 days during tamoxifen or oil injection. Each column is an independent mouse.
- https://cdn.elifesciences.org/articles/63333/elife-63333-fig2-data5-v1.xlsx
-
Figure 2—source data 6
Source data for Figure 2, panel g.
Total change in body weight over the course of the 28-day experiment. Each column is an independent mouse.
- https://cdn.elifesciences.org/articles/63333/elife-63333-fig2-data6-v1.xlsx
Figure 3 with 1 supplement
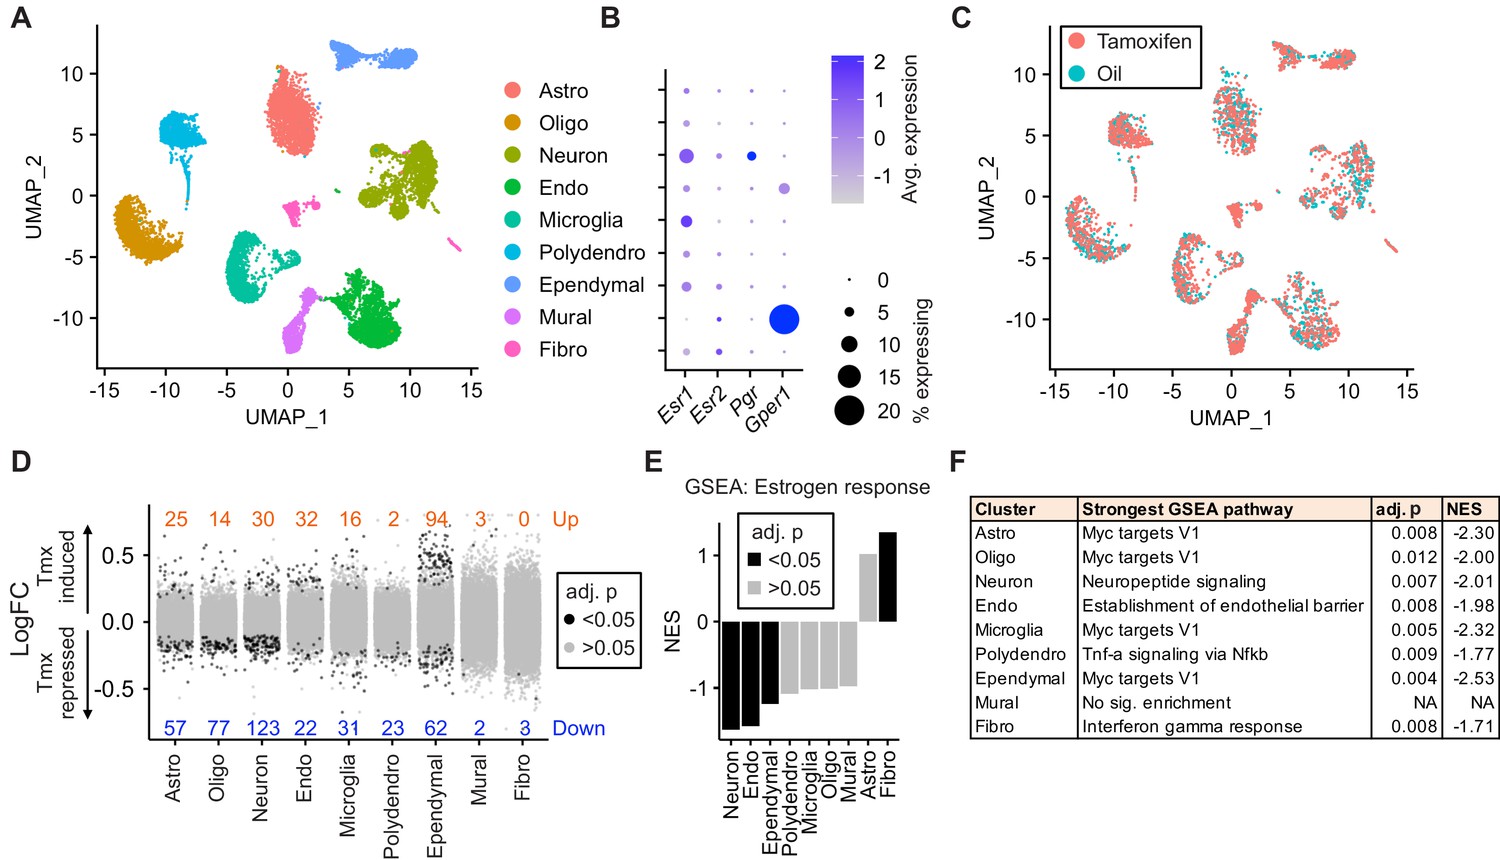
Tamoxifen treatment induces gene expression changes in various cell types of the hypothalamus and preoptic area (hypothalamus-POA).
(A) UMAP showing clustering of the major cell types of the hypothalamus-POA based on single-cell transcriptomics. Each colored dot is a cell, with different colors representing different cell types listed to the right. (B) Dot plot showing expression of estrogen and progesterone receptors in cell types identified in (A). (C) UMAP comparing cells derived from mice receiving tamoxifen (pink) or oil injections (cyan). (D) Collapsed volcano plots showing differential gene expression, represented as log base 2 of fold change (LogFC), induced by daily tamoxifen treatment in various cell types identified. Up/down numbers refer to total number of significantly (Bonferroni adj. p<0.05) up- and downregulated genes. (E) Gene set enrichment analysis (GSEA) to find tamoxifen-induced signatures of estrogen response in hypothalamus-POA cell types. (F) Most strongly enriched or depleted pathways in GSEA comparing control to tamoxifen-treated cells. All analyses were done from cells harvested from female mice injected daily with oil (n = 3) or tamoxifen (n = 5) over 28 days. (E–F) NES: Normalized enrichment score, adj. p: Benjamini-Hochberg adjusted p-value.
Figure 3—figure supplement 1
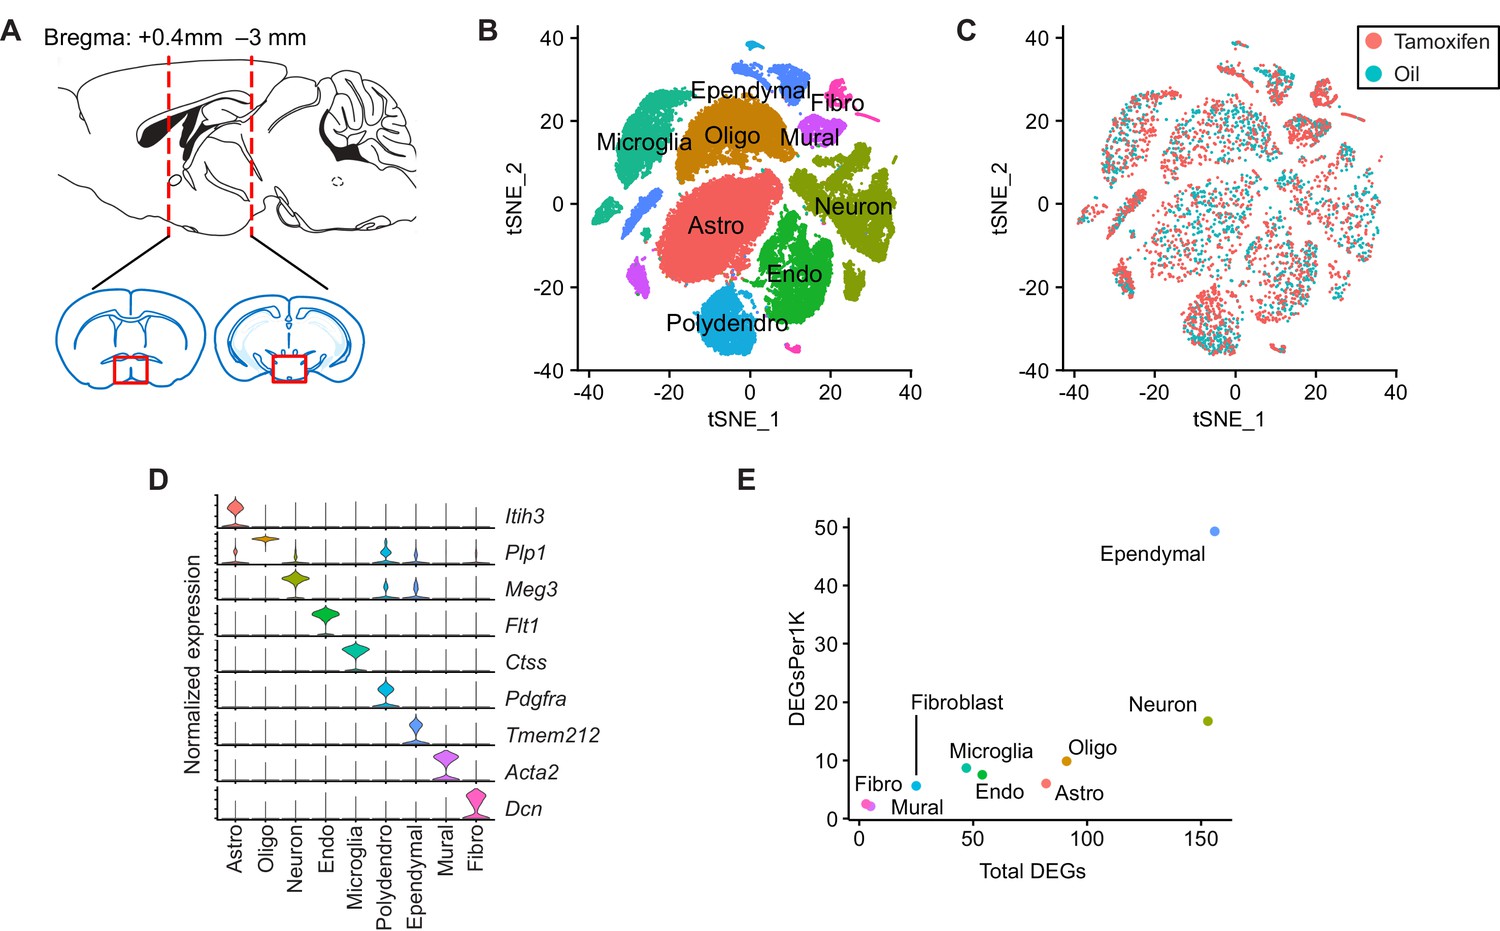
Tamoxifen treatment induces gene expression changes in various cell types of the hypothalamus and preoptic area (hypothalamus-POA).
(A) Schematic of the hypothalamus-POA dissected for scRNA-seq (Bregma +0.4 to –3 mm). (B) tSNE showing clustering of the major cell types of the hypothalamus-POA based on single-cell transcriptomics. (C) tSNE of hypothalamus-POA cells, comparing cells derived from female mice receiving tamoxifen (pink) or oil injections (cyan). (D) Violin plots showing normalized expression of cluster defining markers in all clusters. (E) Plot comparing the total number of significant (Bonferroni adj. p<0.05) tamoxifen regulated genes to the number of significant tamoxifen regulated genes per thousand cells in each cluster. All analyses done from cells harvested from female mice injected daily with oil (n = 3) or tamoxifen (n = 5) over 28 days.
Figure 4 with 1 supplement
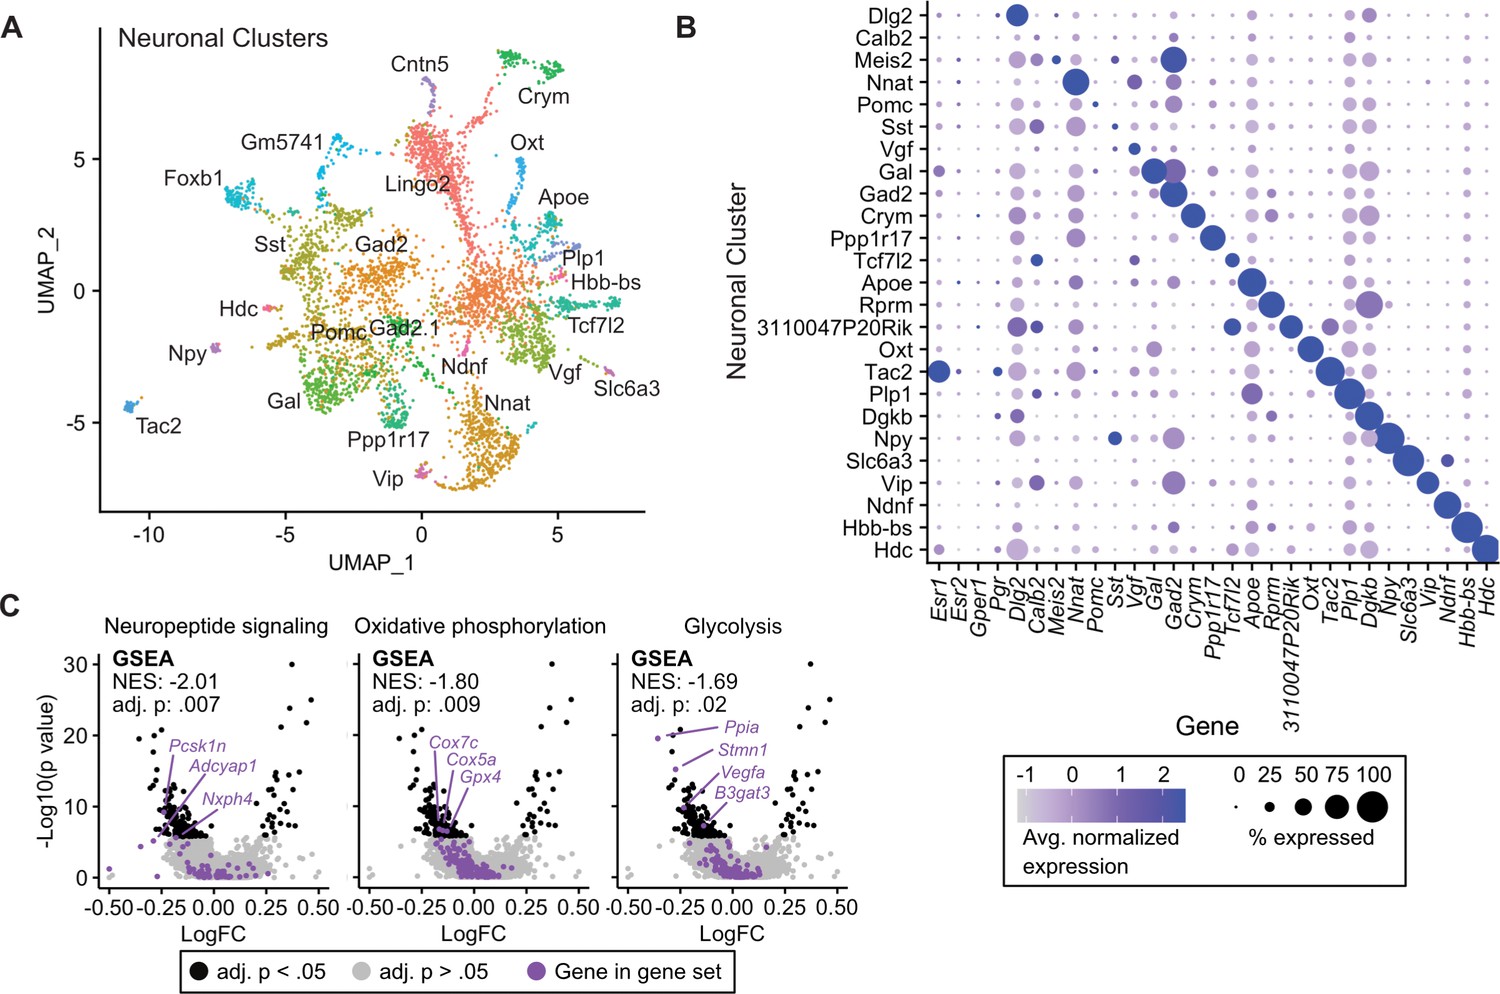
Tamoxifen-induced gene expression changes in neurons of the hypothalamus and preoptic area (hypothalamus-POA).
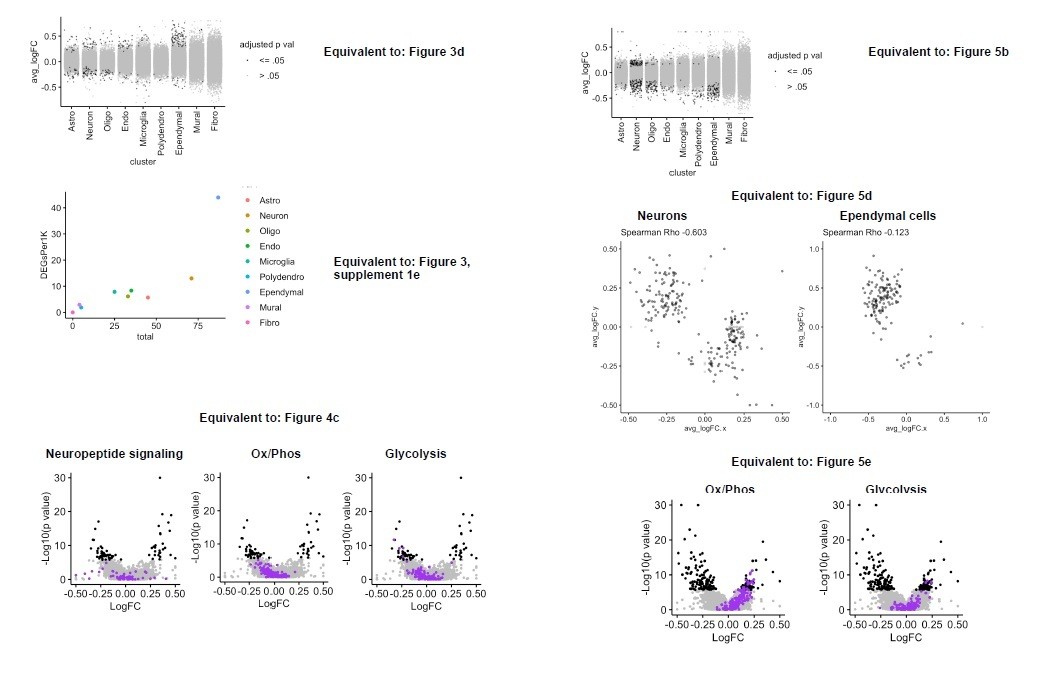
(A) UMAP showing clustering of the neuronal subtypes of the hypothalamus-POA based on single-cell transcriptomics, overlayed with identity named for top expressed cluster defining marker gene. (B) Dot plot showing expression of neuronal cluster defining markers, Esr1, Esr2, Gper1, and Pgr. (C) Volcano plots of tamoxifen-induced or repressed differentially expressed genes (DEGs) overlayed with gene sets (GS) involved in neuropeptide signaling, oxidative phosphorylation, or glycolysis. Analyses done from wild-type female mice injected daily with oil (n = 3) or tamoxifen (n = 5) over 28 days. NES: Normalized enrichment score, GSEA adj. p: Benjamini-Hochberg adjusted p-value, DEG adj. p: Bonferroni adjusted p-value.
Figure 4—figure supplement 1
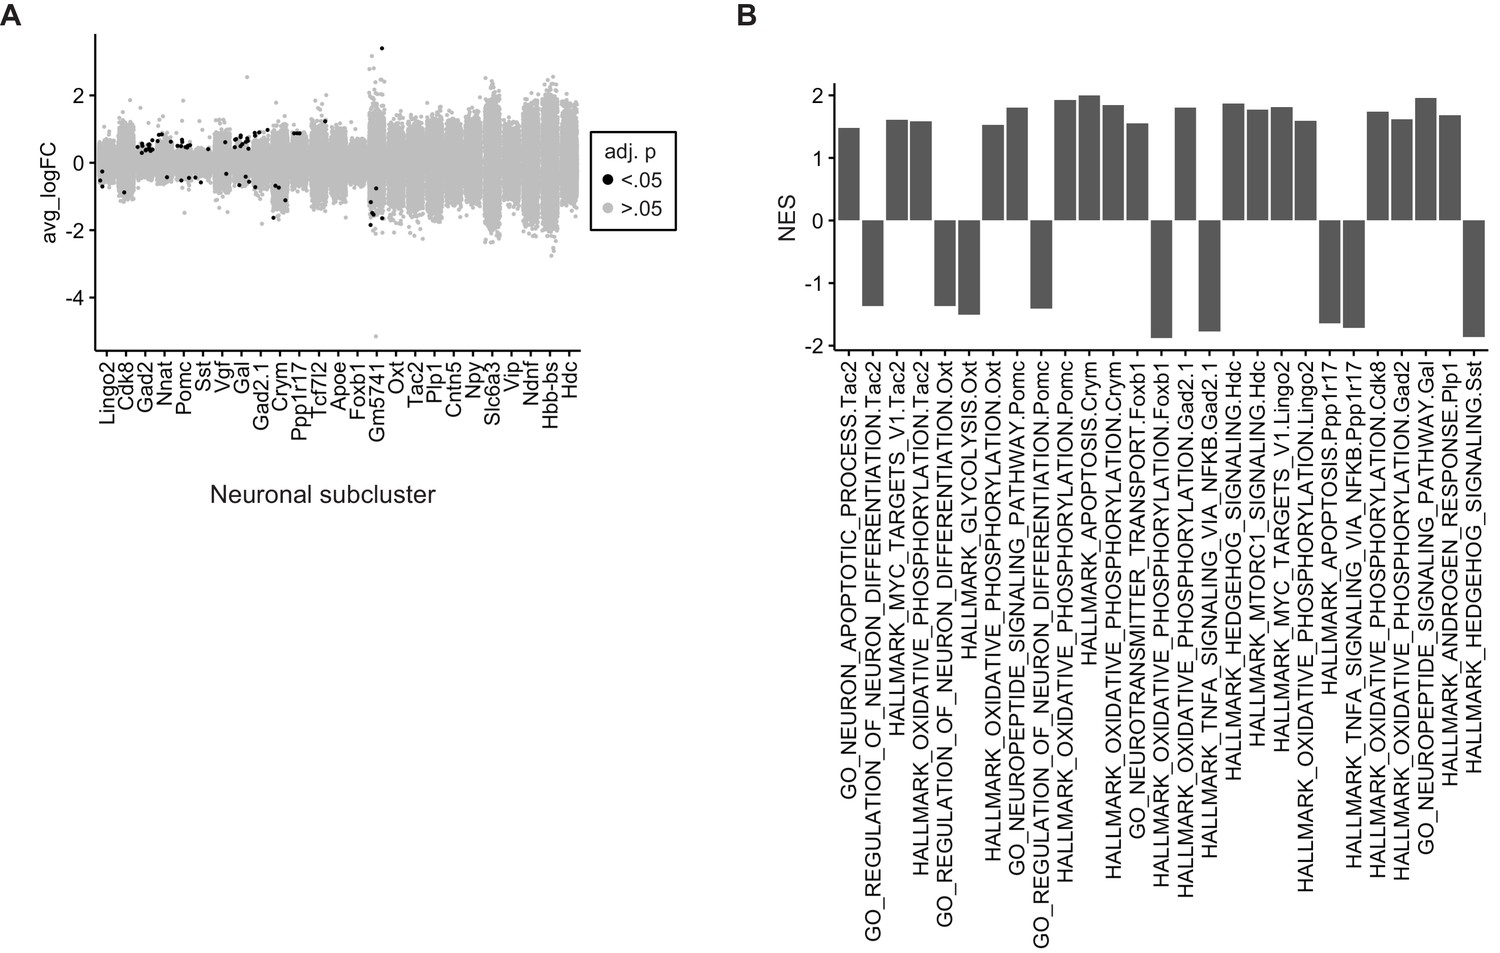
Tamoxifen-induced gene expression changes in hypothalamus and preoptic area (hypothalamus-POA) neurons.
(A) Collapsed volcano plot of differences in gene expression associated with tamoxifen treatment in the various neuronal subtypes of wild-type female mice. adj. p: Bonferroni adjusted p-value. (B) Gene set enrichment analysis (GSEA) pathways significantly (Benjamini-Hochberg adjusted p<0.05) upregulated or downregulated by tamoxifen in individul neuronal subclusters. NES: Normalized enrichment score.
Figure 5 with 2 supplements
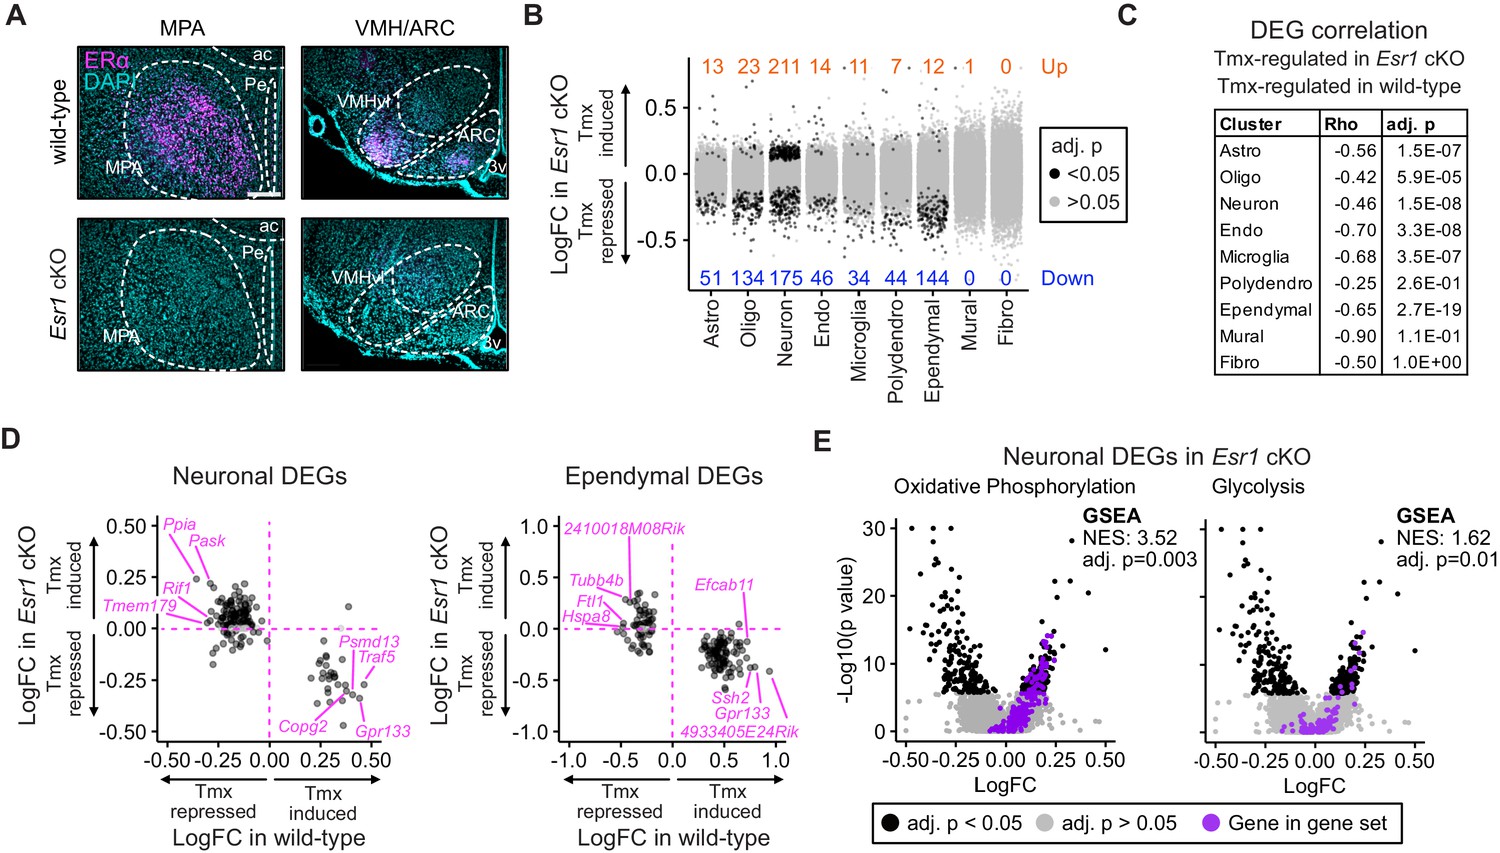
Esr1 conditional knockout reverses hypothalamus and preoptic area (hypothalamus-POA) responses to tamoxifen.
(A) Immunoreactive staining of estrogen receptor alpha (ERα) in the medial preoptic area (MPA), ventromedial nucleus of the hypothalamus (VMH), and the arcuate nucleus of the hypothalamus (ARC) of ERα knockout and wild-type female mice. Scale bar: 200 um. (B) Differentially expressed genes (DEGs) induced by daily tamoxifen treatment in cell types of the Esr1f/f;Nkx2-1Cre (Esr1 cKO) hypothalamus-POA. Up/down numbers refer to total number of significantly (Bonferroni adj. p<0.05) up- and downregulated genes. (C) Table of correlations showing how tamoxifen-induced gene expression changes in wild-type cells correlate with tamoxifen-induced gene expression changes in Esr1 cKO cells. Rho: Spearman correlation coefficient, adj. p: Benjamini-Hochberg adjusted p-value. (D) Gene-by-gene comparison of how tamoxifen treatment affects expression in wild-type and Esr1 cKO neurons and ependymal cells. Named genes are a subset of genes discordantly regulated by tamoxifen in wild-type and Esr1 cKO cells. A complete list of genes shown here is in Supplementary file 1i. (E) Volcano plots of all tamoxifen-induced or repressed DEGs (black) overlayed with gene sets (purple) involved in oxidative phosphorylation or glycolysis. NES: Normalized enrichment score, gene set enrichment analysis (GSEA) adj. p: Benjamini-Hochberg adjusted p-value, DEG adj. p: Bonferroni adjusted p-value. (B–E) Data from n = 4 oil treated Esr1 cKO and n = 4 tamoxifen-treated Esr1 cKO, n = 3 oil treated wild-type and n = 5 tamoxifen-treated wild-type mice.
Figure 5—figure supplement 1
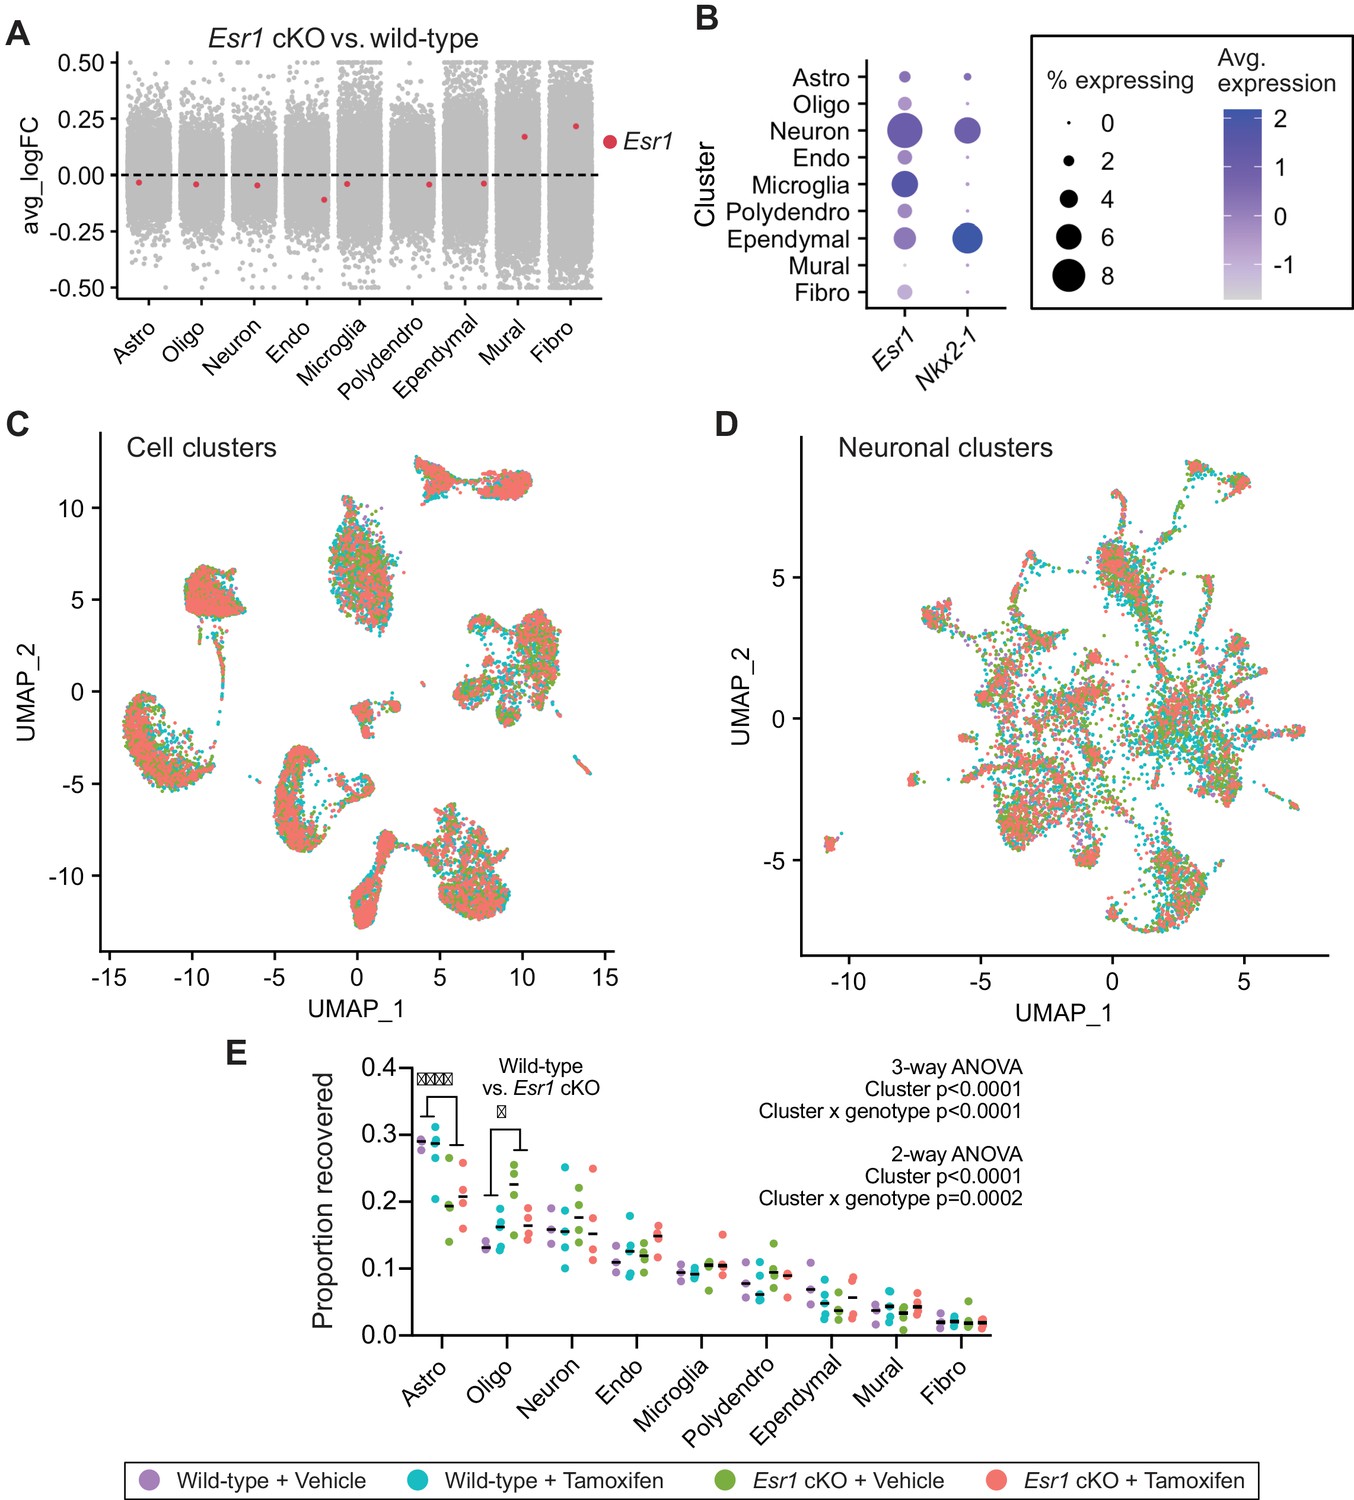
Cell cluster analyses across all four treatment groups.
(A) Collapsed volcano plot showing the average fold change (avg_logFC) in Esr1 transcript expression in Esr1 cKO vs. wild-type mice. (B) Dotplot showing expression of Esr1 and Nkx2-1 in cell types of the hypothalamus and preoptic area (hypothalamus-POA). (C) UMAP of all hypothalamus-POA derived cell types showing individual cells (dots) from the four treatment groups. (D) UMAP of hypothalamus-POA derived neuronal types showing individual neurons (dots) from the four treatment groups. (E) Proportion of each cell type recovered across the four treatment groups. Three-way ANOVA (main effects: cluster x genotype x treatment) shows an effect of cluster (F8,108=91.33, p<0.0001) and the cluster x genotype interaction (F8,108=4.775, p<0.0001). Two-way ANOVA (cluster x genotype collapsed across treatments) shows an effect of cluster (F8,112=86.87, p<0.0001) and the cluster x genotype interaction (F8,112=4.218, p=0.0002). Sidak’s multiple comparisons tests reveal effects of genotype on the proportion of astrocytes (t126 = 5.138) and oligodendrocytes (t126 = 2.896). All other main effects, interactions, and multiple comparisons p>0.05.
Figure 5—figure supplement 2
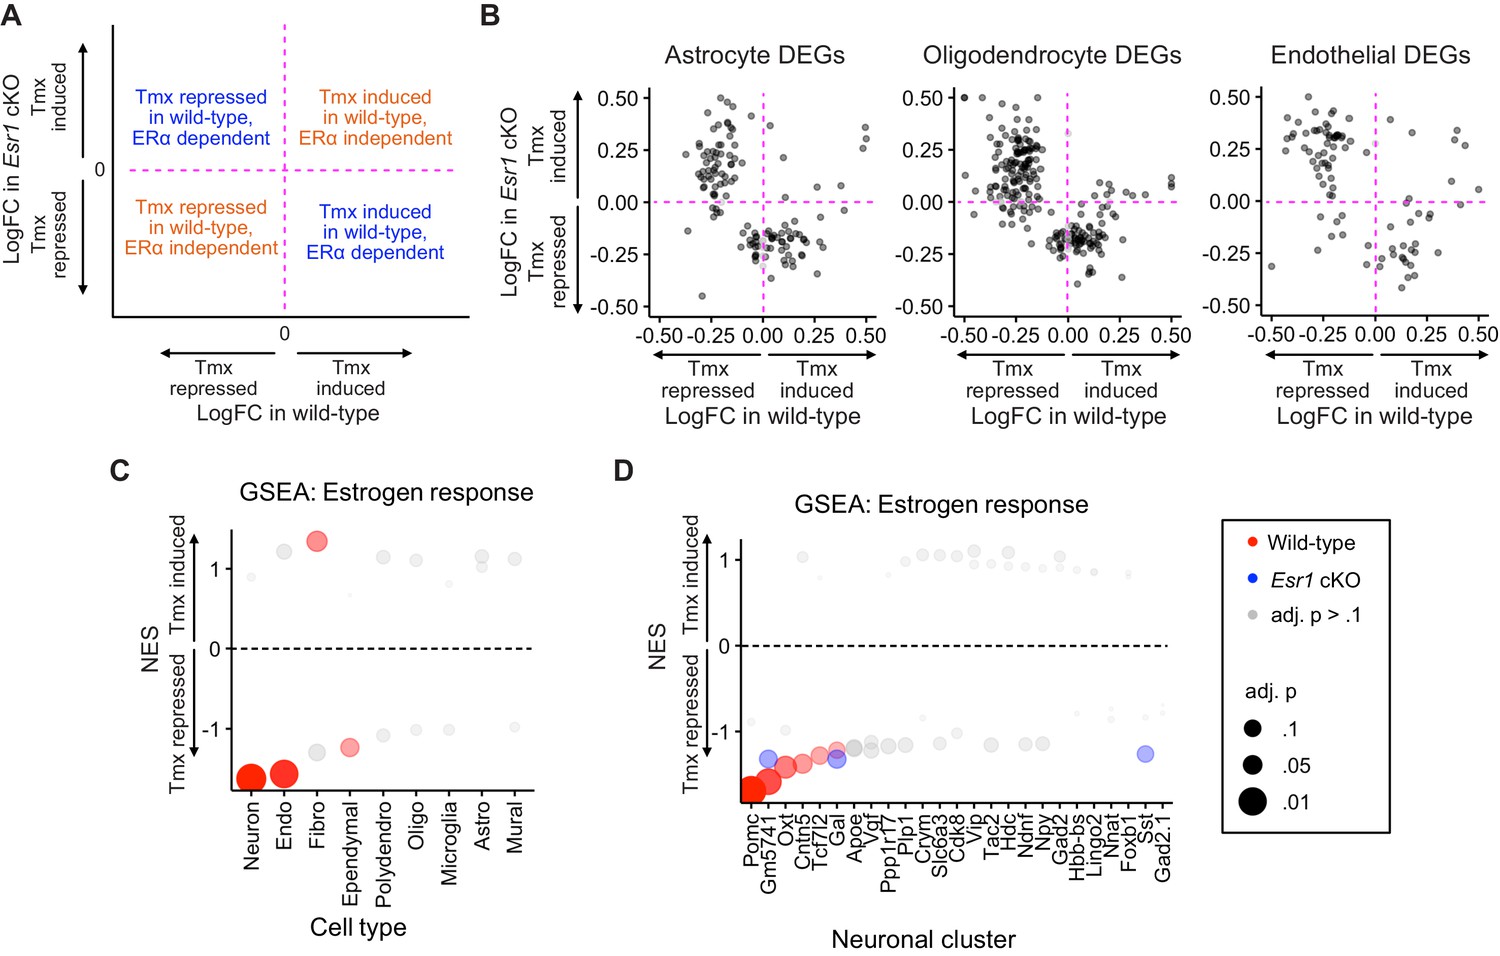
Comparison of gene expression changes induced by tamoxifen in wild-type and Esr1 cKO mice.
(A) Key to comparison of genes induced by tamoxifen in wild-type compared to how they are regulated by tamoxifen in Esr1 cKO animals. (B) Gene-by-gene comparisons of how tamoxifen treatment affects expression in wild-type and Esr1 cKO cells. Each dot is a gene. Only genes significantly up- or downregulated by tamoxifen in wild-type mice are shown. (C) Gene set enrichment analysis (GSEA) NES showing tamoxifen regulation of estrogen responsive genes in wild-type and Esr1 cKO hypothalamus and preoptic area (hypothalamus-POA) cell types. (D) GSEA NES showing tamoxifen regulation of estrogen responsive genes in wild-type and Esr1 cKO neuronal subtypes. NES: Normalized enrichment score, adj. p: Benjamini-Hochberg adjusted p-value.
Figure 6
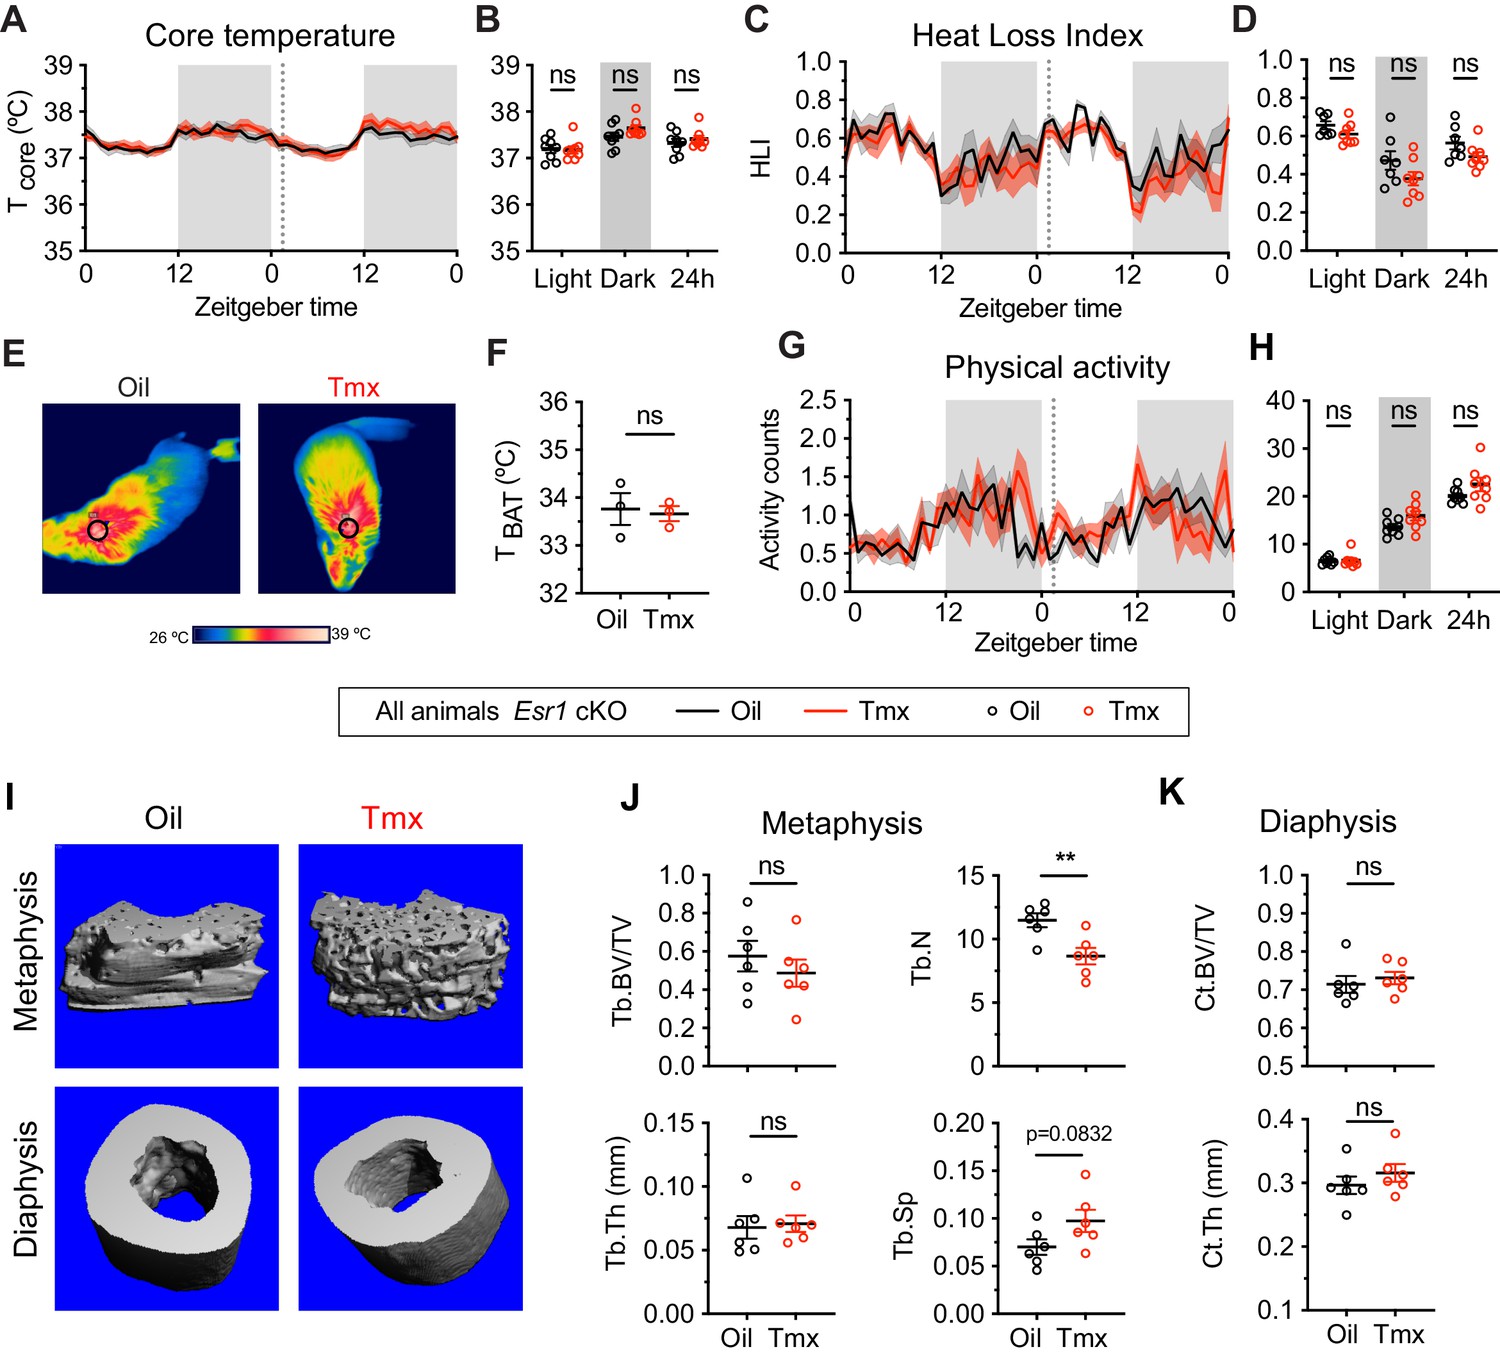
The homeostatic effects of tamoxifen are dependent on estrogen receptor alpha (ERα) in the hypothalamus and preoptic area (hypothalamus-POA).
(A) Hourly average of core body temperature in Esr1 cKO female mice over 2 days before and 3 weeks after injections (dotted line). (B) Average core body temperature from mice shown in panel (A) highlighting per animal averages in light (7:00 to 19:00), dark (19:00 to 7:00), and total 24 hr periods (n = 8, treatment: F1,14=1.395, p=0.7144). (C) Heat loss index (HLI) calculated from continuous measurements of core and tail temperature. (D) Average HLI from mice shown in panel (C) (n = 7–8, treatment: F1,13=3.109, p=0.1013). (E) Thermographic images of interscapular skin above brown adipose tissues (BAT) depots in Esr1 cKO female mice injected with either oil or tamoxifen. (F) Quantification of temperature of skin above intrascapular BAT depots (n = 3, t4 = 0.264, p=0.8048). (G) Hourly average of movement over 2 days before and after injections (dotted line). (H) Average movement from mice shown in panel (H) (n = 8, treatment: F1,14=2.638, p=0.1266). (I) Representative micro-computed tomography (microCT) images showing bone density of the distal metaphysis and midshaft diaphysis of femurs from tamoxifen or oil treated Esr1 cKO female mice. (J) Trabecular bone volume fraction (BV/TV, t10 = 0.8340, p=0.4237), trabecular numbers (Tb.N, t10 = 3.349, p=0.0074), trabecular thickness (Tb.Th, t10 = 0.2668, p=0.7951), and trabecular separation (Tb.Sp, t10 = 1.924, p=0.0832) in distal metaphysis of femurs (n = 6). (K) Bone volume fraction (Ct.BV/TV, t10 = 0.5963, p=0.5643) and cortical thickness (Ct.Th, t10 = 0.9720, p=0.354) in diaphysis of femurs (n = 6). Line shading and error bars represent standard error of the mean (SEM). ns, non-significant; **, p<0.01 for Sidak's multiple comparisons test (B, D, and H) or two-tailed t-test (F, J, and K).
-
Figure 6—source data 1
Source data for Figure 6, panel a.
Hourly average of core body temperature in Esr1 cKO female mice over 2 days before and 3 weeks after injections. Each column is an independent mouse.
- https://cdn.elifesciences.org/articles/63333/elife-63333-fig6-data1-v1.xlsx
-
Figure 6—source data 2
Source data for Figure 6, panel b.
Average core body temperature from Esr1 cKO mice in light, dark, and total 24 hr periods. Each column is an independent mouse.
- https://cdn.elifesciences.org/articles/63333/elife-63333-fig6-data2-v1.xlsx
-
Figure 6—source data 3
Source data for Figure 6, panel c.
Hourly average of heat loss index (HLI) calculated from continuous measurements of core and tail temperature in Esr1 cKO female mice treated with oil or Tmx. Each column is an independent mouse.
- https://cdn.elifesciences.org/articles/63333/elife-63333-fig6-data3-v1.xlsx
-
Figure 6—source data 4
Source data for Figure 6, panel d.
Average heat loss index (HLI) in the light, dark, and total 24 hr periods for Esr1 cKO female mice treated with oil or Tmx. Each column is an independent mouse.
- https://cdn.elifesciences.org/articles/63333/elife-63333-fig6-data4-v1.xlsx
-
Figure 6—source data 5
Source data for Figure 6, panel f.
Quantification of temperature of skin above intrascapular brown adipose tissue (BAT) depots in Esr1 cKO female mice treated with oil or Tmx. Each cell is an independent mouse.
- https://cdn.elifesciences.org/articles/63333/elife-63333-fig6-data5-v1.xlsx
-
Figure 6—source data 6
Source data for Figure 6, panel g.
Hourly average of movement over 2 days before and 3 weeks after injections of oil or tamoxifen in Esr1 cKO female mice. Each column is an independent mouse.
- https://cdn.elifesciences.org/articles/63333/elife-63333-fig6-data6-v1.xlsx
-
Figure 6—source data 7
Source data for Figure 6, panel h.
Average movement in light, dark, and 24 hr periods over 2 days before and 3 weeks after injections of oil or tamoxifen in Esr1 cKO female mice. Each column is an independent mouse.
- https://cdn.elifesciences.org/articles/63333/elife-63333-fig6-data7-v1.xlsx
Author response image 1
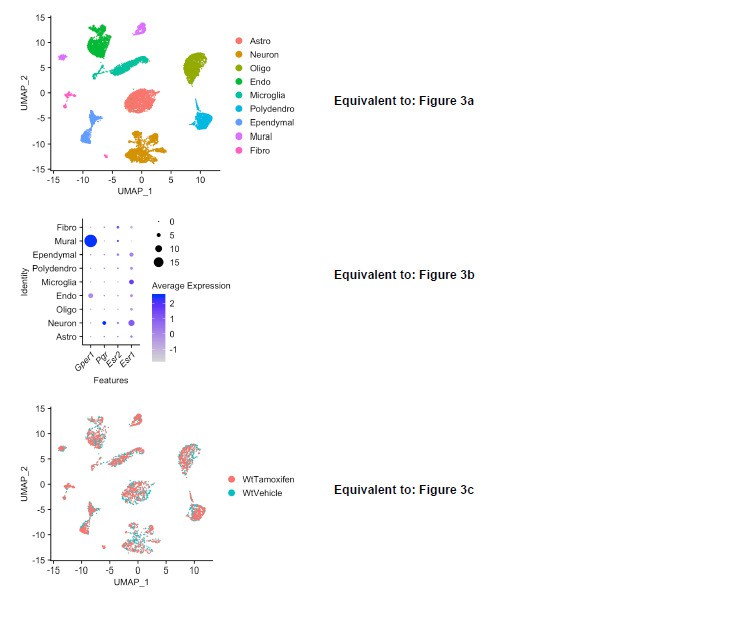
Downsampled re-analysis of scRNA-Seq: all treatment groups normalized to exactly 8,220 cells after initial quality filtering.
Author response image 2
Tables
Key resources table
| Reagent type (species) or resource | Designation | Source or reference | Identifiers | Additional information |
|---|---|---|---|---|
| gene (Mus musculus) | Esr1 | MGI | MGI:1352467 NCBI Gene: 13982 | |
| Strain, strain background (Mus musculus) | Esr1tm1Sakh Esr1 floxed mouse line; CD-1;129P2 mixed background | Feng et al., 2007 | MGI:4459300 | Targeted conditional mutation allele. Females used for experiments |
| Strain, strain background (Mus musculus) | Tg(Nkx2-1-cre)2Sand Nkx2-1Cre mouse line CD-1;129P2 mixed background | Xu et al., 2008 | MGI: 3773076 | BAC transgenic Cre driver. Females used for experiments |
| Antibody | anti-ERα (mouse monoclonal) | Santa Cruz | Cat# sc-8002, RRID:AB_627558 | IF (1:250) |
| Chemical compound, drug | Tamoxifen | Sigma-Aldrich | T5648 | |
| Software, algorithm | Seurat R package | Butler et al., 2018 | version 3.2.0 | Single-cell RNA sequencing analyses |
| Software, algorithm | Prism | GraphPad | version 8 | Physiology data analyses |
| Software, algorithm | VitalView software | Starr Life Sciences | version 5.1 | Core temperature and movement data collection |
| Software, algorithm | Mercury Analysis Software | Star:ODDI | version 5.7 | Tail temperature data collection |
| Other | DAPI stain | Invitrogen | D1306, RRID:AB_2629482 | IF (1 µg/mL) |
Additional files
-
Source code 1
R Code for scRNA-seq analyses.
- https://cdn.elifesciences.org/articles/63333/elife-63333-code1-v1.zip
-
Supplementary file 1
Tables for single-cell data.
(a) Gene set enrichment analysis (GSEA) of estrogen responsive genes in cells from tamoxifen-treated vs. vehicle-treated wild-type mice. (b) List of all gene sets queried in GSEAs for (c, d, and e). (c) Pathways significantly altered in cell clusters from tamoxifen-treated vs. vehicle-treated wild-type mice. (d) Pathways significantly altered in neuronal subtypes from tamoxifen-treated vs. vehicle treated wild-type mice. (e) Pathways significantly altered in cells from tamoxifen-treated vs. vehicle-treated Esr1 cKO mice, as determined by GSEA. (f) GSEA of estrogen responsive genes in cells from tamoxifen-treated vs. vehicle-treated Esr1 cKO mice. (g) GSEA of estrogen responsive genes in neuronal clusters from tamoxifen-treated vs. vehicle-treated wild-type mice. (h) GSEA of estrogen responsive genes in neuronal clusters from tamoxifen-treated vs. vehicle-treated Esr1 cKO mice. (i) Differentially expressed genes (DEGs) in neurons from tamoxifen-treated vs. vehicle-treated mice. (j) DEGs in ependymal cells from tamoxifen-treated vs. vehicle-treated mice.
- https://cdn.elifesciences.org/articles/63333/elife-63333-supp1-v1.xlsx
-
Supplementary file 2
Details of all statistical tests for physiology data.
(a) Statistical details for Figure 1, panels c, e, and g. (b) Statistical details for Figure 1—figure supplement 1, panels b and c. (c) Statistical details for Figure 2, panels b and c. (d) Statistical details for Figure 2, panels e-g. (e) Statistical details for Figure 6, panels b-h. (f) Statistical details for Figure 6, panels j and k .(g) Statistical details for Figure 5—figure supplement 1, panel e.
- https://cdn.elifesciences.org/articles/63333/elife-63333-supp2-v1.xlsx
-
Transparent reporting form
- https://cdn.elifesciences.org/articles/63333/elife-63333-transrepform-v1.docx
Download links
A two-part list of links to download the article, or parts of the article, in various formats.
Downloads (link to download the article as PDF)
Open citations (links to open the citations from this article in various online reference manager services)
Cite this article (links to download the citations from this article in formats compatible with various reference manager tools)
Estrogen receptor alpha in the brain mediates tamoxifen-induced changes in physiology in mice
eLife 10:e63333.
https://doi.org/10.7554/eLife.63333


