Membrane binding controls ordered self-assembly of animal septins
- AMOLF, Department of Living Matter, Biological Soft Matter group, Netherlands
- School of Biomedical Sciences, Faculty of Biological Sciences, Astbury Centre for Structural Molecular Biology, University of Leeds, United Kingdom
- School of Physics and Astronomy, Faculty of Engineering and Physical Sciences, University of Leeds, United Kingdom
- Bragg Centre for Materials Research, University of Leeds, United Kingdom
- Department of Bionanoscience, Kavli Institute of Nanoscience Delft, Delft University of Technology, Netherlands
- Institut Fresnel, CNRS, Aix-Marseille Univ, Centrale Marseille, France
- Laboratoire Physico Chimie Curie, Institut Curie, PSL Research University, France
- Sorbonne Université, France
Figures
Figure 1 with 2 supplements
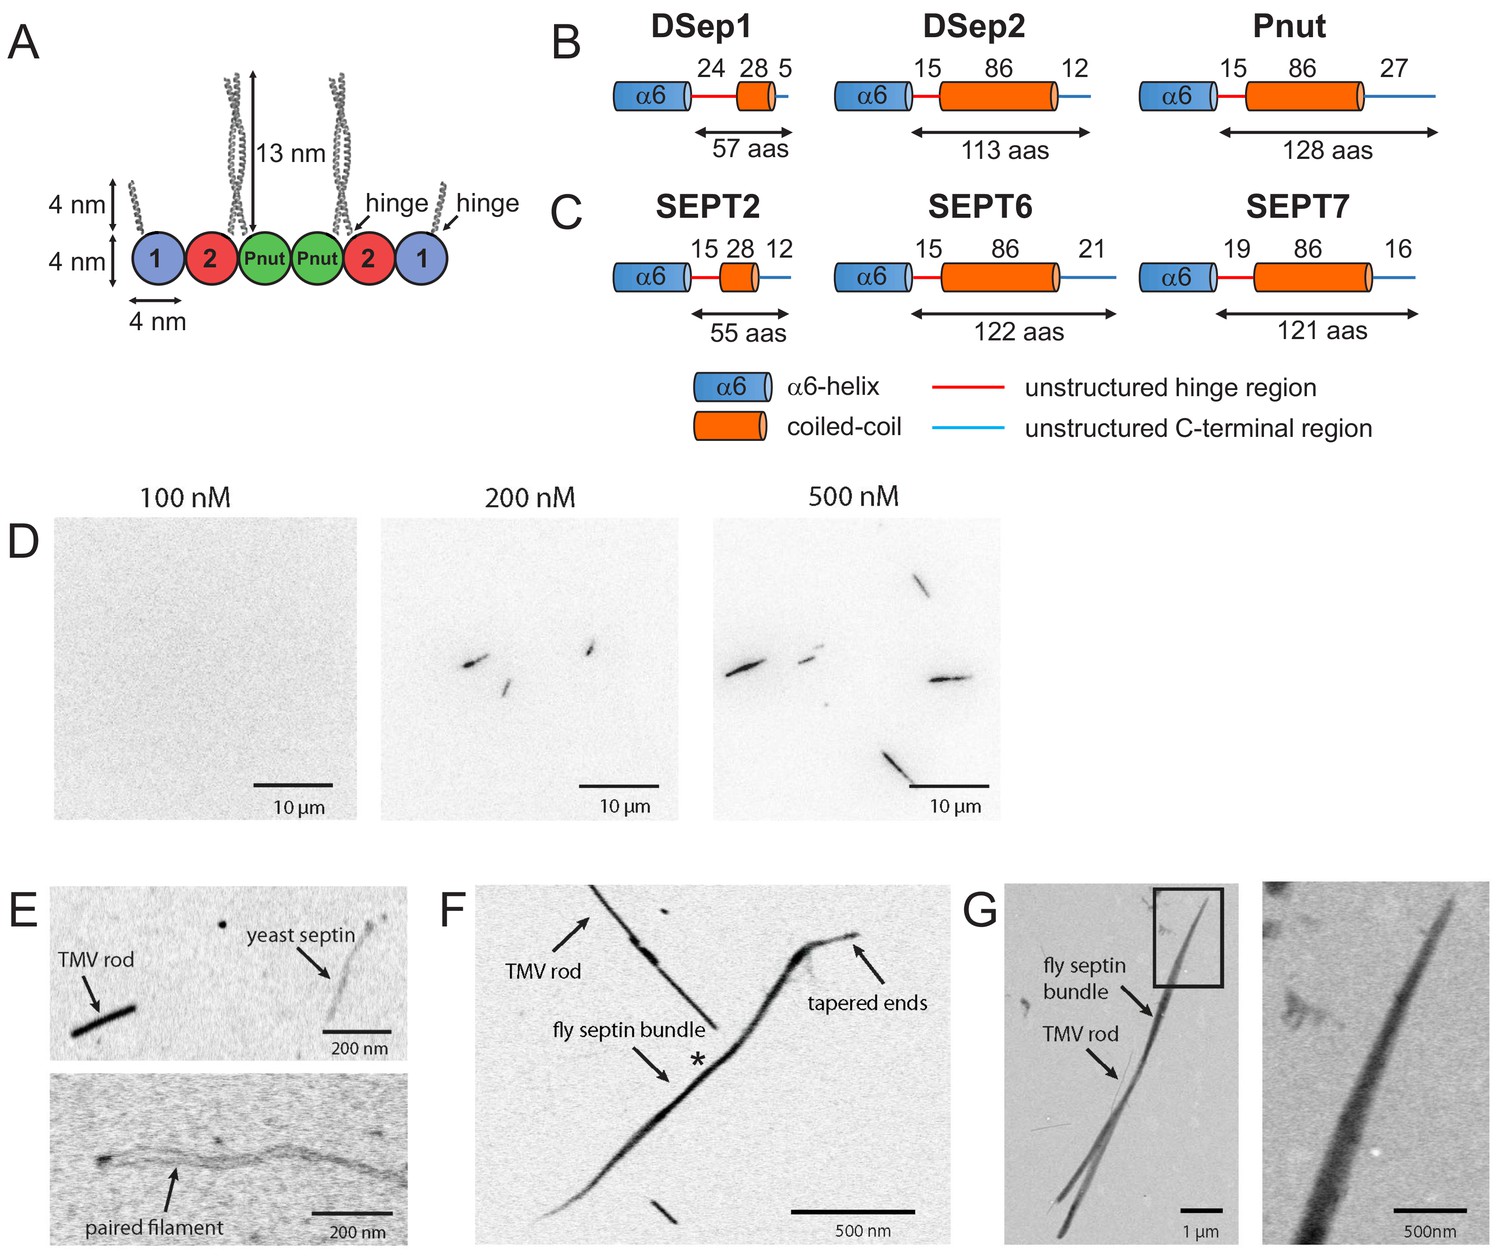
Fly septin hexamers form bundles in solution.
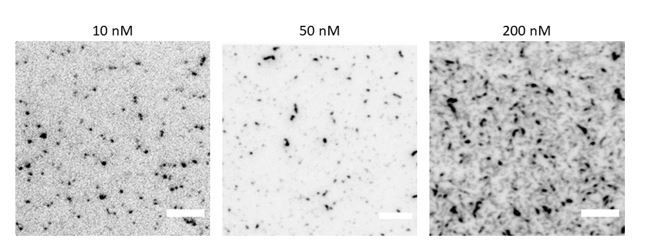
(A) Schematic of the fly septin hexamer, showing its expected palindromic arrangement with long (13 nm) coiled-coil extensions of the Pnut and DSep2 (labelled 2) subunits, and shorter (4 nm) extensions on the DSep1 (labelled 1) subunits. The predicted septin coiled-coils are depicted to scale using available crystal-structures. (B) Structure predictions for the C-terminal regions of fly septins, starting from the end of the α6-helix regions (aas – amino acids). (C) Corresponding predictions for human septins. (D) TIRF images of mEGFP-tagged fly septin bundles formed in solution and crowded onto net-neutral SLBs composed of PC by methylcellulose, with septin concentrations as indicated above each image. (E) STEM images of yeast septin filaments. Upper panel: septin filament and a TMV rod (see arrows). Lower panel: paired septin filament. (F) STEM image of fly septin bundle formed at a concentration of 200 nM surrounded by several TMV rods (one example is pointed out). The bundle center width and MPL (asterisk) are 31 nm and 250 kDa/nm, respectively. (G) STEM image of a fly septin bundle formed at a concentration of 500 nM, together with three TMV rods (one is indicated by an arrow). Note that TIRF and STEM images are all contrast-inverted, so septins appear dark against a light background.
Figure 1—figure supplement 1
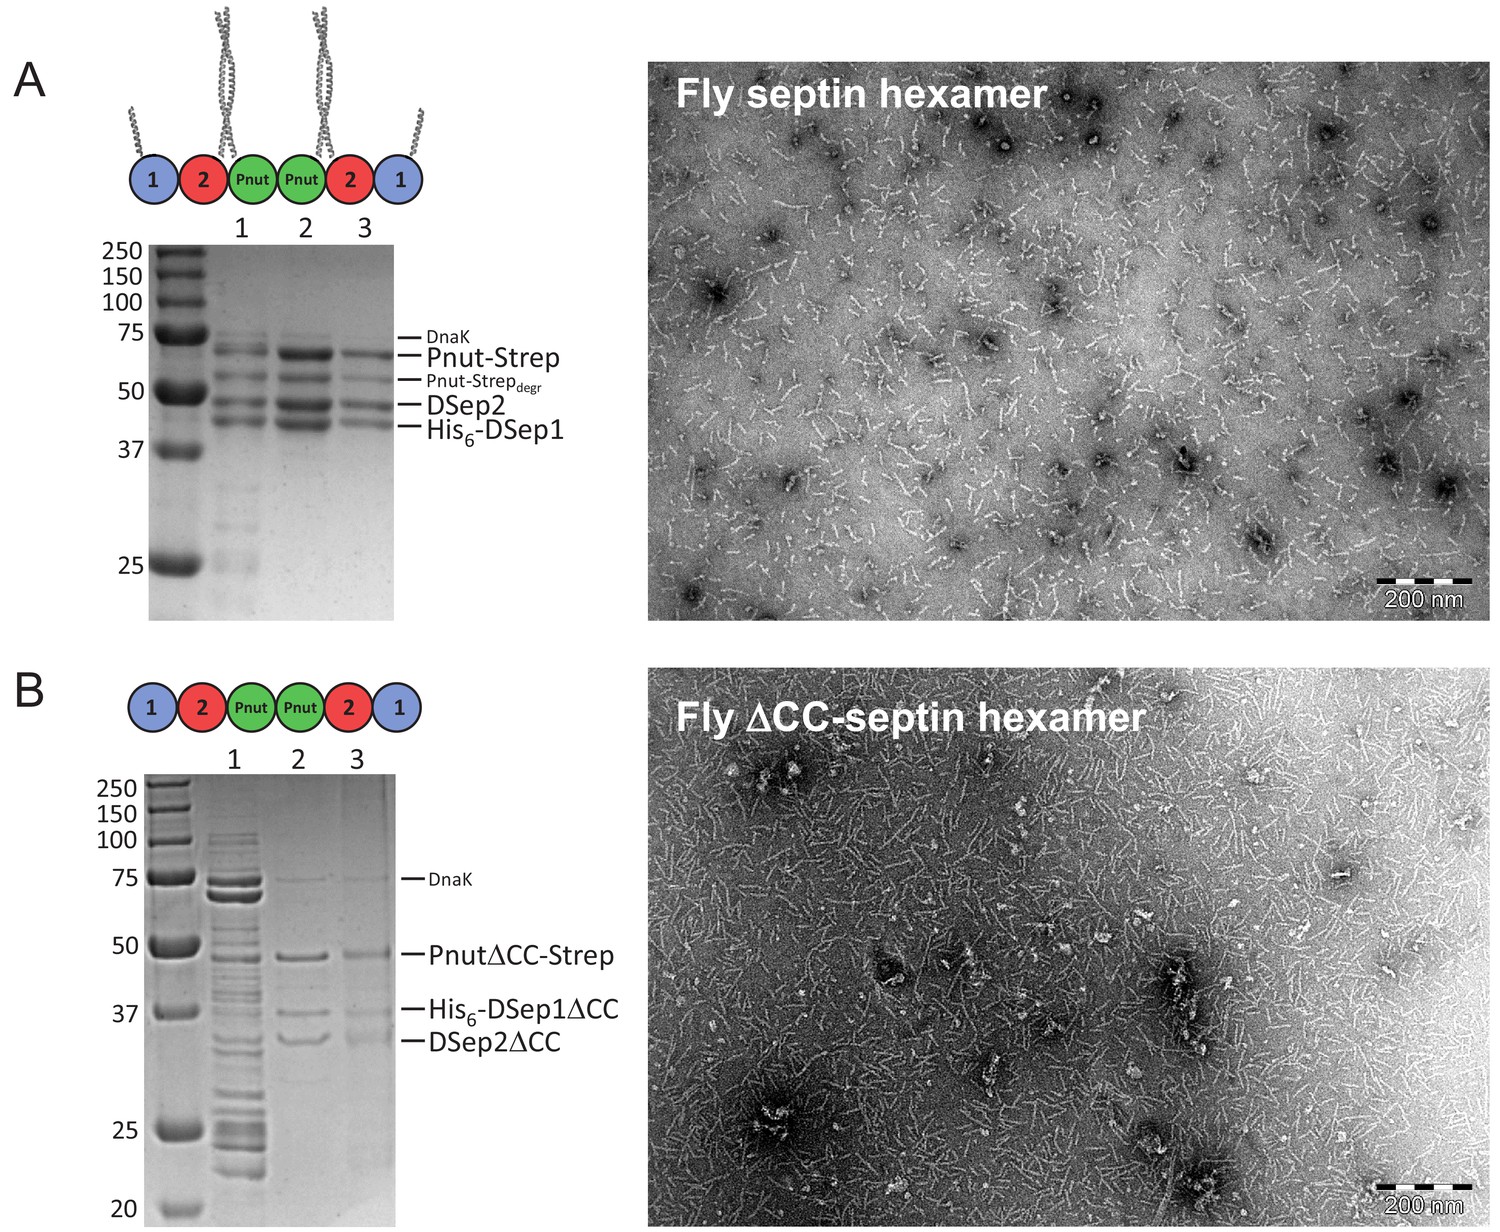
Biochemical and morphological characterization of septin hexamers.
(A) Left: SDS-PAGE gel of full-length fly septin hexamers with lanes showing: (1) nickel-column eluate, (2) StrepTrap-column eluate, (3) gel filtration eluate. Molecular weight markers in kDa are indicated on the left. The three bands of similar intensity represent the three subunits: Pnut-Strep (61.2 kDa), DSep2 (48.5 kDa), and His6-DSep1 (43.8 kDa). The fainter bands between the DSep2 and Pnut bands represent partially degraded Pnut-Strep, while the faint band located around 70 kDa is DnaK (Mavrakis et al., 2014). Right: negative-stain TEM image showing that fly septin hexamers (0.02 mg/ml, that is, 65 nM) in a high-salt (300 mM KCl) storage buffer are present predominantly as hexamers or dimers thereof. (B) Left: SDS-PAGE gel of the ΔCC mutant with C-terminal truncations (DSep1ΔC56, DSep2ΔC111, PnutΔC123), showing three bands at the positions expected for the three septin subunits for the nickel-column eluate (lane 2) and subsequent StrepTrap-column eluate (lane 3). Right: negative-stain TEM image shows that the ΔCC-septin hexamers (0.02 mg/ml, that is., 84 nM) in a high-salt (300 mM KCl) storage buffer are present mainly as hexamers.
Figure 1—figure supplement 2
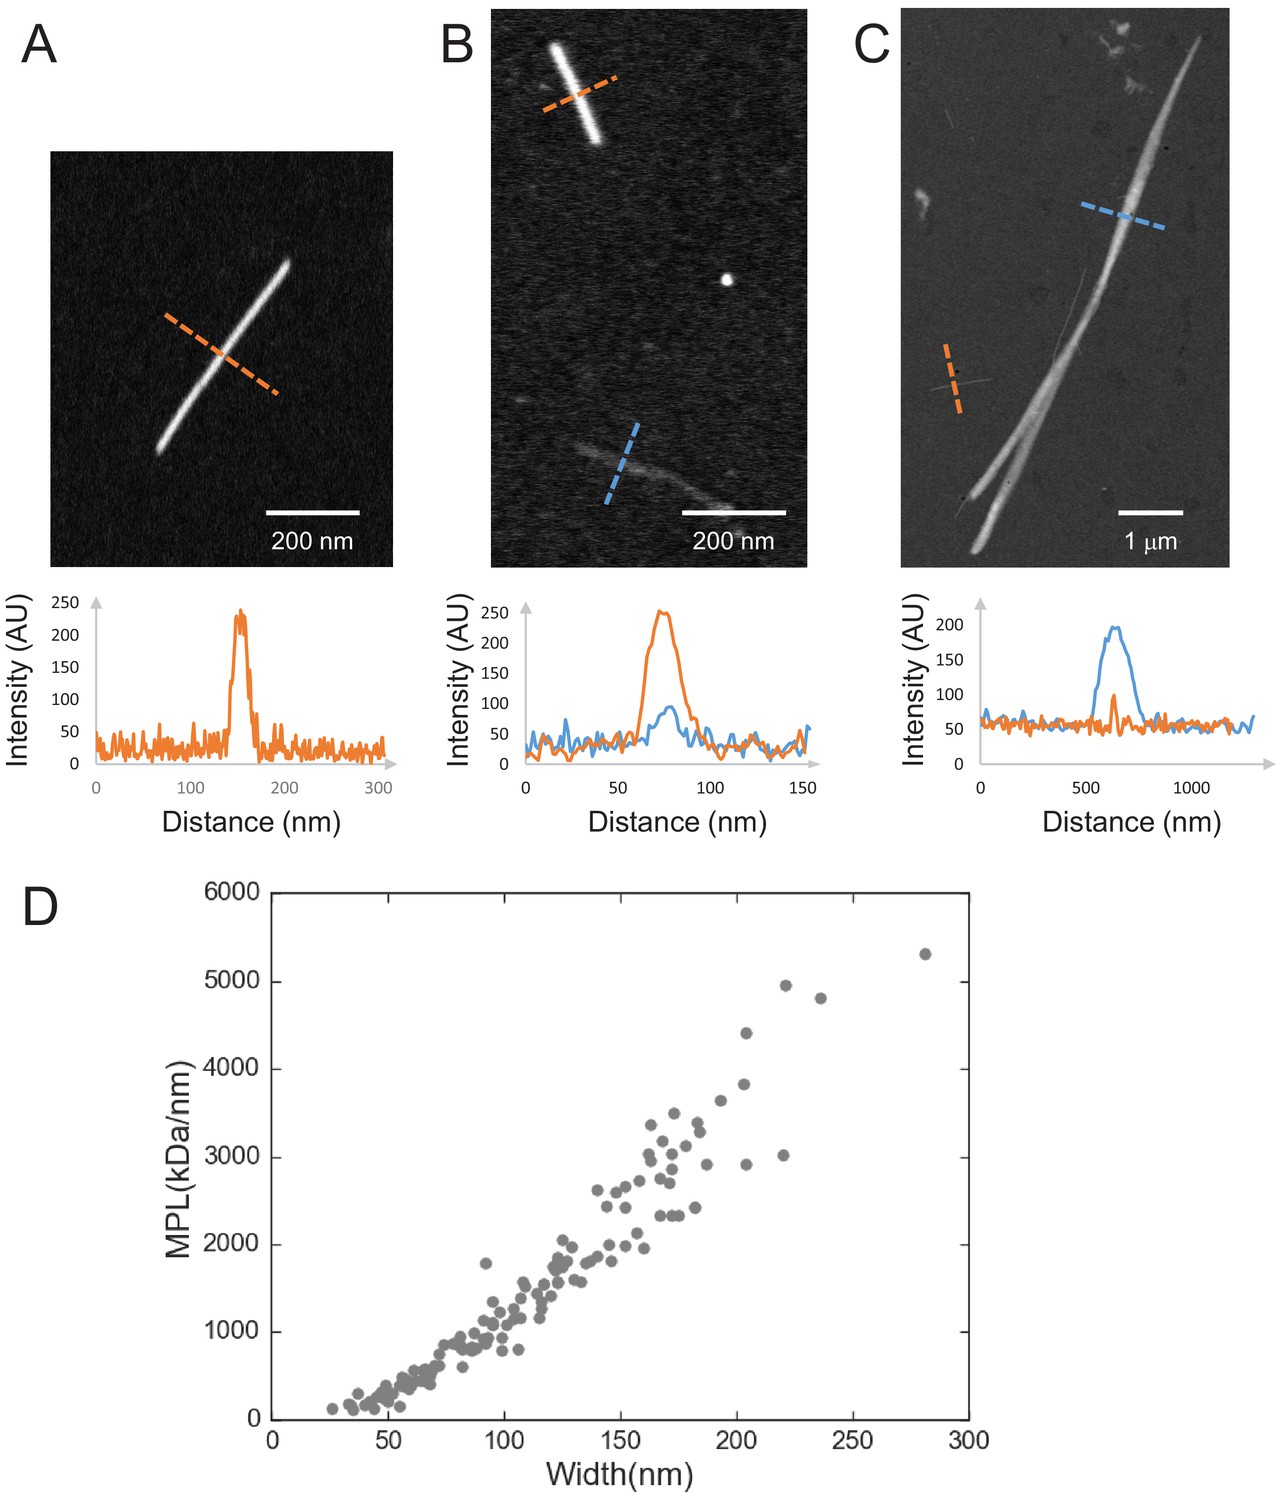
Quantification of septin filament MPL from STEM images.
(A–C) Examples of MPL determination from STEM images for an image of a TMV virus rod (A), an image showing both a TMV virus rod and a paired yeast septin filament (B), and an image showing both a TMV virus rod and a fly septin bundle (C). The graphs show line profiles taken along the orange dotted lines (for TMV rods) and blue dotted lines (for septin filaments) in the corresponding images. The intensity can be converted to MPL as explained in the Materials and methods section. (D) Quantification of the bundle size for fly septin hexamer bundles formed in bulk solution at 500 nM. Scatter plot of the mass-per-length (MPL; in units of kDa/nm) versus the bundle width (in nm). The data were collected from two independent STEM-imaging sessions, five images, 16 bundles, and in total 130 data points.
Figure 2 with 2 supplements
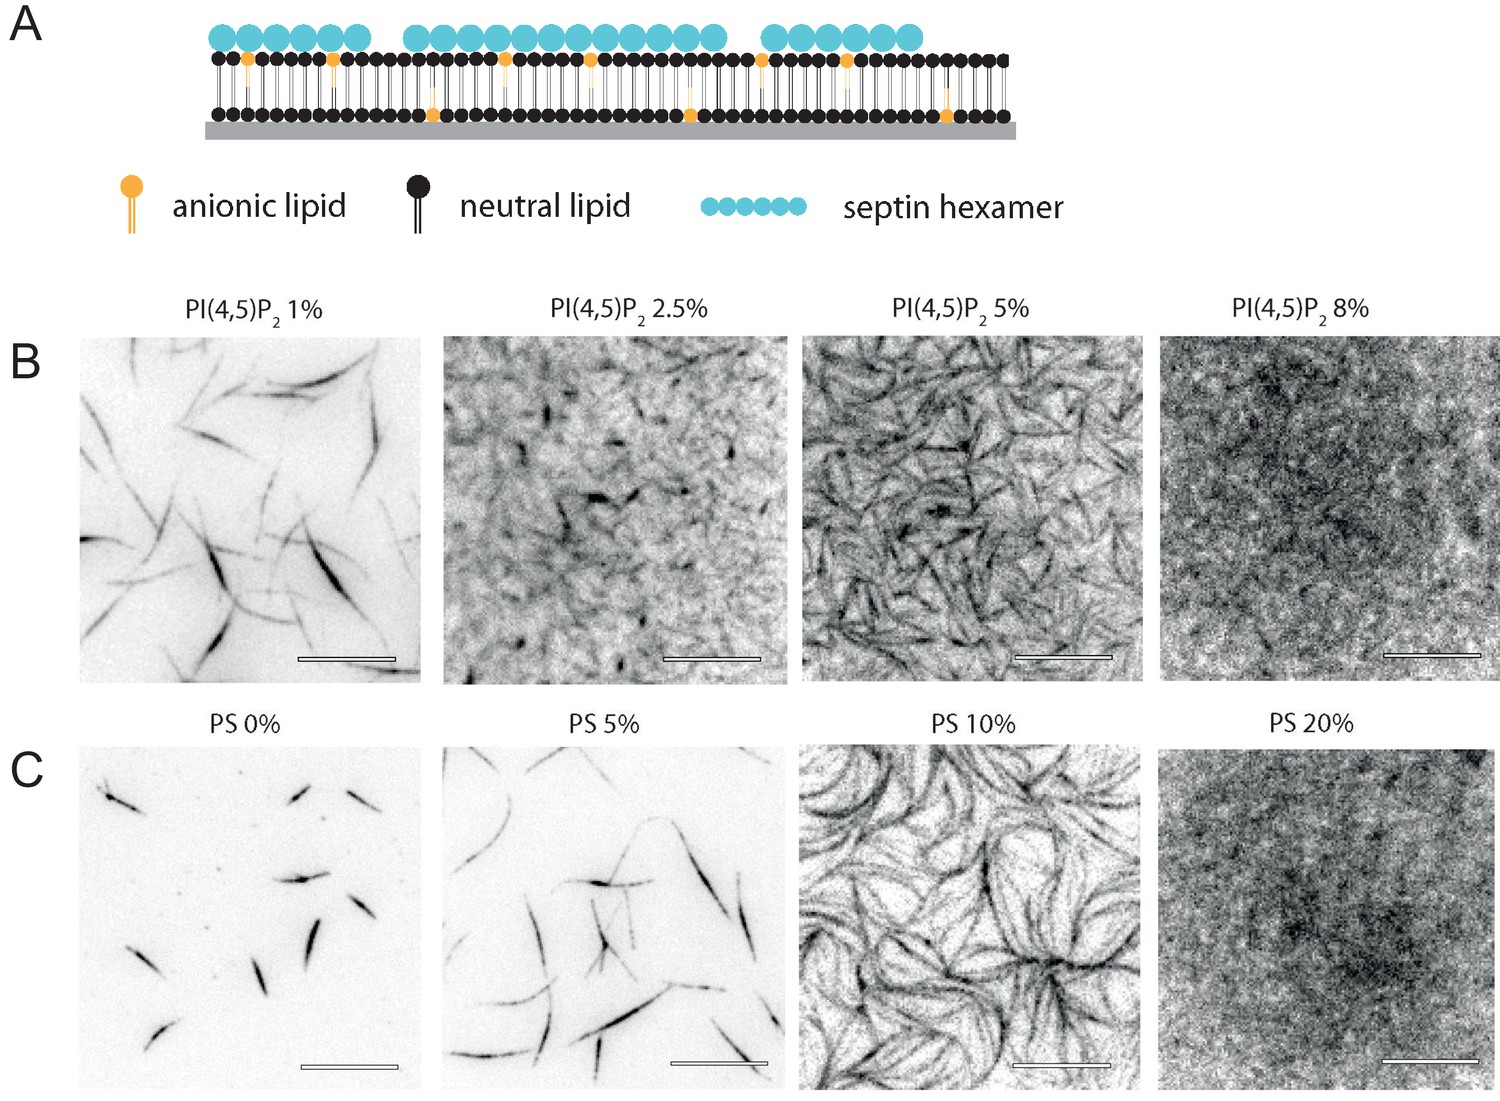
Glass-supported lipid bilayers containing anionic lipids recruit septins and promote the assembly of dense septin meshworks.
(A) Purified fly septin hexamers are deposited on a glass-supported bilayer composed of net-neutral (PC) and anionic (PS or PI(4,5)P2) lipids (sketch not to scale). (B) TIRF images recorded ~3 min after the deposition of septin hexamers (1 µM; 10 mol-% mEGFP-tagged hexamers) on bilayers doped with PI(4,5)P2 at mole fractions between 1% and 8% (see legend). (C) TIRF images obtained ~3 min after the deposition of septins (1 µM) on bilayers doped with PS at mole fractions between 0% and 20% (see legend). Note that methylcellulose was used to crowd septin bundles to the bilayer for the neutral SLB (0% PS) but was left out in all other cases. All images are contrast-inverted, so septins are dark and membrane areas devoid of septins are light. Scale bars: 10 µm.
Figure 2—figure supplement 1
Dependence of septin adsorption on septin concentration and on the PS content of the SLBs.
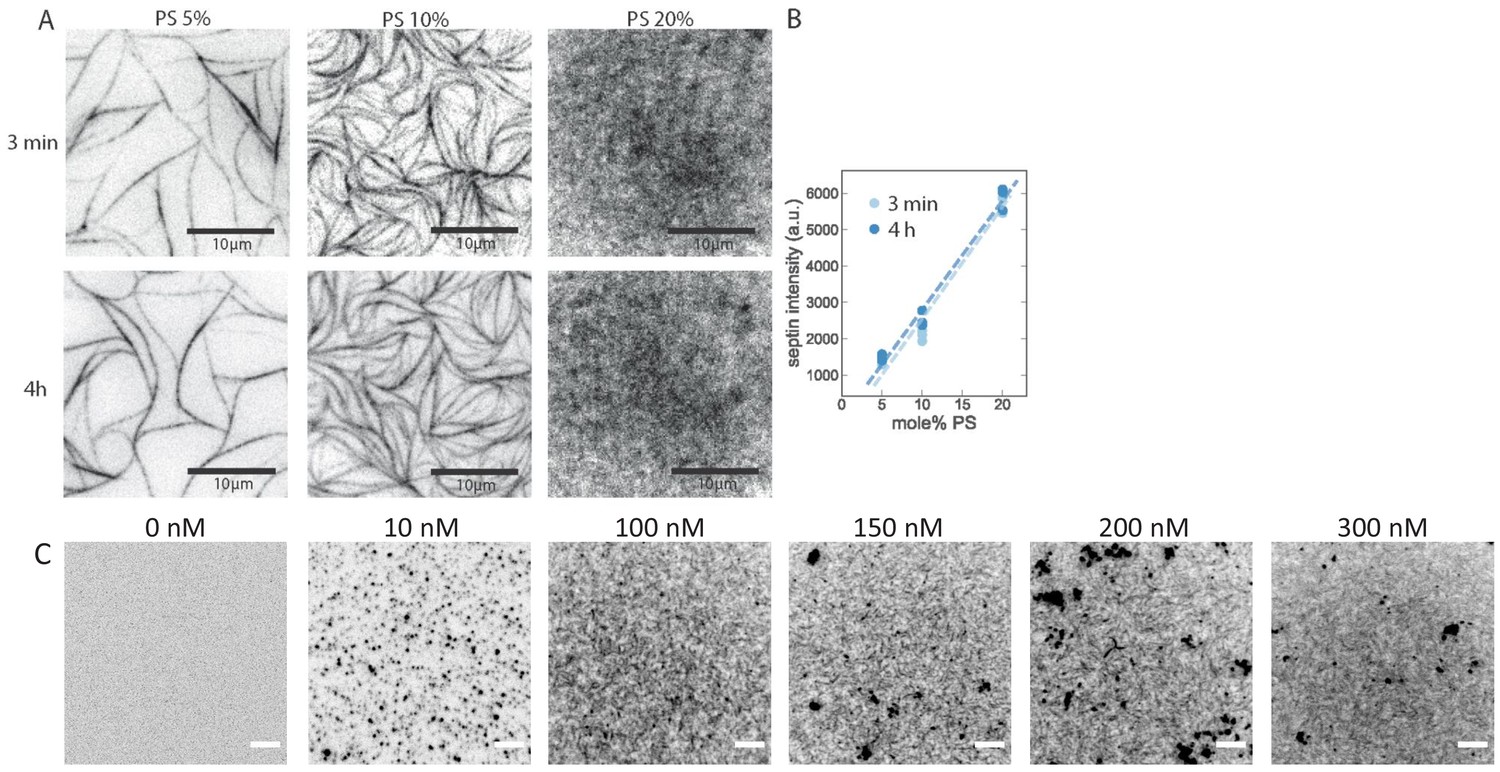
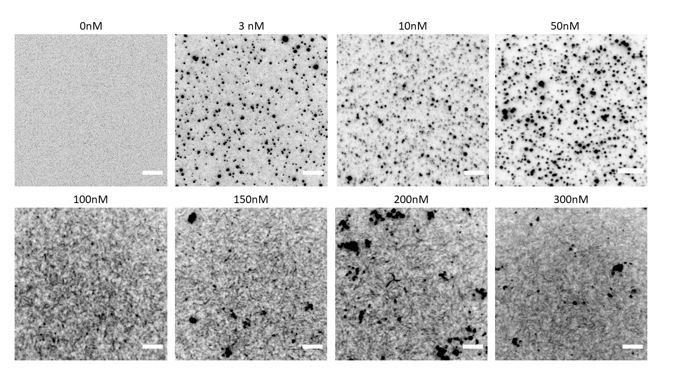
TIRF imaging shows that fly septin hexamers rapidly adsorb to anionic bilayers and rapidly form filaments. (A) TIRF images obtained at time points of ~3 min (top row) and 4 hr (bottom row) after the deposition of fly septin hexamers (500 nM, 10 mol-% mEGFP-tagged) on PC bilayers doped with 5, 10, or 20 mol-% PS. The larger the DOPS content, the less bundled and the more dense and grainy the septin layer appears. Note that the 3 min and 4 hr images do not show the same regions because experiments required keeping the glass slides in a humidified petri dish, so finding the same region afterwards was not possible. (B) Corresponding integrated septin intensities (each data point is based on one experiment with three different regions of interest in different sample locations), showing a linear increase with PS content (lines are fits) with insignificant changes from 3 min to 4 hr of septin incubation. Note that the TIRF signal includes contributions from both membrane-bound septins and solution-phase septins within the TIRF excitation field. (C) TIRF images taken 30 min after depositing fly septin hexamers (100 mol-% EGFP-tagged) at different concentrations, as indicated above each image, on PC bilayers doped with 20 mol-% PS. TIRF reveals the presence of membrane-bound septin already at a concentration of 10 nM, but lacks the resolution necessary to reveal the organization. Dark (i.e. brightly fluorescent) puncta are indicative of some protein aggregation, likely due to the GFP tag. All images are contrast-inverted, so septins are dark and membrane areas devoid of septins are light. Scale bars: 5 μm.
Figure 2—figure supplement 2
FRAP data testing the mobility of septins and lipids.
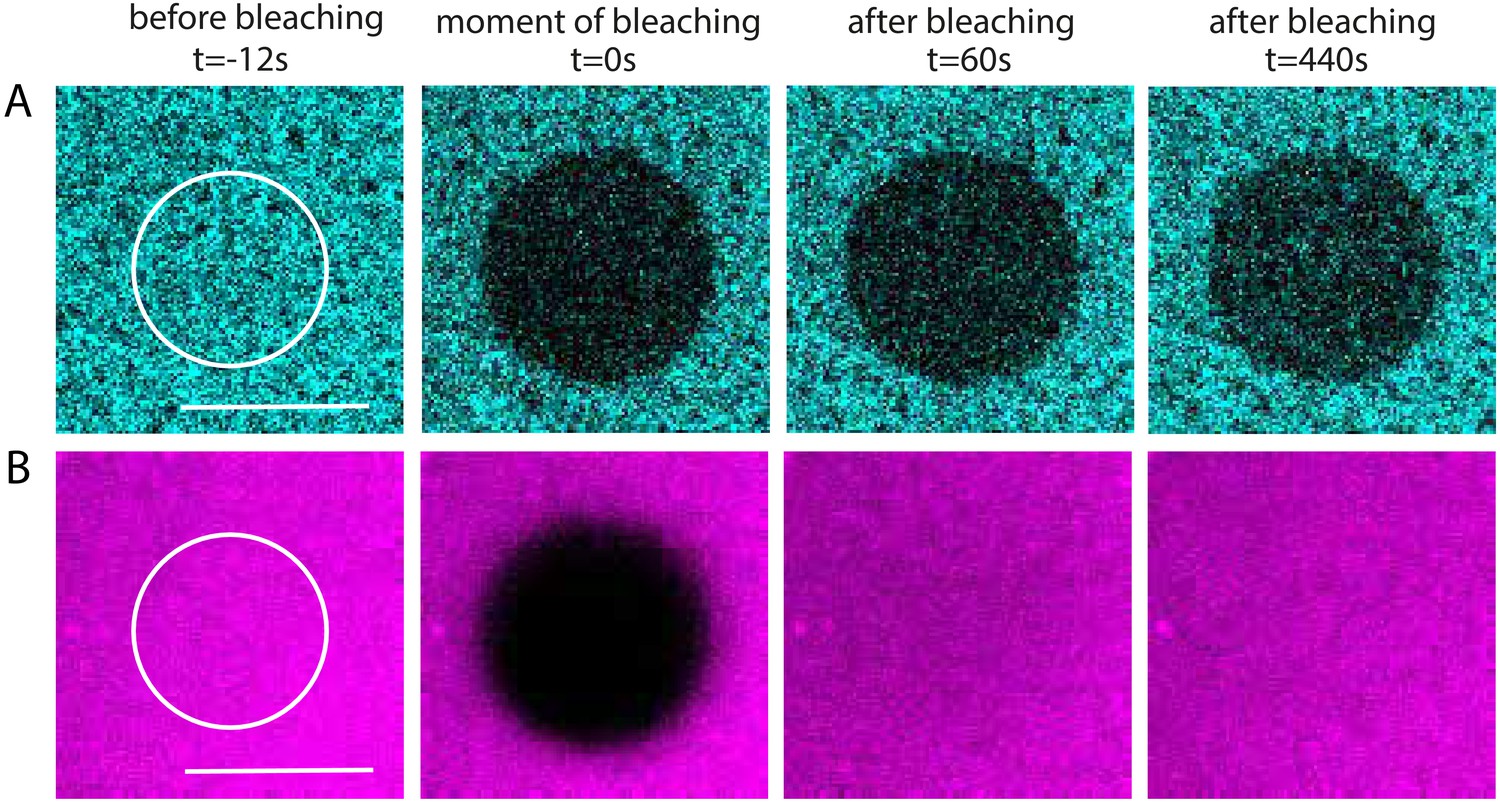
Fluorescence recovery after photobleaching experiments show that membrane-adhered fly septin layers are immobile and stable over time while the bilayer is fluid. A solution of 500 nM septin hexamers containing 10 mol-% mGFP-labeled hexamers was incubated with glass-supported lipid bilayers containing PC, 20% PS, and 0.3% mol-% of fluorescently labeled lipids (rhodamine-PE). (A) The fluorescence of the septin meshwork does not recover after photobleaching a circular region with a radius r = 5 µm (indicated by the white circle) at time t = 0 for 1 s on an observation time scale of nearly 7 min, indicating negligible mobility and turnover. (B) The fluorescent signal of the rhodamine-PE lipids does recover fully upon photobleaching. The time-dependent fluorescence recovery reveals an average lipid diffusivity D ≈ 1.2 μm2/s, both with and without adsorbed septins, as determined by extracting the recovery half time τ1/2 = 4r2γD/D (where γD = 0.88) from a fit to the Soumpasis equation (Soumpasis, 1983). This diffusivity is characteristic of fluid lipid bilayers on solid supports (Guo et al., 2008). Scale bar: 10 µm.
Figure 3 with 2 supplements
Septin hexamers form dense arrays of tightly paired filaments on anionic lipid monolayers.
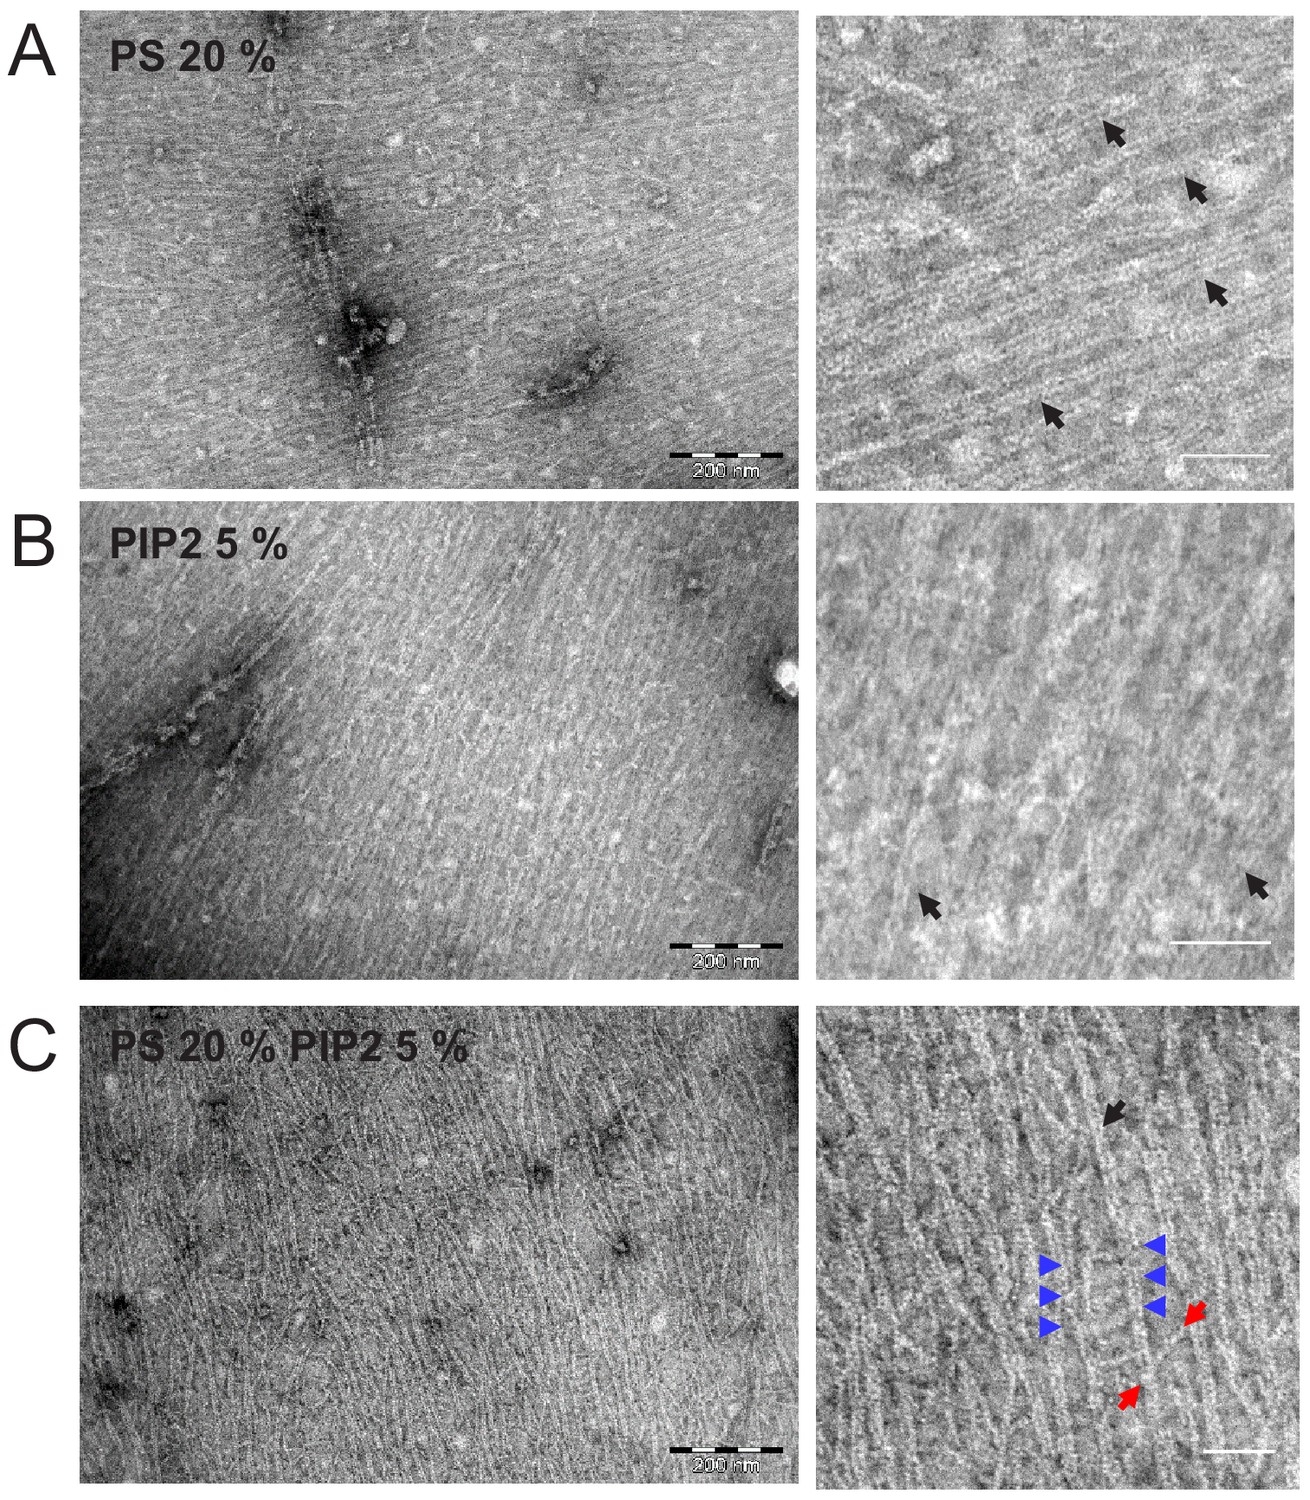
Electron micrographs of negatively stained fly septin hexamers (65 nM) after overnight incubation with lipid monolayers composed of PC combined with anionic lipids: (A) 20% PS, (B) 5% PI(4,5)P2, and (C) 20% PS plus 5% PI(4,5)P2. Images on the right show zoomed-in regions of the images on the left. Black arrows point out examples of paired filaments recognizable by two linear filaments running in parallel. Blue arrows indicate examples of orthogonal hexamers, recognizable by their ~ 24 nm length, between adjacent paired filaments. The two red arrows point to the two ends of a longer (43 nm) cross-bridging filament that bridges two adjacent paired filaments under an oblique angle. Scale bars: 250 nm (left) and 50 nm (right).
Figure 3—figure supplement 1
Quantification of filament dimensions from electron microscopy images.
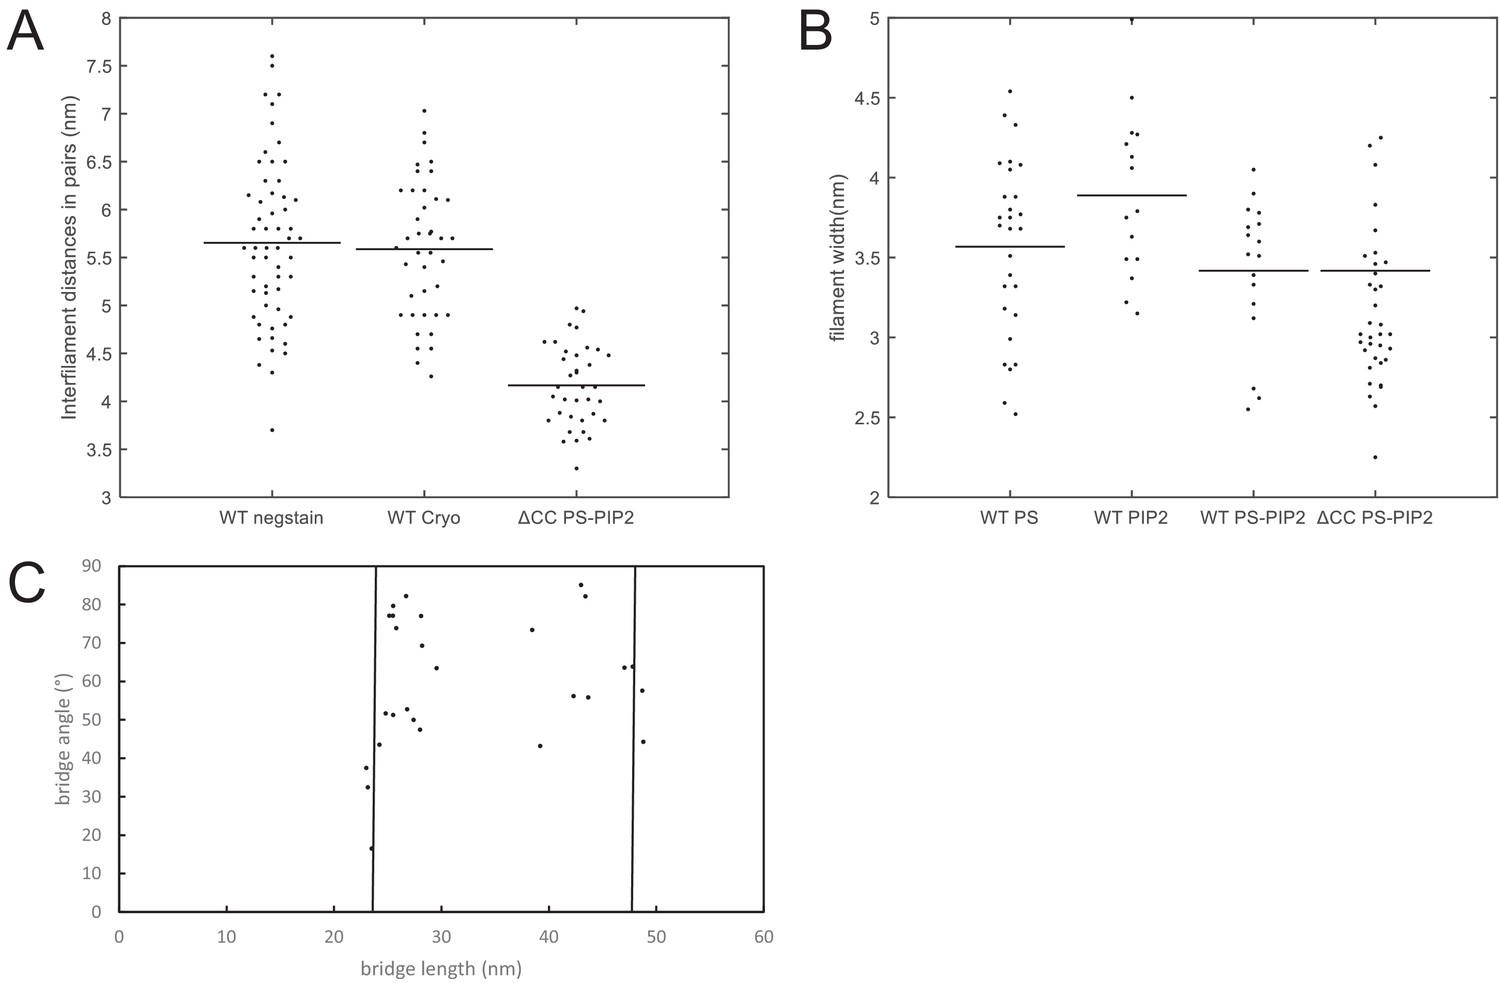
Quantification of negative stain EM and cryoEM images of membrane-bound septin hexamers. Data for wild-type (WT) septin hexamers are shown together with data for C-terminally truncated ΔCC mutant septin hexamers. (A) Interfilament distance (center-to-center) between septin filaments within paired filaments. The figure legend denotes EM data for negatively stained WT septins on lipid monolayers (‘WT negstain’) and for ΔCC mutant septins on lipid monolayers (‘ΔCC PS-PIP2’), and cryoEM data for WT septins on LUVs (‘WT cryo’). The monolayers contained 20% PS + 5% PI(4,5)P2, while the LUVs contained 5% PI(4,5)P2. (B) Widths of individual septin filaments from EM images of negatively stained septins on lipid monolayers, for different lipid compositions. The figure legend denotes the septin variant (WT or ΔCC) and the lipid composition: 20% PS (‘WT PS’), 5% PIP(4,5)P2 (‘WT PIP2’) or 20% PS plus 5% PIP(4,5)P2 (‘WT PS-PIP2’ and ‘ΔCC PS-PIP2’). (C) Lengths and angles of connecting bridges between paired septin filaments on PS-PI(4,5)P2 monolayers. The bridge lengths are distributed within two clusters with lengths near 24 nm (corresponding to hexamers; left vertical line) or 48 nm (corresponding to double hexamers; right vertical line). Black horizontal lines in panels A and B are averages of the distributions. Number of measurements: in panel A: N = 57, 40, and 36 for ‘WT negstain’, ‘WT cryo’, and ‘ΔCC mutant’, respectively. In panel B: N = 28, 17, 15, and 35 for ‘WT PS’, ‘WT PIP2’, ‘WT PS-PIP2’, and ‘ΔCC mutant’, respectively. In panel C, N = 27.
Figure 3—figure supplement 2
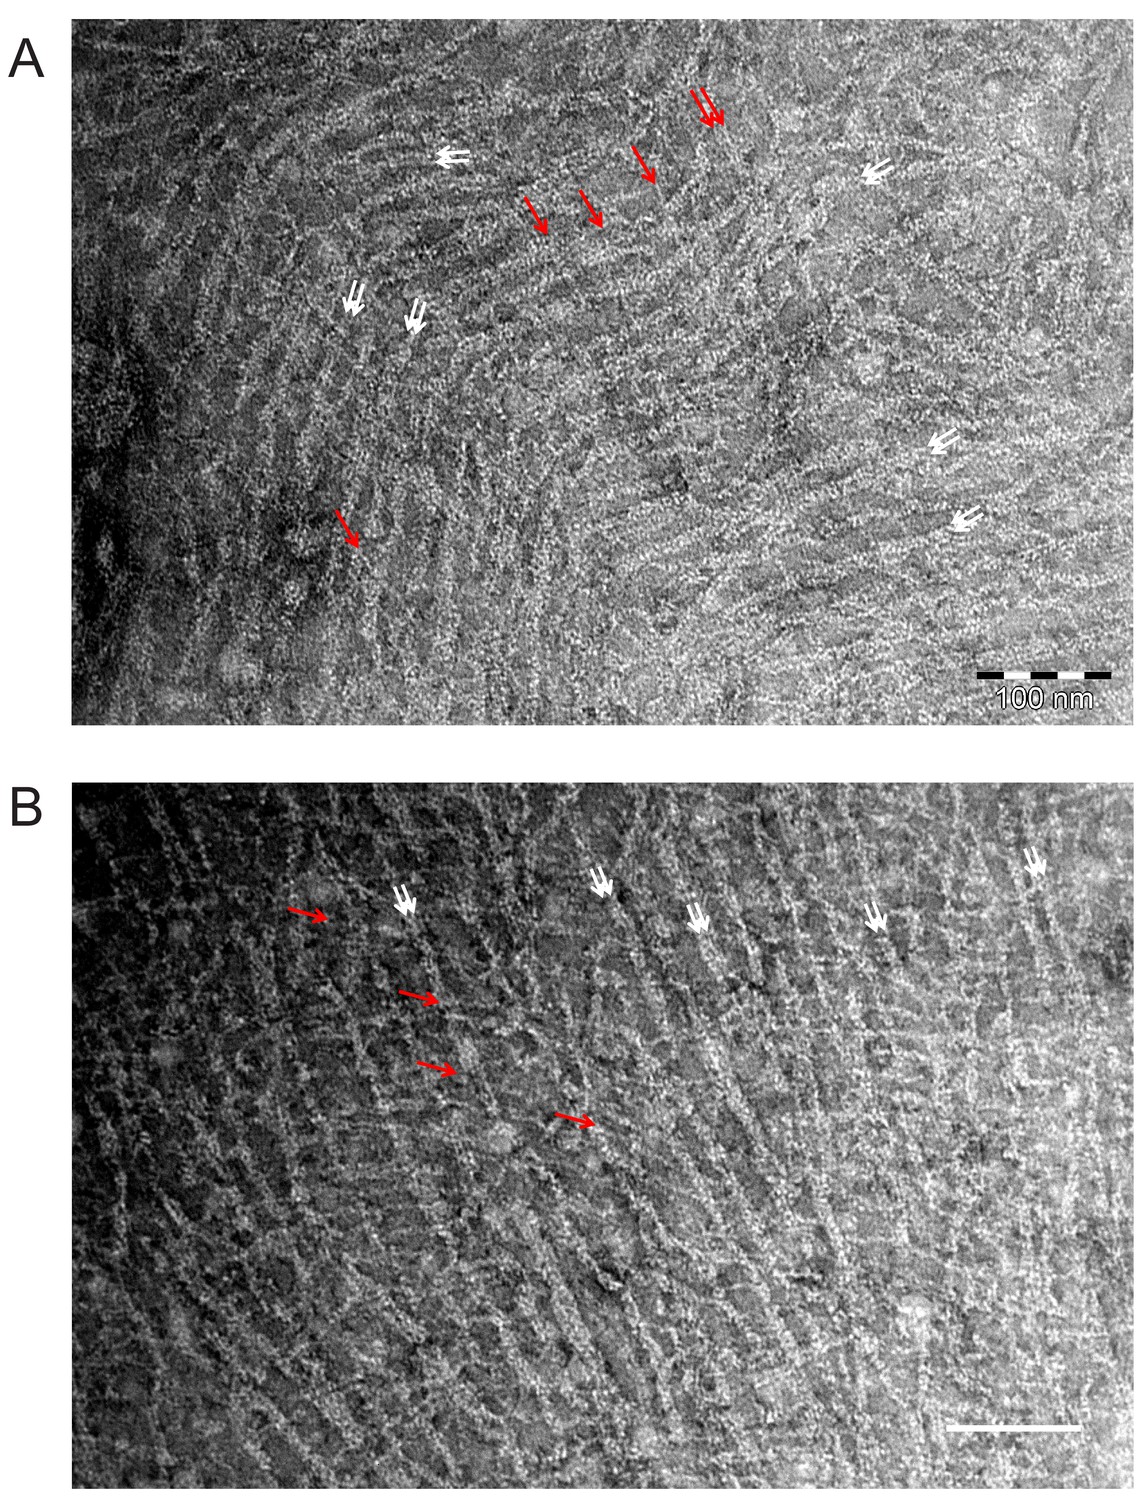
EM images of mammalian septin hexamers on lipid monolayers.
Mammalian septin hexamers form paired filaments on lipid monolayers comprised of PC, 20 mol-% PS, and 5 mol-% PI(4,5)P2. Mammalian septin hexamers (comprised of mouse SEPT2, human SEPT6 and human SEPT7) incubated at 70 nM with a lipid monolayer containing 20% PS and 5% PIP2 form paired filaments connected by many cross-bridging filaments. The white arrows indicate examples of paired filaments (in areas where there are two obvious densities side by side and the filament as a whole looks thicker). Red arrows point at bridging filaments which seem to be thinner and run continuously across the paired filaments. It is unclear whether the bridging filaments are single filaments or (twisted, and therefore thinner) paired filaments. Scale bars: 100 nm.
Figure 4 with 4 supplements
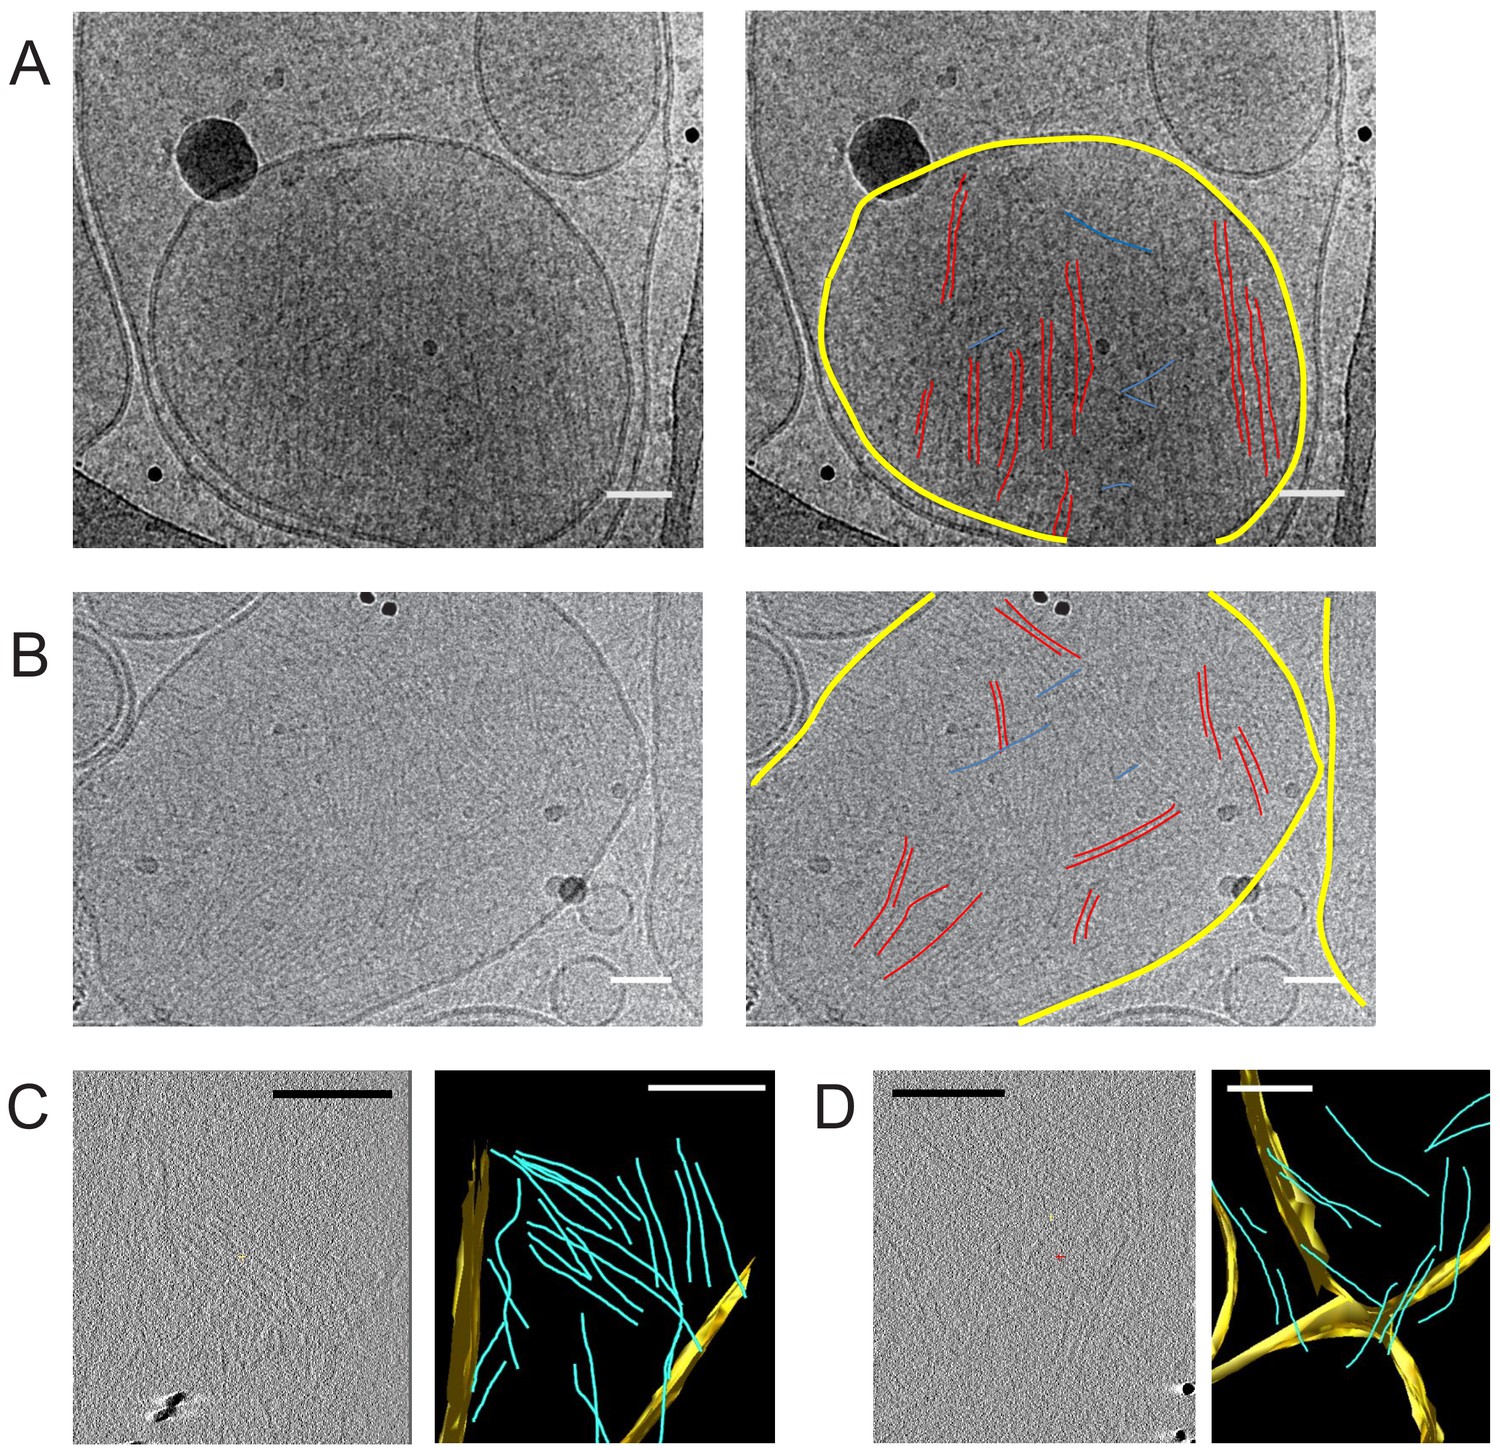
Septin hexamers form single and paired filaments on large unilamellar lipid vesicles.
CryoEM images of fly septin hexamers (160 nM) after a 30 min incubation with LUVs containing 95% PC and 5% PI(4,5)P2. (A) Example image (left) with paired septin filaments traced out in red, connecting orthogonal filaments in blue and the vesicle membrane highlighted in yellow (right). (B) Another example image (left), with mostly paired and occasionally single filaments traced out in red, connecting orthogonal filaments in blue and membranes in yellow (right). Black dots are gold nanoparticles that were included as fiducial markers for tomography. The black curved lines in panels A, B come from the carbon lacey substrate. (C) Slice from 3D reconstructed cryo-tomogram (left) with segmented data (right). (D) Another example tomogram (left) with segmented data (right). Reconstructions show membrane in yellow and septin filaments in blue. Note that the bilayer perpendicular to the electron beam is poorly defined because of the missing wedge. Scale bars are 50 nm in A,B and 850 nm in C, D.
Figure 4—figure supplement 1
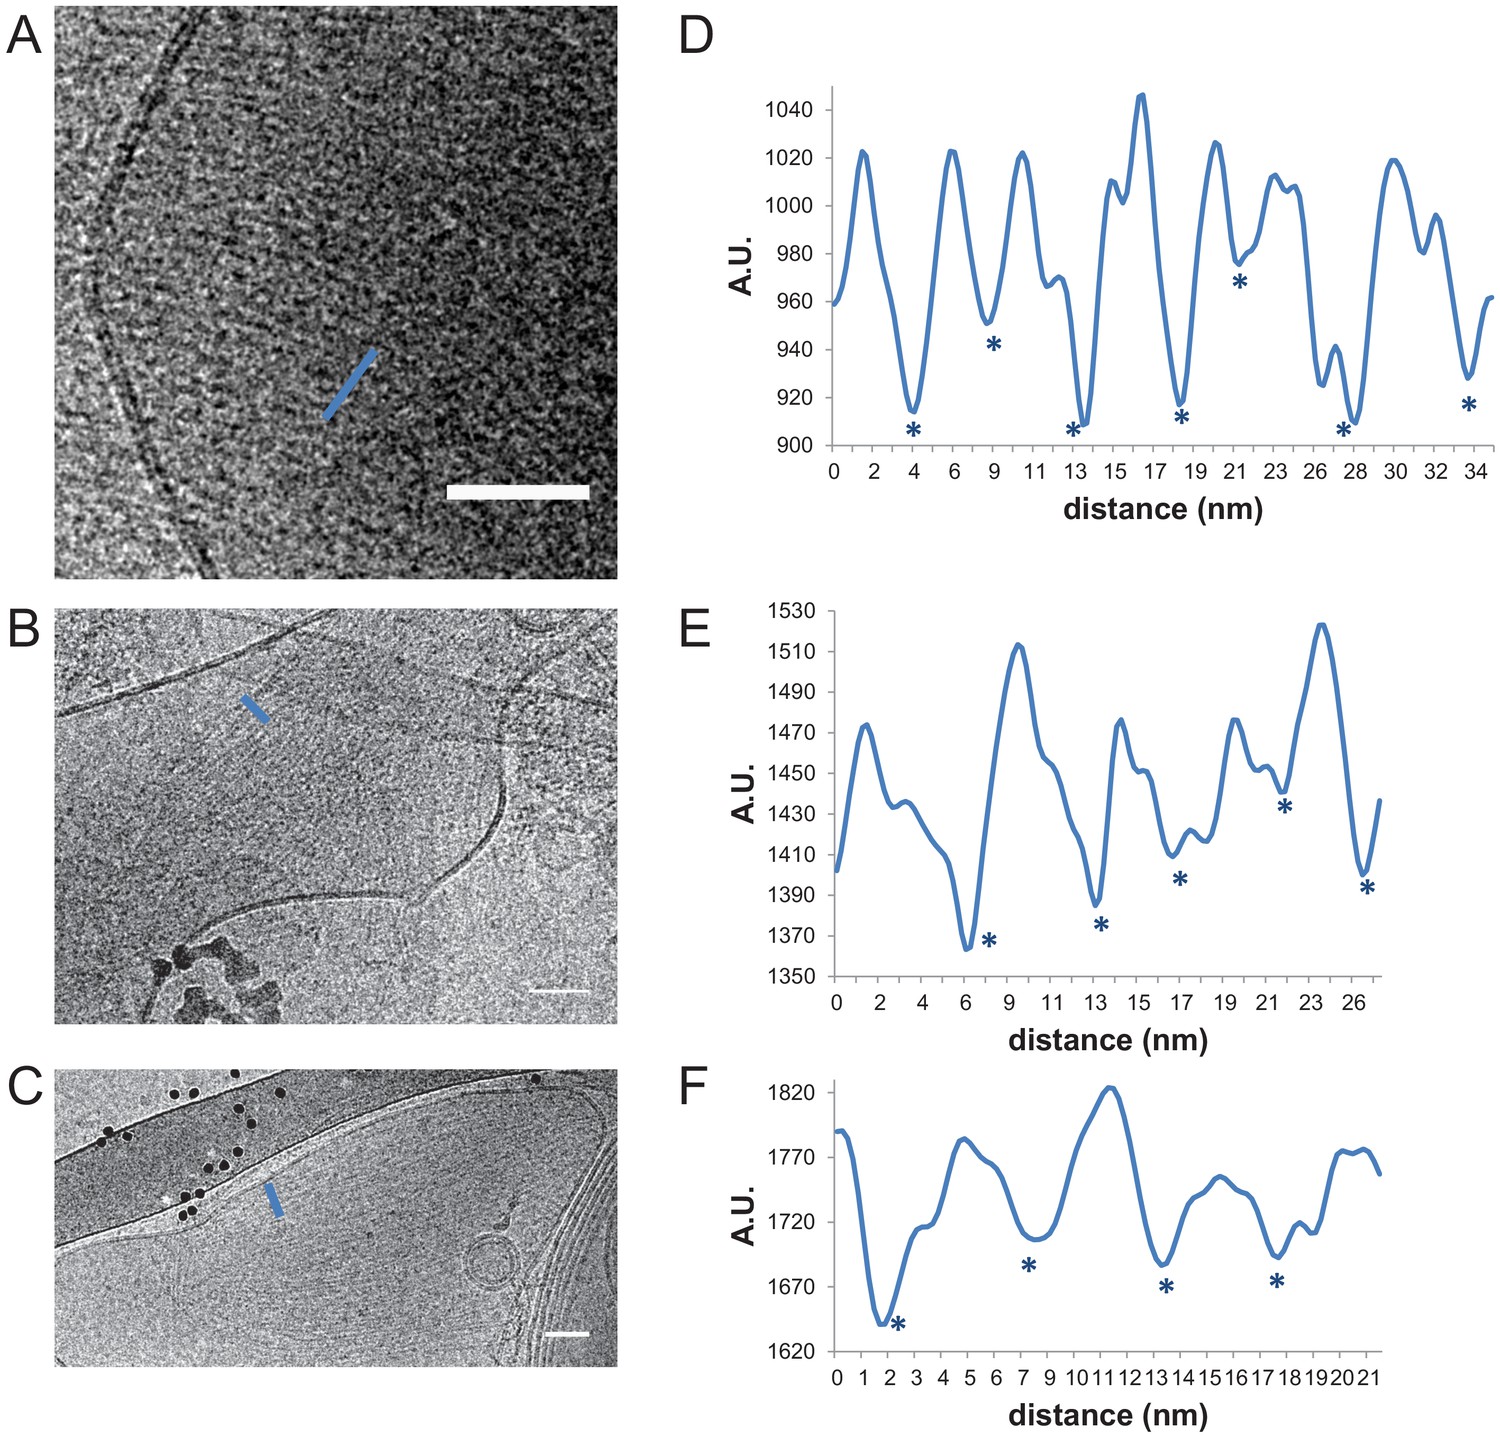
Interfilament spacing for paired fly septin filaments.
Paired fly septin filaments (160 nM) on large unilamellar lipid vesicles composed of 85 mol-% PC, 10 mol-% PE and 5 mol-% PI(4,5)P2 exhibit an average center-to-center spacing of ~5.7 nm. (A, B, C) Three examples of cryoEM images, with (D, E, F) corresponding line profiles drawn along the blue lines. Stars denote approximate center positions of filaments. Scale bars: 50 nm. Further quantification is shown in Figure 3—figure supplement 1.
Figure 4—figure supplement 2
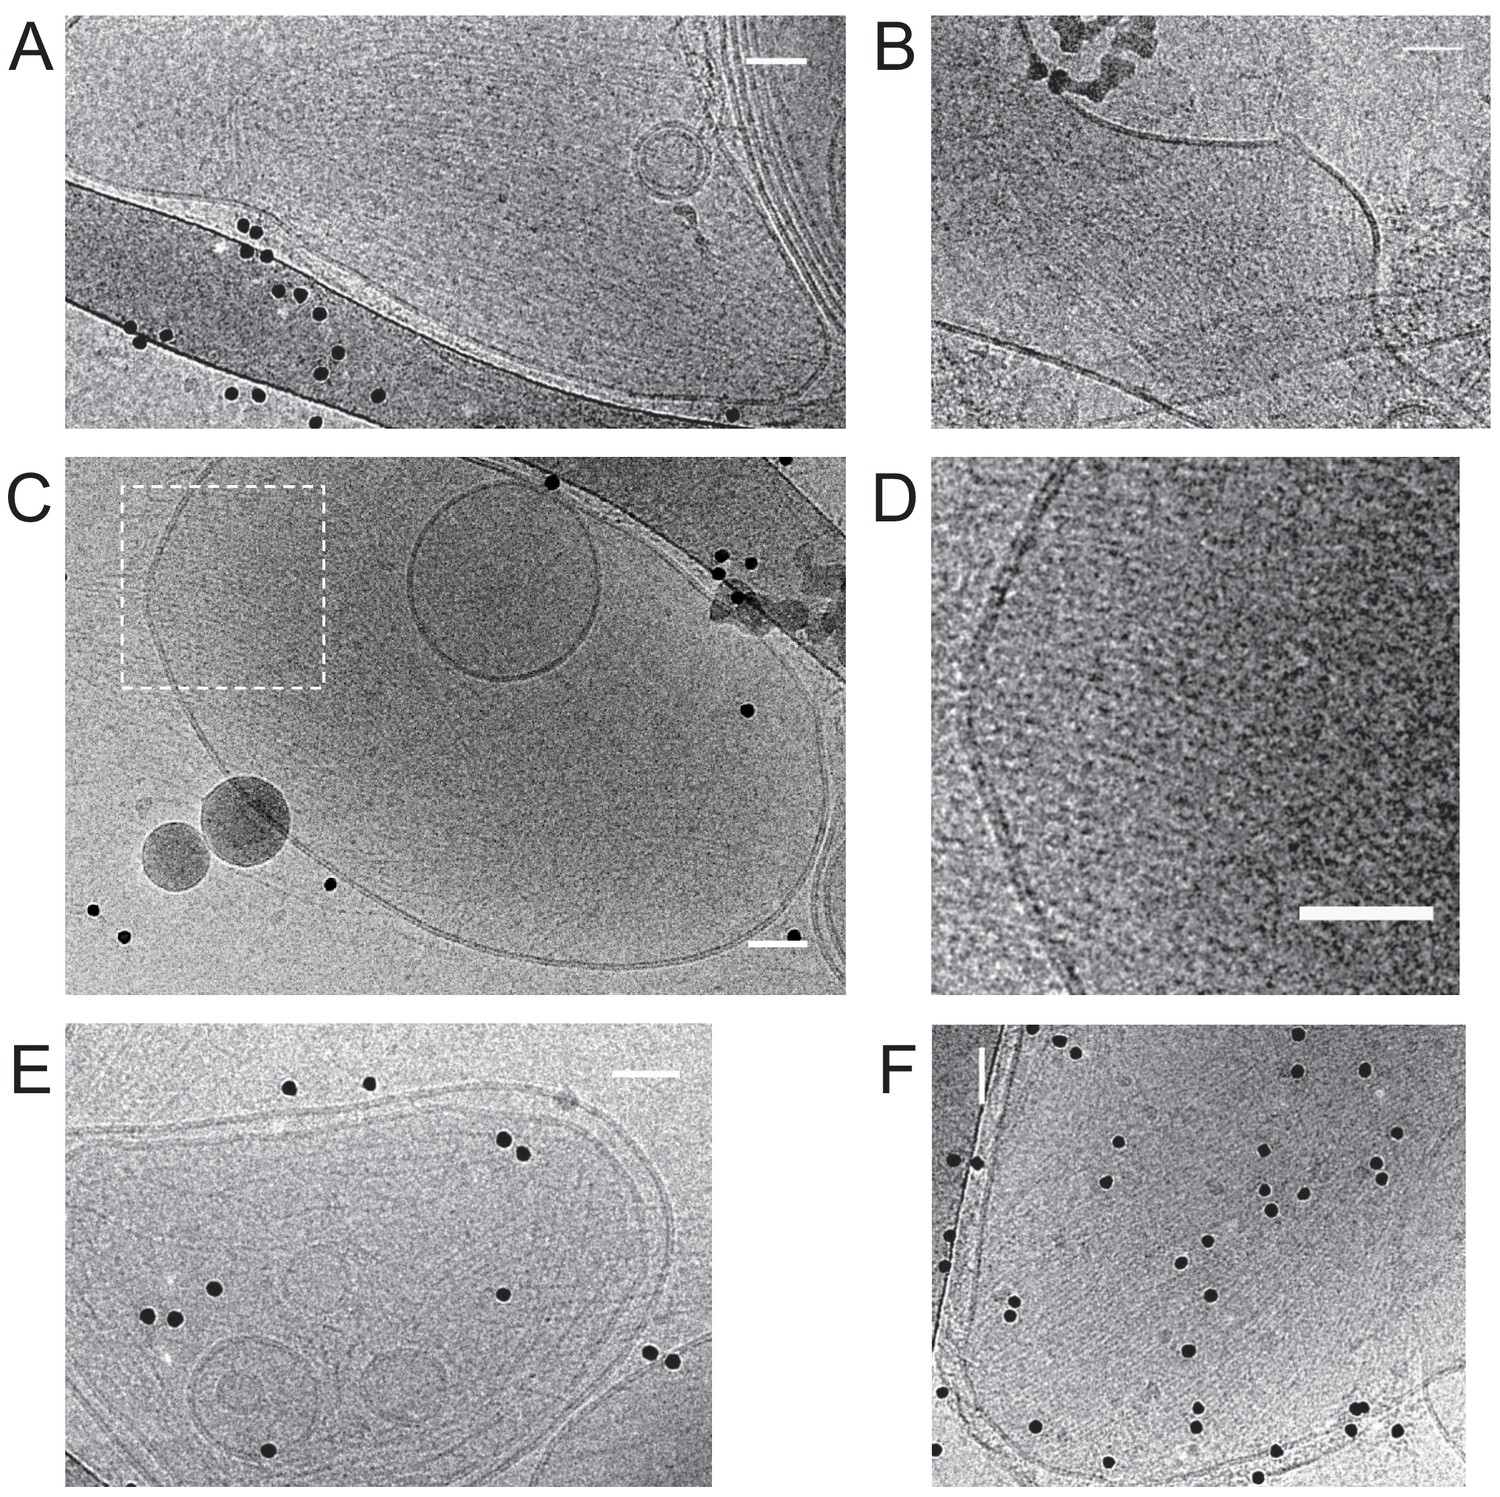
Additional cryoEM data.
Fly septin hexamers form paired and occasionally single filaments on large unilamellar lipid vesicles. Gallery of cryoEM images of septins (160 nM) after a 30 min incubation with large unilamellar vesicles composed of 85 mol-% PC, 10 mol-% PE and 5 mol-% PI(4,5)P2. Images are from different regions/samples, except for panel D, which shows a zoom-in of the boxed region in C. The images show septin filaments (linear structures) and vesicles of different sizes and shapes (circular objects). Most vesicles are covered with parallel sheets of tightly paired filament with narrow spacing (e.g. panel A), but some display rather spaced parallel filaments (e.g. panel E). Black dots are 10 nm diameter gold beads used as fiducials for cryo-tomography. Scale bars: 50 nm.
Figure 4—figure supplement 3
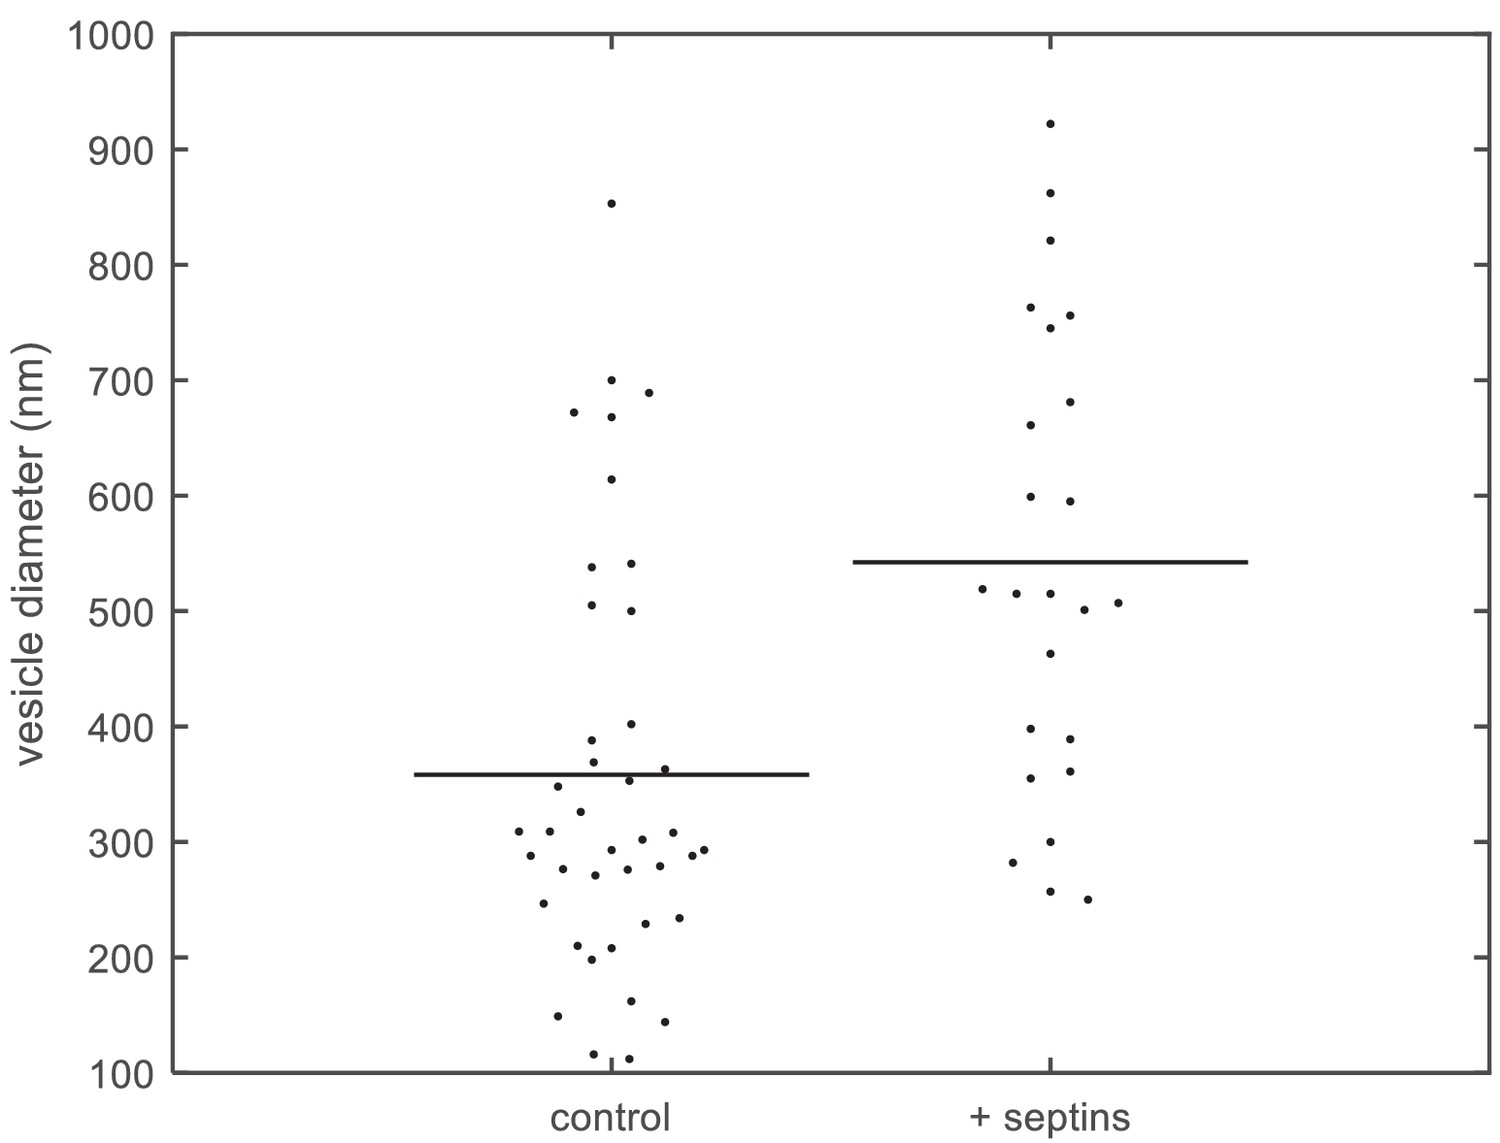
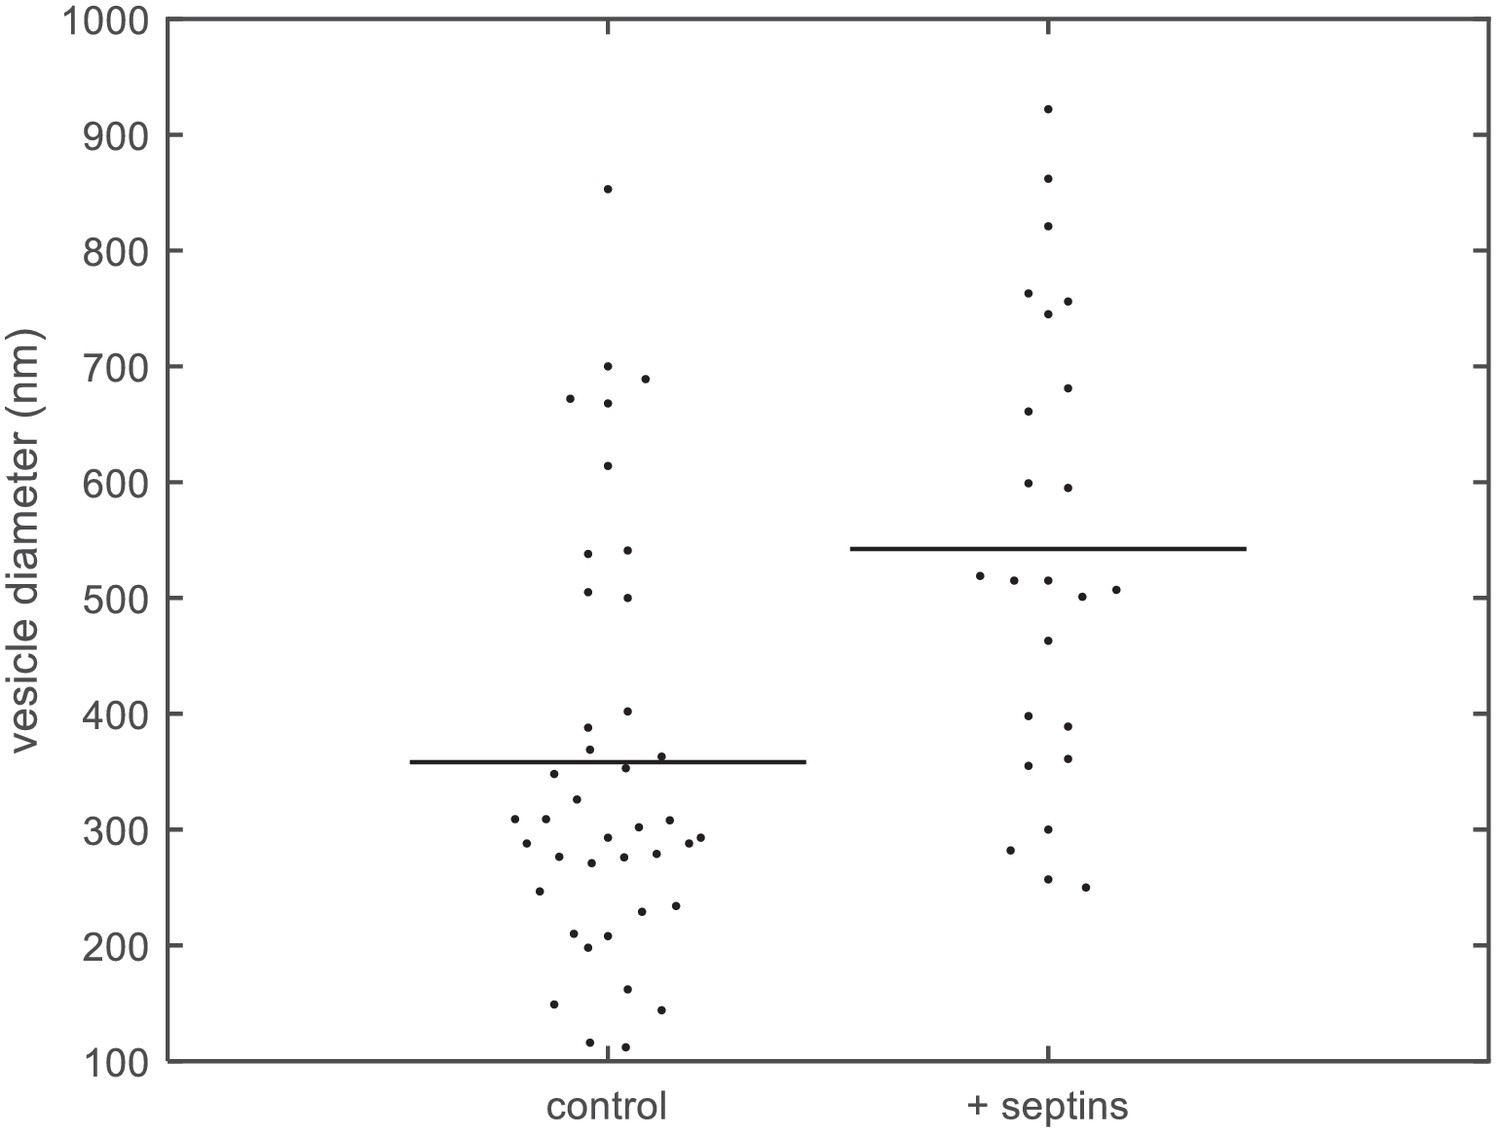
Quantification of vesicle size distributions.
Size distributions of large unilamellar lipid vesicles based on quantification of cryoEM data. Diameters of LUVs (PC 80%, PI(4,5)P2 10%, PS 10%) measured from cryoEM images, without septins (left; N = 40) and with septins (160 nM) (right; N = 24). The horizontal lines represent the averages of the distributions.
Figure 4—video 1
3D tomographic reconstruction of septins bound to lipid vesicles.
3D tomographic reconstruction of fly septin hexamers (160 nM) bound to lipid vesicles composed of 85 mol-% PC, 10 mol-% PE and 5 mol-% PI(4,5)P2. The membrane is in yellow while septin filaments are segmented in blue. Scale bar: 850 nm. The membrane (although only partly visible because a part is perpendicular to the electron beam and therefore invisible because of the missing wedge in tomography) is distorted because of the bound septin filaments.
Figure 5 with 4 supplements
Septins form filaments and ordered arrays on lipid bilayers composed of 80% PC and 20% PS.
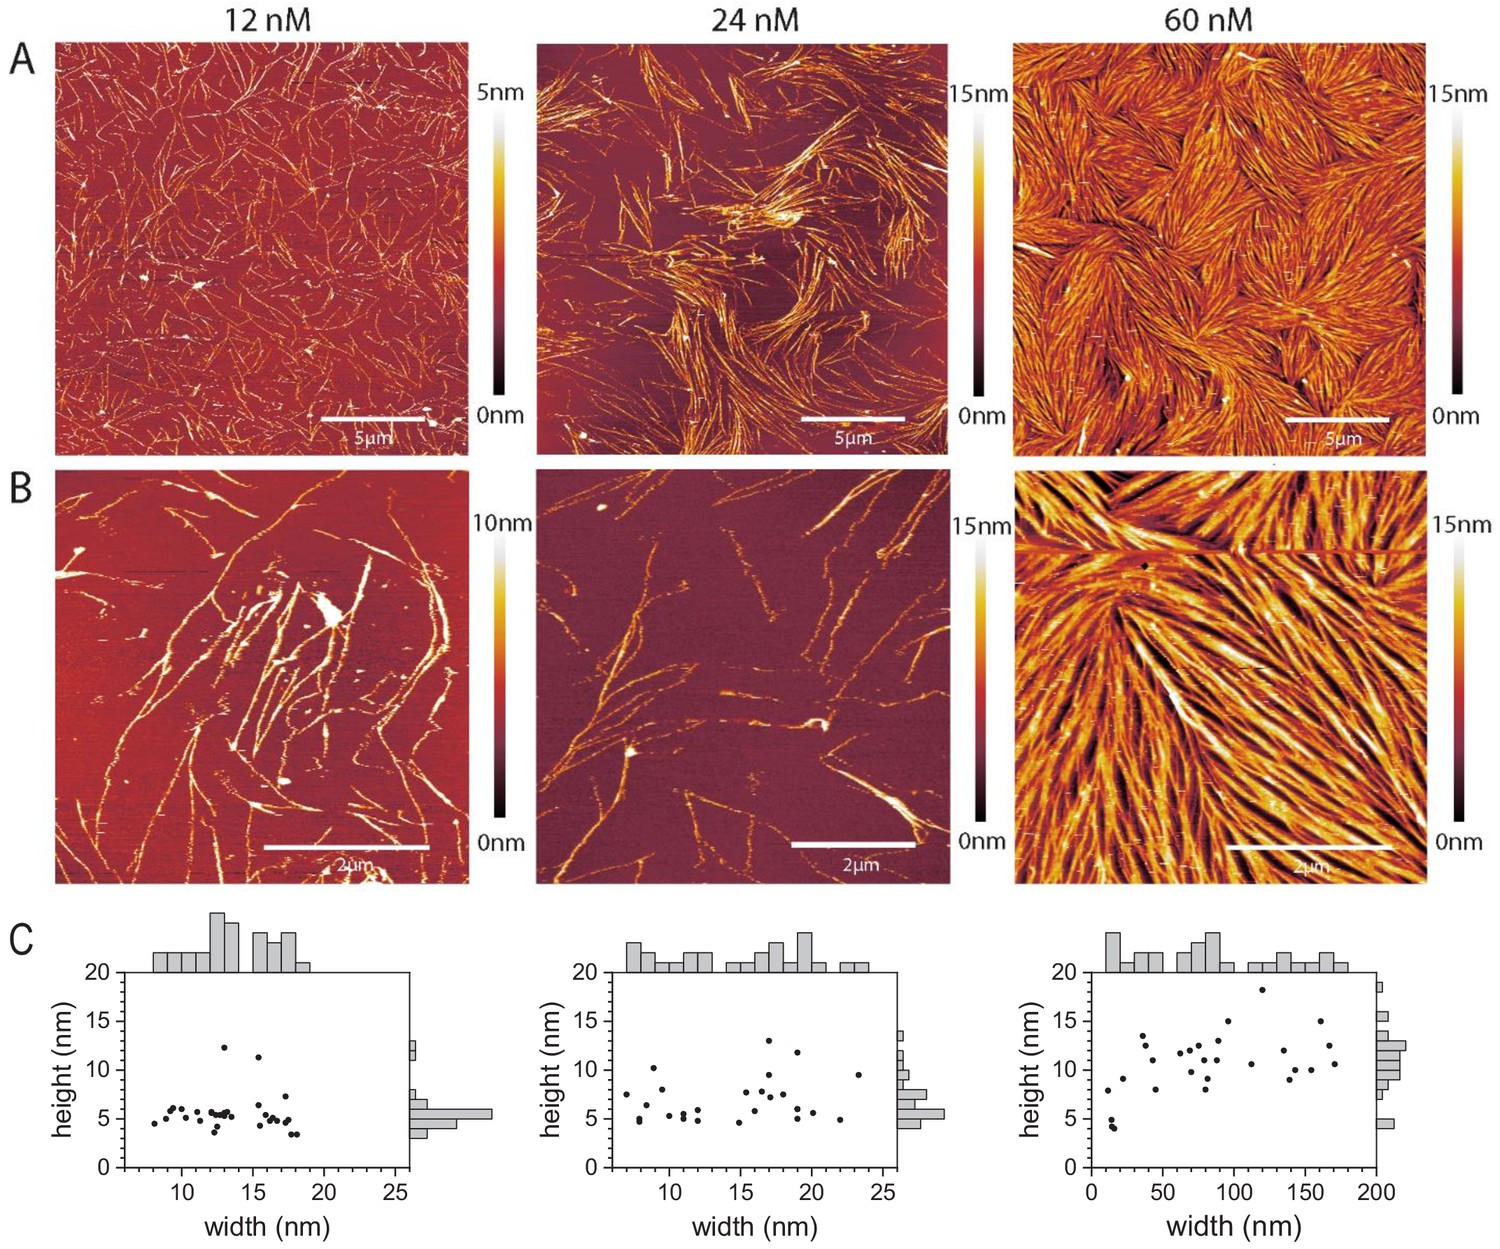
(A–B) AFM topographic images of membrane-bound fly septin structures formed at solution concentrations of 12 nM (left), 24 nM (middle) and 60 nM (right) and observed at a scan size of (A) 20 × 20 µm2. (B) Same samples, imaged at a scan size of 5 × 5 µm2 (left and right) and of 6.7 × 6.7 µm2 (middle). Color bars on the right show the height scale. The samples were fixed with glutaraldehyde (GTA). (C) Scatter plots with marginal histograms of thread widths and heights determined from the corresponding images in (B). N = 31 (left), 26 (middle), and 27 (right) measurements were taken, respectively, across representative sets of well-resolved threads.
Figure 5—figure supplement 1
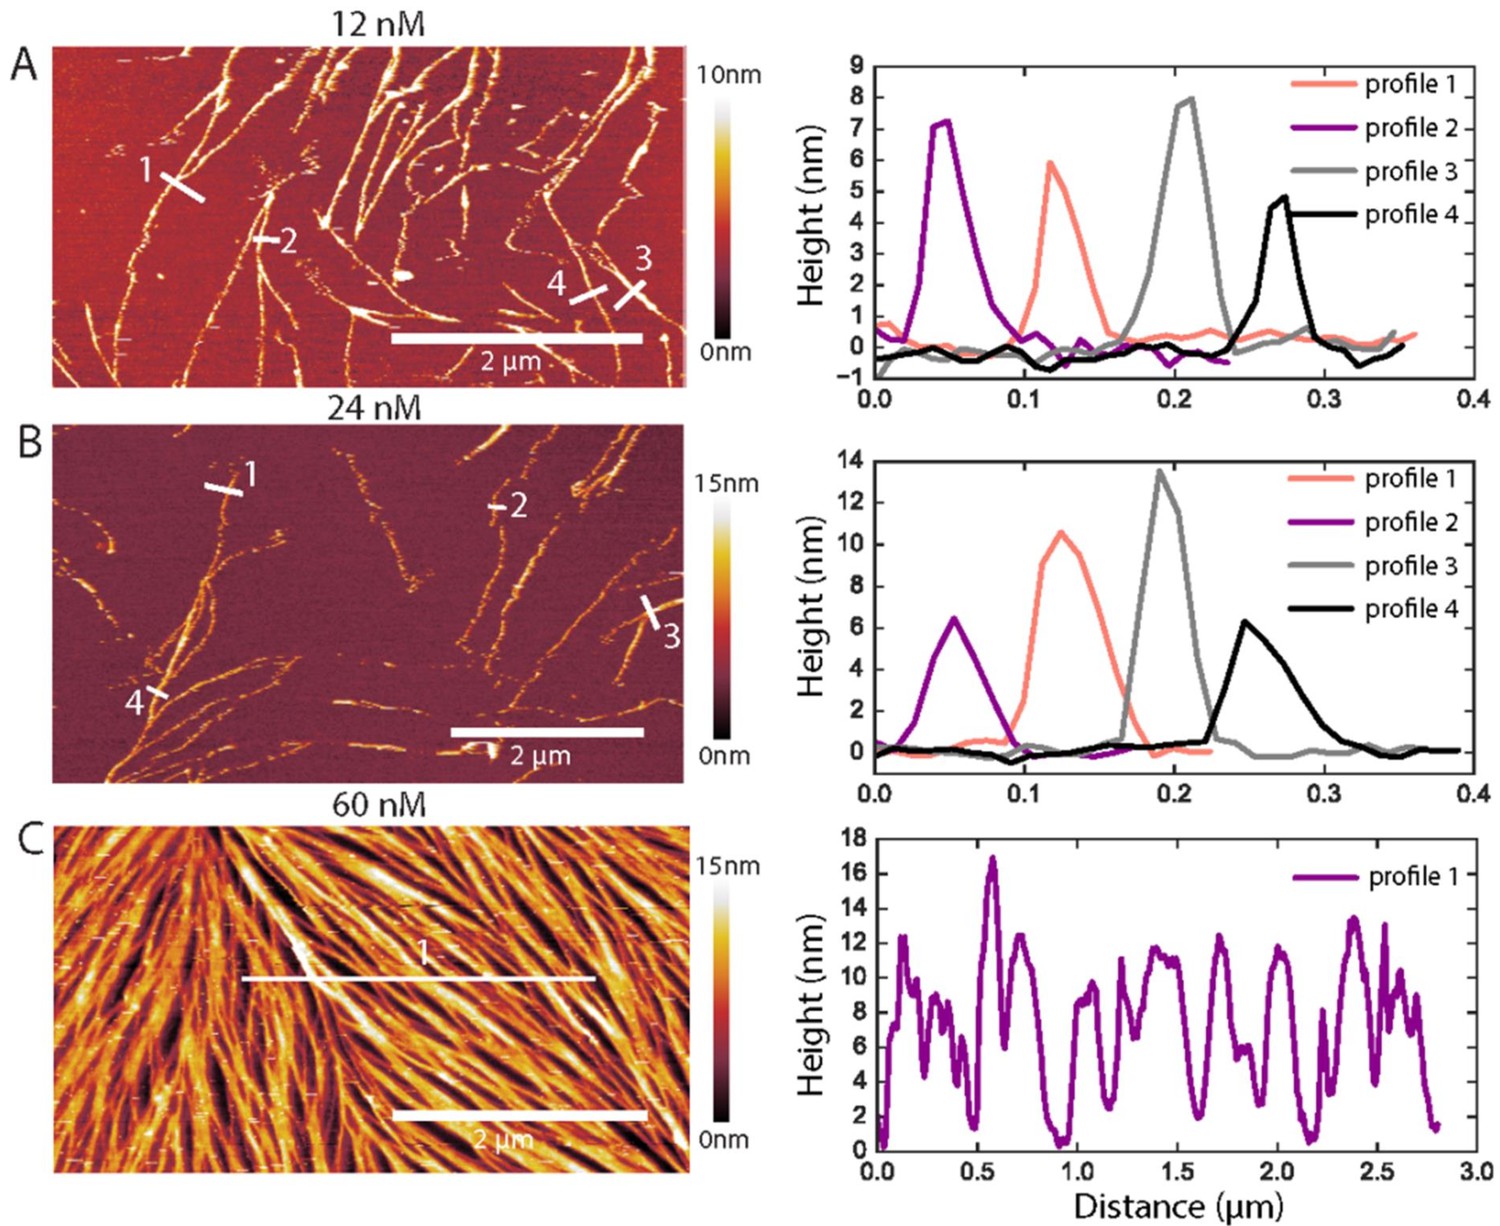
Examples of AFM height profiles across filaments and bundles.
(Left) AFM topographic images of GTA-fixed fly septins at concentrations of 12 nM (A), 24 nM (B), and 60 nM (C). The images were cropped from the images presented in Figure 5B, and color bars on the right show the height scale. (Right) Height profiles were determined along the numbered white lines in each corresponding image on the left. In A and B, they run perpendicularly to the filament/bundle axes, as done for height and width analysis in Figure 5C. In C, a horizontal line across many filaments/bundles was chosen to appreciate their rather dense packing: note that the AFM tip, owing to its finite size, is unable to reach 0 nm height (i.e. the SLB surface) between some tightly spaced filament/bundles.
Figure 5—figure supplement 2
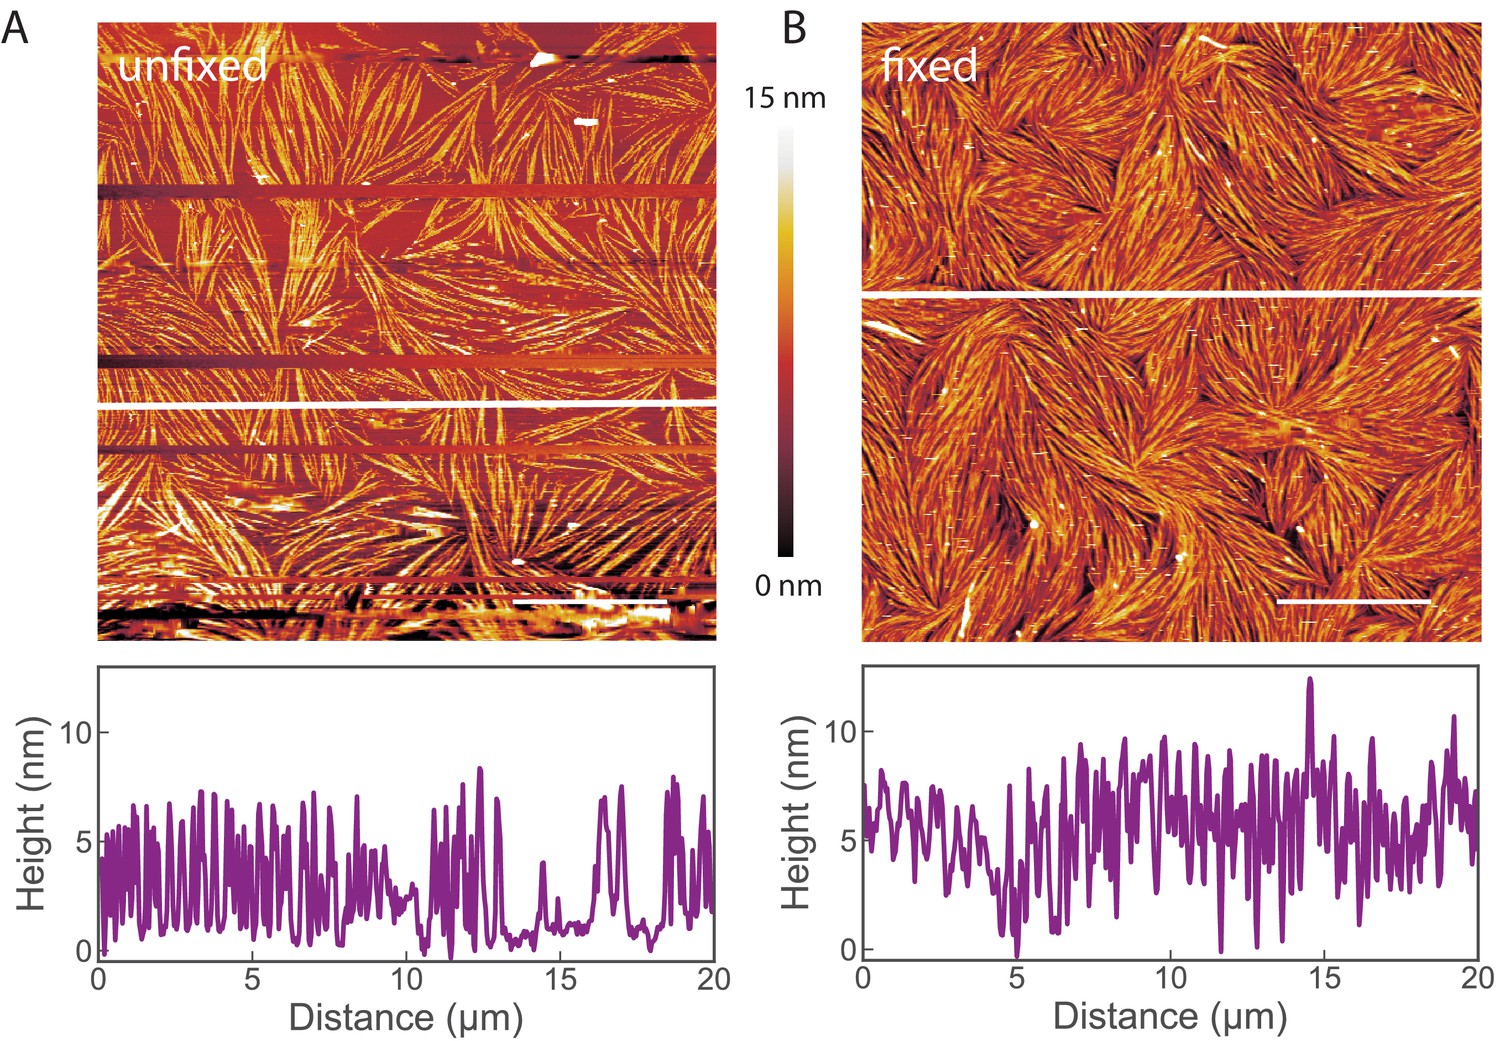
Images of non-fixed septin samples on lipid bilayers.
AFM images show that glutaraldehyde (GTA) fixation does not change the morphology of fly septins adsorbed to supported lipid bilayers. Septin hexamers were incubated at 60 nM on supported lipid bilayers made from 80 mol-% PC and 20 mol-% PS. The bundles and their liquid-crystalline organisation are preserved. (A) Image of unfixed septin filaments. (B) Image of septin filaments fixed by GTA treatment. Scale bar: 5 µm; color bar between images shows the height scale. The graphs below the images present height profiles along the solid white line depicted on each image. Note that the two samples were prepared independently, and that differences in surface density are likely due to slight variations in the sample preparation conditions. Occasional lines appearing empty (in A) correspond to phases when the AFM tip lost contact with the surface, as imaging without GTA required minimal forces to avoid perturbation of the septin organisation.
Figure 5—figure supplement 3
AFM experiment testing the mechanical stability of the septin ultrastructures.
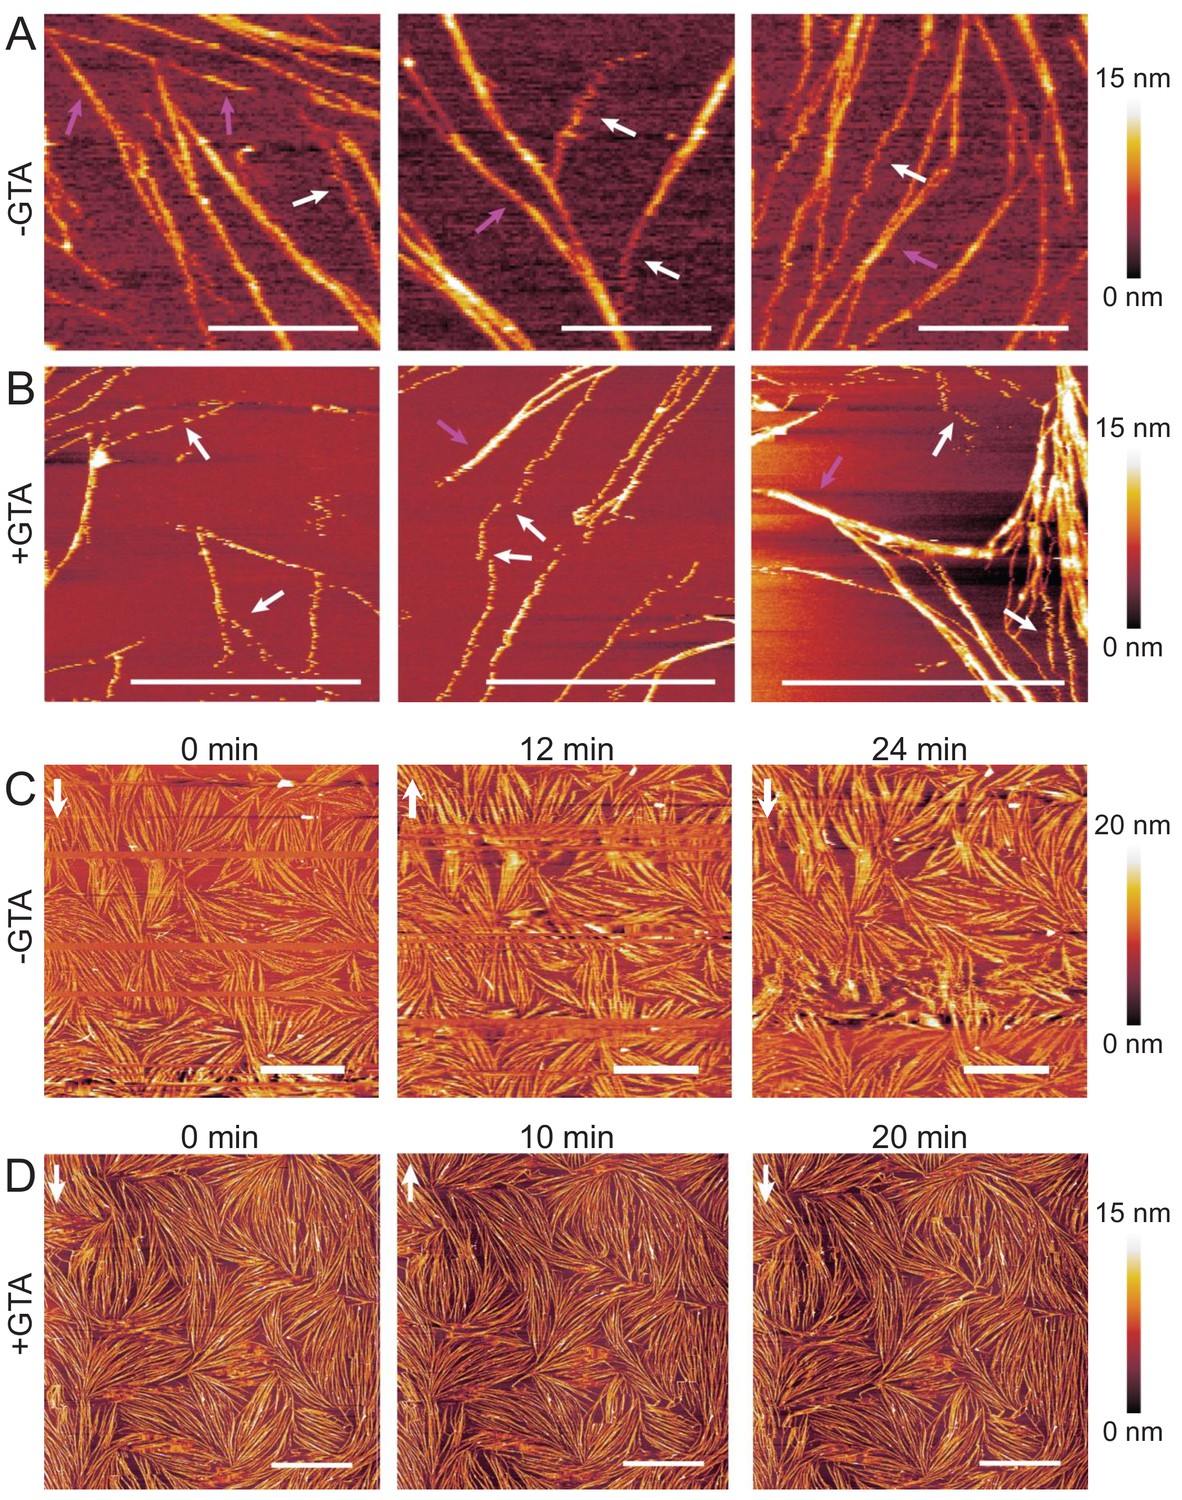
AFM imaging shows that membrane-bound fly septin bundles and dense septin arrays are more mechanically stable than isolated septin filaments (SLB made from 80 mol-% PC and 20 mol-% PS), both in fixed (+GTA) and unfixed (-GTA) conditions. (A) Three representative images taken at different surface areas in unfixed conditions (-GTA). (B) Three representative images taken at different surface areas after fixation with 1% GTA (+GTA). Septin concentration was 60 nM in A, and 24 nM in B. White arrows in A and B show examples of single septin filaments that appear perturbed and mechanically unstable, as indicated by a 'zigzag' shape, most likely due to the AFM tip moving the filament back and forth across the membrane. Pink arrows show (typically thicker) stable filaments or bundles. (C–D) Dense arrays of septins (60 nM; C – unfixed condition, D – after fixation with GTA) are mostly stable over time, as demonstrated by three consecutive scans of the same region (each scan taking 12 min in C, and 10 min in D; t = 0 min indicates the initiation of the first scan; white vertical arrows show the direction of the slow scan axes). Images in C show artefactual variations in contrast, including some scan lines without any contrast: unfixed samples required careful minimisation of the imaging force to minimise filament perturbation by the AFM probe, and fluctuations in the imaging force lead to transient loss of surface tracking. Fixed filaments in D withstood higher imaging forces and thus could be imaged more clearly. Scale bars: 5 µm; color bars on the right show the height scales.
Figure 5—figure supplement 4
AFM experiment showing septin bundles can be displaced along the membrane.
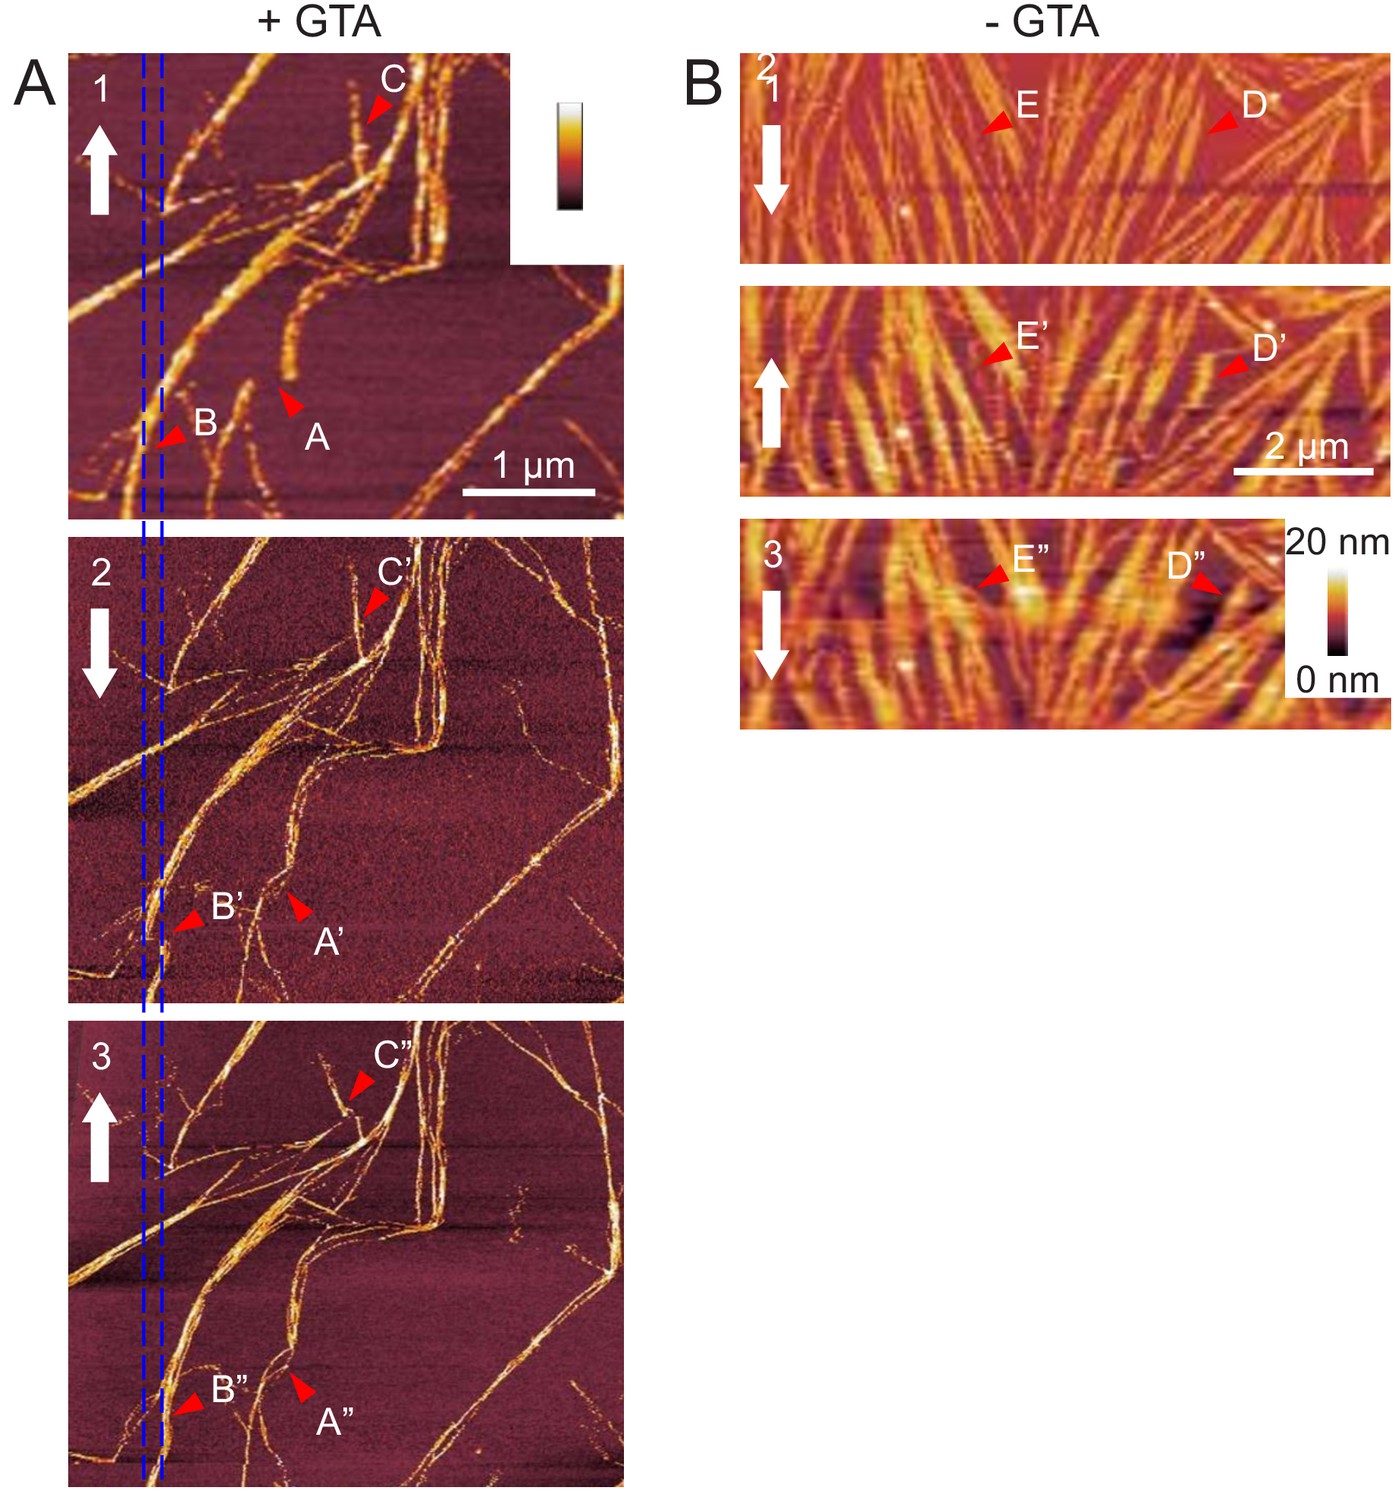
Fly septin filament bundles can be displaced along the membrane. (Left) Three consecutive atomic force micrographs (1, 2, and 3) of the same surface area are shown of GTA-fixed septin filaments (60 nM) on supported lipid bilayers made from 80 mol-% PC and 20 mol-% PS. The alternating direction of the slow-scan axis is indicated (white arrows). Most of the septin filaments remain in place, but some fibrils are occasionally displaced along the horizontal fast-scan axis owing to lateral forces exerted by the AFM tip. Arrow sequence B-B’-B’’ shows such a displacement event leading to a permanent local kink and filament relocation (B’’). The disruption of the filament (B’) in micrograph two is most likely apparent, owing to the line-by-line scanning nature of AFM image acquisition. The spacing between the two blue vertical lines, corresponding to the displacement of the filament bundle in B’, is 170 nm. Arrow sequences A-A’-A’’ and C-C’-C’’ highlight additional examples of displaced fibrils. Images 2 and 3 were stretched/compressed along the vertical (slow scan) axis and skewed along the horizontal (fast scan) axis to correct for drifts during imaging and align these images with image 1. (Right) Equivalent data for unfixed septin filaments (60 nM) on supported lipid bilayers made from 80 mol-% PC and 20 mol-% PS. Note that this region represents a zoom on a small region in Figure 5—figure supplement 3C. Arrow sequences D-D’-D’’ and E-E’-E’’ highlight examples of displaced fibrils, whereas most other filaments remain in place. Larger variations in filament appearance across the images (e.g. filament widening) are due to fluctuations in the surface tracking because the AFM probe was operated at a reduced peak force to minimise filament perturbations.
Figure 6
Native ultrastructure of septin assemblies on lipid bilayers composed of 80% PC and 20% PS.
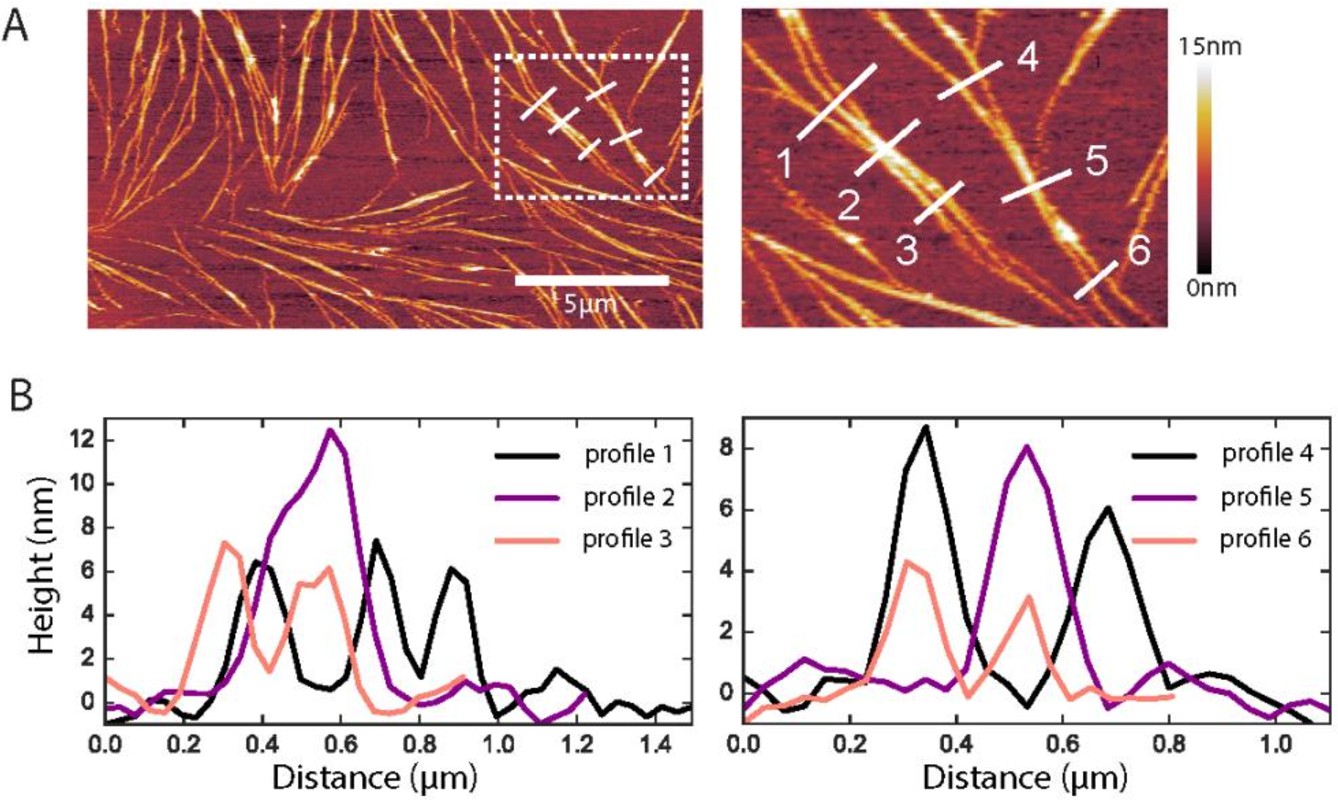
(A) AFM image of non-fixed septins at 60 nM, showing a bilayer region that happens to be sparsely covered with septin filaments. Scale bar for the left panel: 5 µm; right panel shows zoom of the dashed rectangle in the left panel; color bar on the right shows the height scale. (B) Height profiles were determined along the numbered white lines in the images in A.
Figure 7 with 2 supplements

QCM-D measurements of fly septin hexamer adsorption on supported lipid bilayers (SLBs) containing anionic lipids show that septins form thin, rigid films.
Shown are frequency shifts (Δf – blue lines with symbols) and dissipation shifts (ΔD - red solid lines). Arrows on top of the graphs indicate start and duration of sample perfusion; during remaining times, plain buffer (A – vesicle buffer; B and C – septin polymerization buffer) was flown over the sensor surface. (A) Small unilamellar vesicles (SUVs at 50 μg/mL; 20% DOPS, 80% DOPC) were exposed to a plain silica surface to form a SLB. (B–C) Hexamers of wild type septin (B) and the ΔCC septin truncation mutant (C) (60 nM each), were exposed to 80% PC/20% PS SLBs (solid line with circle symbols). (B) also shows control frequency data for exposure of wild type septin (100 nM) to pure DOPC SLBs (dotted line with diamond symbols).
Figure 7—figure supplement 1
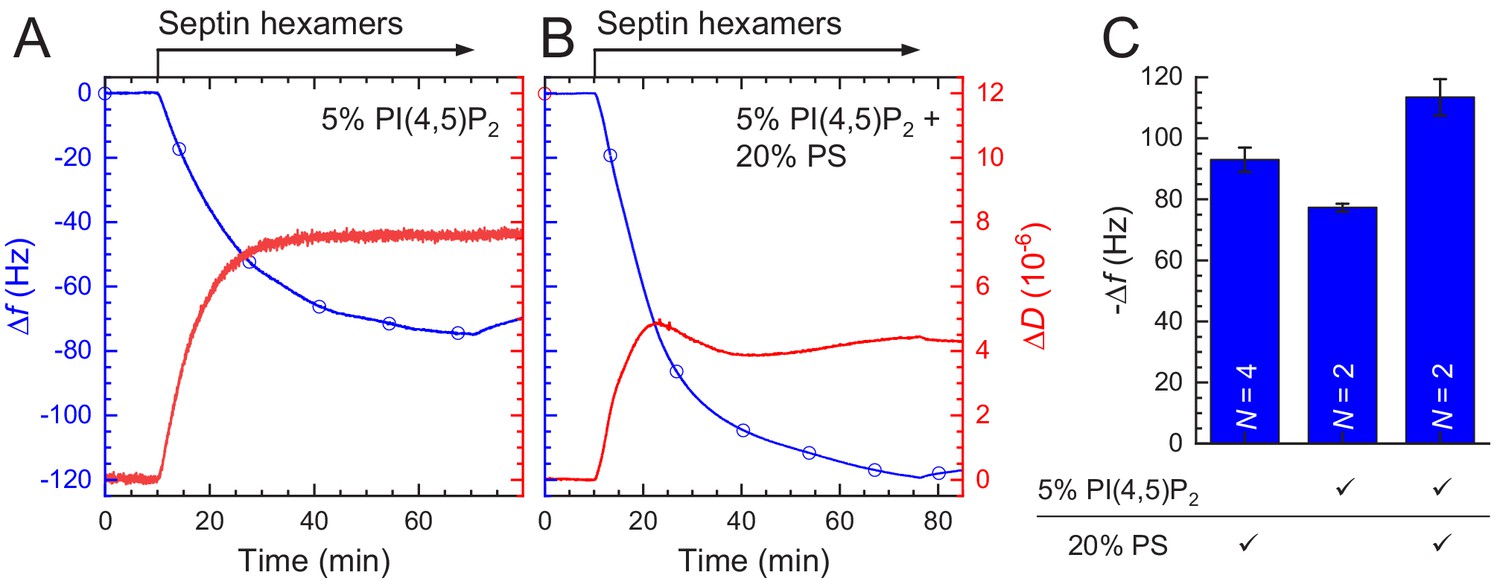
Lipid composition dependence of septin adsorption.
Adsorption kinetics for fly septin hexamers (60 nM) on PC bilayers containing different anionic lipids (see legend). (A–B) Representative QCM-D data for the binding of wild type septin hexamers (60 nM) to SLBs containing 5% PI(4,5)P2 (A) or 20% DOPS and 5% PI(4,5)P2 (B). Shown are frequency shifts (Δf – blue lines with symbols) and dissipation shifts (ΔD - red solid lines). Arrows on top of the graphs indicate start and duration of sample perfusion; during remaining times, plain septin polymerization buffer was flown over the sensor surface. (C) The level of adsorption as a function of SLB composition is expressed in terms of -Δf (measured after an incubation time of 1 hr), which is proportional to the areal mass density of septins hexamers including hydrodynamically coupled solvent. Error bars represent standard deviations based on N experiments per data point (see legend).
Figure 7—figure supplement 2
Coverage-dependent ΔD/-Δf ratios for fly septins.
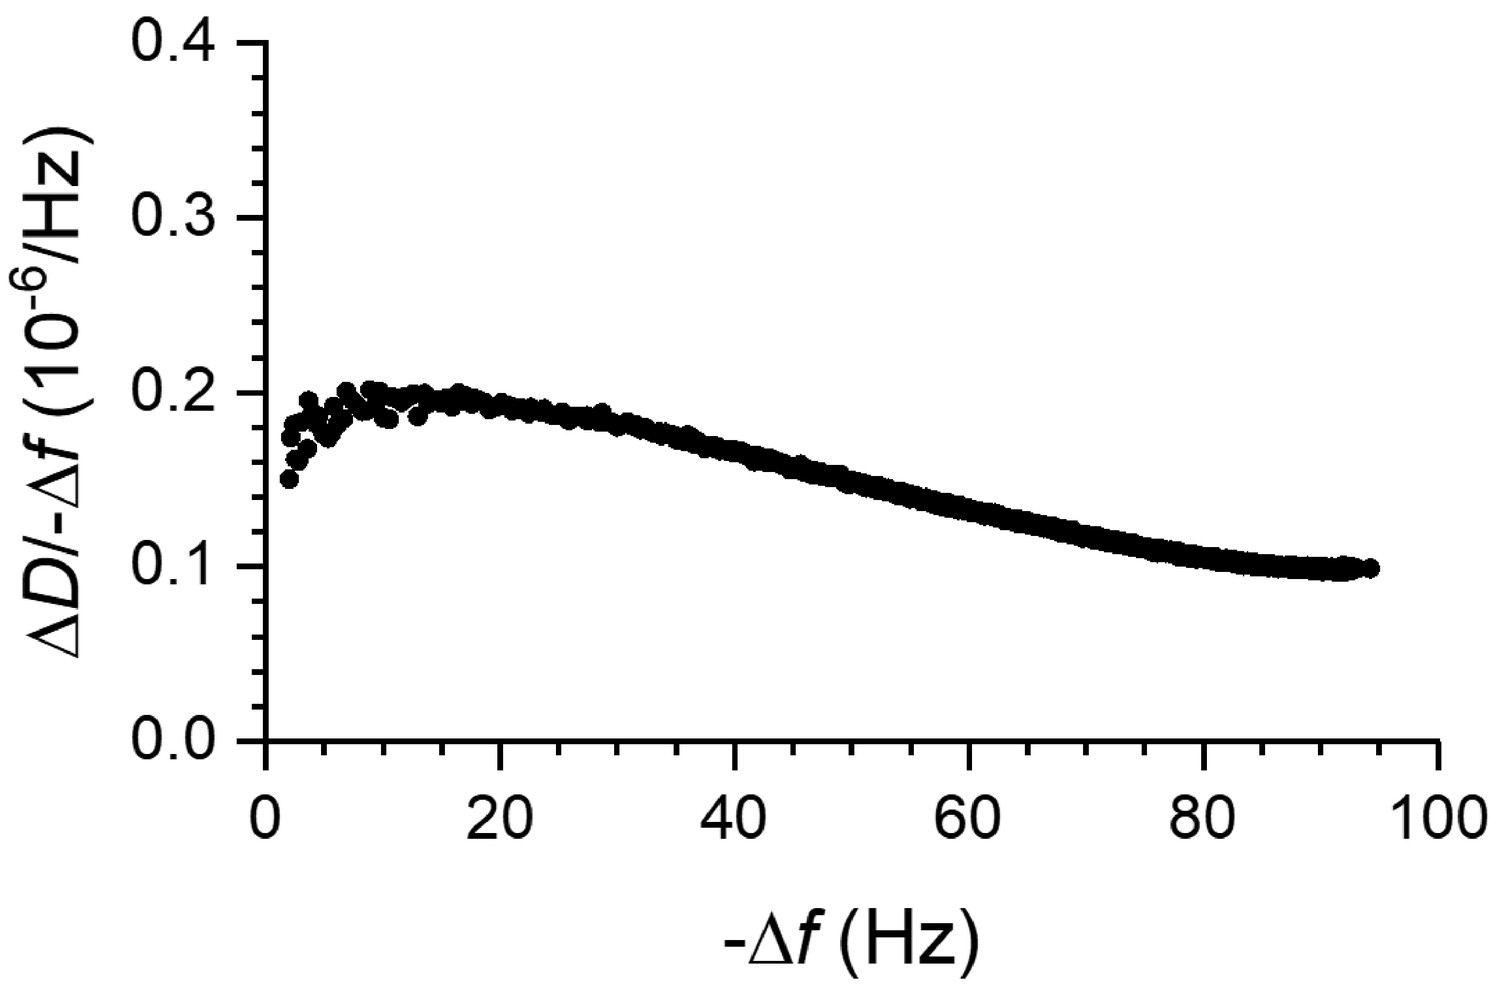
Fly septin filament and bundles are sensed as soft relative to membrane-bound globular proteins by QCM-D. The plot shows ΔD/-Δf ratios (a measure of elastic compliance, or softness) as a function of -Δf (a measure of coverage) for septin hexamers incubated at 60 nM on an SLB made from 80% DOPC and 20% DOPS (data taken from Figure 7B). ΔD/-Δf ratios are relatively high, consistent with flexible hinges linking the protein to the membrane and/or inter-connecting protein domains.
Figure 8 with 1 supplement
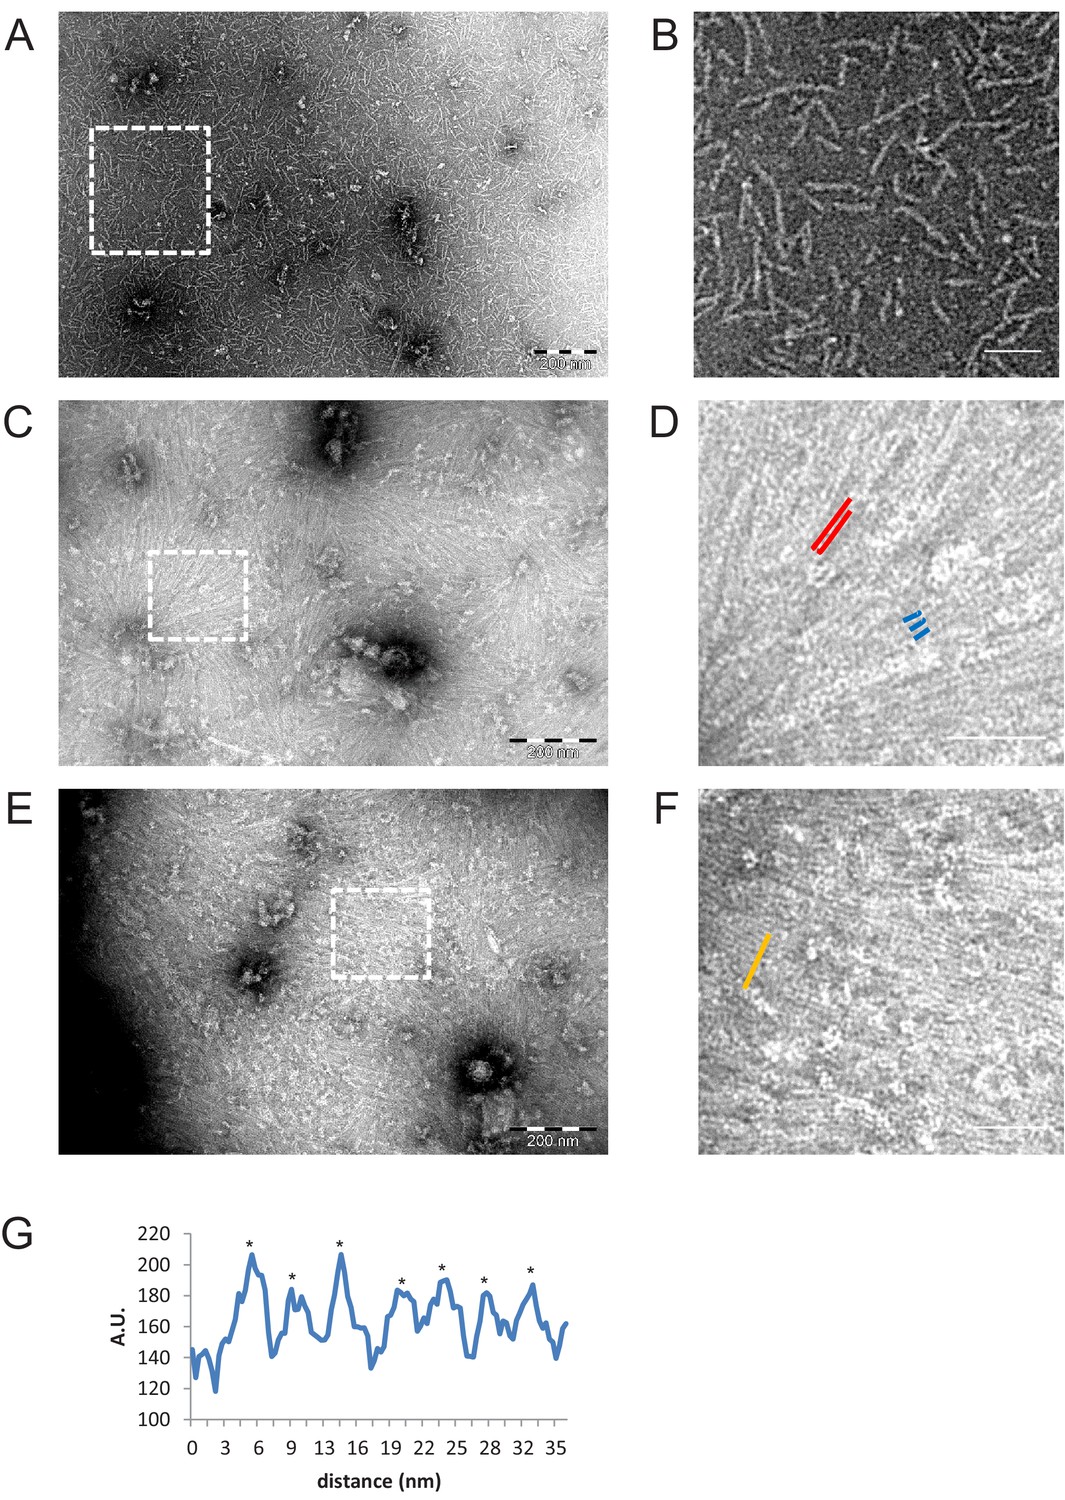
Negative stain EM images of C-terminally truncated fly ΔCC-septins.
(A) ΔCC-septin hexamers in septin polymerization buffer. (B) Zoom-in of the boxed region in (A) shows that ΔCC-septin hexamers (84 nM) predominantly form monomers and short oligomers of hexamers with a length of ~24–60 nm. (C) ΔCC-septin hexamers (210 nM) on a negatively charged lipid monolayer composed of 80% DOPC, 10% PS, and 10% PI(4,5)P2. (D) Zoom-in of the boxed region in (C) shows sheets of closely spaced, long filaments (red lines) and occasionally three filaments lined up side by side (trimer highlighted in blue). (E) Another example of the ΔCC-septin hexamers (210 nM) on a lipid monolayer composed of 80% PC, 10% PS, and 10% PIP(4,5)P2. (F) Zoom-in of the boxed region in (E) again shows sheets of closely spaced, long, unpaired filaments. (G) Line scan (from area highlighted in panel F by an orange line) reveals a center-to-center (asterisks) spacing of ~4.5 nm. Scale bars are 200 nm (A,C,E) and 50 nm (B,D,F).
Figure 8—figure supplement 1
Lengths of ΔCC-septin hexamer filaments formed in low-salt septin polymerization buffer.
Length of filaments formed by C-terminally truncated (ΔCC) fly septin hexamers (84 nM) formed in septin polymerization buffer, that is, in the absence of a lipid mono-/bilayer. The length varies continuously from 20 to 80 nm, suggesting that subunits can be added individually to the ends of rods.
Figure 9

Model of membrane-templated septin self-assembly.
(A) Diagram summarizing the regimes of fly septin self-assembly observed in the solution phase (top) and on anionic lipid membranes (bottom). (B–C) Left column: top views of the membrane proximal septin layer. Right column: side views of all septin layers. The coiled-coils are depicted to scale using available crystal-structures of coiled-coils (see Materials and methods) in light-gray for coiled coils emanating from the bottom septin layer and dark-gray for coiled-coils from the top layer. (B) Full-length septin hexamers form meshworks of paired filaments on the membrane, which are bridged by hexamers and dimers thereof and form bundles with filaments joining or emerging at a shallow angle. A second layer of septin filaments is recruited by coiled-coil interactions oriented vertically (scenario 1) or in-plane (scenario 2). For simplicity, scenario two is depicted with coiled coils oriented perpendicular to the filament axis though they may in reality adopt a range of orientations. (C) ΔCC-septin hexamers lacking coiled coils form a monolayer of filaments interacting by excluded volume interactions, perhaps augmented by G-domain interactions. Dimensions indicated in the schematic are based on the known size of septin subunits from EM and calculated lengths of the coiled-coil regions, and are consistent with the measured filament widths and spacings in-plane (from EM images) and with the measured height of the septin films (from AFM and QCM-D).
Author response image 1
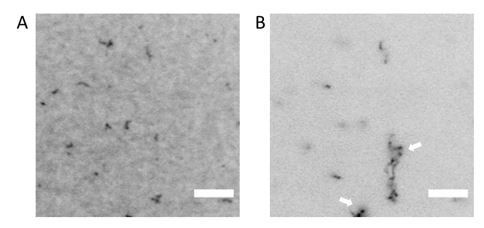
TIRF imaging shows co-existence of bundles with membrane-bound septins when fly septin hexamers (100% GFP-tagged) are incubated at a concentration of 300 nM with a supported lipid bilayer containing 80% DOPC and 20% DOPS.
(A) Image taken in TIRF mode showing membrane-bound septins (laser angle ~80°). (B) Off-TIRF-angle image (laser angle ~3°) showing bundle-like structures in the solution above the bilayer. Arrows point out examples of bundles. Images are contrast-inverted.
Author response image 2
TIRF microscopy images of GFP-tagged fly septin hexamers (10% labelled hexamers, 90% dark hexamers) on a supported lipid bilayer containing 80% DOPC and 20% DOPS for a range of septin hexamer concentrations as labelled.
Note that the image contrast is inverted. Scale bars are 5μm.
Author response image 3
TIRF microscopy images of GFP-tagged fly septin hexamers (100% labelled) on a supported lipid bilayer containing 80% DOPC and 20% DOPS for a range of septin hexamer concentrations as labelled.
Note that image contrast is inverted. Scale bars are 5μm.
Tables
Table 1
Overview of the analysis technique and assay conditions for each figure, summarizing the septin concentration, anionic lipid content of the membrane, and type of membrane used (lipid monolayers in case of negative stain EM imaging, supported lipid bilayers (SLB) in case of TIRF, AFM, and QCM-D, and large unilamellar vesicles (LUV) in case of cryoEM imaging).
| Figure | Assay | Technique | Septin concentration [nM] | Anionic lipid content |
|---|---|---|---|---|
| Figure 1 | WT-fly septin in solution | TIRF and STEM | 100, 200, 500 | No membrane present |
| Suppl 1 | Fly septin in solution (WT and ΔCC mutant*) | TEM | 65 nM (wild type) 84 nM (ΔCC mutant) | No membrane present |
| Suppl 2 | WT-fly septin in solution | STEM | 500 | No membrane present |
| Figure 2 | WT-fly septin on SLB | TIRF | 1000 | 1) 1–8 mole% PI(4,5)P2 2) 5, 10, 20% mole% PS |
| Suppl 1 | WT-fly septin on SLB | TIRF | 10, 100, 150, 200, 300, 500 | 5, 10, 20% mole% PS |
| Suppl 2 | WT-fly septin on SLB | FRAP | 500 | 20% PS |
| Figure 3 | WT-fly septin on monolayer | TEM | 65 | 1) 20% PS 2) 5% PI(4,5)P2, 3) 20% PS and 5% PI(4,5)P2 |
| Suppl 1 | WT-fly septin on monolayer | TEM | 65 | Same as Figure 3 |
| Suppl 2 | Mammalian septin on monolayer | TEM | 70 | 20% PS and 5% PI(4,5)P2 |
| Figure 4 | WT-fly septin on LUVs | cryoEM | 160 | 5% PI(4,5)P2 |
| Suppl 1 | WR-fly septin on LUVs | cryoEM | 160 | 5% PI(4,5)P2 |
| Suppl 2 | WT-fly septin on LUVs | cryoEM | 160 | 5% PI(4,5)P2 |
| Figure 4—video 1 | WT-fly septin on LUVs | cryoEM | 160 | 5% PI(4,5)P2 |
| Figure 5 | WT-fly septin on SLB | AFM | 12, 24, 60 | 20% PS |
| Suppl 1 | WT-fly septin on SLB | AFM | 12, 24, 60 | 20% PS |
| Suppl 2 | WT-fly septin on SLB | AFM | 60 | 20% PS |
| Suppl 3 | WT-fly septin on SLB | AFM | 24,60 | 20% PS |
| Suppl 4 | WT-fly septin on SLB | AFM | 60 | 20% PS |
| Figure 6 | WT-fly septin on SLB | AFM | 60 | 20% PS |
| Figure 7 | Fly septin on SLB (WT and ΔCC) | QCM-D | 60 | 20% PS |
| Suppl 1 | WT-fly septin on SLB | QCM-D | 60 | 1) 20% PS 2) 5% PI(4,5)P2, 3) 20% PS and 5% PI(4,5)P2 |
| Suppl 2 | WT-fly septin on SLB | QCM-D | 60 | 20% PS |
| Figure 8 | ΔCC fly septin in solution and on monolayer* | TEM | 84, 210 | 10% PS + 10% PIP(4,5)P2 |
| Suppl 1 | ΔCC fly septin in solution | TEM | 84 | No membrane present |
-
*We matched the weight concentrations for ΔCC-septin hexamers and full-length septin hexamers in EM experiments in high-salt solutions (0.02 mg/mL). Due to the different molecular weights of these hexamers, this corresponds to slightly different molar concentrations (i.e. 84 nM for ΔCC-septins and 65 nM for full-length septins).
Key resources table
| Reagent type (species) or resource | Designation | Source or reference | Identifiers | Additional information |
|---|---|---|---|---|
| Strain, strain background (Escherichia coli) | BL21(DE3) | Agilent Technologies | Agilent Technologies: 200131 | |
| Recombinant DNA reagent | pnEA-vH encoding His6-DSep1 (plasmid) | PMID:24633326 | ||
| Recombinant DNA reagent | pnCS encoding DSep2 and Pnut-StrepII (plasmid) | PMID:24633326 | ||
| Recombinant DNA reagent | pnCS encoding mEGFP-DSep2 and Pnut-StrepII (plasmid) | PMID:27473911 | ||
| Recombinant DNA reagent | pnEA-vH encoding His6-DSep1ΔC56 (plasmid) | this paper | See Materials and methods section, Septin purification | |
| Recombinant DNA reagent | pnCS encoding DSep2ΔC111 and PnutΔC123-StrepII (plasmid) | this paper | See Materials and methods section, Septin purification | |
| Recombinant DNA reagent | pnEA-vH encoding mouse SEPT2 (plasmid) | PMID:24633326 | ||
| Recombinant DNA reagent | pnCS encoding human SEPT6 and human SEPT7-StrepII (plasmid) | PMID:24633326 | ||
| Peptide, recombinant protein | Drosophila melanogaster septin hexamers composed of His6-DSep1-, DSep2, Pnut-StrepII | PMID:24633326 | ||
| Peptide, recombinant protein | Coiled-coil truncation mutant of Drosophila melanogaster septin hexamers composed of His6-DSep1ΔC56, DSep2ΔC111and PnutΔC123-StrepII | this paper | See Materials and methods, Section Septin purification | |
| Peptide, recombinant protein | Drosophila melanogaster septin hexamers composed of His6-DSep1, mEGFP-DSep2, and Pnut-StrepII | PMID:27473911 | ||
| Peptide, recombinant protein | Mammalian septin hexamers composed of mouse His6-SEPT2, human SEPT6, and human SEPT7-StrepII | PMID:24633326 | ||
| Peptide, recombinant protein | Budding yeast septin octamers composed of Cdc3, Cdc10, Cdc11, and His6-Cdc12 | PMID:18550837 | ||
| Commercial assay, kit | HisTrap FF crude column | GE Healthcare | 17-5286-01 | |
| Commercial assay, kit | StrepTrap HP | GE Healthcare | 28-9075-46 | |
| Commercial assay, kit | 4–15% gradient Mini-PROTEAN TGX Precast Protein Gels | Bio-Rad | #4561084 | |
| Commercial assay, kit | Precision Plus Protein Kaleidoscope protein standard | Bio-Rad | 1610375 | |
| Biological Sample (genus Tobamovirus) | Tobacco mosaic virus (TMV) rods | Godon et al., 2017 PMID:28017791 | Gift from Dr. J.L. Pellequer (Institut de Biologie Structurale, Grenoble, France) |
Additional files
Download links
A two-part list of links to download the article, or parts of the article, in various formats.
Downloads (link to download the article as PDF)
Open citations (links to open the citations from this article in various online reference manager services)
Cite this article (links to download the citations from this article in formats compatible with various reference manager tools)
Membrane binding controls ordered self-assembly of animal septins
eLife 10:e63349.
https://doi.org/10.7554/eLife.63349


