COVID-19 CG enables SARS-CoV-2 mutation and lineage tracking by locations and dates of interest
- Stanley Center for Psychiatric Research, Broad Institute of MIT and Harvard, United States
- Independent web designer, United States
- Department of Zoology & Biodiversity Research Centre, the University of British Columbia, Canada
- Fusion Genomics Corporation, Canada
Figures
Figure 1 with 2 supplements
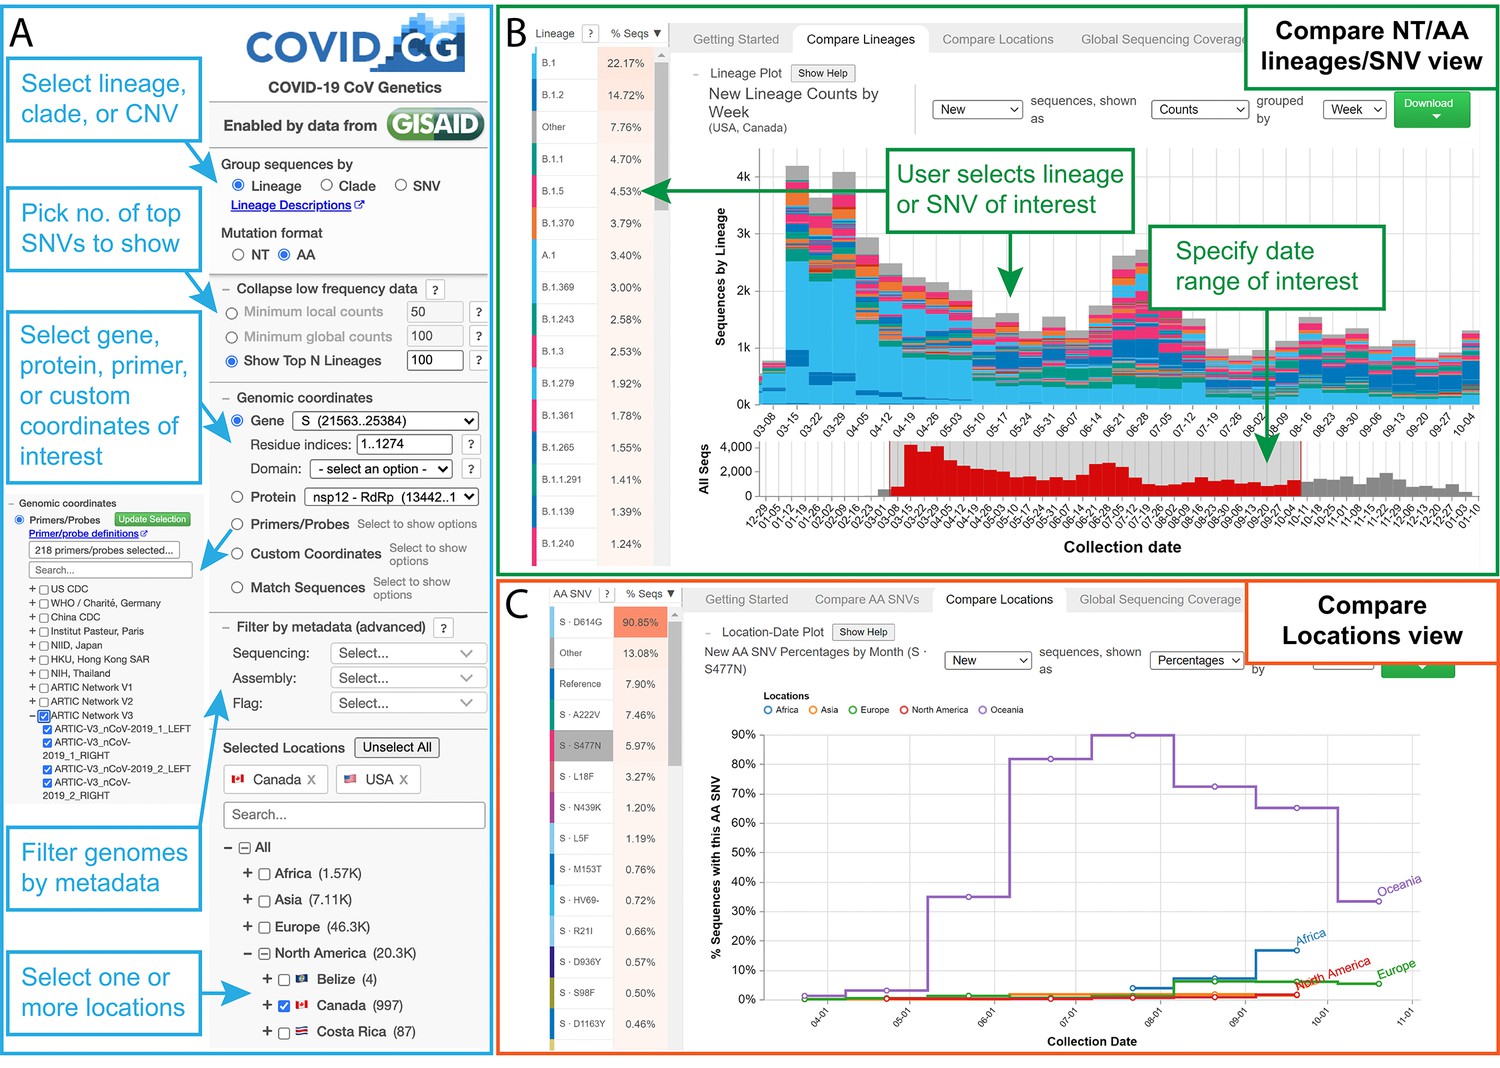
The COVID-19 CG (https://covidcg.org) browser interface.
(A) Users can select SARS-CoV-2 genomes according to lineage, clade, or single-nucleotide variation (SNV), virus gene or protein, and location(s). Genomes can also be filtered by metadata and specifically analyzed at genomic coordinates of interest, such as the target sites of 665 commonly used diagnostic primers and probes. (B) In the ‘Compare lineages/clades/SNVs’ tab, users can visualize SARS-CoV-2 lineages, clades, or SNVs by location, define their date range of interest, and see the corresponding SNVs at the nucleotide or amino acid level. Lineage/clades/SNVs can be sorted by frequency and name/position. (C) In the ‘Compare locations’ tab, users can compare the frequencies of specific lineages, clades, or SNVs in multiple locations over time.
Figure 1—figure supplement 1
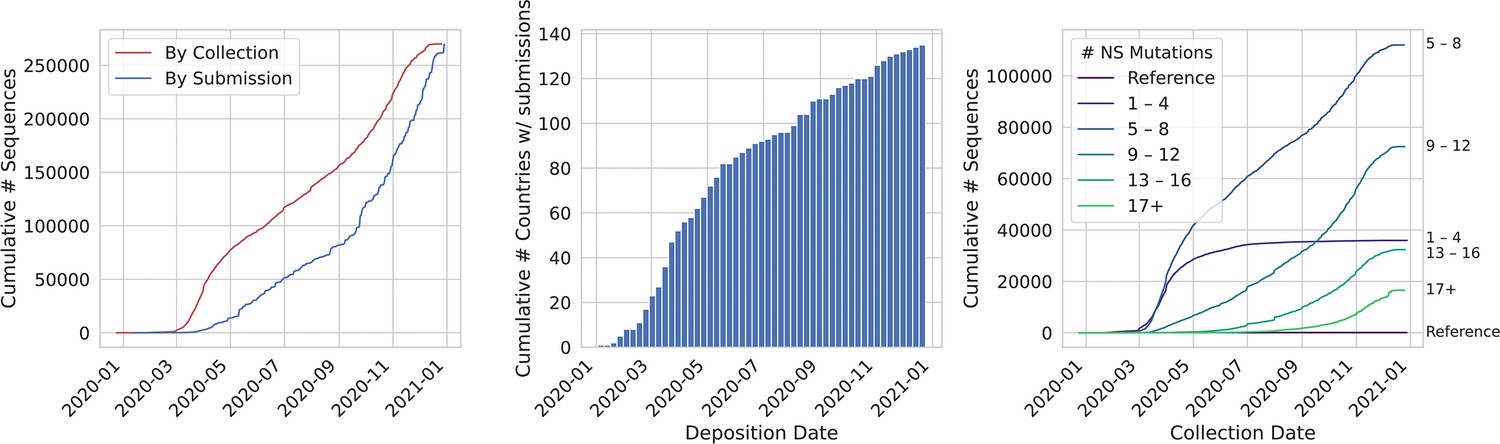
The number of global SARS-CoV-2 genome sequences and mutations is accumulating.
Data shown as of January 2, 2021. (A) Sequence deposition in GISAID continues at a steady pace, albeit there is a lag between collection (red line) and submission date (blue line). The rate of sequence submission has grown to ~50,000,000 genomes per month. (B) One hundred and thirty-five countries have deposited SARS-CoV-2 genomes in GISAID. (C) The number of SARS-CoV-2 variants with more than four nonsynonymous (NS) mutations continues to increase.
Figure 1—figure supplement 2

COVID-19 CG computational workflow.
(1) Sequences and metadata are automatically downloaded and ‘ingested’ on a daily basis. Data for https://covidcg.org is downloaded from a custom GISAID endpoint, but can be configured for any data provider, for example, GenBank (see Methods for details). (2) Based on best practices, we filter out sequences on NextStrain’s exclusion list, non-human SARS-CoV-2 genomes, <29,700,700 nt, or with >5% ambiguous base calls (van Dorp et al., 2020b). (3) Single-nucleotide variations (SNVs) at the nucleotide and amino acid level are determined by aligning (via bowtie2) each sequence to the WIV04 reference, a high quality December 2019 genome recommended by GISAID; NextStrain uses the 100% identical Wuhan-Hu-1 (Langmead et al., 2009). Importantly, spurious SNVs and probable sequencing errors are filtered out prior to downstream analysis. (4) Viral lineages (defined by the pangolin tool) and clades are provided by GISAID. In accordance with pangolin, SNVs present in >90% of sequences within each lineage are assigned as lineage-defining SNVs. (5) The curated data and metadata, SNVs, and lineage-assigned SNVs are associated with their respective sequence identifier and compiled into a compact data set. (6) These data are uploaded onto the COVID-19 CG web application. (7) New analyses will be built into the COVID-19 CG application throughout the course of the pandemic. (8–10) Features and modules that integrate knowledge from other COVID-19 initiatives are continuously incorporated into COVID-19 CG.
Figure 2

Mutational frequencies in the SARS-CoV-2 spike receptor binding domain (RBD) across geographical location and time.
Screen captures from the Compare AA SNVs tab on December 29, 2020, are shown. (A) The top 10 RBD SNVs alongside the number of high quality sequences available on GISAID are shown for each region. (B) The top RBD SNVs for Ireland between mid-July and August 2020 are shown. The S439N mutant had not been previously detected in Ireland. (C) The top RBD SNVs for Australia between June and December 2020 are shown. The S477N mutant constituted only 1.05% of the Australian SARS-CoV-2 genomes on GISAID prior to June.
Figure 3
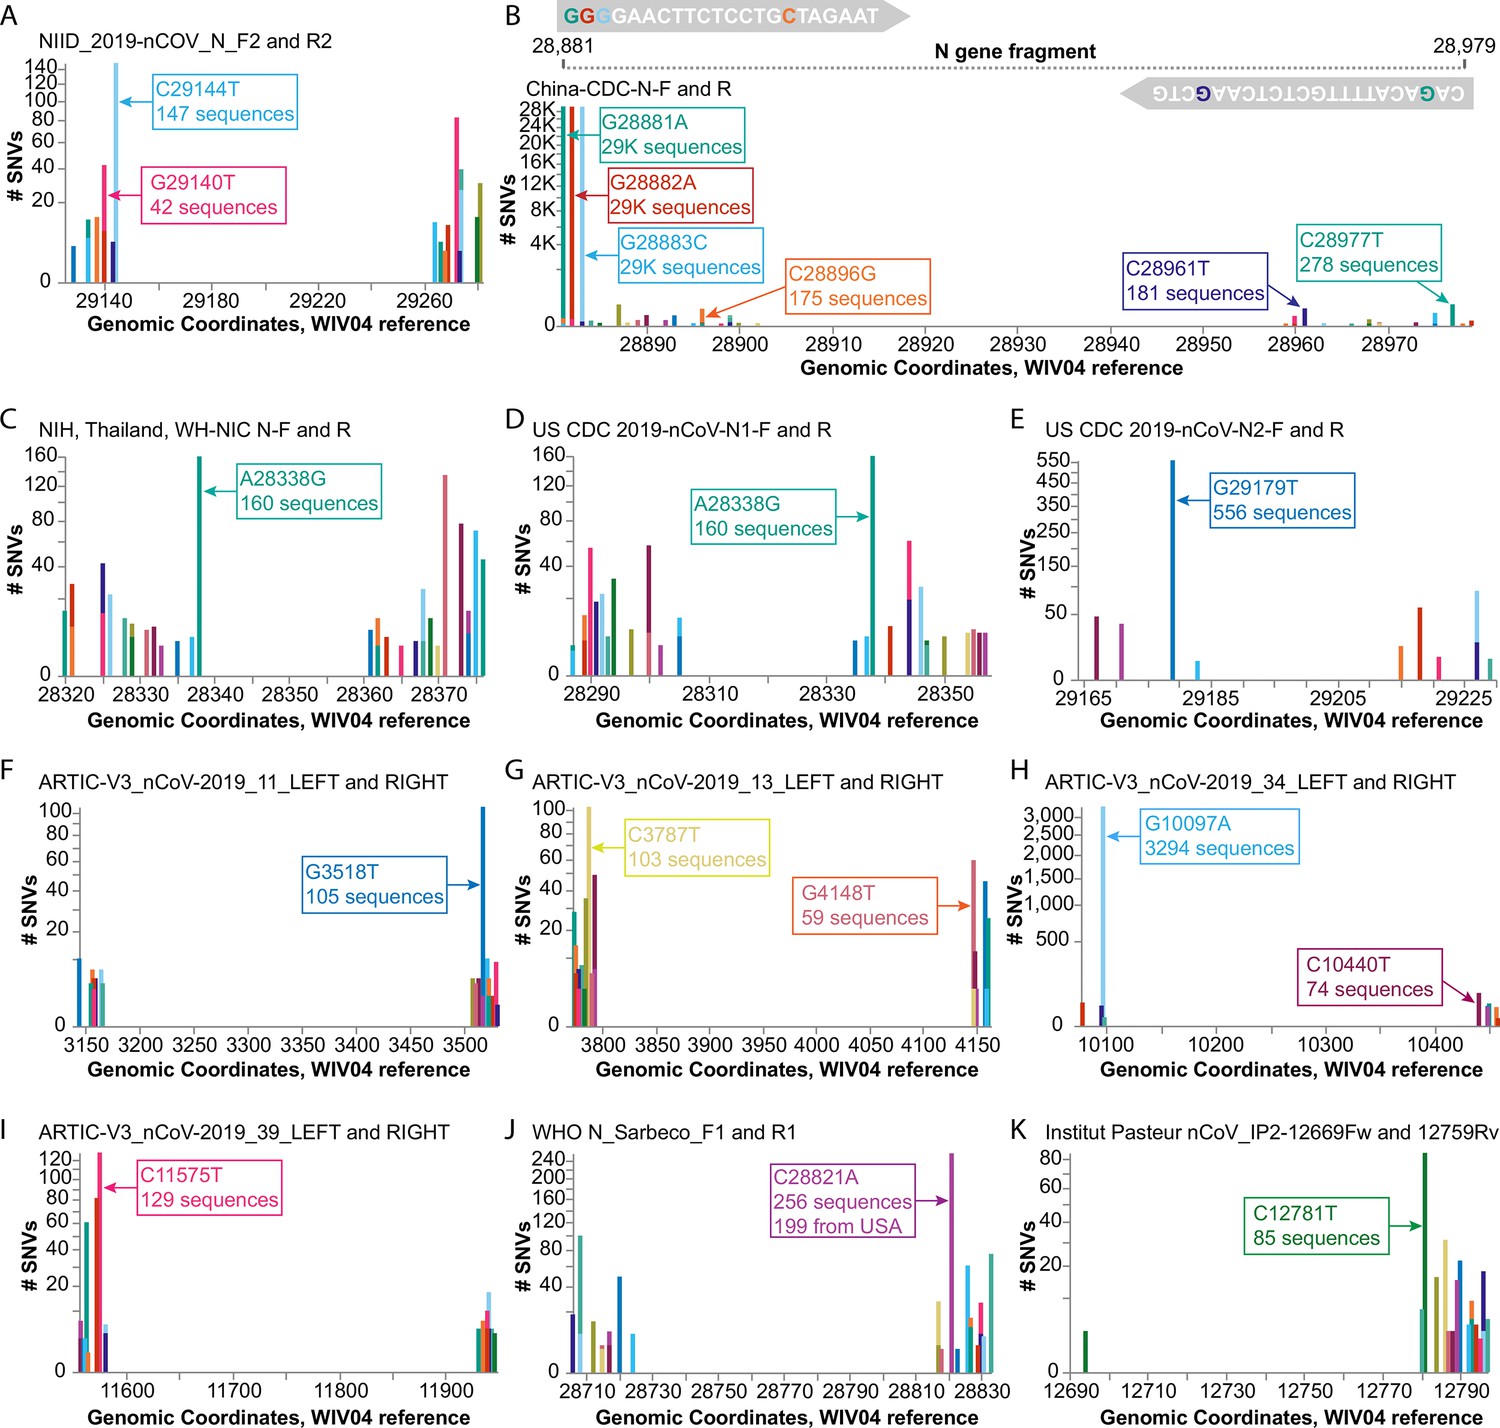
Investigating diagnostic-targeted regions of the SARS-CoV-2 genome for single-nucleotide variations (SNVs) that could impact primer/probe sensitivity.
Images were downloaded from the Compare NT SNVs tab in September 2020. Labels for specific mutations were added. Primer pairs that contain at least one primer with potentially impactful SNVs near the 3’ end are shown. None of the 11 primer pairs shown here were designed with degenerate bases. (A) The G29140T mutation has been demonstrated to impact the NIID_2019-nCOV_N_F2 primer sensitivity. (B-K) Primer pairs affected by SNVs with a global frequency of more than 80 instances are shown. (B) As an example, majors SNVs are colored accordingly in the China-CDC-N-F and R (forward and reverse) primers.
Figure 4
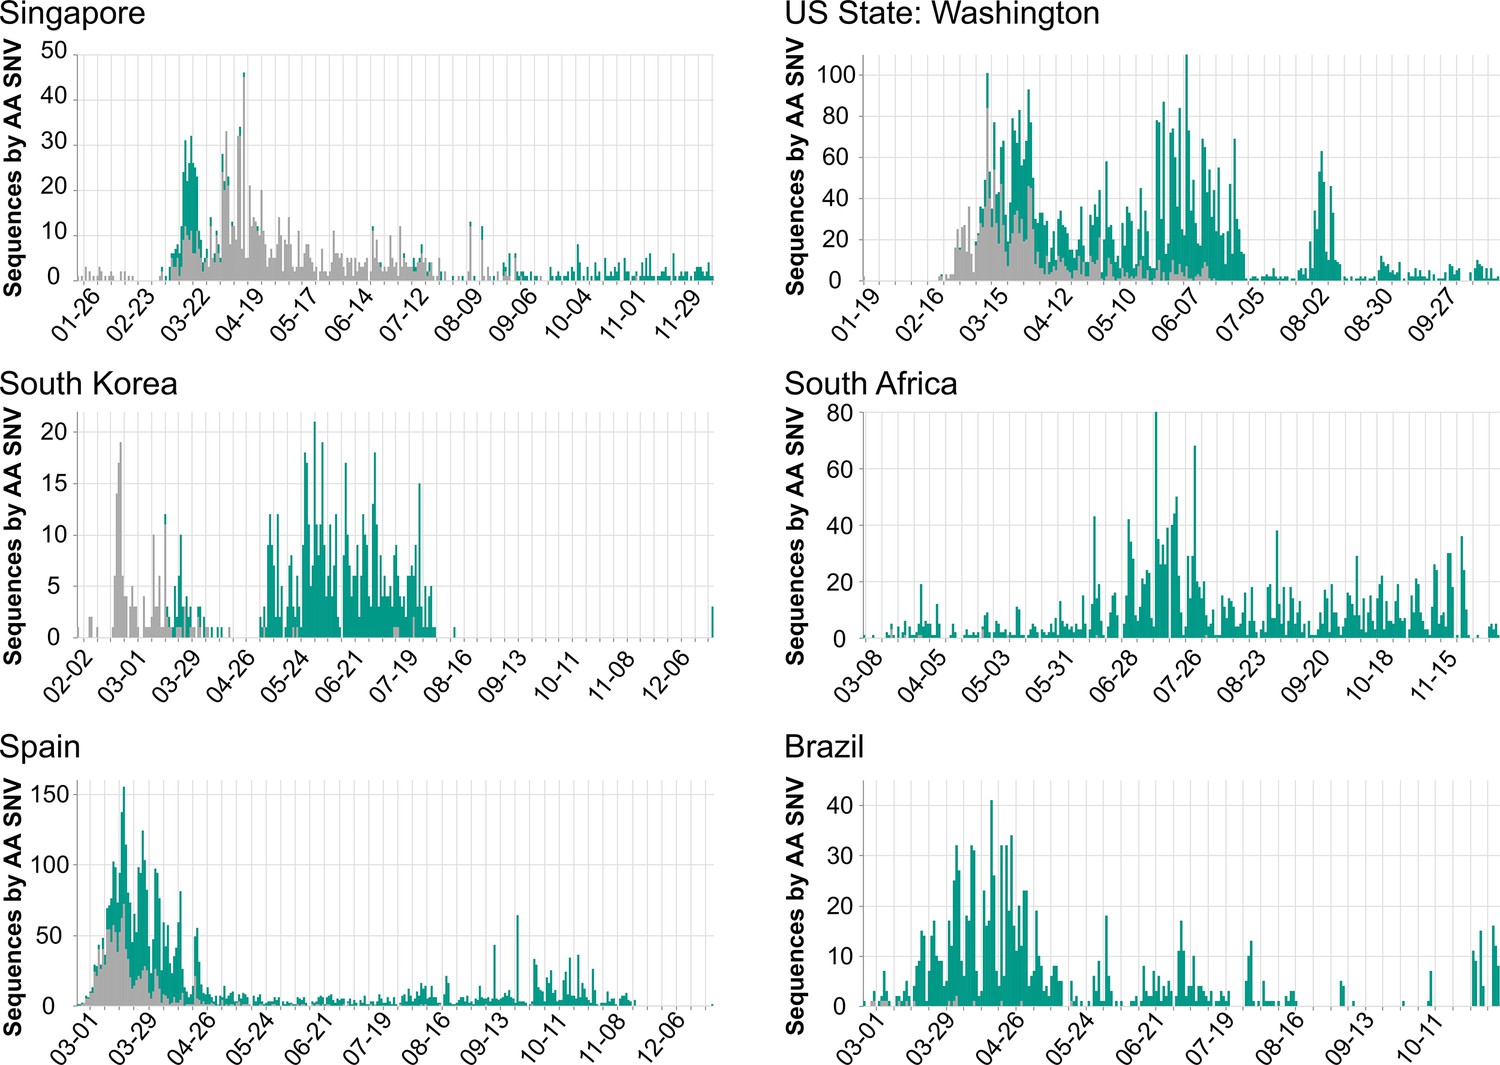
Population dynamics of spike D614G in different regions.
Images were downloaded from the Compare Lineages tab of covidcg.org on December 29, 2020: The spike D614 variants are shown in gray, and the G614 variants are shown in green. Plots displaying different population dynamics were deliberately selected. Time is shown on the horizontal axis and the number of sequences is shown on the vertical axis; these differ per country depending on when and how many samples were collected and whether the sequences were deposited onto GISAID by December 29, 2020.
Figure 5
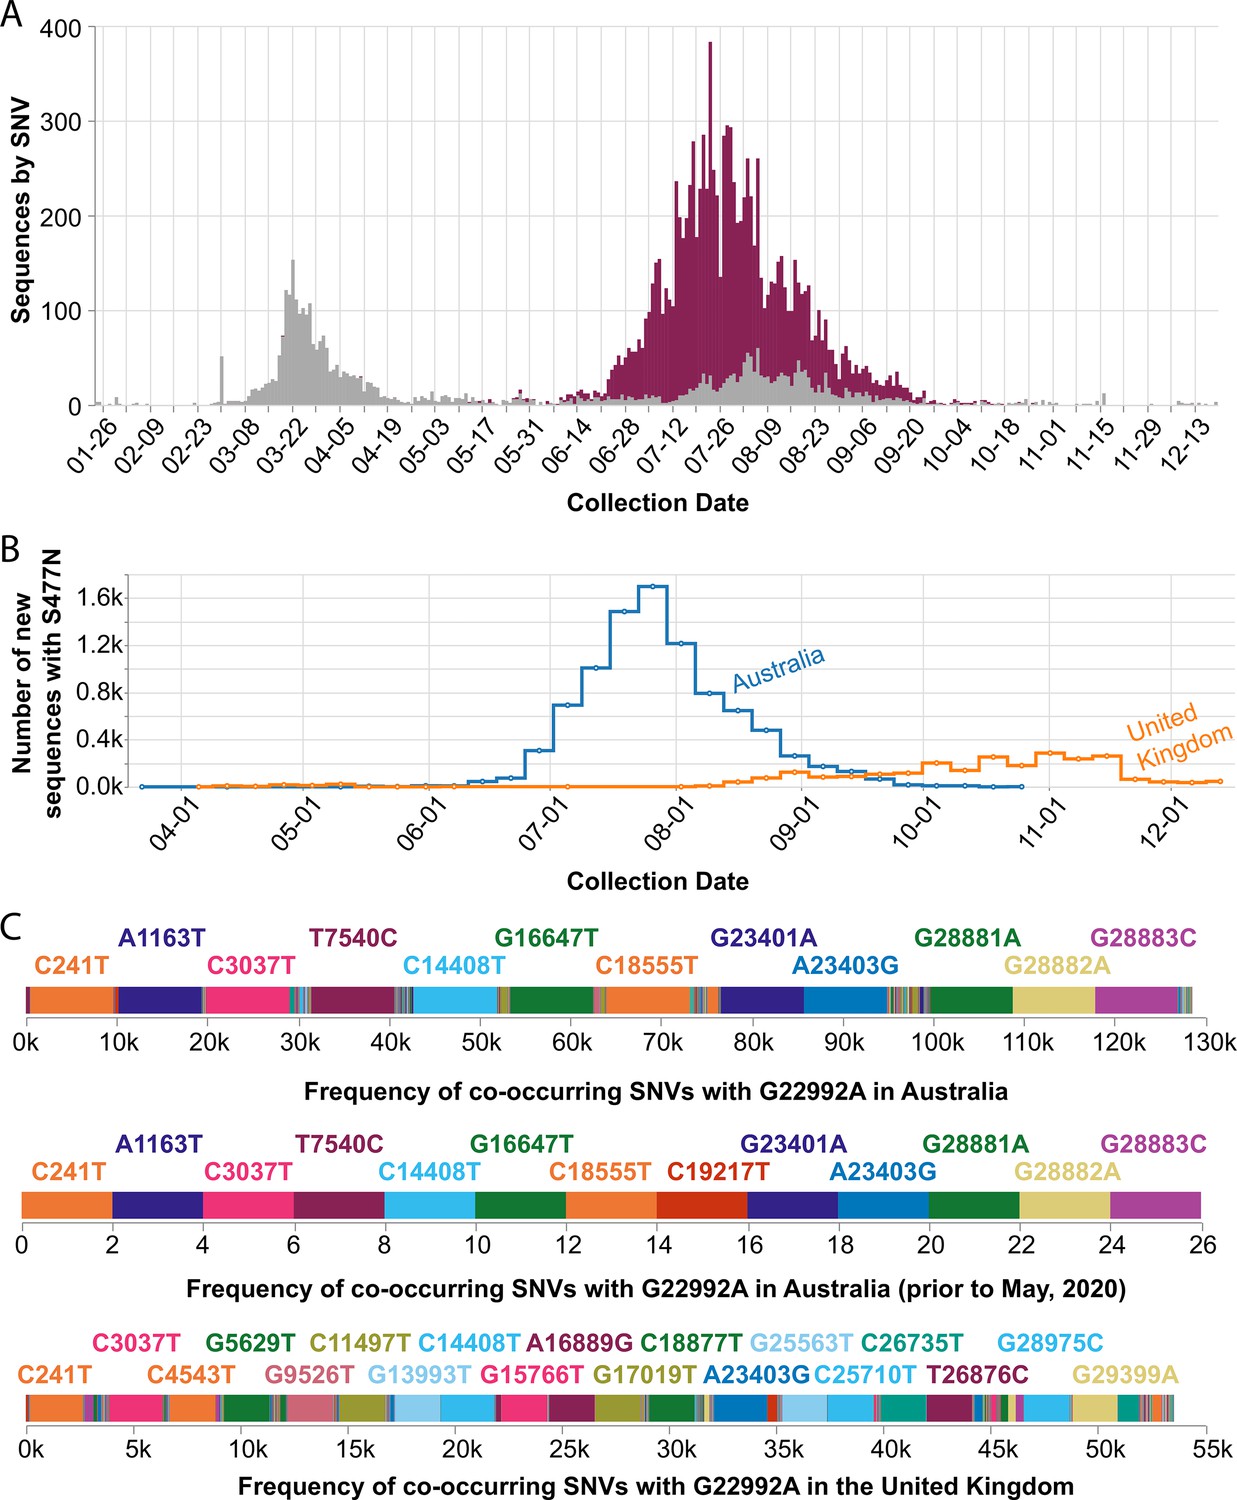
Frequency of the spike S477N mutation in Australia over time.
(A) Image downloaded from the Compare SNVs tab of covidcg.org on December 29, 2020: SARS-CoV-2 variants bearing the spike S477N mutation (also known as the G22992A SNV; depicted in purple), the majority of which lie in the B.1.1.25 lineage, had become the most prevalent form of SARS-CoV-2 in Australia in June through September 2020. (B) Image downloaded from the Compare Locations tab of covidcg.org on December 29, 2020: the cumulative percent of sequences carrying the S477N mutation in Australia and the United Kingdom. (C) Images downloaded from the Compare NT SNVs tab of covidcg.org on December 29, 2020: co-occurring SNVs of G22992A (spike S477N) in Australia, all time versus prior to May 2020, versus in the United Kingdom. In addition to the graphical view, co-occurring mutation data is downloadable in an image or table format.
Figure 6
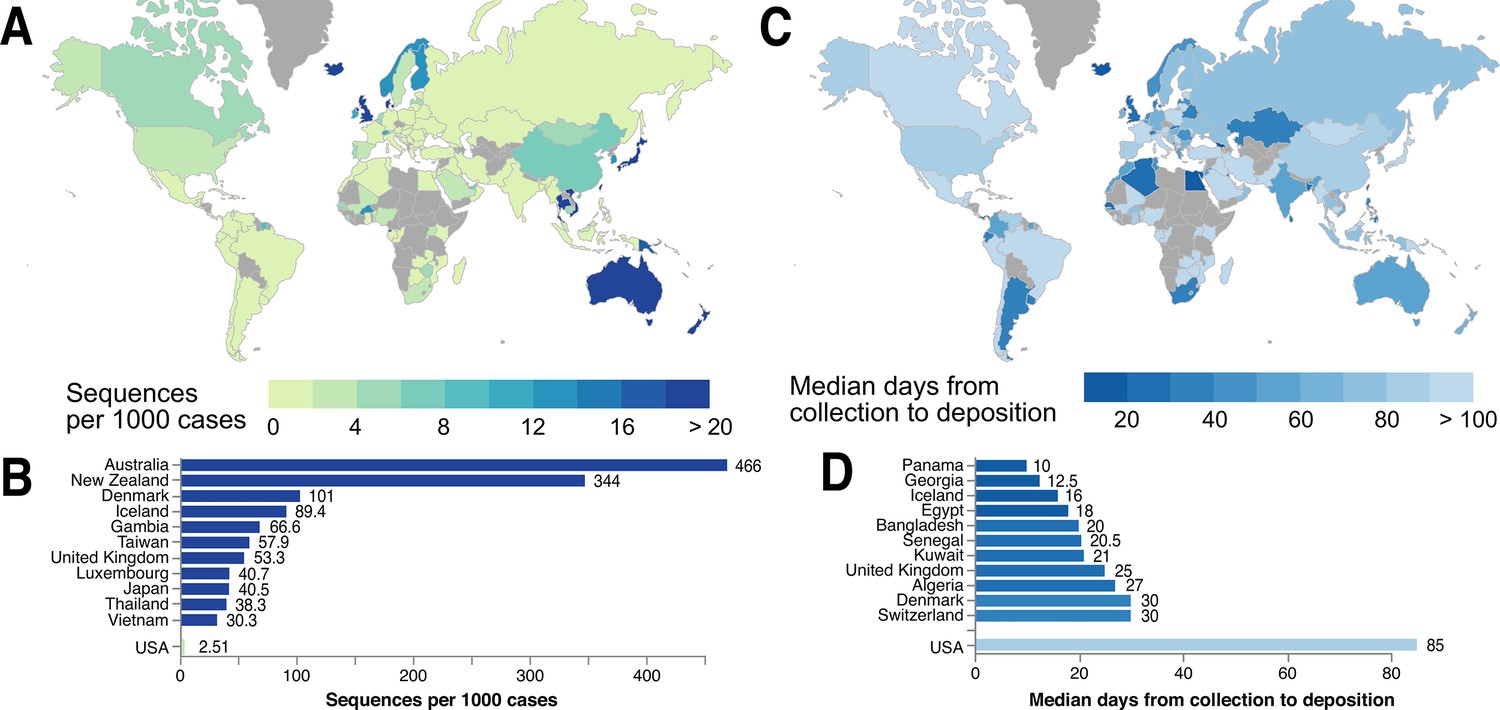
Global statistics of SARS-CoV-2 genome data contribution to GISAID.
Interactive and more comprehensive versions of the figure panels are displayed on the Global Sequencing Coverage tab of covidcg.org. (A) A world map of countries labeled by the number of SARS-CoV-2 sequences contributed per 1000 cases. (B) A bar graph showing the sequences per 1000 cases for the top five countries and the United States. Countries with less than 500 cases were excluded from this plot. (C) A world map of countries labeled by median days between sample collection and sequence deposition. (D) A bar graph showing the median days from collection to deposition for the top five countries and the United States. These interactive displays are generated using sequencing data from GISAID and case data from the JHU CSSE COVID-19 Dataset (Dong et al., 2020).
Additional files
-
Supplementary file 1
List of SARS-CoV-2 genome contributors to GISAID Initiative.
- https://cdn.elifesciences.org/articles/63409/elife-63409-supp1-v1.csv.zip
-
Supplementary file 2
List of Australian SARS-CoV-2 genome contributors to GISAID Initiative.
- https://cdn.elifesciences.org/articles/63409/elife-63409-supp2-v1.csv.zip
-
Transparent reporting form
- https://cdn.elifesciences.org/articles/63409/elife-63409-transrepform-v1.pdf
Download links
A two-part list of links to download the article, or parts of the article, in various formats.
Downloads (link to download the article as PDF)
Open citations (links to open the citations from this article in various online reference manager services)
Cite this article (links to download the citations from this article in formats compatible with various reference manager tools)
COVID-19 CG enables SARS-CoV-2 mutation and lineage tracking by locations and dates of interest
eLife 10:e63409.
https://doi.org/10.7554/eLife.63409


