LAP2alpha maintains a mobile and low assembly state of A-type lamins in the nuclear interior
- Max Perutz Labs, Center for Medical Biochemistry, Medical University of Vienna, Vienna Biocenter Campus (VBC), Austria
- Physics Department and Nanotechnology Institute, Bar Ilan University, Israel
Figures
Figure 1 with 14 supplements
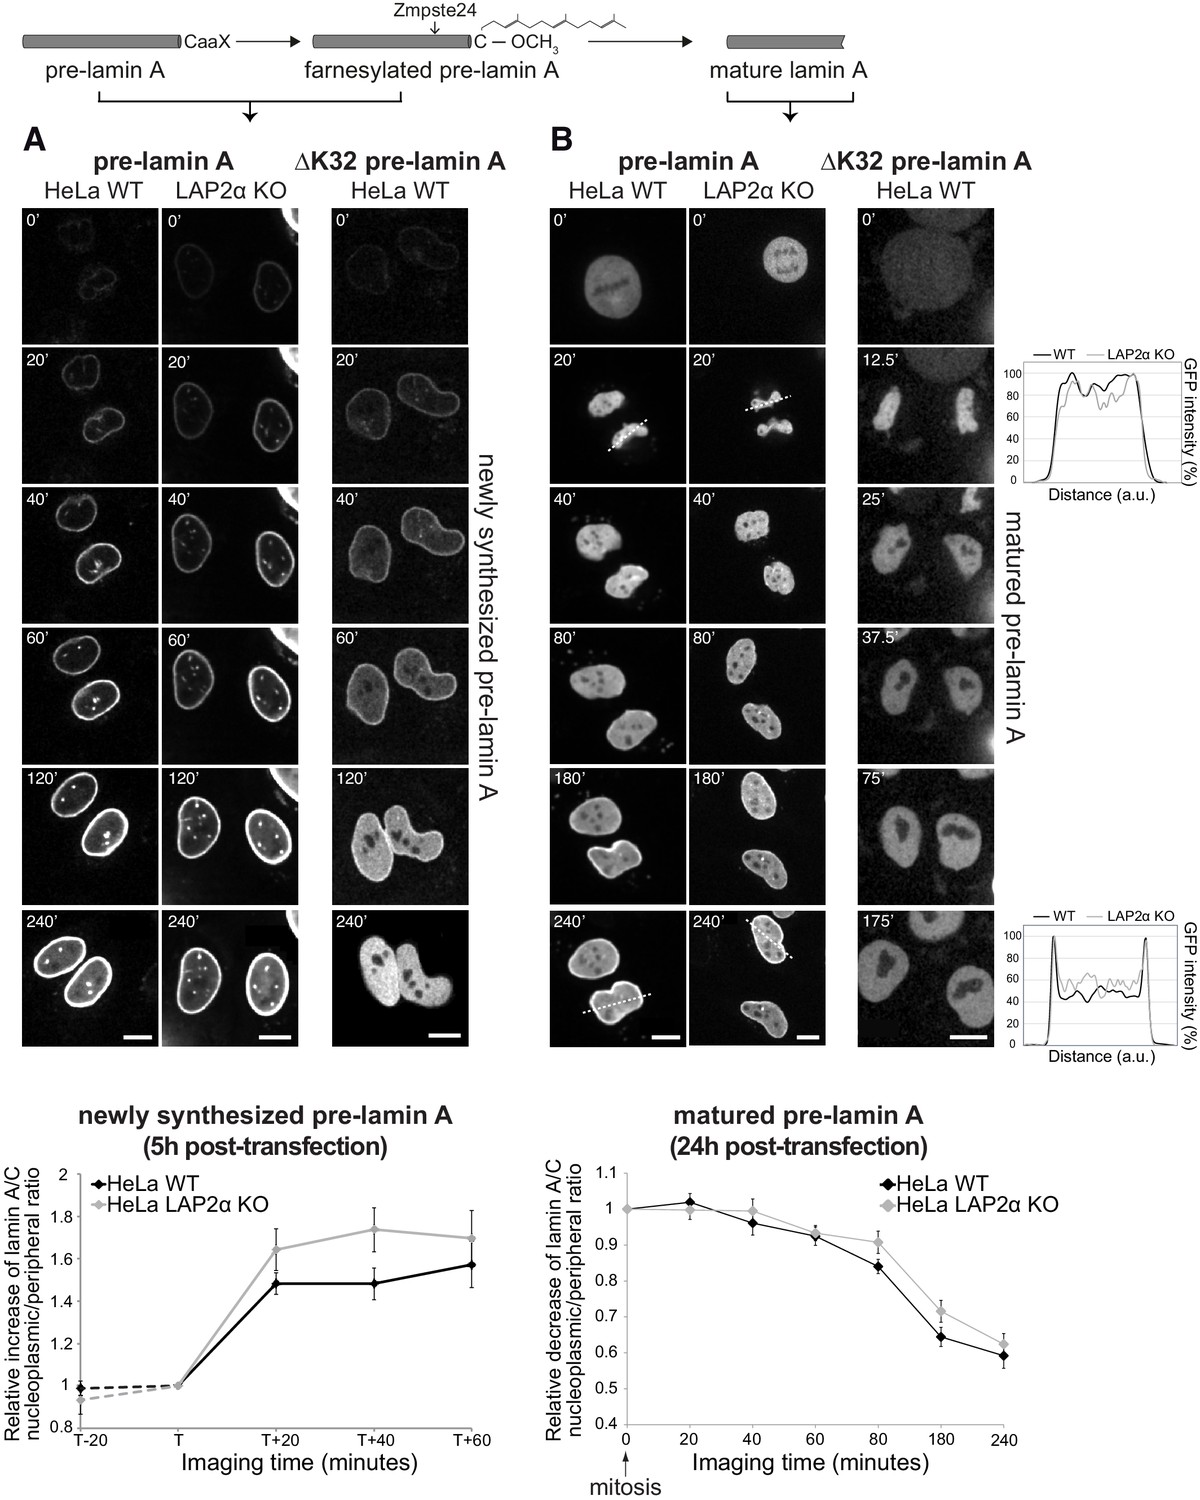
Absence of LAP2α does not affect formation of a nucleoplasmic pool of exogenously expressed GFP-lamin A.
(A) Wildtype (WT) and LAP2α knockout (KO) HeLa cells (see Figure 1—figure supplement 1) were transiently transfected with EGFP-pre-lamin A or EGFP-ΔK32 pre-lamin A as indicated and analyzed by live-cell imaging 5 hr post-transfection. Schematic drawing on top explains lamin A processing state at the time of imaging. Time is indicated in minutes. See also video files: Figure 1—videos 1 and 2, corresponding to panels 1 and 2, Figure 1—video 3 displaying an identically treated second HeLa LAP2α knockout clone, and Figure 1—video 4, corresponding to panel 3. Bottom: Ratio of nucleoplasmic to peripheral mean signal intensity of EGFP-lamin A was calculated (see Materials and methods for details) and normalized to time point ‘T’. ‘T’ defines the moment preceding a significant increase of nucleoplasmic lamin A in each cell. ‘T+/-x’ indicates imaging time relative to ‘T’ with ‘x’ corresponding to minutes. Dashed lines indicate measurements performed in a smaller number of cells (nwt = 6, nko = 6), demonstrating that nucleoplasmic lamin levels remain steadily low prior to the initial release of lamin A into the nucleoplasm (time point ‘T’). Graphs display mean values ± S.E.M (nwt = 18, nko = 23). p Values (repeated measures two-way ANOVA) are ptime <0.0001 and pgenotype = 0.2160 (non-significant). (B) WT and LAP2α KO HeLa cells were transfected as in (A), but imaged 24 hr post-transfection, where ectopically expressed lamin A is largely matured. See also video files: Figure 1—videos 5 and 6, corresponding to panels 1 and 2, Figure 1—video 7 displaying an identically treated second HeLa LAP2α knockout clone, and Figure 1—video 8, corresponding to panel 3. Graphs on the right present examples for GFP-lamin A fluorescence intensity measured along the dashed lines in the images (20’ and 240’). Bottom: Nucleoplasmic over peripheral signal ratio was determined using line profiles for all time points (see Materials and methods for details), normalized to mitosis/early G1 (time point 0’) and plotted versus imaging time. Graphs display mean values ± S.E.M. (nwt = 10, nko = 12). p Values (repeated measures two-way ANOVA) ptime <0.0001 and pgenotype = 0.2564 (non-significant). Scale bar: 10 µm.
Figure 1—figure supplement 1
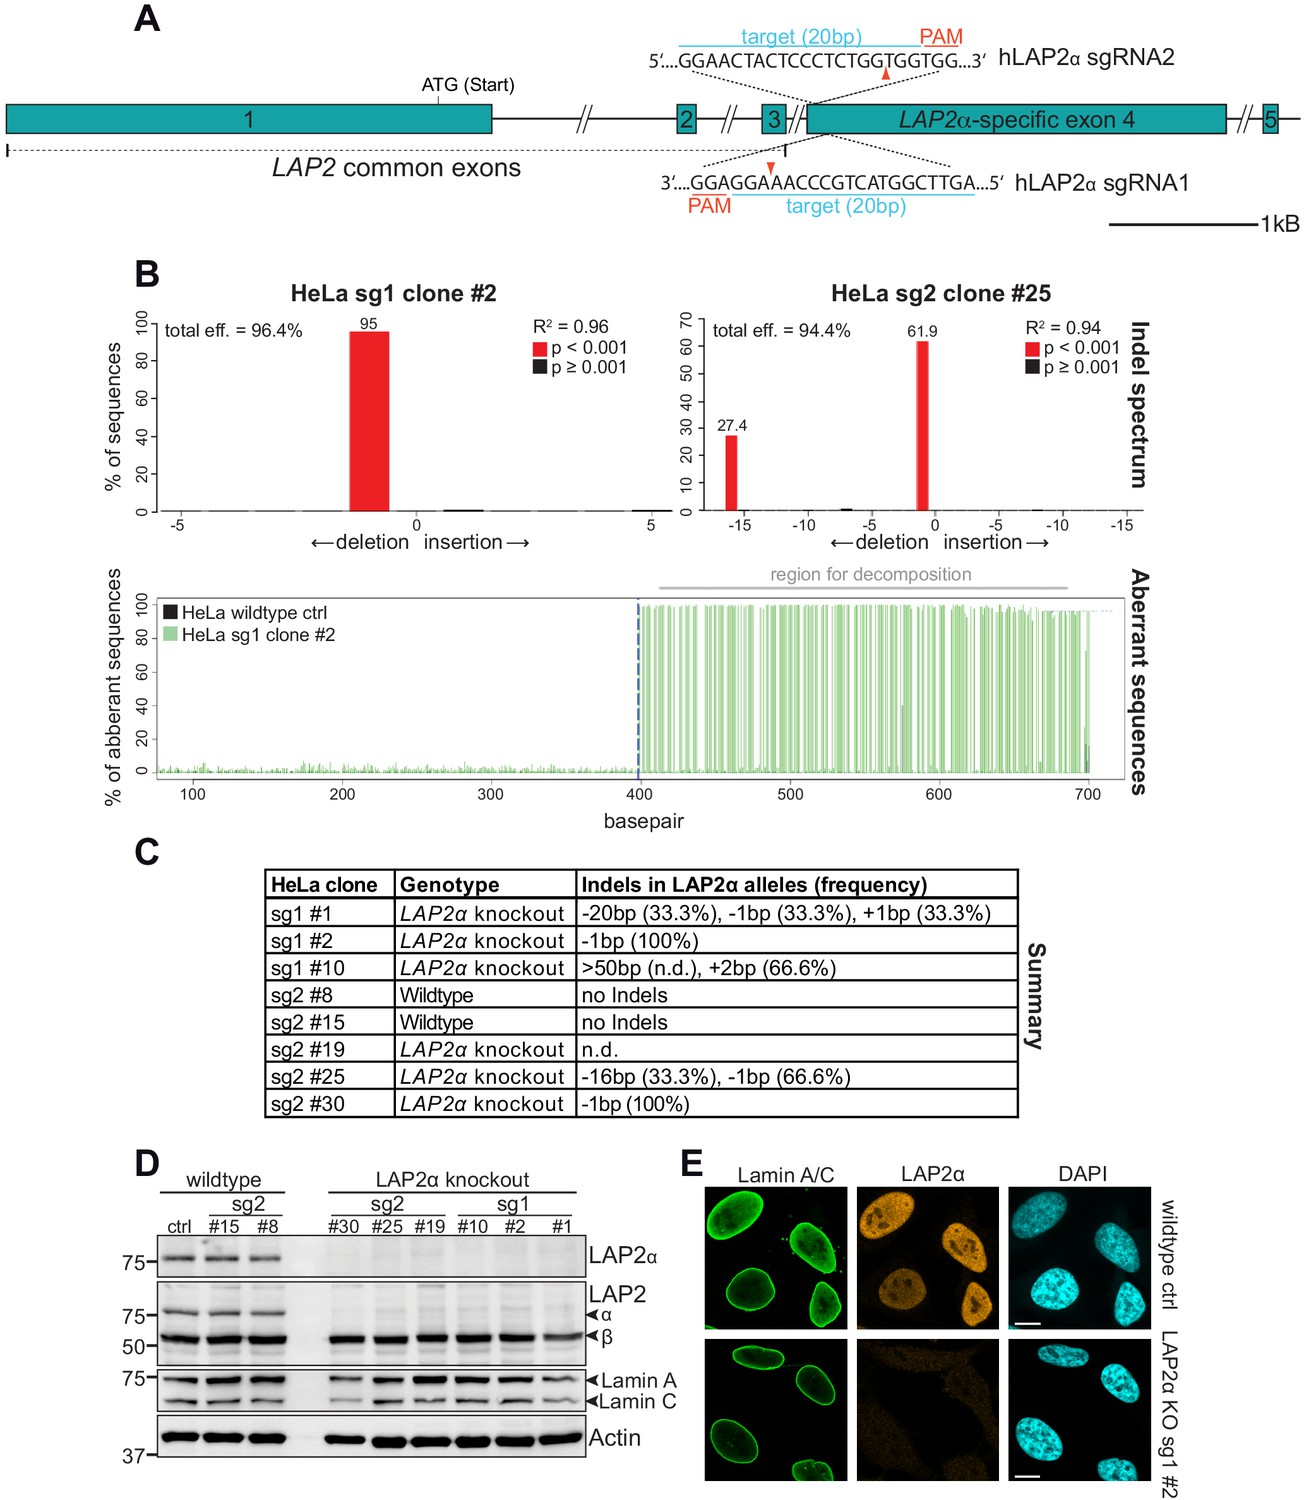
Generation of LAP2α knockout HeLa cell clones using CRISPR-Cas9.
(A) Schematic view of exons 1–5 (bars) and adjacent introns (lines) of the human LAP2 locus. Introns are not displayed in their original length as indicated by a double slash. Exon 1–3 are common to all LAP2 isoforms. Positions of the target sequences of LAP2α-specific sgRNAs 1 and 2 at the beginning of LAP2α-specific exon 4 are shown (blue). Protospacer-adjacent motif (PAM) sequences for each sgRNA are marked in red. Red arrowhead, expected Cas9 cut site. (B) A region spanning both cut sites was amplified from genomic DNA of the indicated clones and wildtype control cells by PCR. PCR products were sequenced and analyzed using the TIDE software (Brinkman et al., 2014). TIDE aligns the control sequence upstream of the predicted Cas9 cut site to the experimental sample sequence to determine any offset between the sequence reads. Then the software uses the peak heights for each base to determine the relative abundance of aberrant nucleotides over the length of the whole sequence trace. Lower graph represents this plot of aberrant sequence signal, which increases drastically for the experimental sample sequence (HeLa sg1 clone #2, green) after Indel-induced frame shifts at the expected cut site (dashed blue line). Aberrant sample sequence signal is very low in the control sample (HeLa wild-type control, black), indicating good quality of the sequencing data. Decomposition was conducted on a sequence segment downstream of the break site (marked in gray), where the software models all possible Indel traces (deletions and insertions from 1 to 50 bp). The sequence trace from the mutated sample is assumed to be a linear combination of the wildtype and the modeled Indel traces and is resolved by standard non-negative linear modeling (Brinkman et al., 2014) to report detected Indels and their frequency in % (upper graph, numbers atop red bars). R2 reports the goodness of fit, p values are calculated by two-tailed t test of the variance-covariance matrix of the standard errors. (C) Summary of generated HeLa clones and their detected Indels as determined by TIDE analysis. Allele frequencies were calculated based on TIDE results and clone ploidy. Alleles with deletions > 50 bp cannot be analyzed by TIDE. (D) HeLa clones were processed for western blot analysis using antibodies to the indicated antigens (anti-lamin A/C 3A6, anti LAP2α Ab15-2). (E) HeLa control and LAP2α knockout sg1 #2 cells were processed for immunofluorescence microscopy using the indicated antibodies (anti-lamin A/C 3A6, LAP2α rabbit antiserum) and analyzed using an LSM 710 confocal microscope. Bar: 10 μm.
Figure 1—figure supplement 2
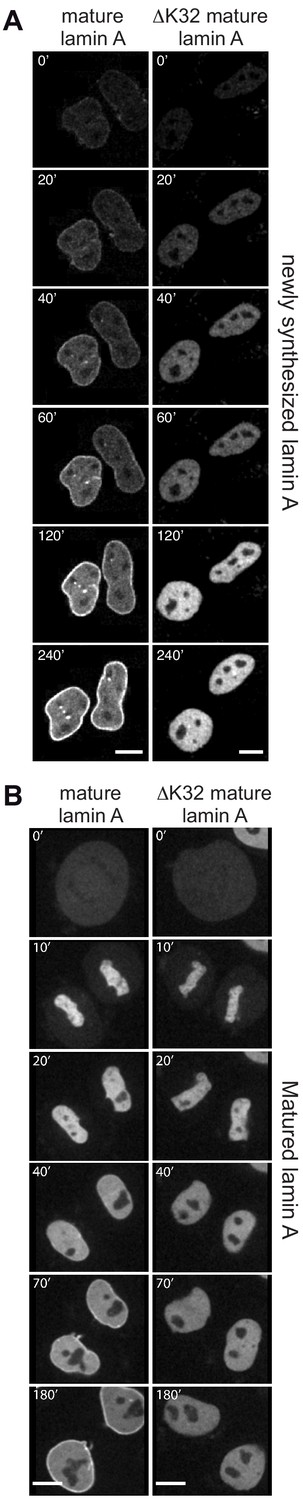
Mature lamin A and mature ΔK32 lamin A initially localize to the nucleoplasm when newly expressed or when mitotically disassembled.
HeLa cells were transiently transfected with either EGFP-mature lamin A or EGFP-ΔK32 mature lamin A as indicated, and analyzed by live-cell imaging 5 hr (A) or 24 hr (B) post-transfection. See also video files: Figure 1—videos 9 and 10, corresponding to panels 1–2 in (A) and Figure 1—videos 11 and 12, corresponding to panels 1–2 in (B). Numbers indicate minutes. Bar: 10 μm.
Figure 1—video 1
Wildtype HeLa cells were transiently transfected with EGFP-pre-lamin A and analyzed by live-cell imaging 5 hr post-transfection.
Shown is a video assembled from images obtained every 20 min of cells starting to display emerging EGFP-pre-lamin A fluorescence (associated with Figure 1A).
Figure 1—video 2
LAP2α knockout HeLa cells (clone sg1#2) were transiently transfected with EGFP-pre-lamin A and analyzed by live-cell imaging 5 hr post-transfection.
Shown is a video assembled from images as described for Figure 1—video 1 (associated with Figure 1A).
Figure 1—video 3
LAP2α knockout HeLa cells (clone sg2#25) were transiently transfected with EGFP-pre-lamin A and analyzed by live-cell imaging 5 hr post-transfection.
Shown is a video assembled from images as described for Figure 1—video 1 (associated with Figure 1A).
Figure 1—video 4
Wildtype HeLa cells were transiently transfected with EGFP-ΔK32 pre-lamin A and analyzed by live-cell imaging 5 hr post-transfection.
Shown is a video assembled from images as described for Figure 1—video 1 (associated with Figure 1A).
Figure 1—video 5
Wildtype HeLa cells were transiently transfected with EGFP-pre-lamin A and analyzed by live-cell imaging 24 hr post-transfection.
Shown is a video assembled from images obtained every 20 min of cells expressing matured EGFP-pre-lamin A starting from a cell undergoing mitosis (associated with Figure 1B).
Figure 1—video 6
LAP2α knockout HeLa cells (clone sg1#2) were transiently transfected with EGFP-pre-lamin A and analyzed by live-cell imaging 24 hr post-transfection.
Shown is a video assembled from images as described for Figure 1—video 5 (associated with Figure 1B).
Figure 1—video 7
LAP2α knockout HeLa cells (clone sg2#25) were transiently transfected with EGFP-pre-lamin A and analyzed by live-cell imaging 24 hr post-transfection.
Shown is a video assembled from images as described for Figure 1—video 5 (associated with Figure 1B).
Figure 1—video 8
Wildtype HeLa cells were transiently transfected with EGFP-ΔK32 pre-lamin A and analyzed by live-cell imaging 24 hr post-transfection.
Shown is a video assembled from images as described for Figure 1—video 5 (associated with Figure 1B).
Figure 1—video 9
Wildtype HeLa cells were transiently transfected with EGFP-mature lamin A and analyzed by live-cell imaging 5 hr post-transfection.
Shown is a video assembled from images obtained every 20 min of cells starting to display emerging EGFP-mature lamin A fluorescence (associated with Figure 1—figure supplement 2A).
Figure 1—video 10
Wildtype HeLa cells were transiently transfected with EGFP-ΔK32 mature lamin A and analyzed by live-cell imaging 5 hr post-transfection.
Shown is a video assembled from images as described for Figure 1—video 9 (associated with Figure 1—figure supplement 2A).
Figure 1—video 11
Wildtype HeLa cells were transiently transfected with EGFP-mature lamin A and analyzed by live-cell imaging 24 hr post-transfection.
Shown is a video assembled from images obtained every 20 min of cells expressing mature EGFP-lamin A starting from a cell undergoing mitosis (associated with Figure 1—figure supplement 2B).
Figure 1—video 12
Wildtype HeLa cells were transiently transfected with EGFP-ΔK32 mature lamin A and analyzed by live-cell imaging 24 hr post-transfection.
Shown is a video assembled from images as described for Figure 1—video 11 (associated with Figure 1—figure supplement 2B).
Figure 2 with 3 supplements
Absence of LAP2α does not alter endogenous nucleoplasmic lamin A/C levels.
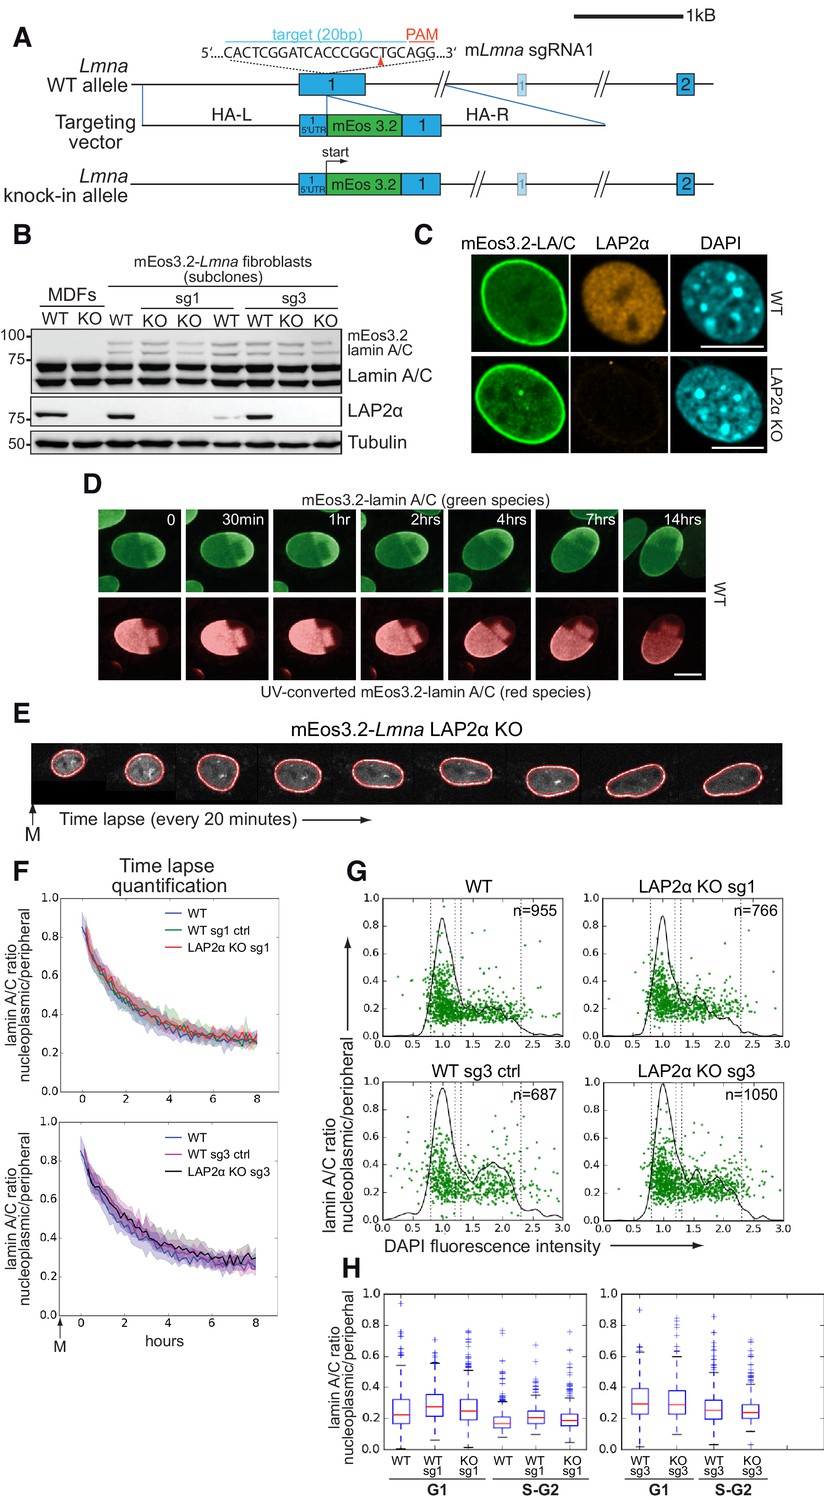
(A) Schematic view of exons 1 and 2 (bars) and adjacent introns of the mouse Lmna locus (top), the targeting construct provided as homology-directed repair template after Cas9-mediated double strand break (middle), and the knock-in allele after successful integration of mEos3.2 (bottom). Very long introns are not displayed in their original length as indicated by a double slash. The second, light-colored exon 1 encodes the N-terminus of meiosis-specific lamin C2. The target sequence of Lmna-specific sgRNA1 in exon 1 is shown (blue). Protospacer-adjacent motif (PAM) is marked in red. Red arrowhead: expected Cas9 cut site. HA-L: Homology Arm-Left; HA-R: Homology Arm-Right. For further cell characterization see Figure 2—figure supplement 1. (B) mEos3.2-Lmna clone derived from wildtype (WT) mouse dermal fibroblasts (MDFs) and subclones generated after treatment with LAP2α-specific sgRNAs 1 or 3 (see Figure 2—figure supplement 2) were processed for western blotting using antibodies to the indicated antigens (anti lamin A/C E1, anti LAP2α 1H11). Positions of mEos-tagged and untagged lamins A and C are indicated. Wildtype and LAP2α knockout (KO) MDFs were added as controls. (C) mEos3.2-Lmna WT and LAP2α KO cells were processed for immunofluorescence microscopy using antibodies against LAP2α (1H11) and DAPI to visualize DNA. Confocal images are shown. Bar: 10 μm. (D) mEos3.2-Lmna WT cells were exposed to UV light (405 nm) to convert mEos3.2-lamin A/C from green to red. Cells were then tracked for 14 hr by live-cell imaging to test for stable integration of mEos3.2-lamin A/C into the peripheral lamina. No significant mobility of converted lamins in the lamina was observed over the entire imaging time. Pictures display merged Z-stacks to visualize most of the peripheral lamina. Bar: 10 μm. (E) Representative example of a LAP2α KO cell expressing mEos3.2-lamin A/C tracked by live-cell imaging throughout G1, followed by automated calculation of nucleoplasmic over peripheral lamin A/C ratio (t0: first available image after mitosis). The area corresponding to the nuclear lamina is delineated by red lines and was defined by a custom-made algorithm implemented in FIJI/ImageJ software. Average values for isogenic mEos3.2-Lmna LAP2α WT and KO clones were plotted in curves (F). The designation ‘sg1’ and ‘sg3’ refers to the sgRNA used to generate that clone (see Figure 2—figure supplement 2). Clones treated with sgRNAs, but still expressing LAP2α, were included as additional controls and are designated as ‘WT sg ctrl’. The 20th and 80th percentile are displayed for each curve (shaded area). nWT = 129, nWTsg1ctrl=159, nKOsg1 = 106, nWTsg3ctrl=111, nKOsg3 = 147 (G) Isogenic clones were fixed and DNA was stained with DAPI. Nucleoplasmic (N) to peripheral (P) signal intensity of mEos3.2-Lamin A/C was calculated for single cells (green dots) using a custom-made FIJI plugin and plotted versus DAPI fluorescence intensity, indicative of cell cycle stage (see also Figure 2—source data 1). Black line outlines number of cells versus DAPI intensity (histogram). Vertical dotted lines indicate what was classified as G1 and S-G2 in (H). (H) Single-cell N/P ratios from (G) were averaged for G1 and S/G2 and are shown in a box plot (median in red within the first and third quartiles; whiskers: minimal and maximal datapoint excluding outliers). The specificity of nucleoplasmic lamin A/C signal was demonstrated by comparison to lamin B1 N/P ratios (see Figure 2—figure supplement 3).
-
Figure 2—source data 1
Nucleoplasmic to peripheral signal intensity ratio and DAPI fluorescence intensity of mEos3.2-Lamin A/C WT and LAP2α KO cells.
- https://cdn.elifesciences.org/articles/63476/elife-63476-fig2-data1-v2.xlsx
Figure 2—figure supplement 1
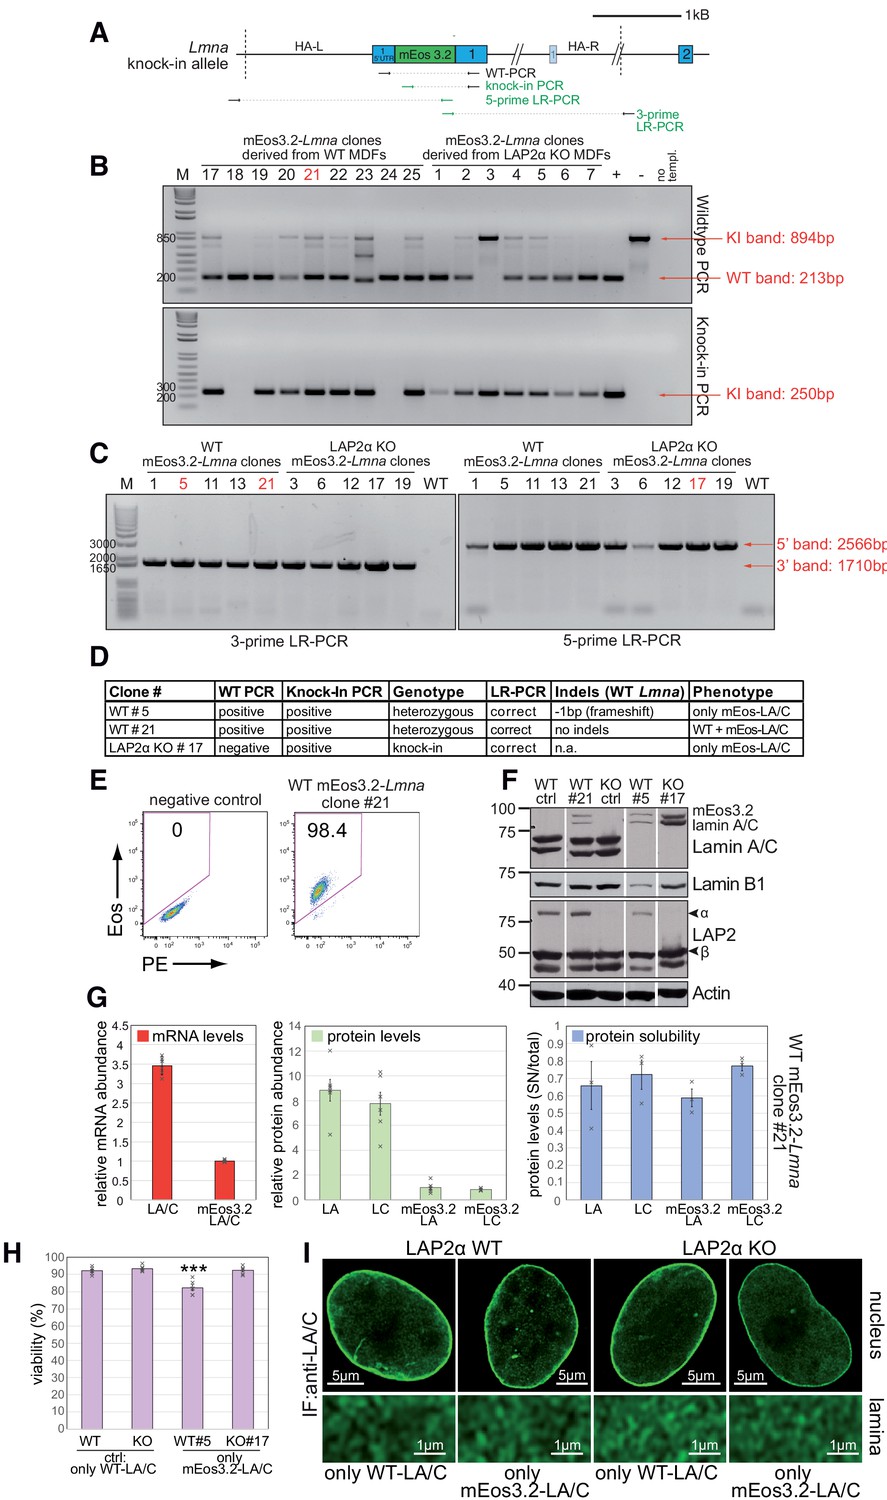
Characterization of mEos3.2-Lmna mouse fibroblasts.
(A) Schematic view of exons 1 and 2 (bars) and adjacent introns (lines) of the mouse Lmna locus after integration of mEos3.2. Very long introns are not displayed in their original length as indicated by a double slash. The second, light-colored exon 1 encodes the N-terminus of meiosis-specific lamin C2. Primers used for genotyping and long-range (LR) PCR are indicated (green: specific for modified allele). Dashed lines demarcate the left and right homology arm used for targeting (HA-L: Homology Arm-Left; HA-R: Homology Arm-Right). (B) Genomic DNA was isolated from clones derived from either wildtype (WT) or LAP2α knockout (KO) mouse dermal fibroblasts (MDFs). Samples were processed for PCR using the primers indicated in (A) to determine the clonal genotype. (C) Clones, where genotyping indicated the presence of a modified allele, were analyzed by long range (LR-)PCR to test for proper integration of the targeting construct. Primer pairs for the left and right homology arm are indicated in (A), with one primer of each pair outside the homology arms. (D) Table summarizes results for relevant clones of PCRs in (B), as well as Indels in the WT allele (if present) as determined by PCR across the sgRNA target sequence, followed by sequencing and analysis using the TIDE software. Clonal phenotypes were determined by western blotting using antibodies to the indicated antigens (anti lamin A/C 3A6), showing expression of mEos3.2-tagged lamins A and C in the presence (WT#21) or absence (WT#5) of untagged wildtype lamin A/C (F). (E) Positive clones were also analyzed for the presence of mEos3.2 by FACS. Representative FACS blots of normal wildtype mouse fibroblasts (negative control) and Eos3.2-Lmna WT clone #21 are shown. (G) Levels of endogenous untagged and mEos3.2-tagged lamins A and C (LA/C) mRNA (left) and protein (middle) isolated from WT clone #21 were determined by quantitative qRT-PCR and western blot, respectively. Graph displays relative abundance of untagged lamins A/C normalized to mEos3.2-tagged lamins A/C in WT clone #21. Left (mRNA): average ± S.D. from technical replicates (n = 6, single data points are displayed); middle (protein): average ± S.E.M (n = 6, single data points are displayed; one-way ANOVA p value is < 0.0001, F = 110.2; Tukey’s post-hoc test: lamin A vs. Eos-lamin A and lamin C vs. Eos-lamin C: p<0.0001). Right graph: Untagged and mEos3.2-tagged lamins A/C were extracted from WT clone #21 cells in salt and detergent-containing buffer (500 mM NaCl, 0.5% NP-40). Lamin A/C levels in the soluble fraction (supernatant - SN) after removal of insoluble proteins by centrifugation were determined by western blot analysis and normalized to total protein levels. Graph shows averages ± S.E.M (n = 3, single data points are displayed; one-way ANOVA p value is 0.525, F = 0.806; non-significant). (H) Relative viability (in %) of parental WT and LAP2α KO control (ctrl) cells expressing only WT untagged lamins A/C and cells expressing only mEos3.2-tagged lamins A/C (WT clone #5 and LAP2α KO clone #17) was determined using a Casy counter. Graph displays averages ± S.E.M (n = 6, single data points are displayed). WT#5 has a slightly reduced viability (adjusted p value vs WT ctrl, vs KO ctrl and vs KO#17: ***p<0.0001), likely due to lower lamin A/C levels (see western blot in F). (I) Control and only mEos3.2-lamin A/C expressing cells from (H) were processed for immunofluorescence microscopy using antibodies to lamin A/C (3A6). Confocal super-resolution (Airyscan) images of lamin A/C signal in the whole nucleus (top) or in the basal layer of the lamina (bottom) are depicted.
Figure 2—figure supplement 2
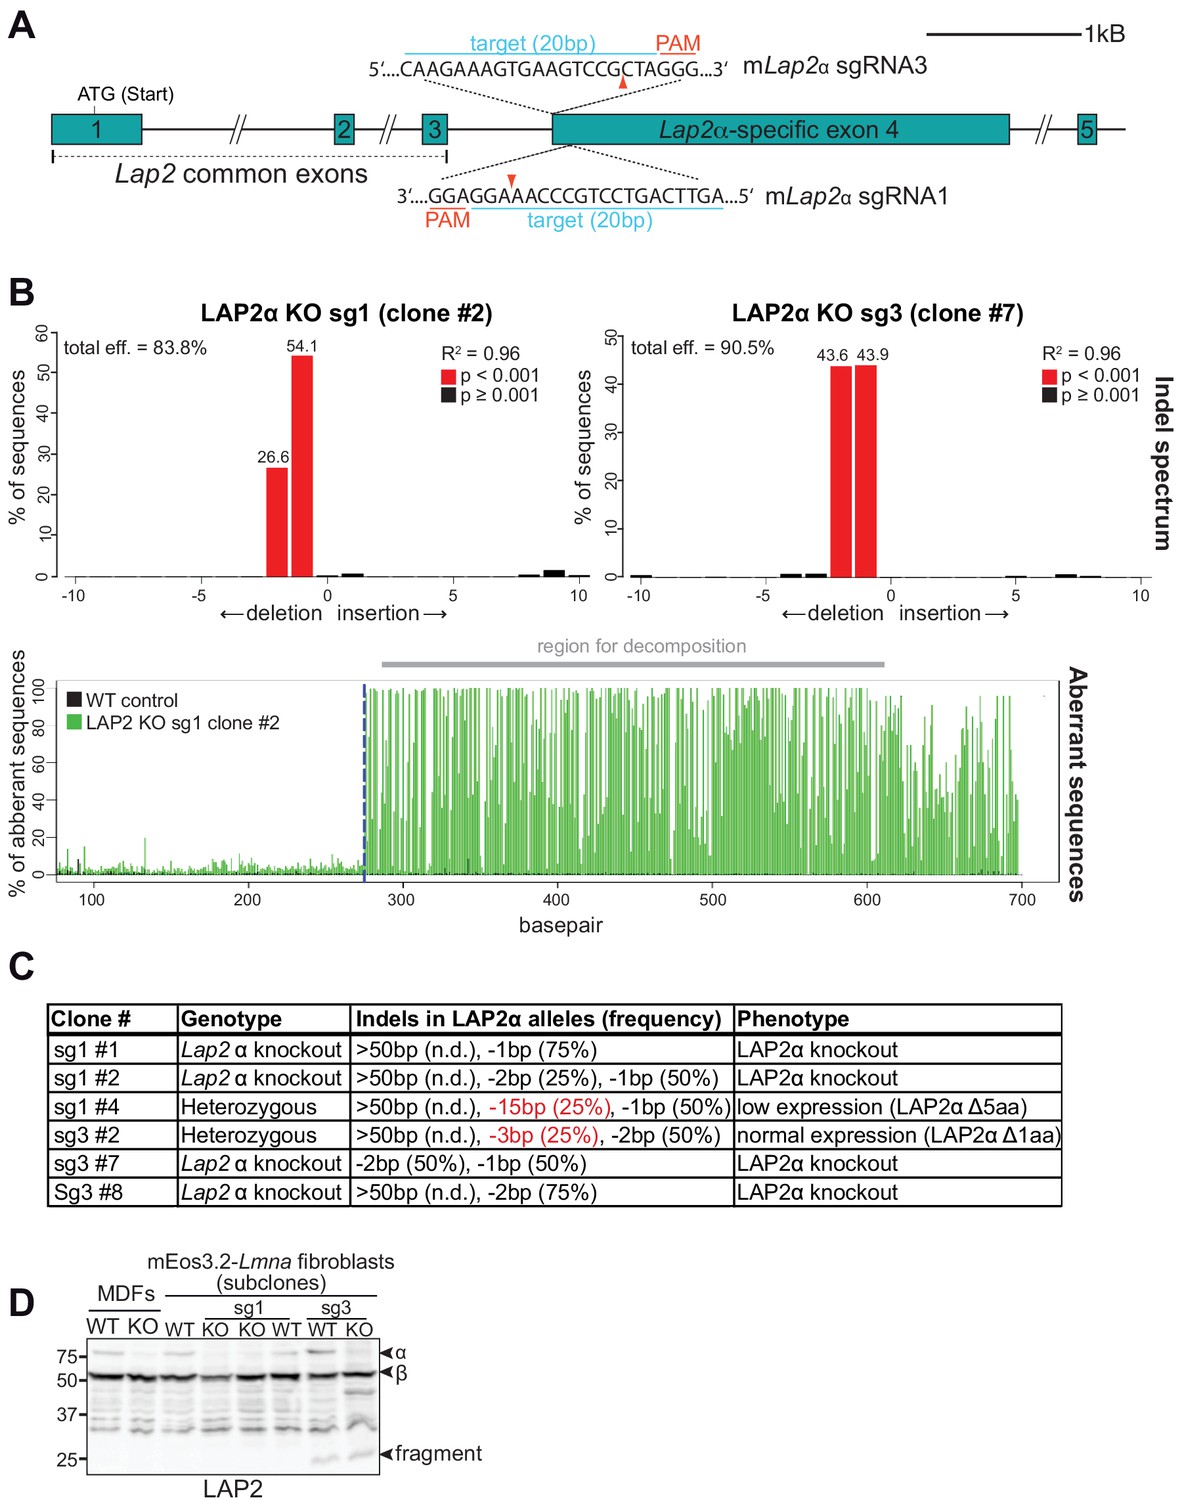
Generation of isogenic LAP2α knockout mEos3.2-Lmna clones using CRISPR-Cas9.
(A) Large interclonal variability in the expression levels of mEos-tagged and untagged lamin A/C in mEos3.2-Lmna mouse fibroblasts (Figure 2—figure supplement 1) prompted us to use one wildtype clone (WT clone #21) with normal nuclear morphology that harbors both, tagged and untagged lamins A/C, to create isogenic LAP2α knockout cells with two different LAP2α-specific sgRNAs. Image shows a schematic view of exons 1–5 (bars) and adjacent introns (lines) of the murine Lap2 locus. Long introns are not displayed in their original length as indicated by a double slash. Exon 1–3 are common to all LAP2 isoforms. Positions of the target sequences of Lap2α-specific sgRNAs 1 and 3 at the beginning of Lap2α-specific exon 4 are shown (blue). Protospacer-adjacent motif (PAM) sequences for each sgRNA are marked in red. Red arrowhead; expected Cas9 cut site. (B) A region spanning both cut sites was amplified from genomic DNA of the indicated clones and wildtype control cells by PCR. PCR products were sequenced and analyzed using TIDE as described in Figure 1—figure supplement 1B. Upper graphs display detected Indels and their frequency in % (numbers atop red bars), lower graph shows an example alignment of wildtype and clone sg1 #2 sequences. Dashed blue line; expected Cas9 cut site. The region used for decomposition of individual sequences and Indel prediction is marked in gray. R2 reports the goodness of fit, p values are calculated by two-tailed t test of the variance-covariance matrix of the standard errors (Brinkman et al., 2014). (C) Summary of generated isogenic mEos3.2-Lmna clones and their detected Indels as determined by TIDE analysis. Alleles with deletions > 50 bp cannot be analyzed by TIDE. Sequencing revealed that WT mEos3.2-lamin A/C cells and all isogenic clones are tetraploid. Alleles marked in red represent in-frame deletions, encoding full length LAP2α with small deletions. Clonal phenotypes are described based on data in (D). (D) Isogenic clones were processed for western blot analysis using antibodies against the LAP2 common N-terminal domain. Notably, clones generated with LAP2α-specific sgRNA3 express a small N-terminal fragment likely representing the LAP2 N-terminal domain common to all LAP2 isoforms. To control for any effects caused by this LAP2 fragment, sg3 LAP2α knockout clones were not only compared to their wildtype origin clone, but also to a clone (sg3 #2) that carried one Lap2α allele with an in-frame deletion of 3 bp, thus expressing full length LAP2α (minus one amino acid), as well as the N-terminal fragment from the other, modified alleles, thus serving as an additional ‘wild-type’ control (designated WT sg3 ctrl in the main figures).
Figure 2—figure supplement 3
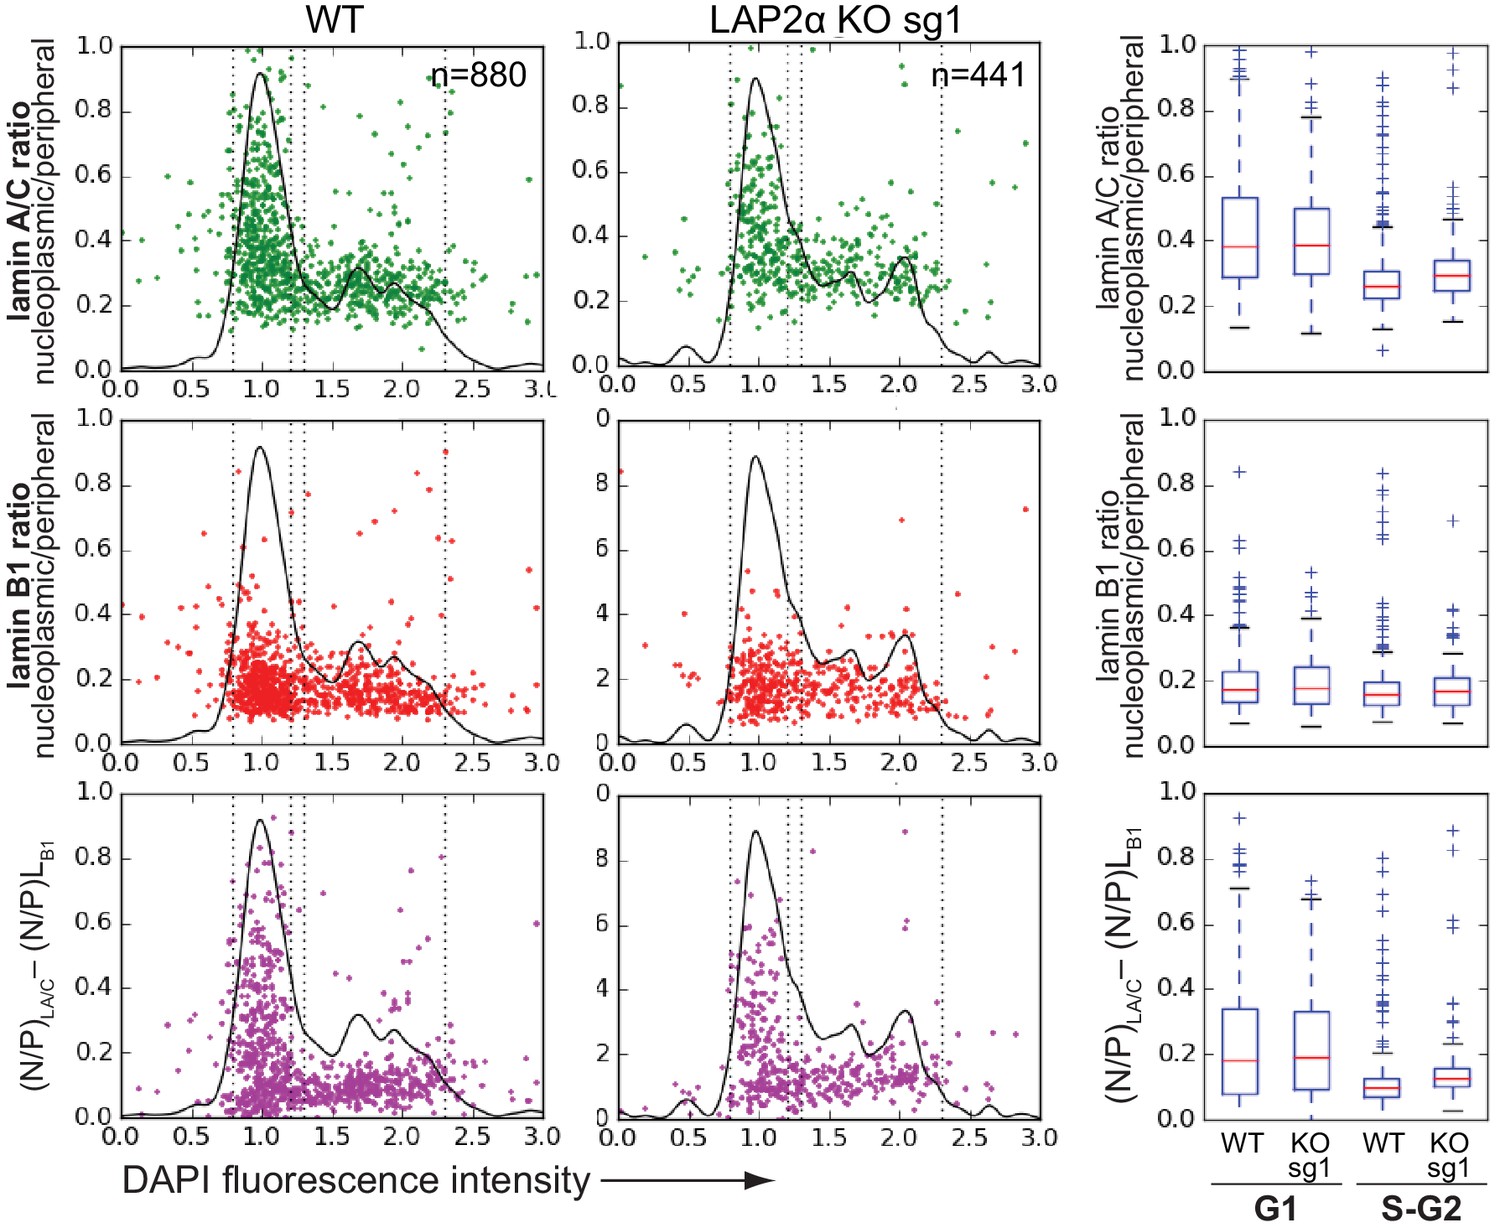
Assessing specificity of nucleoplasmic lamin A/C fluorescence signal by quantifying fluorescent out-of-focus bleed-through by the nuclear lamina.
mEos3.2-Lmna wildtype (WT) and isogenic LAP2α knockout (KO) sg1 cells were fixed and processed for immunofluorescence using antibodies against lamin B1. DNA was stained with DAPI. Nucleoplasmic to peripheral signal intensity of mEos3.2-lamin A/C and lamin B1 was calculated for single cells (dots) and plotted versus DAPI fluorescence intensity, indicative of cell cycle stage. Black line outlines number of cells versus DAPI intensity (histogram). Vertical dotted lines indicate what was classified as G1 and S-G2. Since most or all signal observed in the nucleoplasm from lamin B1 should represent out-of-focus light, specific nucleoplasmic/peripheral ratios for lamins A and C were determined by subtracting lamin B1 values for every cell (lower graph). Data are also displayed in a box plot (median in red within the first and third quartiles; whiskers: minimal and maximal datapoint excluding outliers).
Figure 3 with 1 supplement

Absence of LAP2α reduces nucleoplasmic lamin A/C staining in immunofluorescence.
(A) mEos3.2-Lmna WT and LAP2α KO sg1 cells were processed for immunofluorescence microscopy using antibody N18 against lamin A/C N-terminus, and DAPI to visualize DNA. Lamin A/C antibody N18 preferably stains nucleoplasmic lamin A/C. (B) mEos3.2-Lmna WT and LAP2α KO sg1 cells were co-cultured and processed for immunofluorescence microscopy as in (A) using antibodies N18 against lamin A/C and 1H11 against LAP2α, and DAPI to visualize DNA. Fluorescence intensity was determined for each cell along the dashed line in the red and green channel and is depicted in percent of maximum value in the graphs below. (C) LAP2α KO sg1 cells were processed as in (A) using lamin A/C antibody N18 without or with prior treatment with DNase I and RNase A to reverse N18 epitope masking. Bar: 10 μm. (D) Average nucleoplasmic fluorescence intensity from 3 wildtype and 3 LAP2α KO clones with and without prior DNase/RNase (D/R) treatment for N18 stainings and for mEos3.2 lamin A/C signal is depicted. Data represent averages ± S.E.M. Single data points are shown for each group. One-way ANOVA p value for N18 is 0.0020, F = 20.85; **p<0.01 (Tukey’s post-hoc test: WT vs. KO: p=0.0034; KO vs KO plus DNase/RNase: p=0.0033); p value for mEos3.2-lamin A/C is 0.3694 (non-significant), F = 1.181.
Figure 3—figure supplement 1
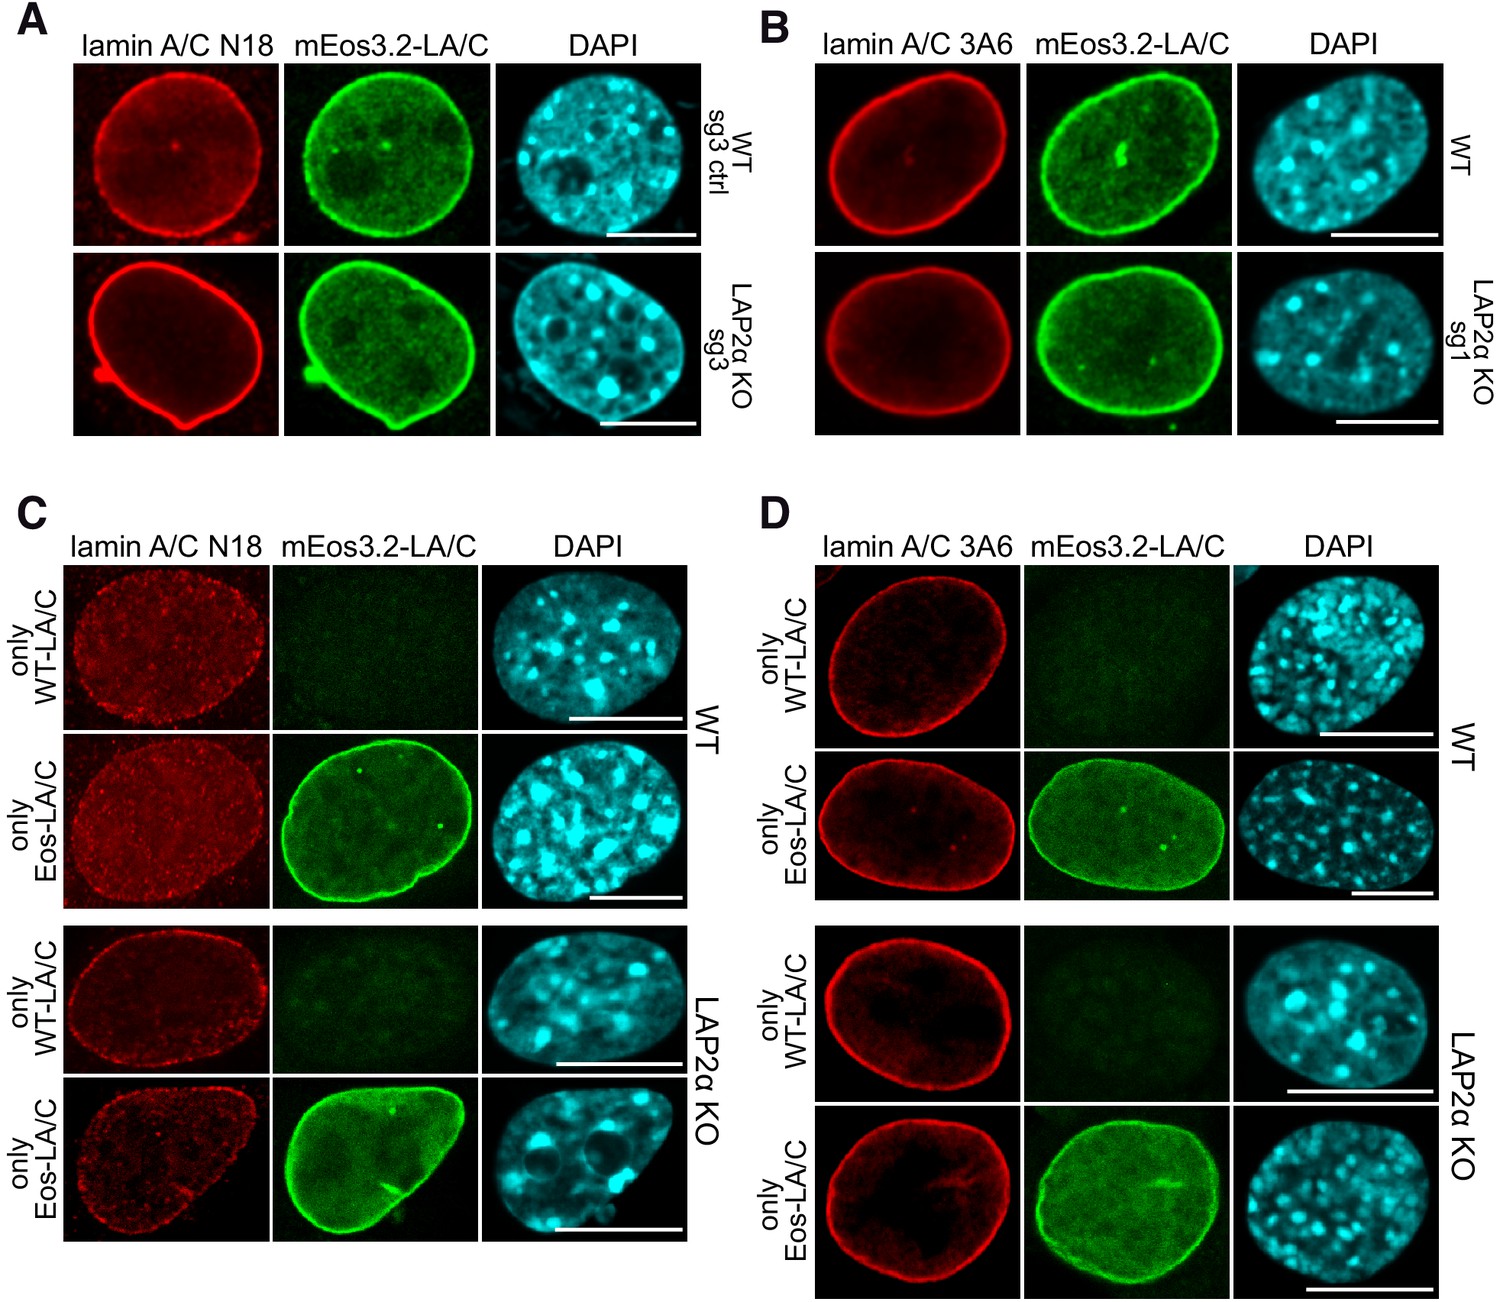
Nucleoplasmic lamin A/C antibody staining but not the mEos3.2 fluorescence signal is reduced in LAP2α knockout versus wild-type fibroblasts in fluorescence microscopy.
(A) mEos3.2-Lmna wildtype (WT) sg3 control (ctrl) and LAP2α knockout (KO) sg3 cells were processed for immunofluorescence microscopy using lamin A/C antibody N18 staining nucleoplasmic lamin A/C, and DAPI to visualize DNA. (B) mEos3.2-Lmna WT and LAP2α KO sg1 cells were processed as in (A) using lamin A/C antibody 3A6 staining mostly peripheral lamin A/C in both LAP2α WT and KO cells. (C, D) WT and LAP2α KO parental fibroblast cells expressing only WT untagged lamin A/C (LA/C) and cells expressing only mEos3.2-tagged lamin A/C (WT clone #5 and LAP2α KO clone #17, see Figure 2—figure supplement 1F) were processed for immunofluorescence microscopy using lamin A/C antibody N18 and 3A6 as indicated. Confocal images are shown in (A), (B), (C) and (D). Bar: 10 μm.
Figure 4 with 1 supplement
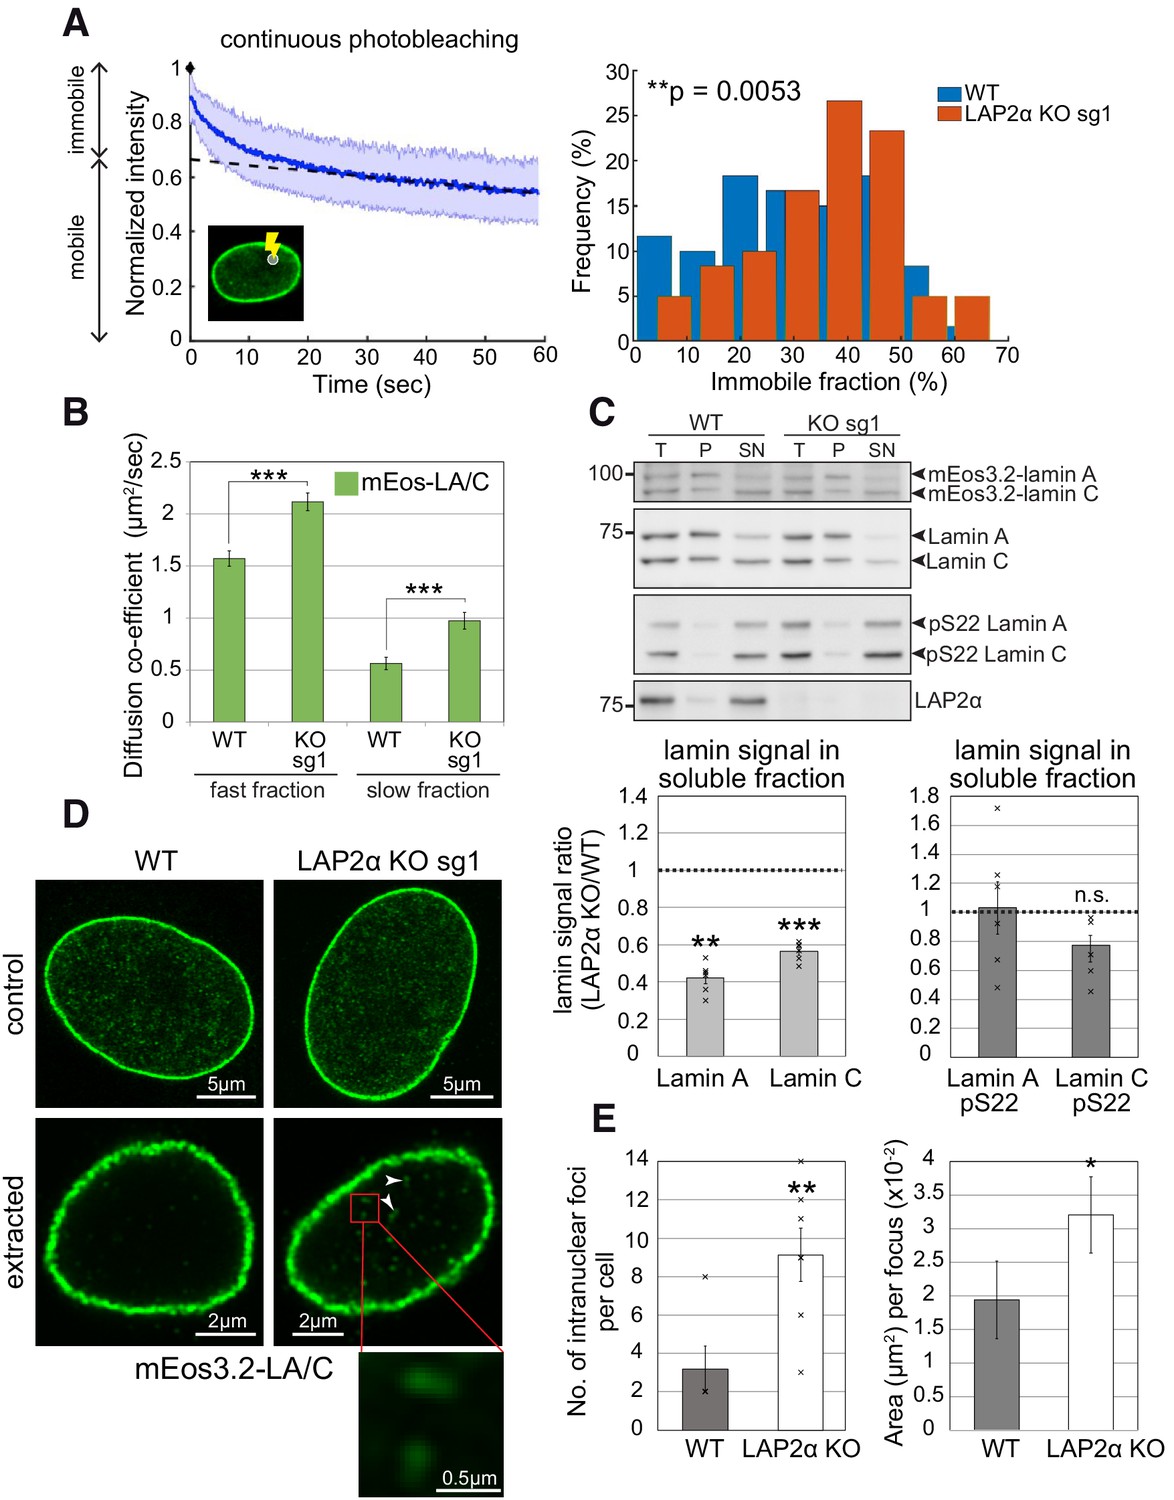
Nucleoplasmic lamin A/C is less mobile, more extraction-resistant and form larger assemblies in the absence of LAP2α.
(A) Left: Depicted is a representative curve obtained by continuous photobleaching (CP, see schematic inset on the lower left) using mEos3.2-lamin A/C WT cells, allowing to determine mobile and immobile fractions (shown on the left side of the graph) of the measured mEos3.2-lamin A/C. Blue line represents normalized average intensity of mEos3.2-lamin A/C measured over time from a selected spot inside the nucleus. Right: Immobile fractions of mEos3.2-lamin A and C protein as calculated from measured CP curves of mEos3.2-lamin A/C WT and LAP2α KO sg1 cells are depicted as histogram (see also Figure 4—source data 1). nWT = 59, nKO = 60, p=0.0053 (two-tailed student’s t test of arcsin transformed values). (B) Graph displays the diffusion co-efficient of fast and slow moving mEos3.2-lamins A and C as determined by fluorescence correlation spectroscopy (FCS) measurements (see also Figure 4—source data 2). Data represent averages ± S.E.M.; nWT (fast fraction)=106, nWT (slow fraction)=96, nKO (fast fraction)=97, nKO (slow fraction)=99; ***p<0.0001 (Mann-Whitney U test). (C) Cells from isogenic WT and LAP2α KO clones were extracted in salt and detergent-containing buffer (500 mM NaCl, 0.5% NP-40). Extracts were processed for Western blot analysis. Upper panel shows representative western blots from WT and LAP2α KO sg1 cells using antibodies against total lamin A/C (E1), lamin A/C phosphorylated at serine 22 (pS22) or LAP2α (1H11). T: total lysate; P: insoluble pellet fraction; SN: soluble, extracted supernatant fraction. Western blots were quantified and lamin signal in the supernatant was normalized to total lamin A/C. Graphs display lamins A and C levels in the supernatant fraction of LAP2α knockout samples as average fold difference ± S.E.M over wildtype samples. Single data points are shown for each group. nWT = 6, nKO = 6; **p=0.00013, ***p=2.09E-5, n.s.: non-significant (p=0.072) (paired student’s t-test on log transformed values). (D) mEos3.2-lamin A/C WT and LAP2α KO sg1 cells were processed for immunofluorescence microscopy with and without prior extraction in salt and detergent-containing buffer. Confocal super-resolution (Airyscan) images of mEos3.2-lamin A/C signal are depicted. Larger lamin A/C nucleoplasmic structures in LAP2α knockout cells are marked by arrowheads and displayed as larger inset (bottom). (E) Graphs show quantification of number (No.) of intranuclear lamin A/C structures per cell and mean area per structure. Data represent averages ± S.E.M. Left graph: nWT = 5, nKO = 7 (single data points are displayed), p=0.0076 (Mann-Whitney U test); right graph: nWT = 16, nKO = 64, p=0.0433 (Mann-Whitney U test); *p<0.05, **p<0.01.
-
Figure 4—source data 1
Immobile mEos3.2-lamin A/C fraction in the nucleoplasm of WT and LAP2α KO cells determined by constant photobleaching.
- https://cdn.elifesciences.org/articles/63476/elife-63476-fig4-data1-v2.xlsx
-
Figure 4—source data 2
Diffusion co-efficient of fast and slow moving mEos3.2-lamins A and C in WT and LAP2α KO cells as determined by FCS.
- https://cdn.elifesciences.org/articles/63476/elife-63476-fig4-data2-v2.xlsx
Figure 4—figure supplement 1
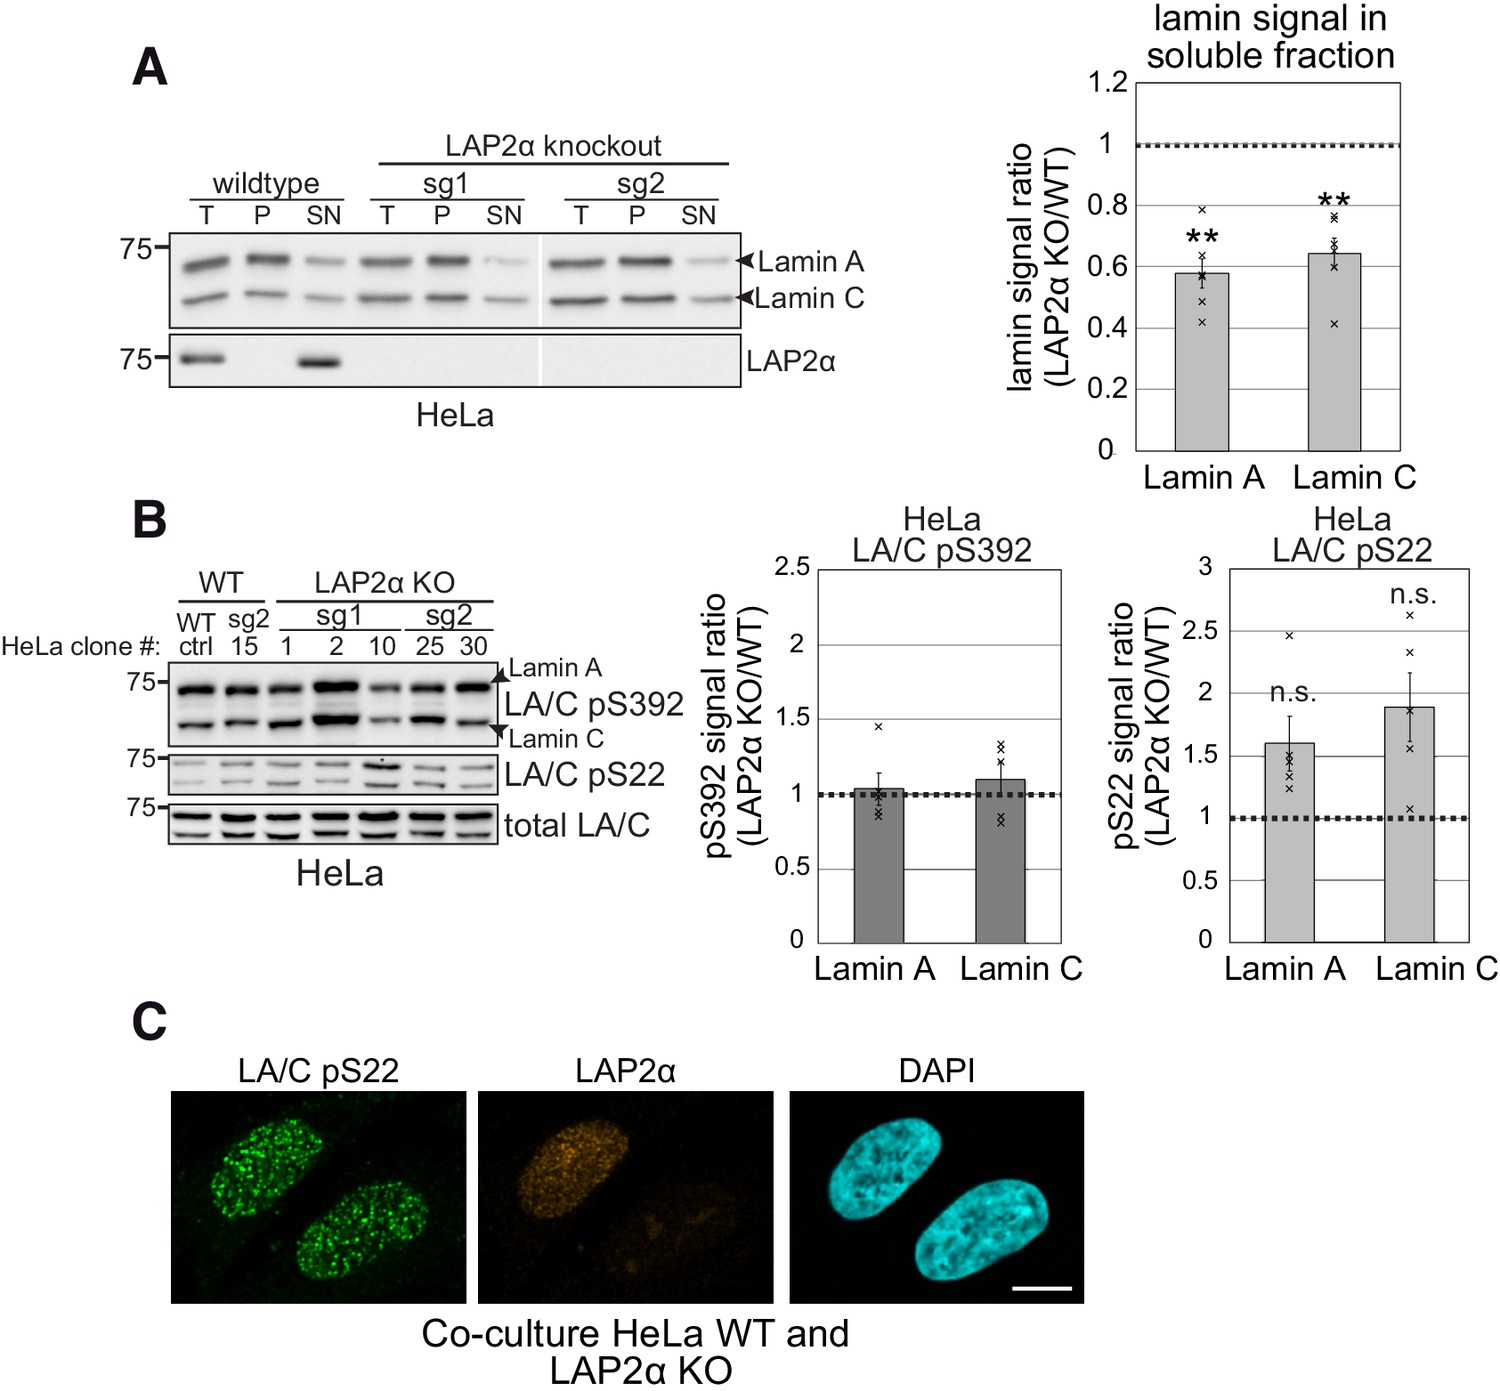
Nucleoplasmic lamins A and C are more resistant to extraction in the absence of LAP2α in HeLa cells without detectable changes in lamin phosphorylation.
(A) Wildtype and LAP2α knockout HeLa cells were extracted in salt and detergent-containing buffer (150 mM NaCl, 0.5% NP-40). Extracts were processed for western blot analysis. Left panel shows a representative western blot of wild-type cells and two LAP2α knockout clones generated with sgRNA1 and 2, respectively, targeting LAP2α-specific exon 4 (see Figure 1—figure supplement 1), using antibodies against lamin A/C (E1) or LAP2α (Ab15-2). T: total lysate; P: insoluble pellet fraction; SN: soluble, extracted supernatant fraction. Western blots were quantified and lamin signal in the supernatant was normalized to total lamin A/C signal. Graph displays lamins A and C levels in the supernatant fraction of LAP2α knockout samples as average fold difference ± S.E.M over wild-type samples. nWT = 3, nKO = 6 (single data points are displayed); **p<0.01 (pLA = 0.0073, pLC = 0.0077; unpaired, two-tailed student’s t test). (B) LAP2α KO or WT HeLa clones were processed for western blotting using antibodies against lamin A/C phosphorylated at specific residues as indicated or a pan-lamin A/C antibody (E1). Western blot signals for phosphorylated lamins were quantified, normalized to total lamins A and C and expressed as fold difference to the WT samples (graphs on the right). Graphs display average fold difference ± S.E.M. nWT = 2, nKO = 5 (single data points are displayed), n.s.: non-significant (pLA = 0.15, pLC = 0.11; unpaired, two-tailed student’s t test). (C) LAP2α KO or WT HeLa clones were co-cultured and processed for immunofluorescence microscopy using antibodies specific to lamin A/C phosphorylated at serine 22 (LA/C pS22) or LAP2α (1H11), and DAPI to visualize DNA. Bar: 10 μm.
Figure 5
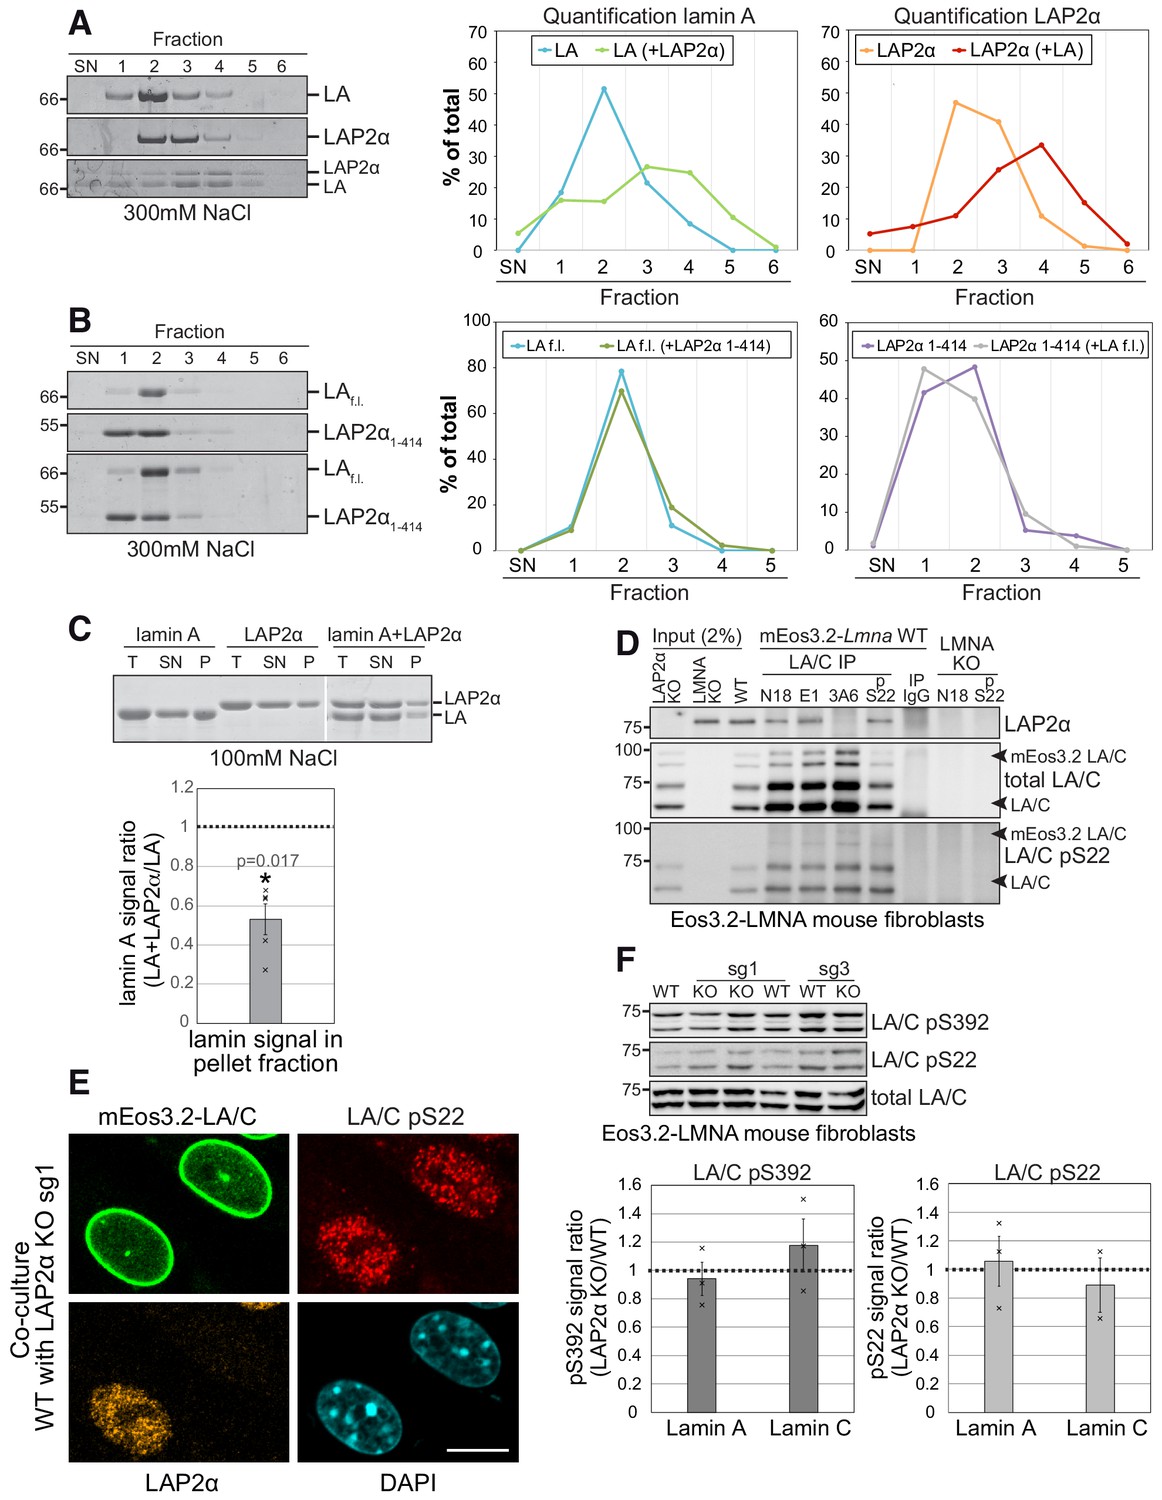
LAP2α binds to lamin A/C and inhibits their assembly without altering lamin phosphorylation.
(A, B). Purified recombinant lamin A and LAP2α full length (f.l.) (A) or lamin A-binding mutant LAP2α1-414 (B) were dialyzed either alone or together into assembly buffer with 300 mM NaCl. Samples were separated on a 10% to 30% sucrose gradient, followed by collection of fractions and quantification of protein bands. Exemplary Coomassie stained gels of fractions ,supernatant’ (SN) to six are shown on the left. The calculated protein amount per fraction (% of total protein) was plotted as curve chart on the right. (C) Lamin A and LAP2α were dialyzed either alone or together into assembly buffer as in (D), but with 100 mM NaCl, enabling formation of higher assembly lamin structures. After centrifugation, total (T), supernatant (SN) and pellet (P) fractions were analyzed on a Coomassie gel, protein bands were quantified and normalized to total protein levels. Graph displays lamin A levels in the pellet fraction of mixed samples (lamin A + LAP2α) as average fold difference ± S.E.M over samples with lamin A alone, n = 5 (single data points are displayed). (D) Lamin A/C was immunoprecipitated from mEos3.2-lamin A/C WT cells and LAP2α and lamin A/C knockout controls using the indicated antibodies recognizing different regions of lamin A/C. Immunoprecipitates were analyzed by western blotting using the indicated antibodies (anti lamin A/C 3A6, anti pS22 lamin A/C, anti LAP2α 1H11). (E) mEos3.2-Lmna WT and LAP2α KO sg1 cells were co-cultured and processed for immunofluorescence microscopy using antibodies specific to lamin A/C phosphorylated at serine 22 (LA/C pS22), antibody 1H11 against LAP2α, and DAPI to visualize DNA. Bar: 10 μm. (F) Isogenic LAP2α KO or WT clones were processed for western blotting using antibodies against lamin A/C phosphorylated at specific residues as indicated or a pan-lamin A/C antibody (E1). Western blot signals for phosphorylated lamins were quantified, normalized to total lamins A and C and expressed as fold difference to the WT samples (graphs on the right). Graphs display average fold difference ± S.E.M. nWT = 3, nKO = 3 (single data points are displayed), p values (paired student’s t-test on log transformed values) are: lamin A pS392 p = 0.602, lamin C pS392 p = 0.493, lamin A pS22 p = 0.841, lamin C pS22 p = 0.826 (non-significant).
Figure 6 with 1 supplement
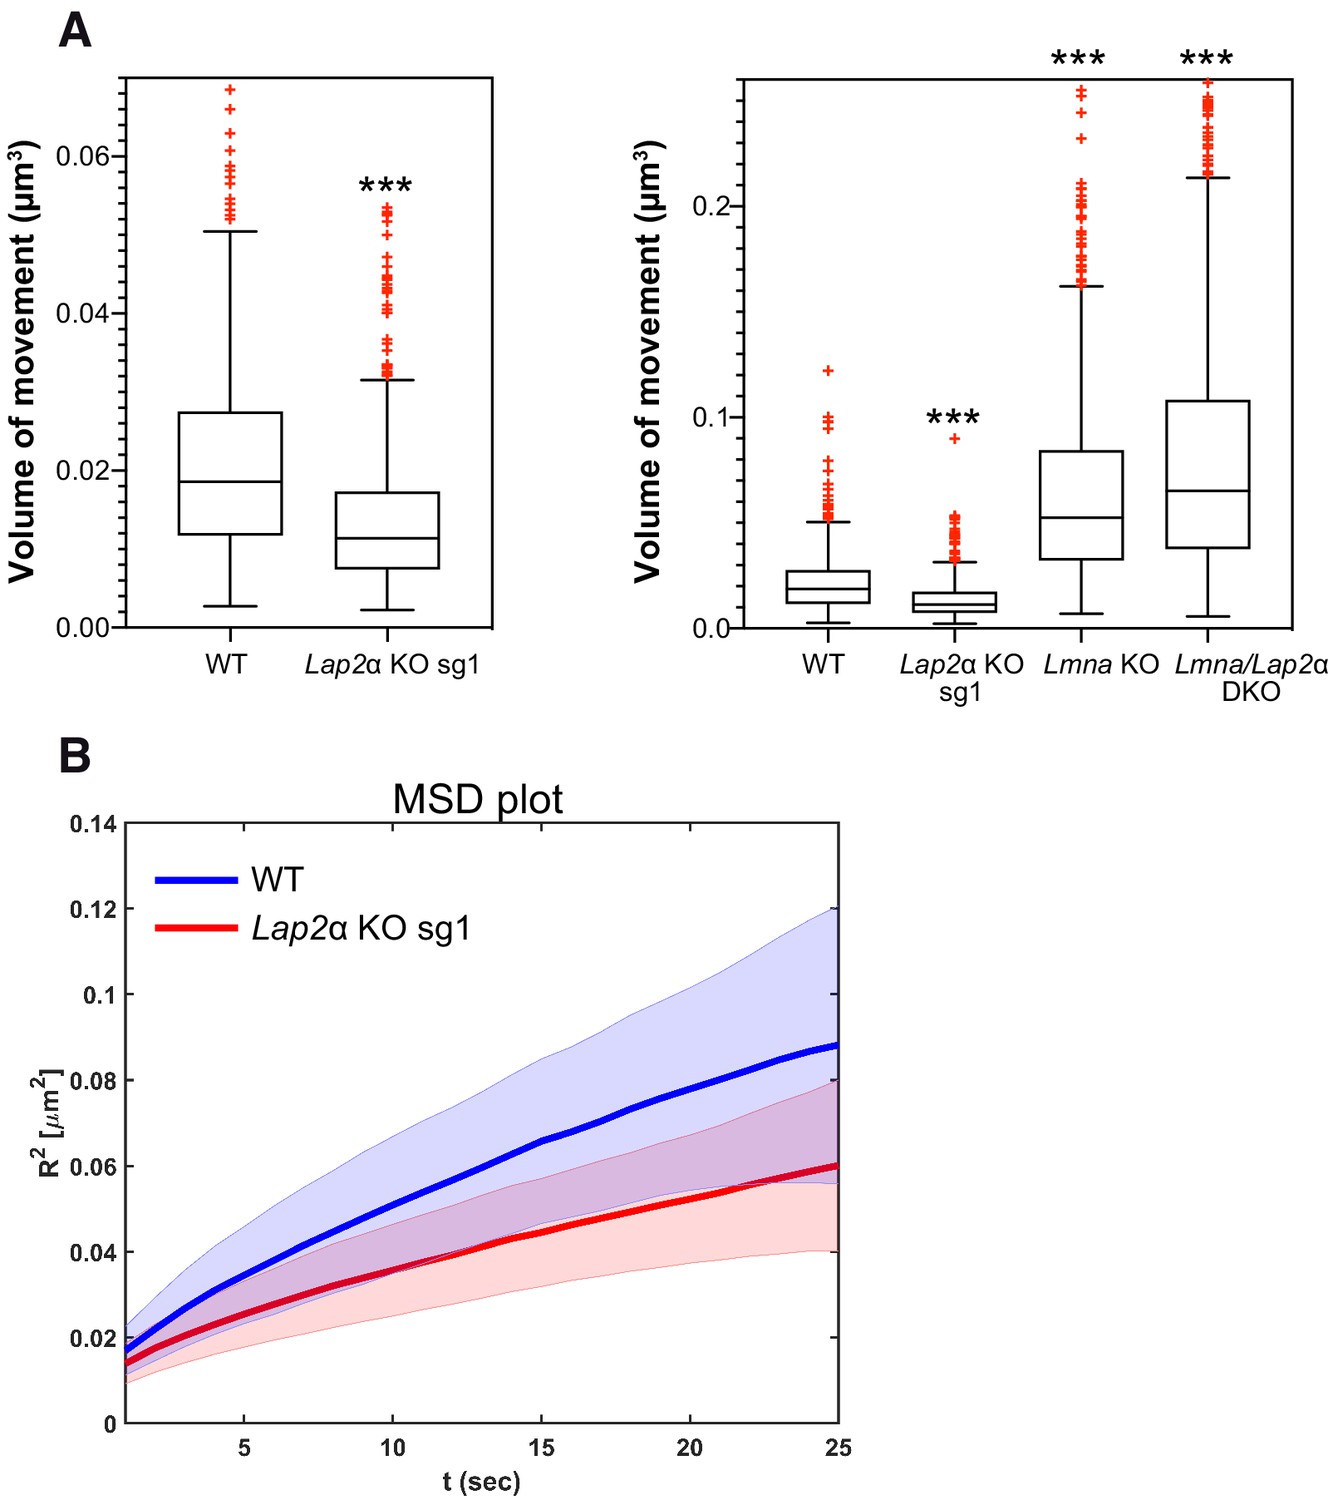
Lower lamin A/C mobility in the absence of LAP2α leads to a reduction in telomere movement.
mEos3.2-Lmna WT or mEos3.2-Lmna fibroblasts lacking LAP2α (Lap2α KO sg1), lamin A/C (Lmna KO, see Figure 6—figure supplement 1), or both (Lmna/Lap2α DKO) were transiently transfected with a plasmid expressing DsRed-TRF1 to fluorescently label telomeres. The volume of telomere motion was then calculated based on its trajectory. (A) Box plots compare telomere motion between WT and Lap2α KO sg1 (left; ***p<0.0001 using Mann-Whitney U test, effect size d = 0.62) or between all four genotypes (right; Kruskal-Wallis test p<0.0001; post tests for WT ctrl versus each genotype are all highly significant with ***p<0.0001). The median is depicted within the first and third quartiles; whiskers: minimal and maximal datapoint excluding outliers (see also Figure 6—source data 1). (B) Mean square displacement (MSD) curves for telomere diffusion in mEos3.2-Lmna WT and LAP2α KO sg1 cells. The shaded area shows the distribution of 70% of the population. nWT = 471, nLap2αKO=562, nLmnaKO = 925, nDKO = 1298.
-
Figure 6—source data 1
Volume of telomere movement in WT, LAP2α KO, Lmna KO and DKO cells.
- https://cdn.elifesciences.org/articles/63476/elife-63476-fig6-data1-v2.xlsx
Figure 6—figure supplement 1
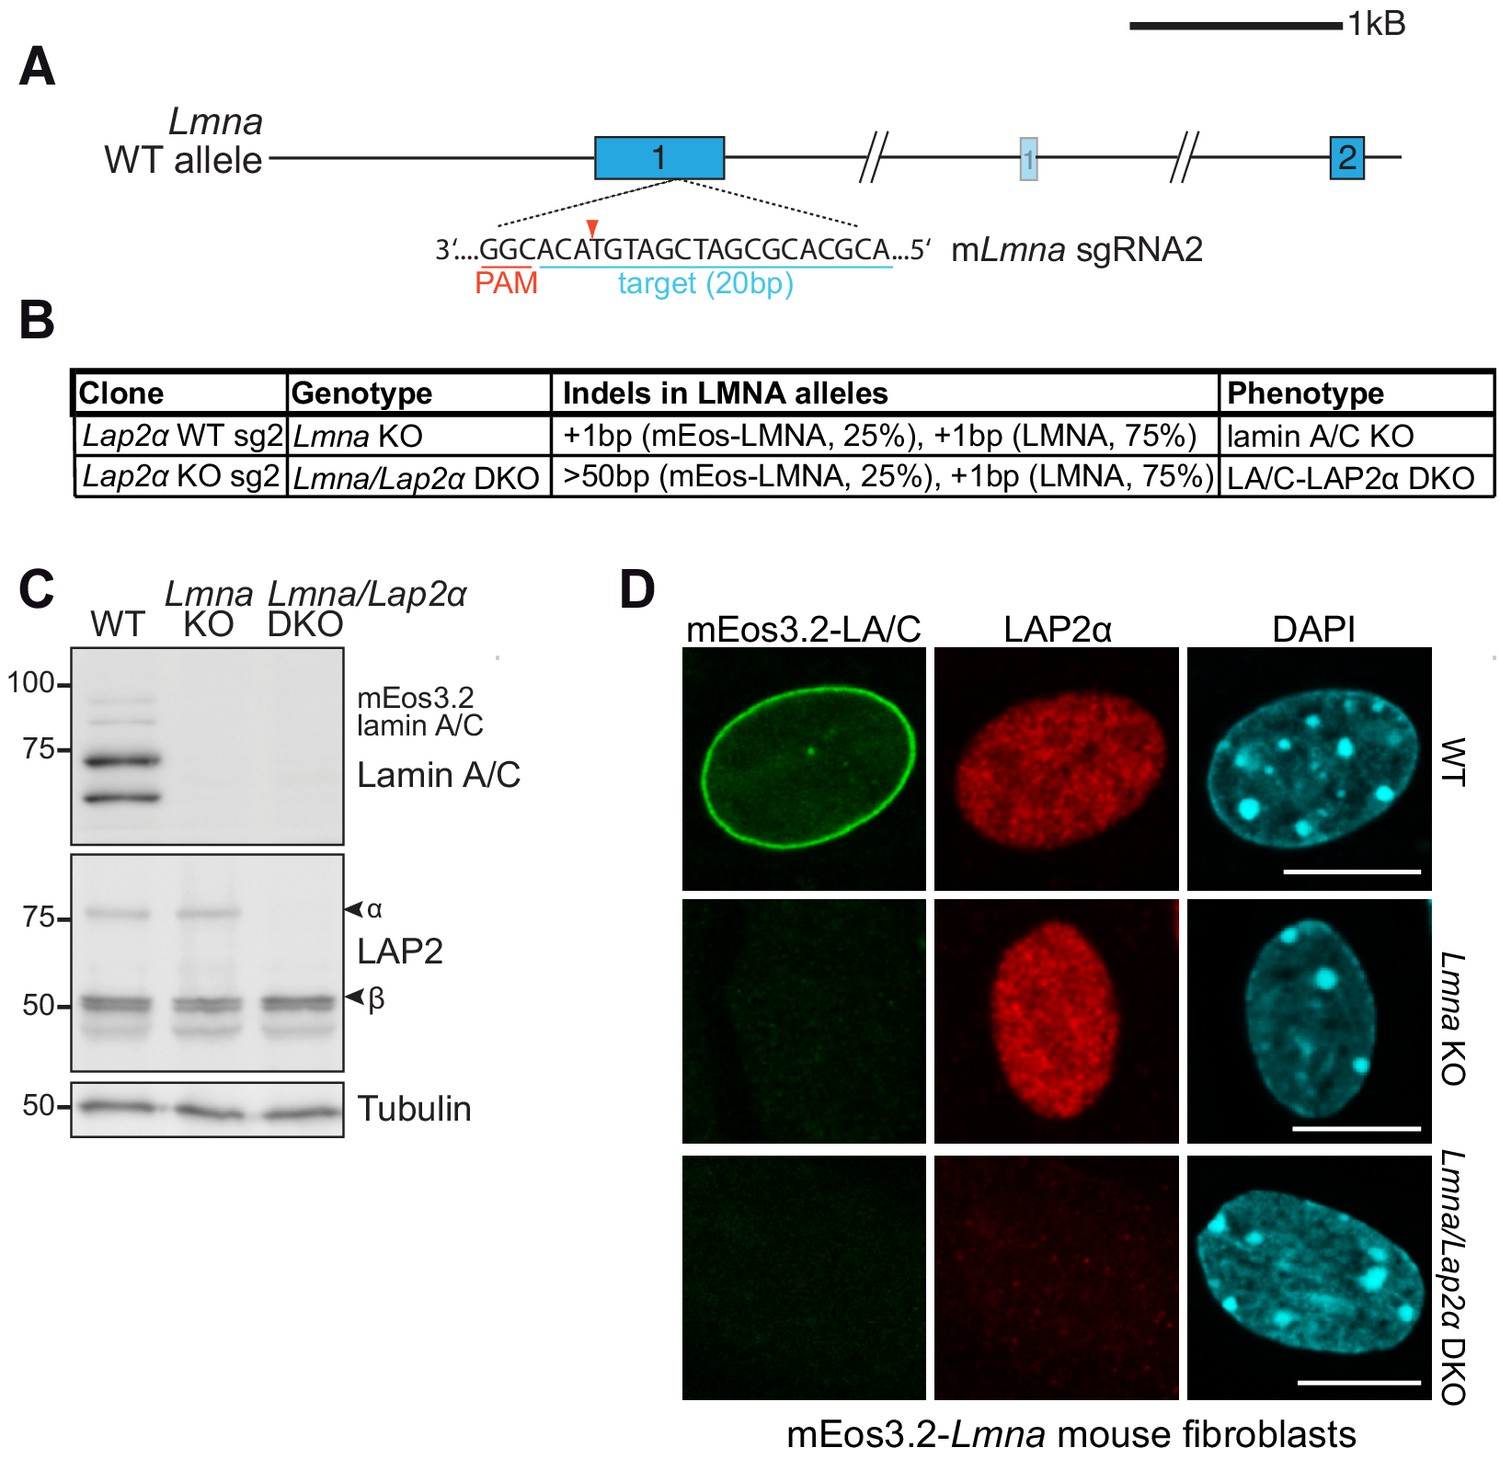
Generation of isogenic Lmna knockout and Lmna/Lap2α double knockout mouse fibroblasts using CRISPR-Cas9.
(A) Schematic view of exons 1 and 2 (bars) and adjacent introns of the mouse Lmna locus. Very long introns are not displayed in their original length as indicated by a double slash. The second, light-colored exon 1 encodes the N-terminus of meiosis-specific lamin C2. The target sequence of Lmna-specific sgRNA2 in exon 1 is shown (blue). Protospacer-adjacent motif (PAM) is marked in red. Red arrowhead; expected Cas9 cut site. (B) Summary of generated isogenic Lmna knockout clones (using mEos3.2-Lmna WT cells) and Lmna/Lap2α double knockout clones (using mEos3.2-Lmna LAP2α knockout cells) and their detected Indels as determined by TIDE analysis. Alleles with deletions > 50 bp cannot be analyzed by TIDE. Clonal phenotypes are described based on data in (C). (C) Isogenic clones were processed for Western blot analysis using antibodies to lamin A/C (E1), the LAP2 common N-terminal domain and γ-tubulin as loading control. (D) Isogenic clones and mEos3.2-Lmna WT control cells were processed for immunofluorescence microscopy using antibodies against LAP2α (1H11) and DAPI to stain DNA and analyzed using an LSM 710 confocal microscope. Bar: 10 μm.
Figure 7

Model of LAP2α-dependent regulation of A-type lamins in the nucleoplasm.
LAP2α dynamically interacts with lamins A and C in the nucleoplasm, independent of their phosphorylation status. While lamins at the periphery interact mainly with heterochromatic lamina-associated domains (LADs), nucleoplasmic A-type lamins and LAP2α bind to euchromatic genome regions regulating chromatin mobility. When hypophosphorylated lamins are not bound to LAP2α, they form larger, stable assemblies in the nucleoplasm. In the absence of LAP2α, these lamin A/C structures become more frequent, leading to altered, putatively less dynamic lamin A/C chromatin interaction and slower chromatin movement.
Tables
Key resources table
| Reagent type (species) or resource | Designation | Source or reference | Identifiers | Additional information |
|---|---|---|---|---|
| Gene (Mus musculus) | Lmna | GenBank | Gene:ID_16905 | |
| Gene (M. musculus) | Tmpo; Lap2 | GenBank | Gene:ID_21917 | |
| Gene (Homo sapiens) | TMPO; LAP2 | GenBank | Gene:ID_7112 | |
| Strain, strain background (E.c oli) | NEB5-alpha Competent E. coli (high efficiency) | New England Biolabs | Cat# C2987 | Chemically competent |
| Strain, strain background (E. coli) | BL21-CodonPlus (DE3) | PMID:10562549 | ||
| Cell line (M. musculus) | mEos3.2-Lmna wildtype dermal fibroblasts | This paper | See Materials and methods, section ‘Generation and cultivation of cell lines’ | |
| Cell line (M. musculus) | mEos3.2- Lmna LAP2α knockout fibroblasts | This paper | See Materials and methods, section ‘Generation and cultivation of cell lines’ | |
| Cell line (M. musculus) | mEos3.2- Lmna lamin A/C knockout fibroblasts | This paper | See Materials and methods, section ‘Generation and cultivation of cell lines’ | |
| Cell line (M. musculus) | mEos3.2- Lmna LAP2α-lamin A/C double knockout fibroblasts | This paper | See Materials and methods, section ‘Generation and cultivation of cell lines’ | |
| Cell line (H. sapiens) | LAP2α knockout HeLa cells | This paper | See Materials and methods, section ‘Generation and cultivation of cell lines’ | |
| Transfected construct (M. musculus) | Lmna-targeting construct | This paper | See Materials and methods, section ‘Generation of Lmna-specific targeting construct’ | |
| Transfected construct (M. musculus and H. sapiens) | sgRNAs targeting Lmna or Lap2 in pX458 | This paper | See Materials and methods, section ‘Generation and cultivation of cell lines’ | |
| Antibody | Anti-LAP2α (rabbit, polyclonal) | PMID:11864981 | WB (1:5000) IF (1:800) | |
| Antibody | Anti-LAP2α 1H11 (mouse, monoclonal) | Max Perutz Labs Monoclonal Antibody facility, see also PMID:26798136 | WB (1:100) IF (1:30) | |
| Antibody | Anti-LAP2α Ab15-2 (mouse, monoclonal) | PMID:9707448 | WB (undiluted hybridoma supernatant) | |
| Antibody | Anti-LAP2 Ab12 (mouse, monoclonal) | PMID:9707448 | WB (1:4) | |
| Antibody | Anti-lamin A/C 3A6 (mouse, monoclonal) | Max Perutz Labs Monoclonal Antibody facility, see also PMID:26798136 | WB (1:50) IF (1:50) | |
| Antibody | Anti-lamin A/C E1 (mouse, monoclonal) | Santa Cruz Biotechnology | Cat# sc-376248, RRID: AB_10991536 | WB (1:1000) IF (1:100) |
| Antibody | Anti-lamin A/C N18 (goat, polyclonal) | Santa Cruz Biotechnology | Cat# sc-6215, RRID:AB_648152 | WB (1:1000) IF (1:100) |
| Antibody | Anti-lamin A/C pS22 (rabbit polyclonal) | Invitrogen/ Thermo Fisher Scientific | Cat# PA5-17113, RRID: AB_10989809 | WB (1:200) IF (1:50) |
| Antibody | Anti-lamin A/C pS22 D2B2E (rabbit, monoclonal) | Cell Signaling | Cat# 13448, RRID:AB_2798221 | IP (5 μl/IP) |
| Antibody | Anti-lamin A/C pS392 (rabbit, polyclonal) | Abcam | Cat# ab58528, RRID:AB_883054 | WB (1:500) |
| Antibody | Anti-lamin B1 (rabbit, polyclonal) | Proteintech | Cat# 12987–1-AP, RRID: AB_2136290 | WB (1:500) IF (1:100) |
| Antibody | Anti-mEos2 (rabbit polyclonal) | Badrilla | Cat# A010-mEOS2, RRID: AB_2773027 | IF (1:200) |
| Antibody | Anti-γ-tubulin GTU88 (mouse, monoclonal) | Sigma Aldrich | Cat# T6557, RRID:AB_477584 | WB (1:5000) |
| Antibody | Anti-actin I-19 (goat, polyclonal) | Santa Cruz Biotechnology | Cat# sc-1616, RRID:AB_630836 | WB (1:500) |
| Recombinant DNA reagent | pSpCas9(BB)−2A-GFP; pX458 (plasmid) | Addgene | RRID:Addgene_48138 | sgRNAs targeting Lmna or Lap2 were inserted into this vector |
| Recombinant DNA reagent | pSpCas9(BB)−2A-mCherry (plasmid) | This paper | See Materials and methods, section ‘Vectors’ | |
| Recombinant DNA reagent | pEGFP-myc-Lamin A (plasmid) | This paper | See Materials and methods, section 'Vectors' | |
| Recombinant DNA reagent | dsRed-TRF1 (plasmid) | PMID:26299252 | ||
| Sequence-based reagent | hLAP2α sgRNA1 | This paper | sgRNA | AGTTCGGTACTGCCCAAAGG |
| Sequence-based reagent | hLAP2α sgRNA2 | This paper | sgRNA | GGAACTACTCCCTCTGGTGG |
| Sequence-based reagent | mLmna sgRNA1 | This paper | sgRNA | CACTCGGATCACCCGGCTGC |
| Sequence-based reagent | mLmna sgRNA2 | This paper | sgRNA | ACGCACGCGATCGATGTACA |
| Sequence-based reagent | mLap2α sgRNA1 | This paper | sgRNA | AGTTCAGTCCTGCCCAAAGG |
| Sequence-based reagent | mLap2α sgRNA3 | This paper | sgRNA | CAAGAAAGTGAAGTCCGCTA |
| Peptide, recombinant protein | Q5 High Fidelity DNA polymerase | New England Biolabs | Cat# M0491 | |
| Commercial assay or kit | RevertAid First Strand cDNA synthesis kit | Thermo Fisher Scientific | Cat# K1622 | |
| Commercial assay or kit | KAPA SYBR Green 2x PCR master mix | Kapa Biosystems | Cat# KK4602 | |
| Commercial assay or kit | Gibson assembly master mix | New England Biolabs | Cat# E2611 | |
| Commercial assay or kit | GoTaq green master mix | Promega | Cat# M7122 | |
| Software, algorithm | TIDE | PMID:25300484 | https://tide.nki.nl/ | |
| Software, algorithm | Visiview 4.4 software | Visitron systems | ||
| Software, algorithm | FIJI | Open source | RRID:SCR_002285 | https://imagej.net/Fiji |
| Software, algorithm | Zeiss ZEN 2.1 software | Zeiss | ||
| Software, algorithm | Matlab | MathWorks | RRID:SCR_001622 | |
| Software, algorithm | SymPho Time software | PicoQuant |
Additional files
Download links
A two-part list of links to download the article, or parts of the article, in various formats.
Downloads (link to download the article as PDF)
Open citations (links to open the citations from this article in various online reference manager services)
Cite this article (links to download the citations from this article in formats compatible with various reference manager tools)
LAP2alpha maintains a mobile and low assembly state of A-type lamins in the nuclear interior
eLife 10:e63476.
https://doi.org/10.7554/eLife.63476


