Tendon and motor phenotypes in the Crtap-/- mouse model of recessive osteogenesis imperfecta
- Department of Molecular and Human Genetics, Baylor College of Medicine, United States
- Department of Orthopaedics and Sports Medicine, University of Washington, United States
- Shriners Hospital for Children, United States
- Department of Orthopaedic Surgery, UT Health Sciences Center, United States
Figures
Figure 1
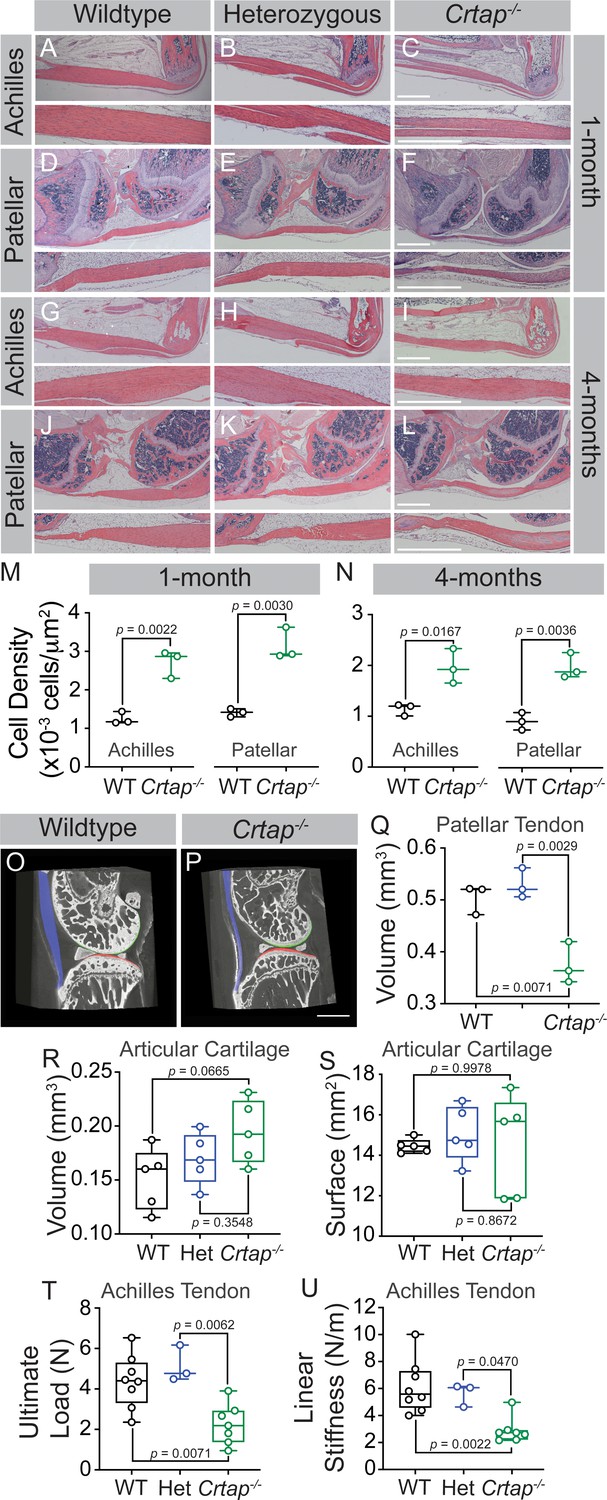
Loss of CRTAP causes thinning, hypercellularity, and weakening of tendons in young and mature mice.
(A–C) Representative H & E images of 1-month ankle joints. (D–F) Representative H & E images of 1-month knee joints. (G–I) Representative H & E images of 4-month ankle joints. (J–L) Representative H & E images of 4-month knee joints. For all micrographs, higher magnification images of the mid-tendon are illustrated. n = 3–4 mice per group. Scale bar is 1 mm. (M–N) Quantification of cell density for Achilles and patellar tendons of wildtype and Crtap-/- mice at 1 month (M) and 4 months (N) of age. Data are min-to-max box and whisker plots with individual points indicated. n = 3 mice per group. Data passed the Shapiro-Wilk test for normality, and groups were compared using two-tailed unpaired t-tests. Exact p-values are reported. (O–P) Representative phase-contrast μCT images of 4-month wildtype (O) and Crtap-/- (P) knee joints. Blue indicates the patellar tendon, green indicates the femoral articular cartilage, and red indicates the tibial articular cartilage. Scale bar is 1 mm. (Q) Quantification of the patellar tendon volume in wildtype, heterozygous, and Crtap-/- mice at 4-months. Data are min-to-max box and whisker plots with individual points indicated. n = 3 mice per group. Data passed the Shapiro-Wilk test for normality, and groups were compared using one-way ANOVA with Tukey’s post-hoc tests. Exact p-values are reported. (R–S) Quantification of articular cartilage volume (R) and surface (S) in wildtype, heterozygous, and Crtap-/- mice at 4-months. Data are min-to-max box and whisker plots with individual points indicated. n = 5 mice per group. Data passed the Shapiro-Wilk test for normality, and groups were compared using one-way ANOVA with Tukey’s post-hoc tests. Exact p-values are reported. (T–U) Biomechanical assessment of ultimate load (T) and linear stiffness (U) for Achilles tendons from 1-month-old wildtype, heterozygous, and Crtap-/- mice. Data are min-to-max box and whisker plots with individual points indicated. n = 3–8 mice per group. Data passed the Shapiro-Wilk test for normality, and groups were compared using one-way ANOVA with Tukey’s post-hoc tests. Exact p-values are reported.
Figure 2
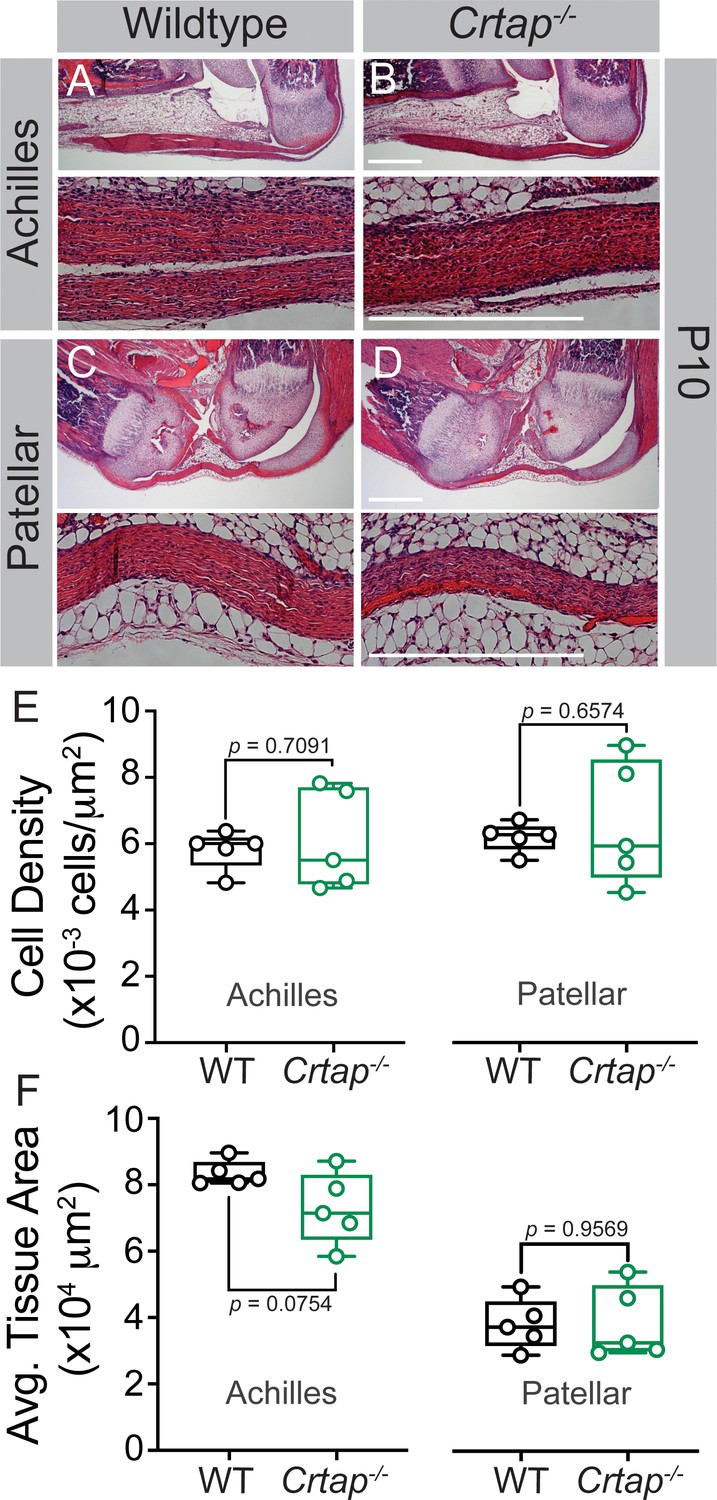
Tendon thinning and hypercellularity are not observed in Crtap-/- mice at postnatal day 10.
(A–B) Representative H & E images of postnatal day 10 (P10) ankle joints. (C–D) Representative H & E images of P10 knee joints. For all micrographs, higher magnification images of the mid-tendon are illustrated. n = 5 mice per group. Scale bar is 0.5 mm. (E) Quantification of cell density and (F) Average tissue area for Achilles and patellar tendons of wildtype and Crtap-/- mice at P10 (taken mid-tendon). Data are min-to-max box and whisker plots with individual points indicated. n = 5 mice per group. Data passed the Shapiro-Wilk test for normality, and groups were compared using two-tailed unpaired t-tests. Exact p-values are reported.
Figure 3
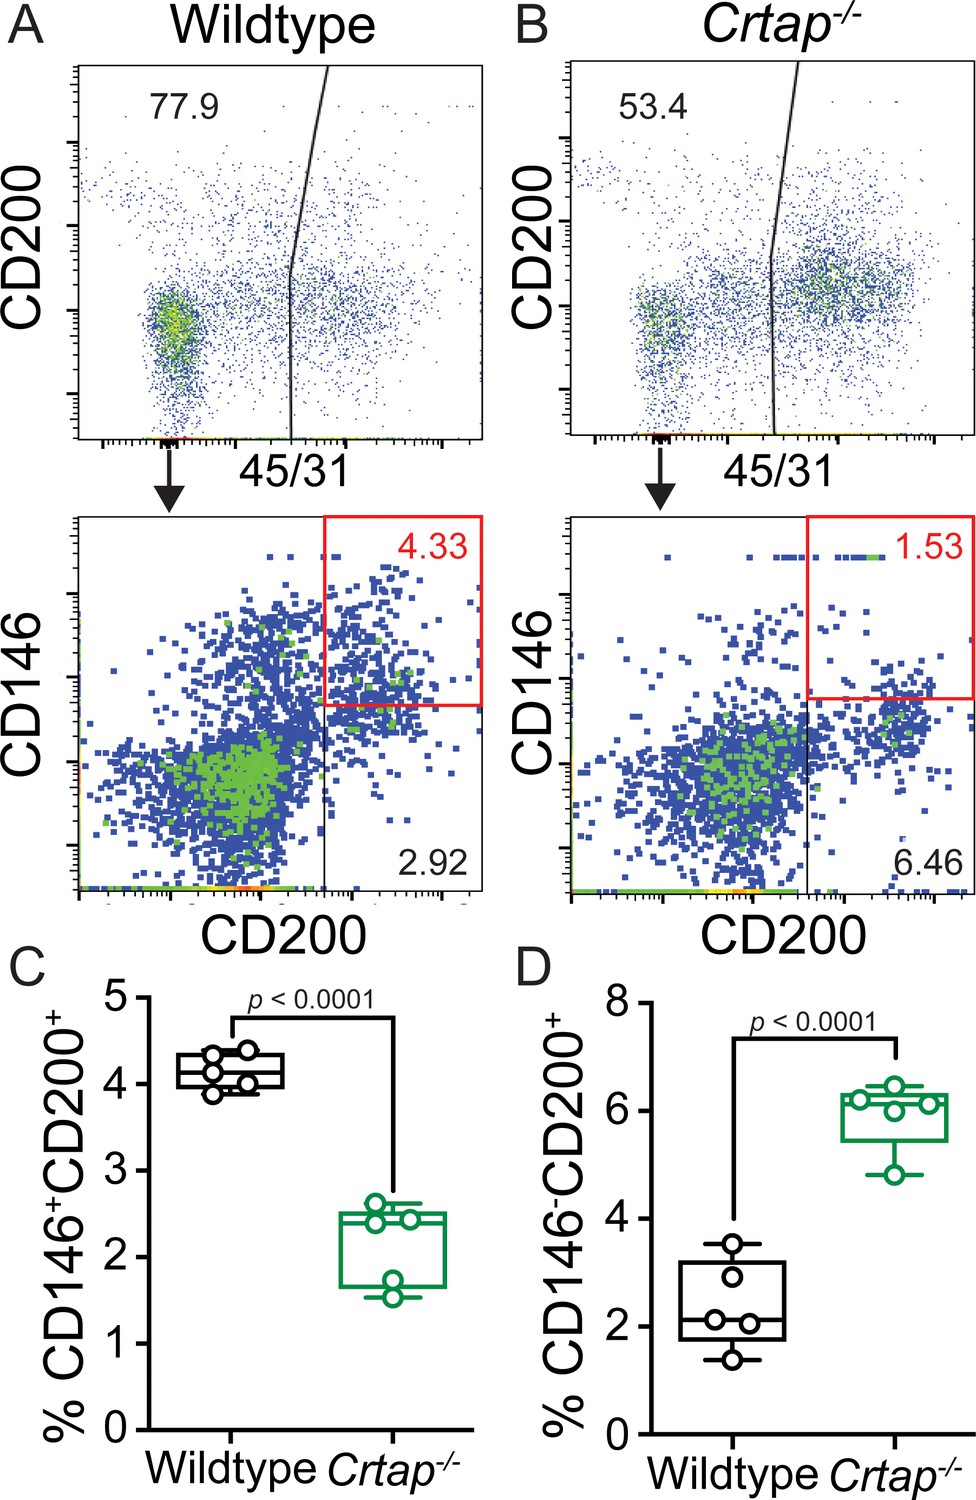
Loss of CRTAP in the patellar tendon leads to a decrease in progenitor cells and an accumulation of immature resident tissue cells.
(A–B) Patellar tendon cells isolated from 5-month-old wildtype (A) or Crtap-/- (B) mice were analyzed for the expression of CD200 and CD146 tendon progenitor markers (top histogram) within the CD45-CD31- population (bottom histogram). The plots are representative from a single wildtype or Crtap-/- mouse. (C–D) Graphs show the percentage of CD45-CD31-CD146+CD200+ progenitor cells (C) and CD45-CD31-CD146-CD200+ immature tendon cells (D) From 5-month wildtype and Crtap-/- patellar tendons. Data are min-to-max box and whisker plots with individual points indicated. n = 5 mice per group. Data passed the Shapiro-Wilk test for normality, and groups were compared using two-tailed unpaired t-tests. Exact p-values are reported.
Figure 4
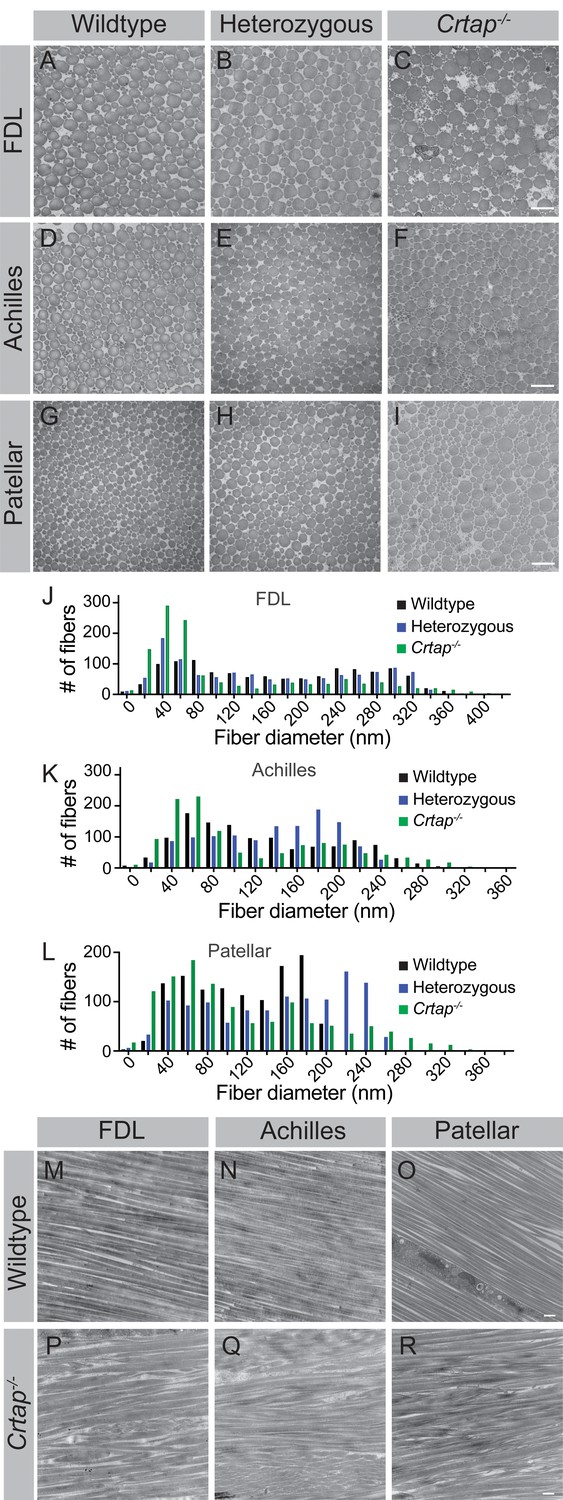
Collagen fibril diameter is altered in tendons from heterozygous and Crtap-/- mice.
(A–C) Representative transverse TEM images of 4-month (A–C) FDL tendon collagen fibrils, (D–F) Achilles tendon collagen fibrils, and (G–I) patellar tendon collagen fibrils. Scale bar is 500 nm. (J) Representative histogram of the size distribution for collagen fibrils in FDL tendons. Data are representative of n = 3 mice. (K) Representative histogram of the size distribution for collagen fibrils in Achilles tendons. Data are representative of n = 3 mice. (L) Representative histogram of the size distribution for collagen fibrils in patellar tendons. Data are representative of n = 3 mice per group. (M–R) Representative longitudinal TEM images of 4-month wildtype FDL (M), Achilles (N), and patellar (O) tendons, and 4-month Crtap-/- FDL (P), Achilles (Q), and patellar (R) tendons. Scale bar is 500 nm.
Figure 5

Collagen cross-linking is increased in tendons from young and mature Crtap-/- mice.
Quantification of collagen cross-links as hydroxylysyl-pyridinoline (HP) residues per collagen molecule for (A) FDL tendons; (B) Achilles tendons; and (C) patellar tendons. Data are shown as means ± S.D. n = 3–4 mice per group. Data passed the Shapiro-Wilk test for normality, and groups were compared using one-way ANOVA with Tukey’s post-hoc tests. Exact p-values are reported.
Figure 6
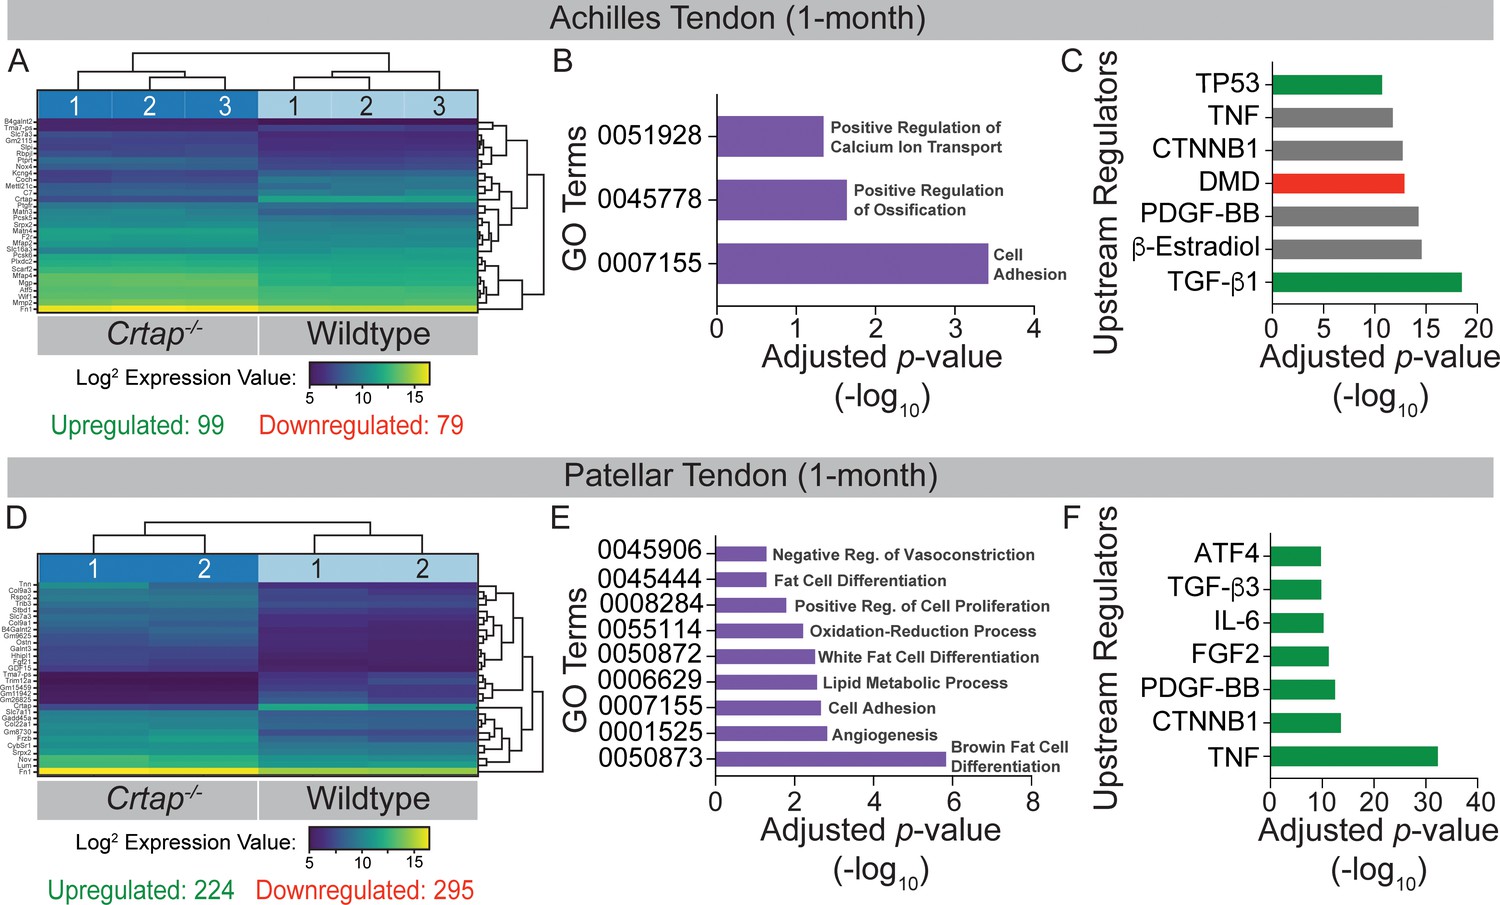
Transcriptome analysis of tendons from 1-month-old Crtap-/- mice.
DESeq2 was used to compare gene expression between wildtype and Crtap-/- Achilles and patellar tendon RNA samples, and genes with an adjusted p-value<0.05 and absolute log2 fold change >1 were considered as differentially expressed. (A) A bi-clustering heatmap of the top 30 differentially expressed genes between wildtype and Crtap-/- Achilles tendons sorted by adjusted p-value and plotted according to log2 transformed expression values. The Wald test was used to generate p-values and log2 fold changes. See Figure 6—source data 1 for a complete list of differentially regulated genes. (B) Significantly differentially expressed genes between Achilles tendons from wildtype and Crtap-/- mice were clustered by their gene ontology, and enrichment for gene ontology terms was tested using Fisher exact test. All gene ontology terms with an adjusted p-value<0.05 are plotted according to their -log10 adjusted p-value. (C) Select upstream regulators predicted as being activated (shown in green), inhibited (shown in red), or of unclear state (shown in gray) in Crtap-/- compared to wildtype Achilles tendons plotted according to their -log10 adjusted p-value. See Figure 6—source data 2 for a complete list of predicted upstream regulators. n = 3 mice per genotype for (A–C). (D) A bi-clustering heatmap of the top 30 differentially expressed genes between wildtype and Crtap-/- patellar tendons sorted by adjusted p-value and plotted according to log2 transformed expression values. The Wald test was used to generate p-values and log2 fold changes. See Figure 6—source data 3 for a complete list of differentially regulated genes. (E) Significantly differentially expressed genes between patellar tendons from wildtype and Crtap-/- mice were clustered by their gene ontology, and enrichment for gene ontology terms was tested using Fisher exact test. All gene ontology terms with an adjusted p-value<0.05 are plotted according to their -log10 adjusted p-value. (F) Select upstream regulators predicted as being activated (shown in green), inhibited (shown in red), or of unclear state (shown in gray) in Crtap-/- compared to wildtype patellar tendons plotted according to -log10 adjusted p-value. See Figure 6—source data 4 for a complete list of predicted upstream regulators. n = 2 mice per genotype for (D–F).
-
Figure 6—source data 1
List of differentially expressed genes between 1-month wildtype and Crtap knockout Achilles tendons.
The Wald test was used to generate p-values and log2 fold changes. Genes with an adjusted p-value<0.05 and absolute log2 fold change >1 were called significantly differentially expressed genes. This is a full list of all differentially expressed genes ordered by adjusted p-value.
- https://cdn.elifesciences.org/articles/63488/elife-63488-fig6-data1-v2.xlsx
-
Figure 6—source data 2
Predicted upstream regulators driving differential gene expression between 1-month wildtype and Crtap knockout Achilles tendons.
Based on a list of differentially expressed genes, upstream regulators were predicted using Ingenuity Pathway Analysis. The results are sorted by adjusted p-value.
- https://cdn.elifesciences.org/articles/63488/elife-63488-fig6-data2-v2.xlsx
-
Figure 6—source data 3
List of differentially expressed genes between 1-month wildtype and Crtap knockout patellar tendons.
The Wald test was used to generate p-values and log2 fold changes. Genes with an adjusted p-value<0.05 and absolute log2 fold change >1 were called significantly differentially expressed genes. This is a full list of all differentially expressed genes ordered by adjusted p-value.
- https://cdn.elifesciences.org/articles/63488/elife-63488-fig6-data3-v2.xlsx
-
Figure 6—source data 4
Predicted upstream regulators driving differential gene expression between 1-month wildtype and Crtap knockout patellar tendons.
Based on a list of differentially expressed genes, upstream regulators were predicted using Ingenuity Pathway Analysis. The results are sorted by adjusted p-value.
- https://cdn.elifesciences.org/articles/63488/elife-63488-fig6-data4-v2.xlsx
Figure 7
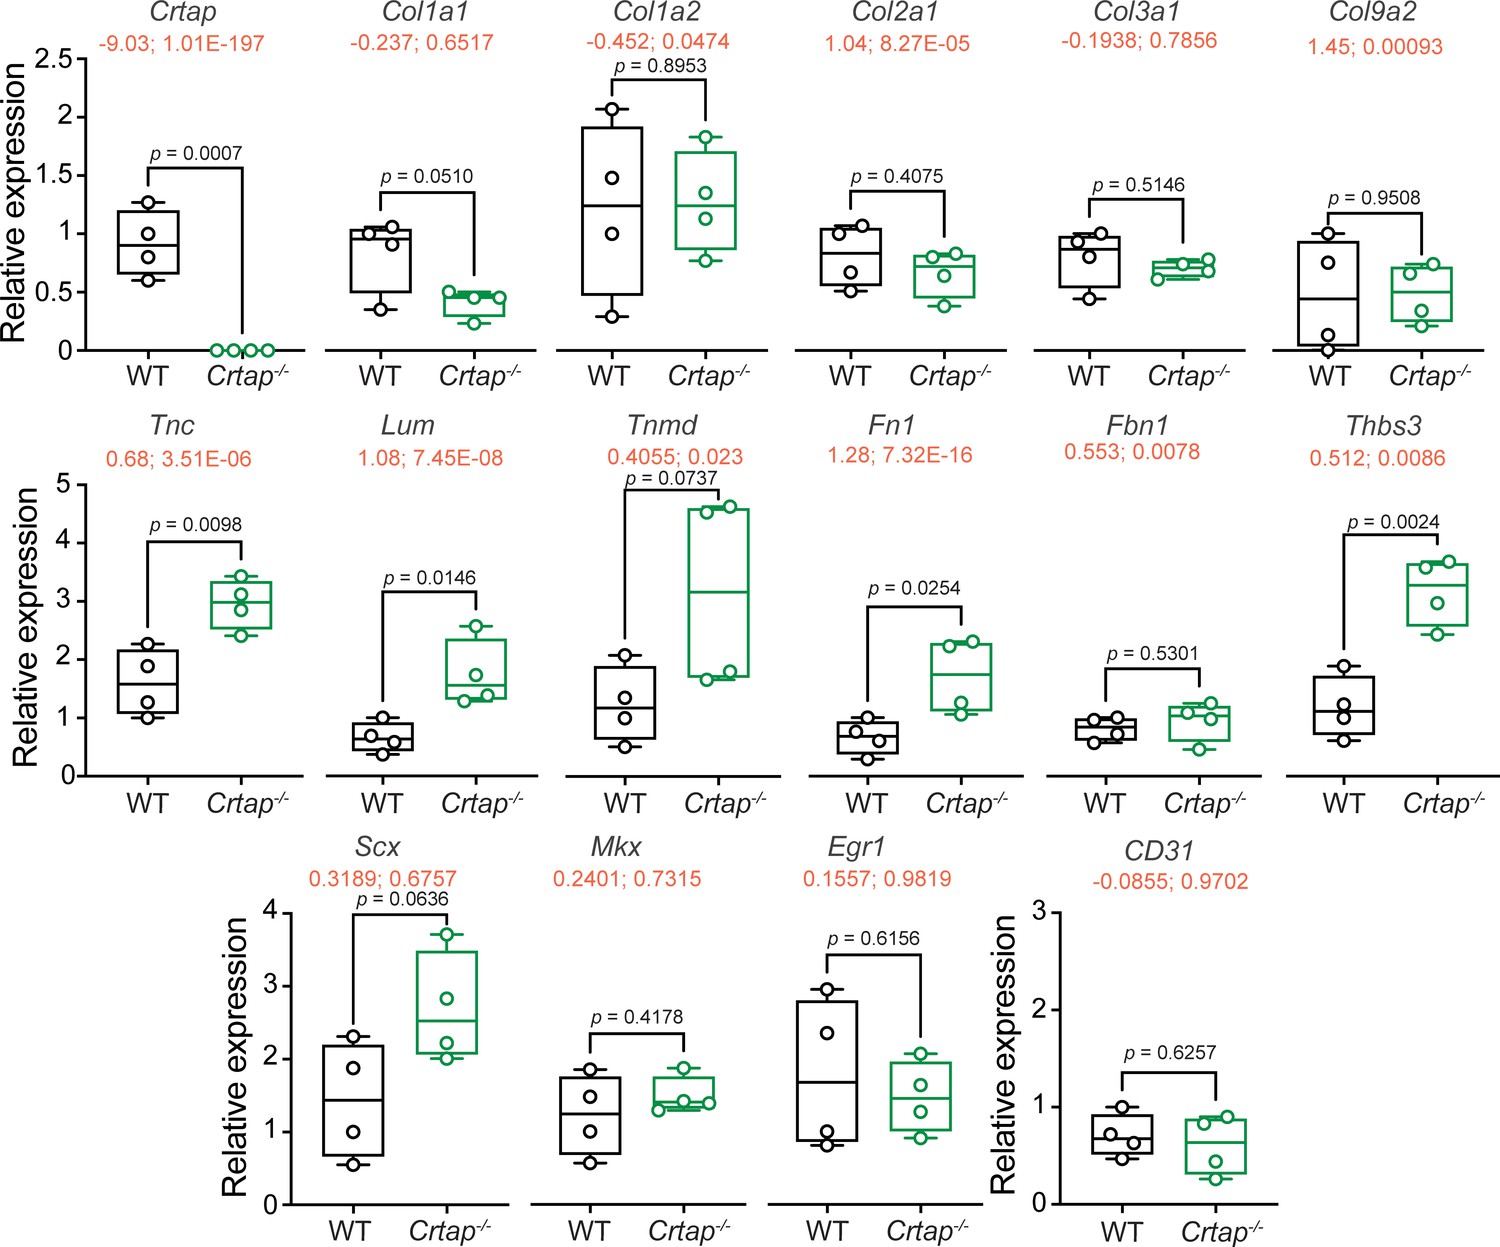
Tendon marker gene expression is altered in Crtap-/- Achilles tendons at 1 month.
Real-time quantitative PCR was performed to examine changes in the expression of Crtap, various fibrillar collagens (i.e., Col1a1, Col1a2, Col2a1, Col3a1, Col9a2), tendon makers (i.e. Scx, Mkx, Egr1, Tnc, Lum, Tnmd, Fn1, Fbn1), other targets from the RNA-seq analysis in Figure 6 (i.e., Thbs3), and CD31 as a marker of vascularization. n = 4 mice per group. Data passed the Shapiro-Wilk test for normality, and groups were compared using one-way ANOVA with Tukey’s post-hoc tests. Exact p-values are reported. The log2 fold change and adjusted p-value (shown as log2 fold change; adjusted p-value") from the RNA-seq experiment in Figure 6 is indicated in red just below the gene name.
Figure 8

Four-month Crtap-/- patellar tendons exhibit increased staining for markers of fibrosis, increased ECM turnover, and inflammatory events.
(A–B) Representative herovici-stained images of 4-month patellar tendons. (C–D) Representative αSMA IHC images of 4-month patellar tendons. (E–F) Representative MMP2 IHC images of 4-month patellar tendons. (G–H) Representative phosphorylated NFκB (pNFκB) IHC images of 4-month patellar tendons. For all micrographs, higher magnification images of the mid-tendon are illustrated. n = 3–5 mice per group. Scale bar is 0.5 mm.
Figure 9
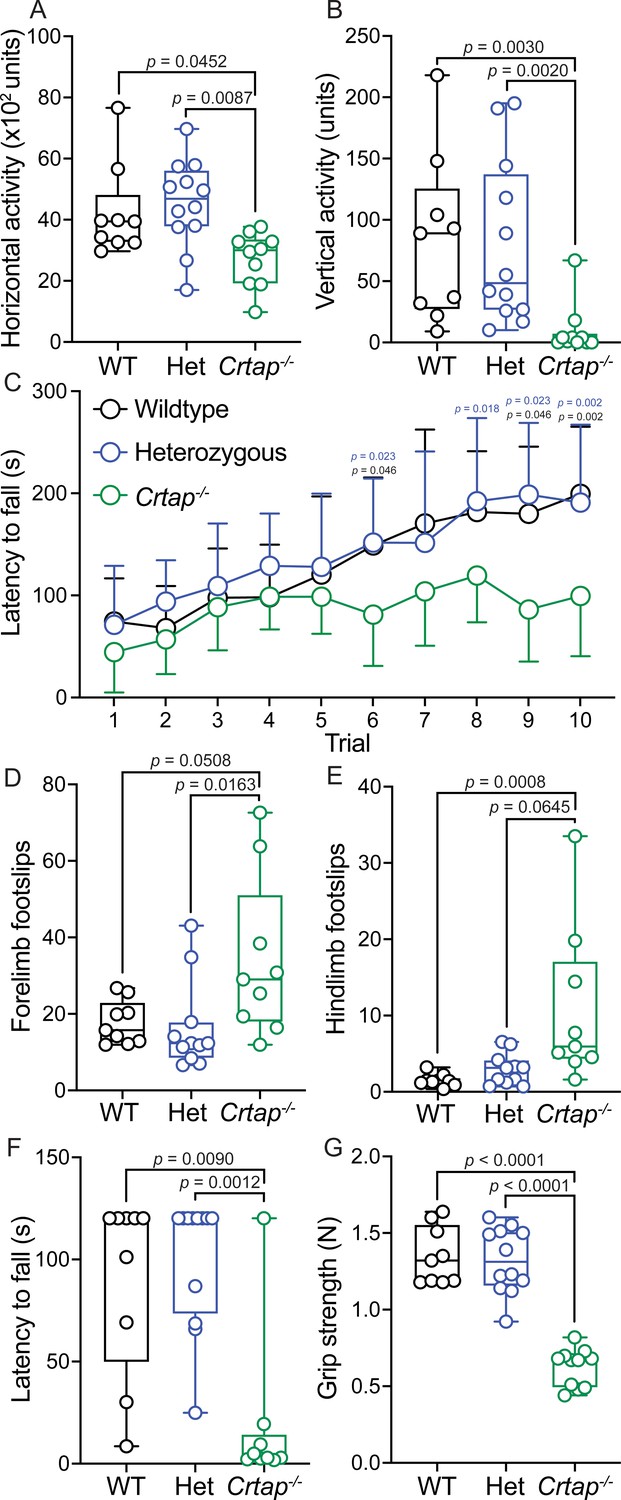
Motor activity and coordination are impaired in 4-month-old Crtap-/- mice.
(A–B) Quantification of spontaneous motor activity including horizontal (A) and vertical (B) activity over a 30-min period using the open-field assay. Data are min-to-max box and whisker plots with individual points indicated. n = 9–12 mice per group. For (A), data passed the Shapiro-Wilk test for normality, and groups were compared using one-way ANOVA with Tukey’s post-hoc tests. For (B), data failed the Shapiro-Wilk test for normality, and groups were compared using Kruskal-Wallis with Dunn’s post-hoc tests. Exact p-values are reported for (A–B). (C) Quantification of motor activity, coordination, and endurance across 10 trials conducted over 2 days using an accelerating rotarod assay. Data are means ± S.D. n = 9–12 mice per group. Groups were compared using repeated-measures two-way ANOVA with Tukey’s post-hoc tests. Exact p-values are reported, with black p-values being compared to wildtype, and blue p-values being compared to heterozygous mice. (D–E) Quantification of forelimb (D) and hindlimb (E) motor coordination using the grid foot slip assay. Data are min-to-max box and whisker plots with individual points indicated. n = 9–12 mice per group. Data failed the Shapiro-Wilk test for normality, and groups were compared using Kruskal-Wallis with Dunn’s post-hoc tests. Exact p-values are reported. (F) Quantification of forelimb and hindlimb grip strength using the inverted grid assay conducted for 120 s. A reduction in latency to fall indicates reduced strength. Data are min-to-max box and whisker plots with individual points indicated. n = 8–9 mice per group. Data failed the Shapiro-Wilk test for normality, and groups were compared using Kruskal-Wallis with Dunn’s post-hoc tests. Exact p-values are reported. (G) Quantification of forelimb grip strength in N of force measured over three trials and then averaged. Data are min-to-max box and whisker plots with individual points indicated. n = 9–12 mice per group. Data passed the Shapiro-Wilk test for normality, and groups were compared using one-way ANOVA with Tukey’s post-hoc tests. Exact p-values are reported.
Tables
Key resources table
| Reagent type (species) or resource | Designation | Source or reference | Identifiers | Additional information |
|---|---|---|---|---|
| Genetic reagent (M. musculus) | Crtaptm1Brle | B. H. Lee Laboratory | DOI: 10.1016/j.cell.2006.08.039 | Deposited at Jackson Labs (B6; 129S7-Crtaptm1Brle/J; Stock #: 018831) |
| Genetic reagent (M. musculus) | 129sv/EV | Dr. Allan Bradley | Baylor College of Medicine | Maintained in Lee Laboratory for many generations |
| Genetic reagent (M. musculus) | C57BL/6J | Jackson Laboratory | Stock #: 000664 RRID:IMSR_JAX:000664 | |
| Antibody | Anti-CD45- pacific blue (mouse monoclonal) | Invitrogen | Cat. #: MCD4528 RRID:AB_10373710 | FACS (1:100) Clone: 30-F11 |
| Antibody | Anti-CD31-eFluor 450 (mouse monoclonal) | Invitrogen | Cat. #: 48-0311-82 RRID:AB_10598807 | FACS (1:100) Clone: 390 |
| Antibody | Anti-CD146-PE-Cy7 (mouse monoclonal) | BioLegend | Cat. #: 134713 RRID:AB_2563108 | FACS (1:100) Clone: ME-9F1 |
| Antibody | Anti-CD200-APC (mouse monoclonal) | BioLegend | Cat. #: 123809 RRID:AB_10900996 | FACS (1:100) Clone: OX-90 |
| Antibody | Anti-αSMA (rabbit polyclonal) | Abcam | Cat #: ab5694 RRID:AB_2223021 | IHC (1:200) |
| Antibody | Anti-MMP2 (goal polyclonal) | R and D Systems | Cat #: AF1488 RRID:AB_2145989 | IHC (1:400) |
| Antibody | Anti-phospho-NFκB p65 (Ser536) (93H1) (rabbit monoclonal) | Cell Signaling | Cat #: 3033 RRID:AB_331284 | IHC (1:20) |
| Antibody | Biotin-SP-AffiniPure Donkey Anti-Rabbit IgG (H + L) | Jackson ImmunoResearch Labs | Cat #: 711-065-152 RRID:AB_2340593 | IHC (1:100, 1:400) |
| Antibody | Biotin-SP-AffiniPure Donkey Anti-Goat IgG (H + L) | Jackson ImmunoResearch Labs | Cat #: 705-065-147 RRID:AB_2340397 | IHC (1:500) |
| Antibody | Peroxidase-Streptavidin Slides were incubated with DAB substrate (Vector Laboratories, SK-4100) | Jackson ImmunoResearch Labs | Cat #: 016-030-084 RRID:AB_2337238 | IHC (1:100, 1:400, 1:500) |
| Antibody | DAB Substrate Kit (3,3’-diaminobenzidine) | Vector Laboratories | Cat #: SK-4100 RRID:AB_2336382 | |
| Other | Propidium iodide | Sigma-Aldrich | Cat. #: P4170-100MG | |
| Commercial assay or kit | RNeasy fibrous tissue mini kit | Qiagen | Cat. #: 74704 | |
| Commercial assay or kit | RNeasy micro kit | Qiagen | Cat. #: 74004 | |
| Commercial assay or kit | iScript cDNA synthesis kit | Bio-Rad | Cat. #: 1708890 | |
| Chemical compound, drug | LightCycler FastStart DNA Master SYBR Green I | Roche | Cat. #: 12239264001 | |
| Chemical compound, drug | Hexaammineruthenium(III) chloride | Sigma-Aldrich | Cat. #: 262005–5G | 0.7% w/v in phase-contrast µCT fixative, wash buffer, and post-fixative |
| Chemical compound, drug | Glutaraldehyde | Polysciences, Inc | Cat. #: 01909 | 2% v/v in phase-contrast µCT fixative |
| Chemical compound, drug | Cacodylic acid | Electron Microscopy Sciences | Cat. #: 12200 | 0.05 M in phase-contrast µCT fixative and wash buffer; 0.1 M for post-fixative |
| Chemical compound, drug | Osmium tetroxide | Electron Microscopy Sciences | Cat. #: 19190 | 1% w/v in phase-contrast µCT or TEM post-fixative |
| Software, algorithm | Fiji | ImageJ | https://imagej.net/Fiji RRID:SCR_002285 | Version 2.1.0/1.53 c |
| Software, algorithm | GraphPad Prism | GraphPad Software | https://graphpad.com RRID:SCR_002798 | Version 9.0.1 |
| Software, algorithm | Tri/3D BON | Ratoc System Engineering | https://www.ratoc.co.jp/ENG/3diryo.html | Version R.8.00.008-H-64 |
| Software, algorithm | FlowJo | BD | https://www.flowjo.com/solutions/flowjo/downloads RRID:SCR_008520 | Version 10.7 |
Additional files
-
Transparent reporting form
- https://cdn.elifesciences.org/articles/63488/elife-63488-transrepform-v2.docx
-
Reporting standard 1
ARRIVE checklist.
- https://cdn.elifesciences.org/articles/63488/elife-63488-repstand1-v2.pdf
Download links
A two-part list of links to download the article, or parts of the article, in various formats.
Downloads (link to download the article as PDF)
Open citations (links to open the citations from this article in various online reference manager services)
Cite this article (links to download the citations from this article in formats compatible with various reference manager tools)
Tendon and motor phenotypes in the Crtap-/- mouse model of recessive osteogenesis imperfecta
eLife 10:e63488.
https://doi.org/10.7554/eLife.63488


