Longitudinal high-throughput TCR repertoire profiling reveals the dynamics of T-cell memory formation after mild COVID-19 infection
- Shemyakin-Ovchinnikov Institute of Bioorganic Chemistry, Russian Federation
- Pirogov Russian National Research Medical University, Russian Federation
- National Research Center for Hematology, Russian Federation
- Laboratoire de physique de l'École Normale Supérieure, ENS, PSL, Sorbonne Universite, Universite de Paris, and CNRS, France
- Institute of Clinical Molecular Biology, Kiel University, Germany
- Masaryk University, Central European Institute of Technology, Czech Republic
- V.I. Kulakov National Medical Research Center for Obstetrics, Gynecology and Perinatology, Russian Federation
- Moscow State University, Russian Federation
Figures
Figure 1 with 5 supplements
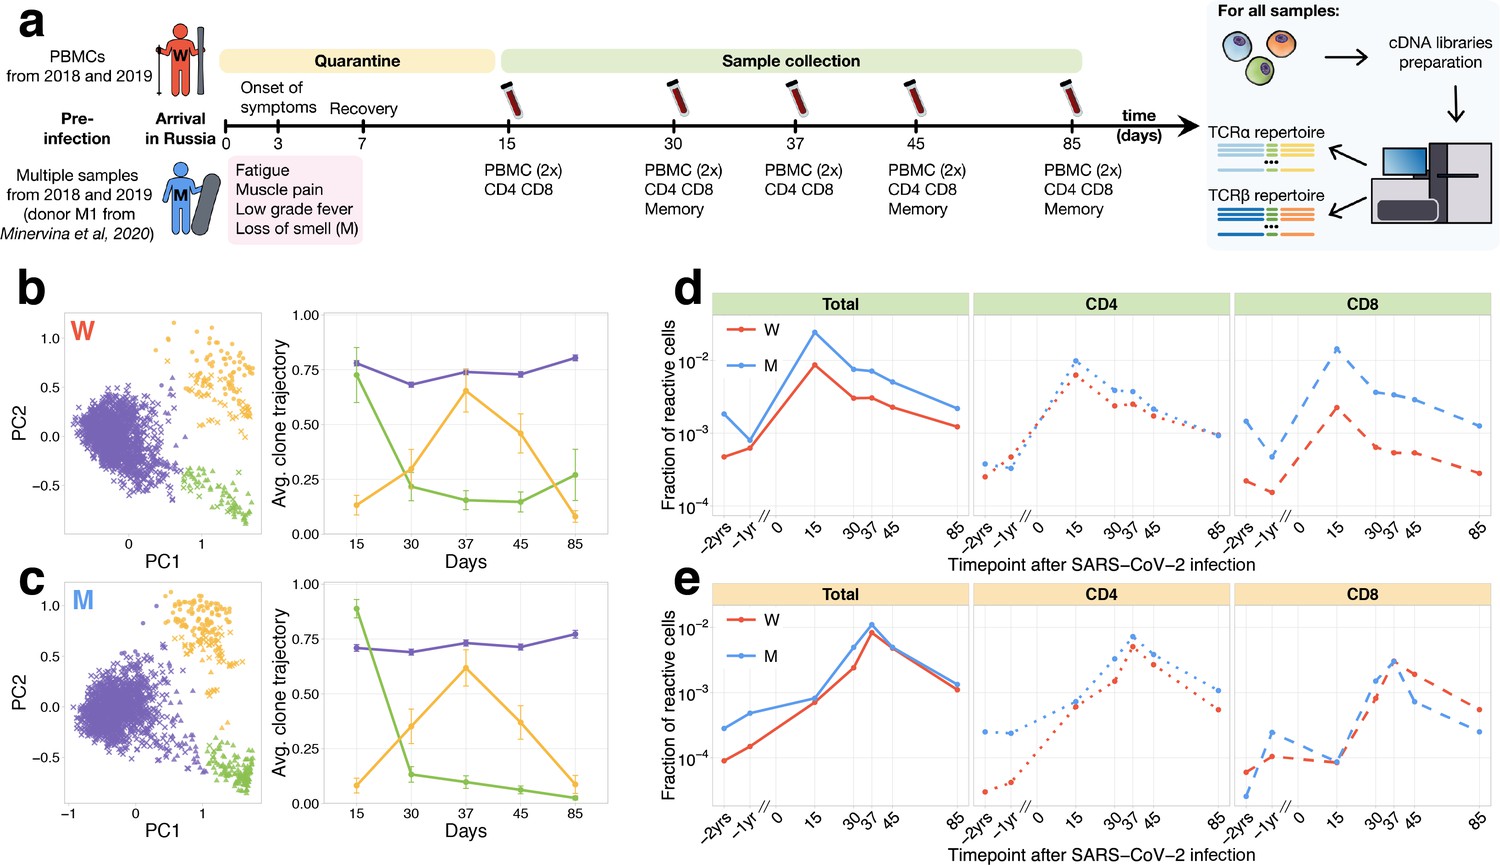
Longitudinal tracking of T-cell clones after mild COVID-19.
(a) Study design. Peripheral blood of two donors was sampled longitudinally on days 15, 30, 37, 45, and 85 after arrival in Russia. At each time point, we evaluated SARS-CoV-2-specific antibodies using ELISA (Figure 1—figure supplement 1) and isolated PBMCs in two biological replicates. Additionally, CD4+ and CD8+ cells were isolated from a separate portion of blood, and EM, CM, EMRA, and SCM memory subpopulations were FACS sorted on days 30, 45, and 85. For each sample, we sequenced TCRalpha and TCRbeta repertoires. For both donors, pre-infection PBMC repertoires were sampled in 2018 and 2019 for other projects. (b, c) PCA of clonal temporal trajectories identifies three groups of clones with distinctive behaviours. Left: First two principal components of the 1000 most abundant TCRbeta clonotype frequencies normalized by maximum value for each clonotype in PBMC at post-infection time points. Colour indicates hierarchical clustering results of principal components; symbol indicates if clonotype was called as significantly contracted from day 15 to day 85 (triangles) or expanded from day 15 to day 37 (circles) by both edgeR and NoisET (Figure 1—figure supplement 5 shows overlap between clonal trajectory clusters and edgeR/NoisET hits). Right: Each curve shows the average ±2.96 SE of normalized clonal frequencies from each cluster. Contracting (d) and expanding (e) clones include both CD4+ and CD8+ T cells and are less abundant in pre-infection repertoires. T-cell clones significantly contracted from day 15 to day 85 (d) and significantly expanded from day 15 to day 37 (e) were identified in both donors. The fraction of contracting (d) and expanding (e) TCRbeta clonotypes in the total repertoire (calculated as the sum of frequencies of these clonotypes in the second PBMC replicate at a given time point and corresponding to the fraction of responding cells of all T cells) is plotted in log-scale for all reactive clones (left) and reactive clones with the CD4 (middle) and CD8 (right) phenotypes. Similar dynamics were observed in TCRalpha repertoires (Figure 1—figure supplement 3) and for significantly expanded/contracted clones identified with the NoisET Bayesian differential expansion statistical model alone (Figure 1—figure supplement 4).
Figure 1—figure supplement 1
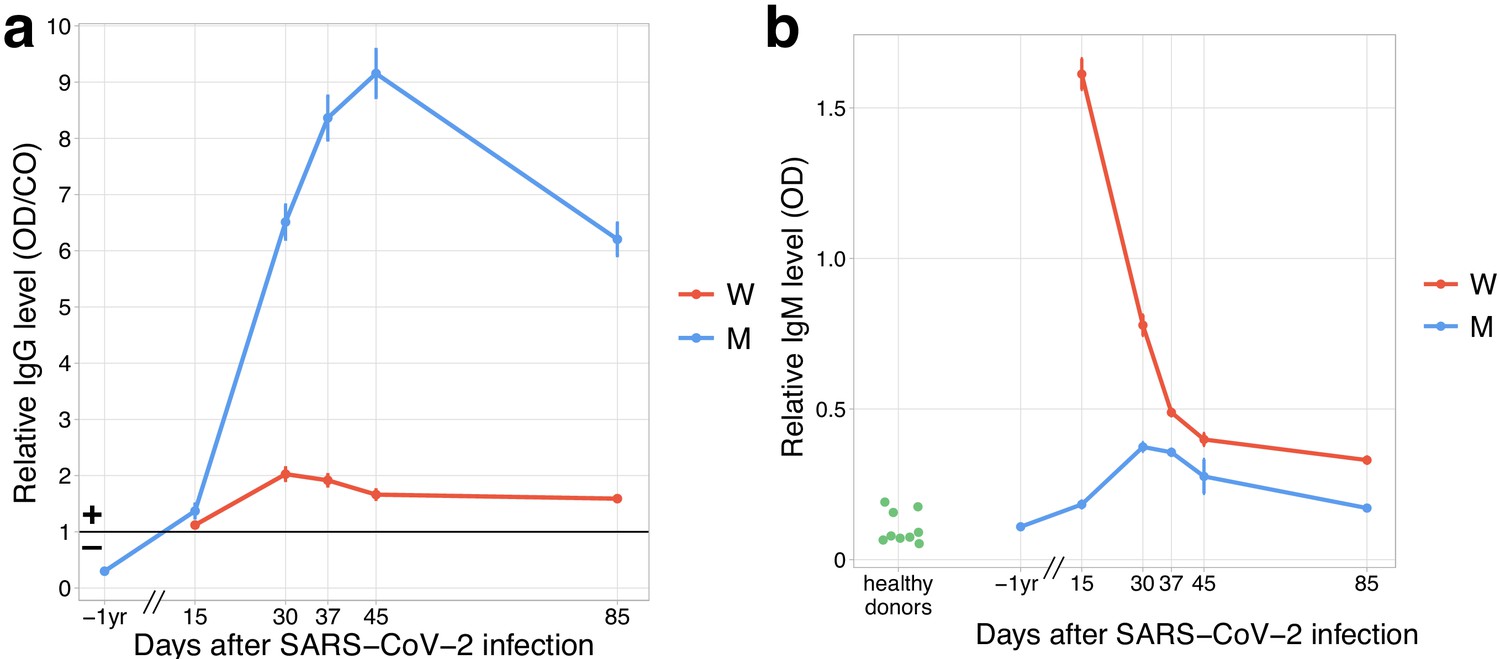
Both donors developed anti-SARS-CoV-2 IgG and IgM responses by day 15 post-infection.
(a) The relative level of SARS-CoV-2 S-RBD domain-specific IgG (y-axis) is plotted against time. Solid black line shows the threshold for positive testing. (b) Relative IgM levels in donors M and W are shown over time. Relative IgM levels for pre-pandemic serum samples from healthy donors are shown on the left (green dots).
Figure 1—figure supplement 2
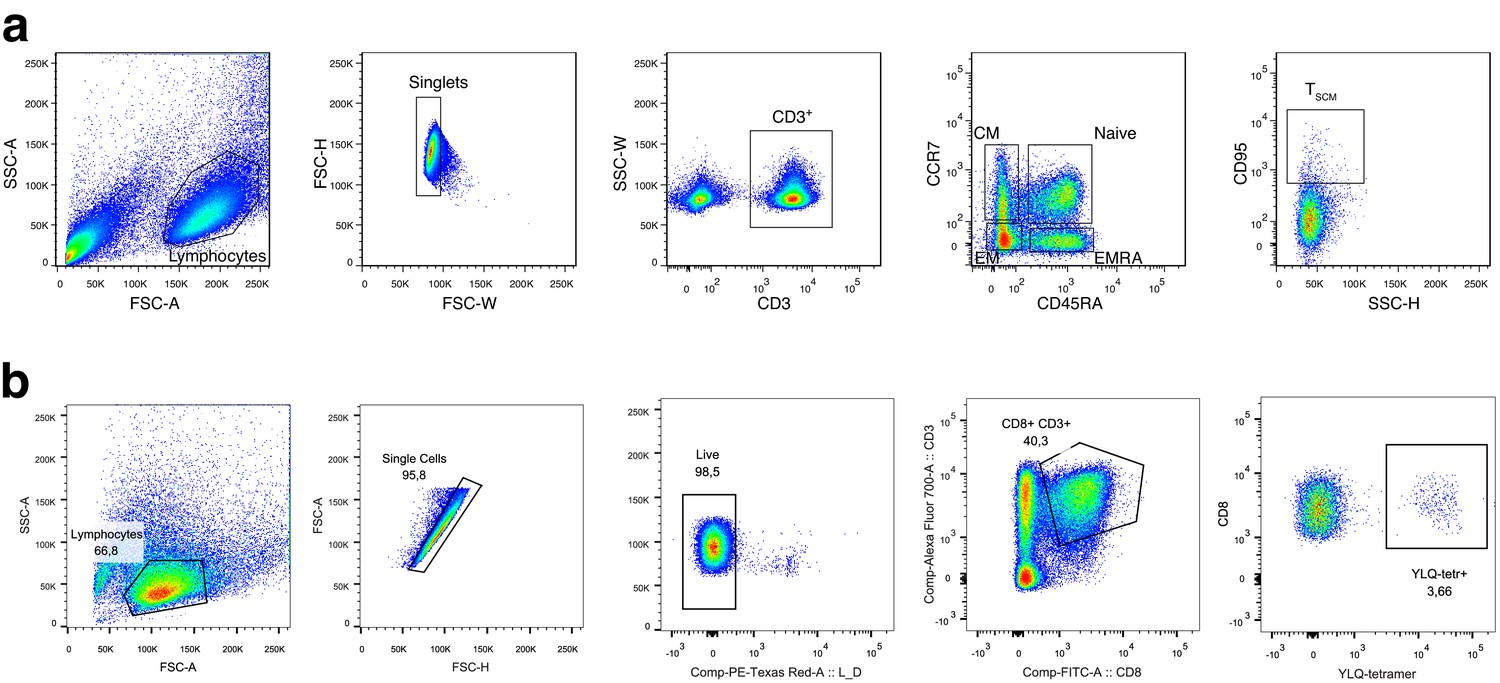
Gating strategy for T cell subsets.
(a) Memory subpopulation gating strategy. Three populations of memory T cells: EM, CM, and EMRA are defined by CCR7 and CD45RA markers; SCM are distinguished from naive CCR7+ CD45RA+ T cells by CD95 expression. (b) HLA-A*02:01-YLQPRTFLL subpopulation gating strategy. On day 25 post-infection, donor M participated in study by Shomuradova et al., 2020 (as donor p1434), where his T cells were in vitro expanded and stained with HLA-A*02:01-YLQPRTFLL tetramer, TCRalpha, and TCRbeta repertoires were sequenced and resulting sequences deposited to VDJdb. See Shomuradova et al., 2020 for experimental details.
Figure 1—figure supplement 3
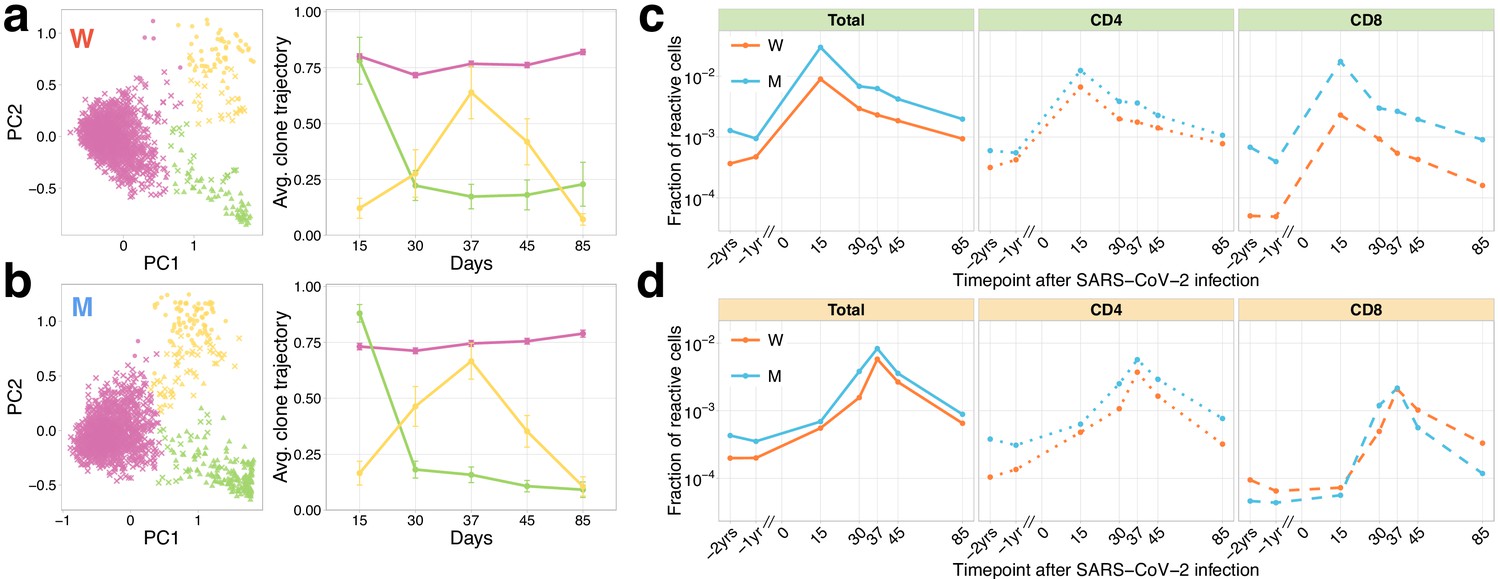
Longitudinal tracking of T-cell clones after mild COVID-19 with TCRalpha repertoire sequencing.
(a, b) PCA of clonal temporal trajectories identifies three groups of clones with distinctive behaviours. Left: First two principal components of the 1000 most abundant TCRalpha clonotype frequencies normalized by maximum value for each clonotype in PBMC at post-infection time points. Colour indicates hierarchical clustering results of principal components; symbol indicates if clonotype was called as significantly contracted from day 15 to day 85 (triangles) or expanded from day 15 to day 37 (circles) by both edgeR and NoisET (Figure 1—figure supplement 5 shows overlap between clonal trajectory clusters and edgeR/NoisET hits). Right: Each curve shows the average ±2.96 SE of normalized clonal frequencies from each cluster. Contracting (c) and expanding (d) clones include both CD4+ and CD8+ T cells and are less abundant in pre-infection repertoires. T-cell clones significantly contracted from day 15 to day 85 (c) and significantly expanded from day 15 to day 37 (d) were identified in both donors. The fraction of contracting (c) and expanding (d) TCRalpha clonotypes in the total repertoire (calculated as the sum of frequencies of these clonotypes in the second PBMC replicate at a given time point and corresponding to the fraction of responding cells of all T cells) is plotted in log-scale for all reactive clones (left) and reactive clones with the CD4 (middle) and CD8 (right) phenotypes.
Figure 1—figure supplement 4
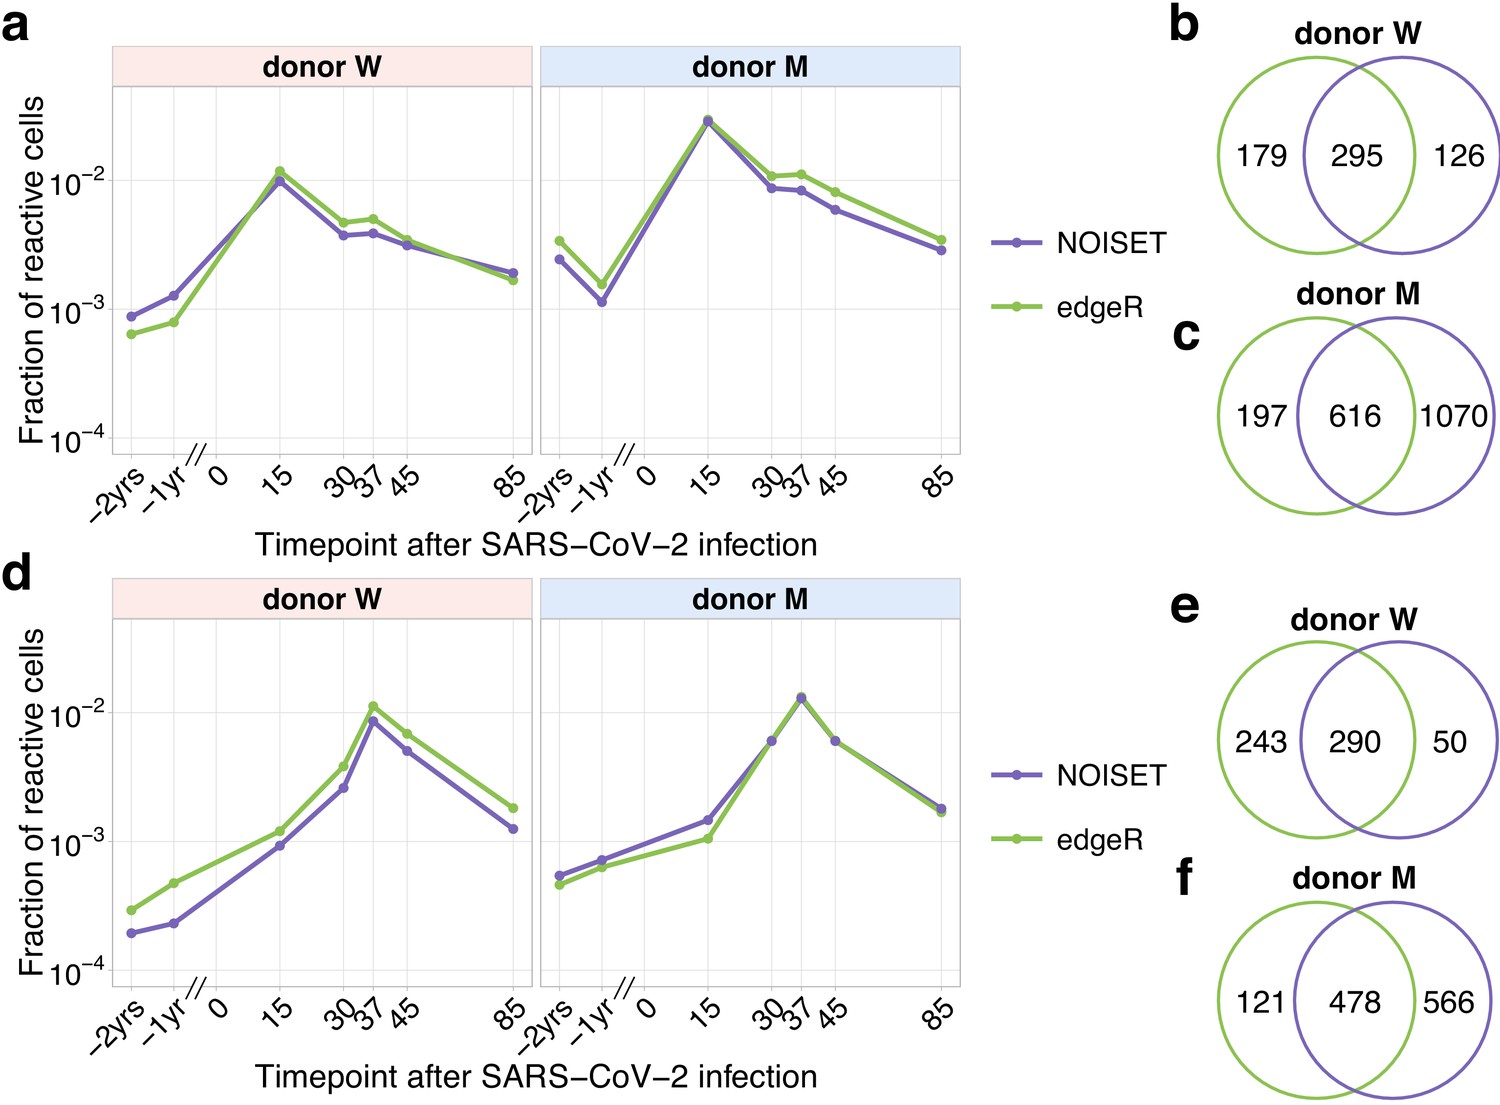
Comparison of edgeR and NoisET clonal expansion detection procedures.
The fraction (plotted in the log-scale) of contracting (a) and expanding (d) TCRbeta clonotypes in the total repertoire was estimated using subsets of expanded and contracted clones called by edgeR (green) and NoisET (purple) models. Overlaps for contracted clones (b, c) and expanded clones (e, f) identified by both models are shown on the right.
Figure 1—figure supplement 5

The overlap between clusters of clonal trajectories identified by PCA and groups of expanding/contracting clones identified with edgeR/NoisET.
For each cluster of clonal trajectories identified on Figure 1b,c, Figure 1—figure supplement 3a,b, we show overlap with groups of significantly (called by edgeR and NoisET simultaneously) expanding clonotypes from day 15 to day 37 in yellow, significantly contracting clonotypes from day 15 to day 85 in green, other clonotypes are shown in purple (‘stable’ clonotypes that were not called significant by edgeR and NoisET simultaneously). Bar heights show fraction of abundant clonotypes in PCA cluster overlapping with expanding/contracting/non-significant groups called by edgeR/NoisET; raw number of overlapping clonotypes is shown inside bars.
Figure 2 with 2 supplements
Memory phenotypes of responding clonotypes contracting after day 15.
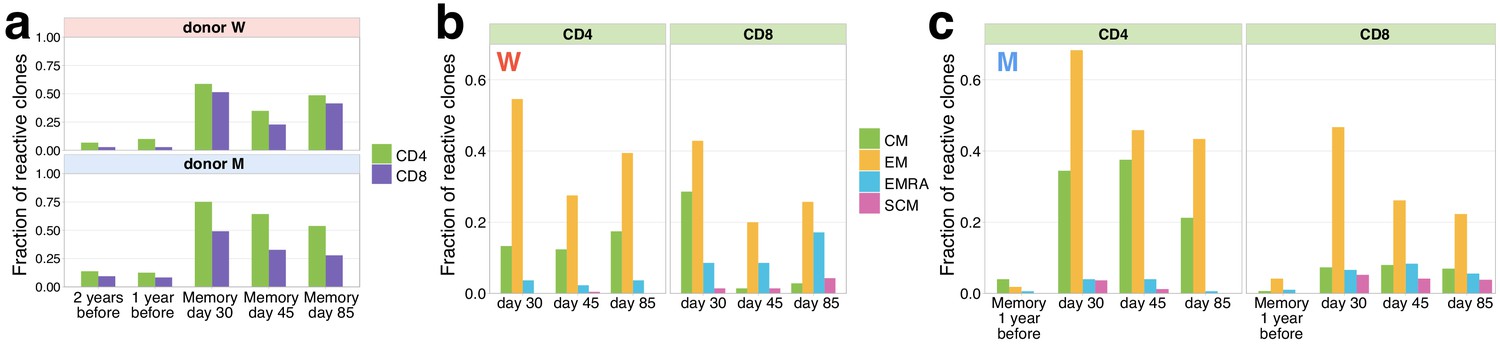
(a) A large fraction of contracting clonotypes is identified in T-cell memory subsets after infection. Bars show the fraction of contracting CD4+ and CD8+ TCRbeta clonotypes present in 2 year; 1 year pre-infection PBMC; in at least one of memory subpopulation sampled on day 30, day 37, and day 85 post-infection. (b, c) Responding clones are found in different memory subsets. Fraction of CD4+ (left panels) and CD8+ (right panels) contracting clones of donor W (b) and M (c) that were identified in each memory subpopulation repertoire at each time point. For both donors, CD4+ clonotypes were found predominantly in central memory (CM) and effector memory (EM), while CD8+ T cells were enriched in EMRA compartment. (c) For donor M, CD4+ contracting clonotypes are also identified in memory subsets 1 year before the infection, with a bias towards the CM subpopulation and a group of CD8+ clones is found in the pre-infection EM subpopulation.
Figure 2—figure supplement 1

Memory phenotypes of responding clonotypes expanding from day 15 to day 37.
(a) A fraction of expanding clonotypes is identified in T-cell memory subsets after infection. Bars show the fraction of expanding CD4+ and CD8+ TCRbeta clonotypes present in 2 year; 1 year pre-infection PBMC; and in at least one of memory subpopulation sampled on day 30 and day 37 post-infection. (b) Responding clones are found in different memory subsets. For both W (b) and M (c) donors, CD4+ clonotypes were found predominantly in central memory (CM) and effector memory (EM), while CD8+ T cells were also present in EMRA.
Figure 2—figure supplement 2

Dynamics of pre-existing SARS-CoV-2 responding clones.
The fraction of pre-existing (identified in −1 year and/or −2 year time point pre-infection) contracting (a) and expanding (b) TCRbeta clonotypes in the total repertoire (corresponding to the fraction of responding cells of all T cells) is plotted in log-scale for all reactive clones (left) and reactive clones with the CD4 (middle) and the CD8 phenotype (right).
Figure 3 with 2 supplements
Distinctive TCR sequence motifs and epitope specificity of contracting CD8+ T cell clones.
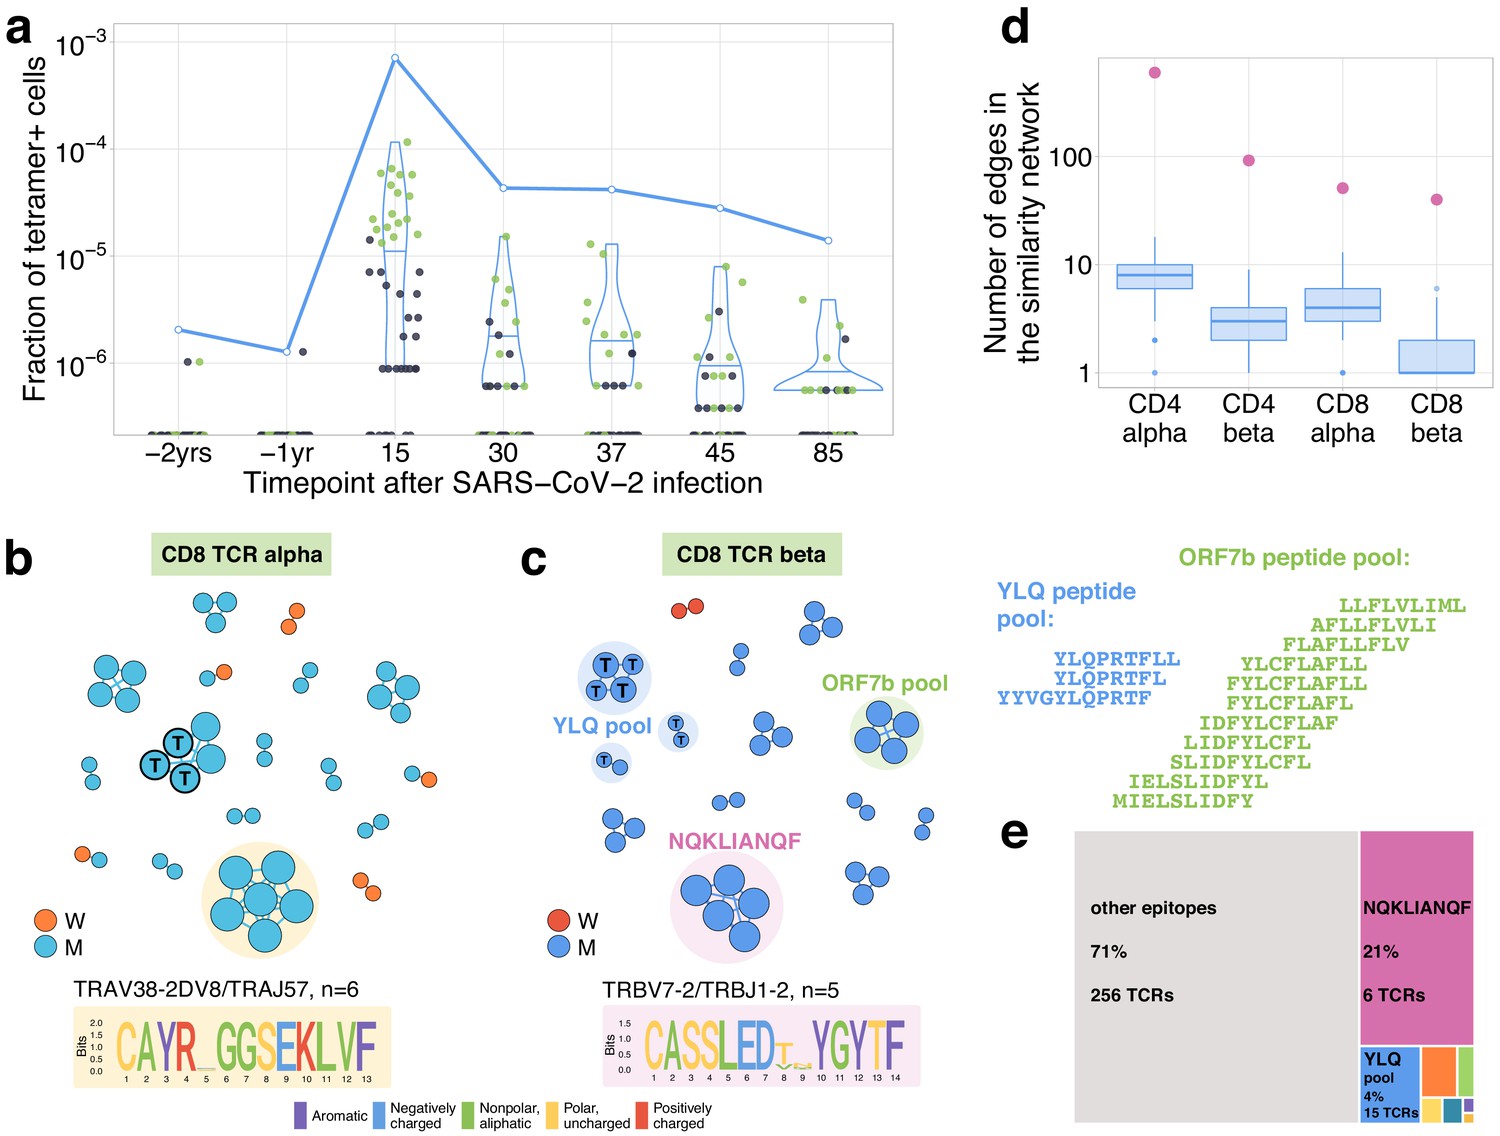
(a) SARS-CoV-2-specific TCRs are independently identified by clonal contraction. On day 25, donor M participated in a study by Shomuradova et al., 2020, where TCR sequences responding to the HLA-A*02:01-YLQPRTFLL-tetramer T cells were determined. Here we matched the resulting tetramer-specific TCRbeta clonotypes to the longitudinal repertoire dataset obtained in the current study. Each dot corresponds to the frequency of HLA-A*02:01-YLQPRTFLL-tetramer-specific TCRbeta clonotype in bulk repertoire of donor M (donor p1434 from Shomuradova et al., 2020) at each time point. Green dots correspond to clonotypes independently identified as contracting in our longitudinal dataset. Blue line shows the cumulative frequency of tetramer-specific TCRbeta clonotypes. (b, c) Analysis of TCR amino acid sequences of contracting CD8+ clones reveals distinctive motifs. For each set of CD8alpha and CD8beta contracted clonotypes, we constructed a separate similarity network. Each vertex in the similarity network corresponds to a contracting clonotype. An edge indicates two or less amino acid mismatches in the CDR3 region and identical V and J segments. Networks are plotted separately for CD8alpha (b) and CD8beta (c) contracting clonotypes. Clonotypes without neighbours are not shown. Sequence logos corresponding to the largest clusters are shown under the corresponding network plots. ‘T’ on vertices indicate TCRbeta clonotypes confirmed by HLA-A*02:01-YLQPRTFLL tetramer staining. Shaded coloured circles (c) indicate clonotypes with large number of matches to CD8+ TCRs recognising SARS-CoV-2 peptides pools from Snyder et al., 2020 (MIRA peptide dataset). Lists of peptides in YLQ and ORF7b peptide pools are shown on the right. (d) Sequence convergence among contracting clonotypes. The number of edges in each group is shown by pink dots and is compared to the distribution of that number in 1000 random samples of the same size from the relevant repertoires at day 15 (blue boxplots). (e) Fraction of TCRbeta clonotypes with matches in the MIRA dataset (coloured rectangles) out of all responding CD8+ TCRbeta clonotypes in donor M on day 15.
Figure 3—figure supplement 1
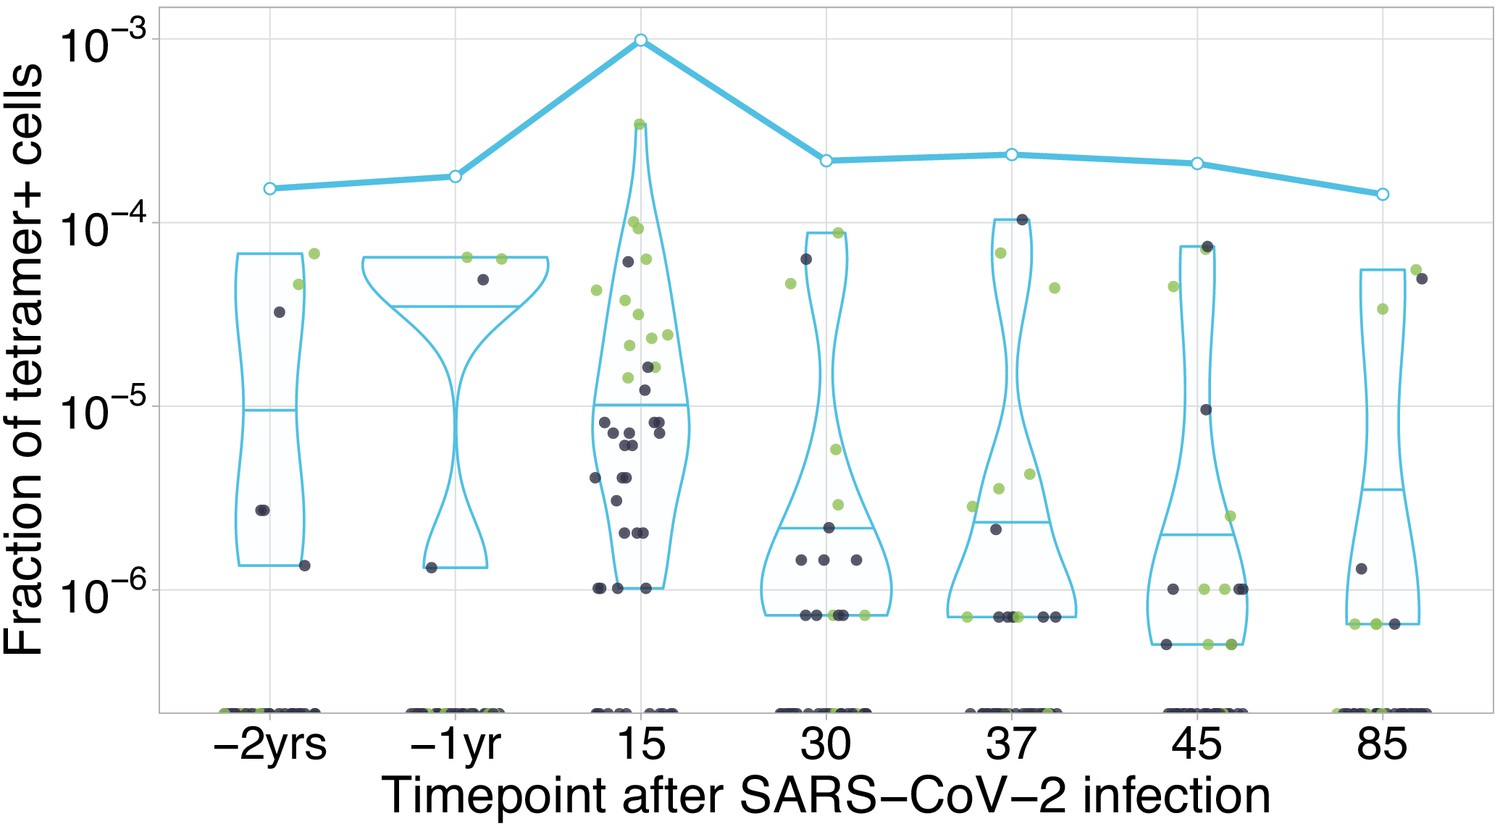
HLA-A*02:01-YLQPRTFLL-specific TCRs are independently identified by clonal contraction.
Each dot corresponds to the frequency of HLA-A*02:01-YLQPRTFLL-tetramer-specific TCRalpha in bulk repertoire from donor M (donor p1434 from Shomuradova et al., 2020) at given time point (an estimate of fraction of tetramer+ cells of all CD3+ cells). Green dots correspond to clonotypes independently identified as contracting in our longitudinal dataset. Blue line shows cumulative frequency of HLA-A*02:01-YLQPRTFLL-tetramer-specific TCRalpha clonotypes.
Figure 3—figure supplement 2
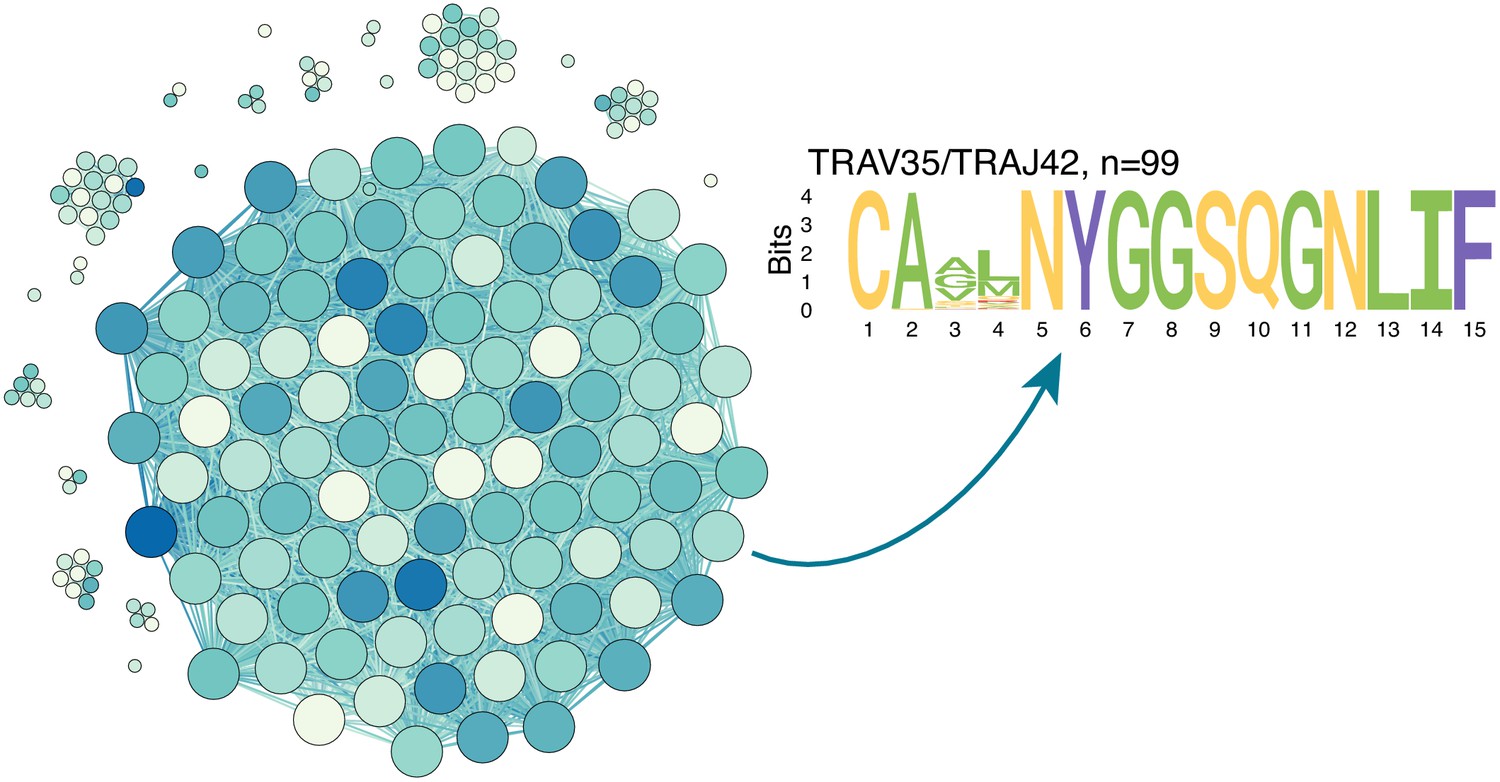
ALICE algorithm output for TCRalpha PBMC repertoire of donor M on day 15.
Similarity network shows ALICE hits (clones in repertoire with more neighbours than expected by chance), which differ by two mismatches or less in TCRalpha amino acid sequence. Darker colours indicate larger frequency of clone in the repertoire, vertex size indicates degree. The majority (54%, 99/183) of hits identified by the algorithm correspond to a single large TRAV35/TRAJ42 cluster of CD4+ contracting clones also seen on Figure 4a.
Figure 4 with 2 supplements
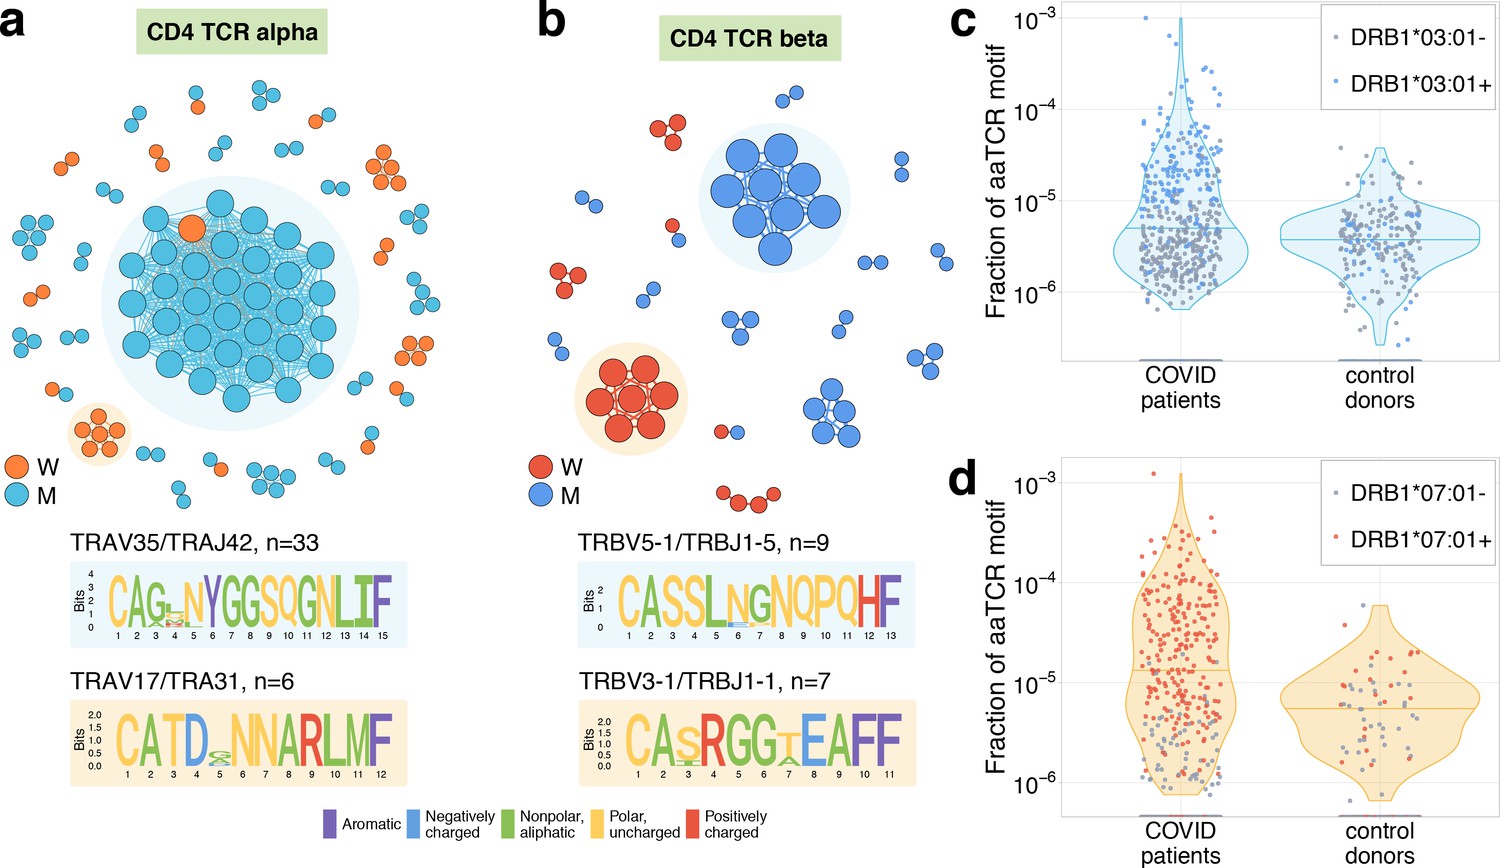
Analysis of TCR amino acid sequences of CD4+contracting clones reveals distinctive motifs.
(a) Each vertex in the similarity network corresponds to a contracting clonotype. An edge indicates two or less amino acid mismatches in the CDR3 region (and identical V and J segments). Networks are plotted separately for CD4alpha (a) and CD4beta (b) contracting clonotypes. Clonotypes without neighbours are not shown. Sequence logos corresponding to the largest clusters are shown under the corresponding network plots. (c, d) Clonotypes forming the two largest motifs are significantly more clonally expanded (p<0.001, one-sided t-test) in a cohort of COVID-19 patients (Snyder et al., 2020) than in a cohort of control donors (Emerson et al., 2017). Each dot corresponds to the total frequency of clonotypes from motifs shaded on (b) in the TCRbeta repertoire of a given donor. Coloured dots show donors predicted to share HLA-DRB1*07:01 allele with donor W (c) or HLA-DRB1*03:01-DQB1*02:01 haplotype with donor M (d).
Figure 4—figure supplement 1
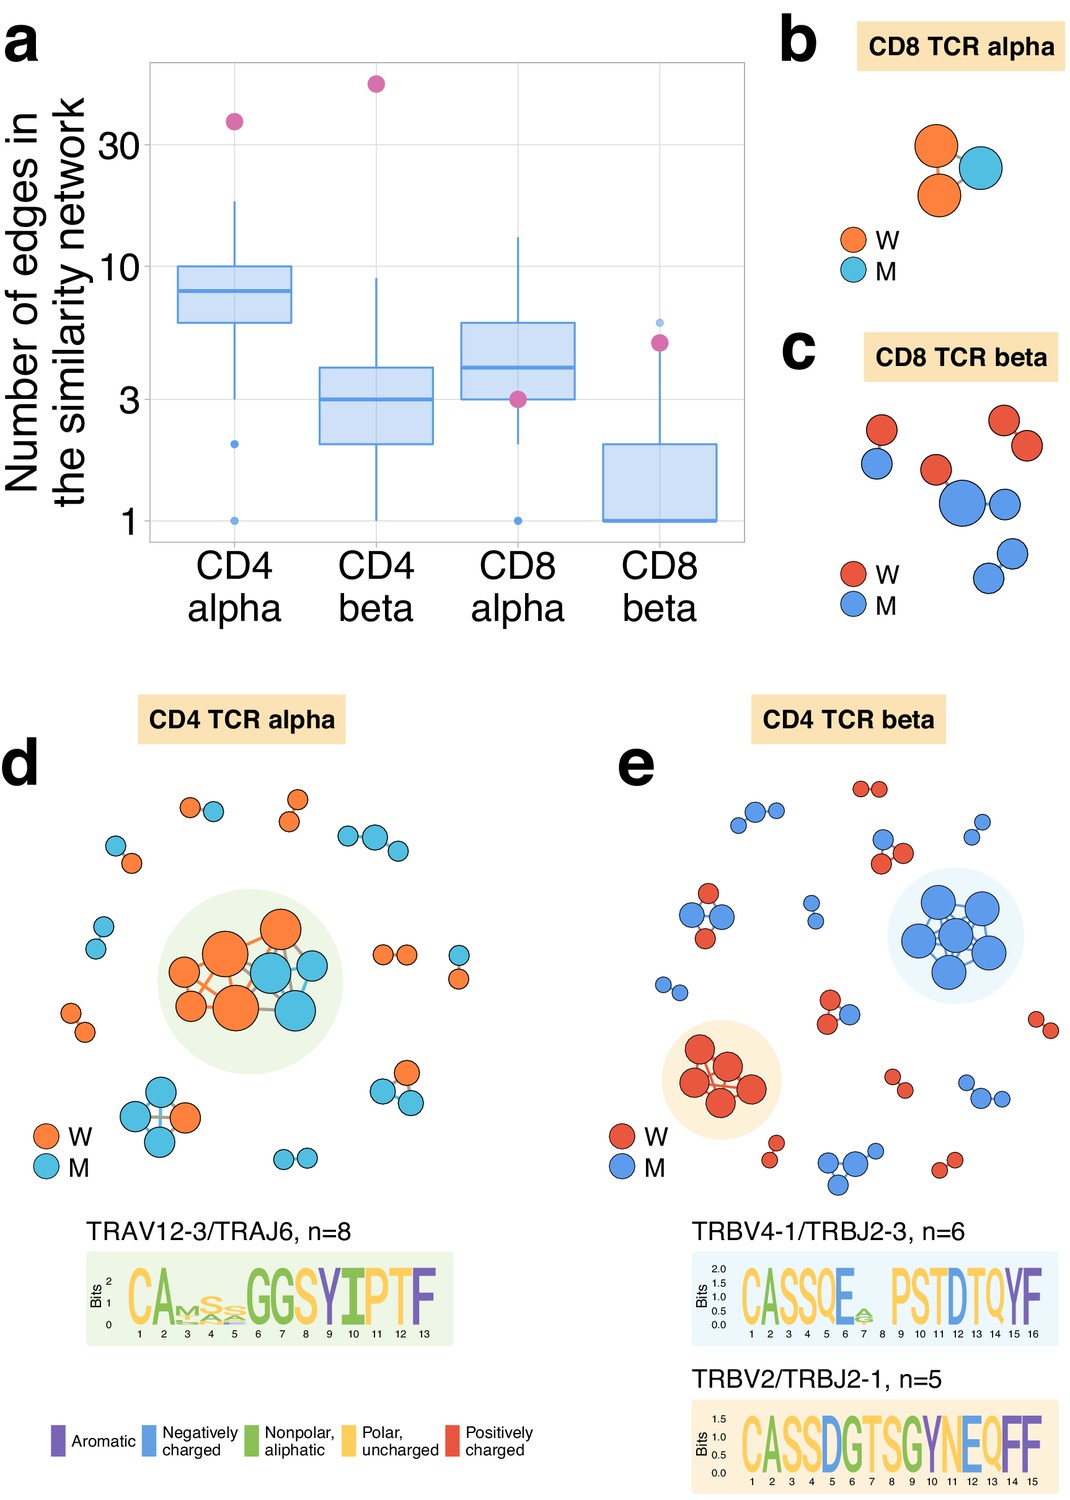
Expanding CD4+ (but not CD8+) clonotypes show unexpected TCRalpha and TCRbeta sequence convergence.
(a) For each set of CD4alpha, CD4beta, CD8alpha, and CD8beta expanded clonotypes, we constructed separate similarity networks. Each vertex in the similarity network corresponds to an expanding clonotype. An edge indicates two or less amino acid mismatches in the CDR3 region and identical V and J segments. The number of edges in each group is shown by pink dots and is compared to the distribution of that number in 1000 random samples of the same size from the relevant repertoires at day 37 (blue boxplots). (b–e) Analysis of TCR amino acid sequences of expanding clones reveal distinctive motifs. Networks are plotted separately for CD8alpha (b), CD8beta (c), CD4alpha (d), and CD4beta (e) expanding clonotypes. Clonotypes without neighbours are not shown. Sequence logos corresponding to the largest clusters are shown under the corresponding network plots.
Figure 4—figure supplement 2
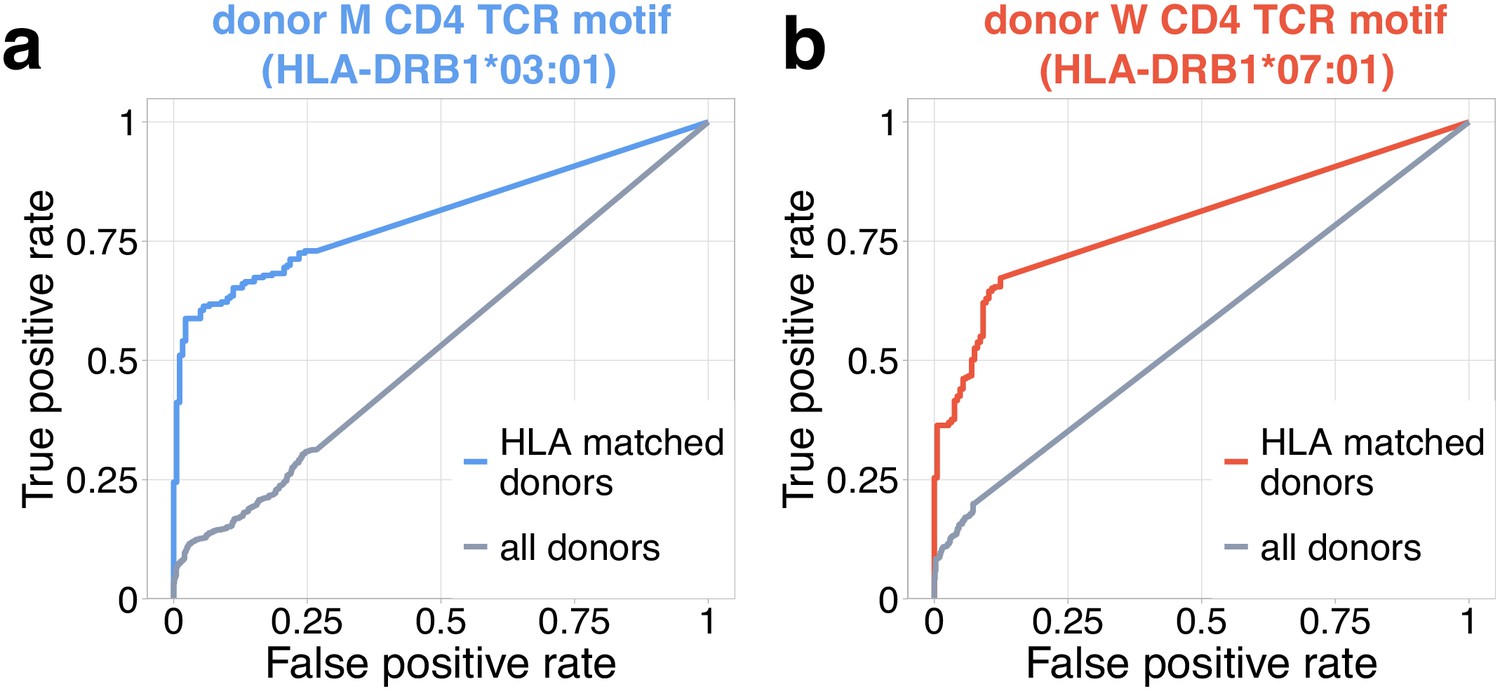
Identification of COVID-19 patients by frequency of TCR motifs from contracting CD4+ clones from donors M (a) and W (b).
Receiver operating characteristic (ROC) curves for classifying TCRbeta repertoires from COVID cohort vs control by cumulative frequency of clones from CD4beta motifs. Blue curve shows ROC curve (area under the ROC or AUROC = 0.8) for the classification of control and COVID donors predicted to be DRB1*03:01-DQB1*02:01 haplotype positive with motif from donor M. Red curve shows ROC curve (AUROC = 0.79) for classification of control and COVID donors predicted to be DRB1*07:01 positive using motif from donor W. Grey ROC curves show classifier performance on all donors, irrespective of HLA allele matching (AUROC = 0.53 for (a) and AUROC = 0.57 for (b)).
Tables
Key resources table
| Reagent type (species) or resource | Designation | Source or reference | Identifiers | Additional information |
|---|---|---|---|---|
| Antibody | Anti-CD3-FITC (mouse monoclonal) | eBioscience | CAT# 11-0038-42 | FACS (5 µl per test) |
| Antibody | Anti-CD45RA-eFluor450 (mouse monoclonal) | eBioscience | CAT# 48-0458-42 | FACS (5 µl per test) |
| Antibody | Anti-CCR7-APC (rat monoclonal) | eBioscience | CAT# 17-1979-42 | FACS (5 µl per test) |
| Antibody | Anti-CD95-PE (mouse monoclonal) | eBioscience | CAT# 12-0959-42 | FACS (5 µl per test) |
| Commercial assay or kit | Dynabeads CD4 Positive Isolation Kit | Invitrogen | CAT# 11331D | |
| Commercial assay or kit | Dynabeads CD8 Positive Isolation Kit | Invitrogen | CAT# 11333D |
Additional files
-
Supplementary file 1
List of all TCRbeta and TCRalpha libraries produced in this study.
- https://cdn.elifesciences.org/articles/63502/elife-63502-supp1-v2.tsv
-
Supplementary file 2
HLA-typing results for donors M and W.
- https://cdn.elifesciences.org/articles/63502/elife-63502-supp2-v2.tsv
-
Supplementary file 3
List of TCRbeta clonotypes contracting from day 15 to day 85.
- https://cdn.elifesciences.org/articles/63502/elife-63502-supp3-v2.tsv
-
Supplementary file 4
List of TCRalpha clonotypes contracting from day 15 to day 85.
- https://cdn.elifesciences.org/articles/63502/elife-63502-supp4-v2.tsv
-
Supplementary file 5
List of TCRbeta clonotypes expanding from day 15 to day 37.
- https://cdn.elifesciences.org/articles/63502/elife-63502-supp5-v2.tsv
-
Supplementary file 6
List of TCRalpha clonotypes expanding from day 15 to day 37.
- https://cdn.elifesciences.org/articles/63502/elife-63502-supp6-v2.tsv
-
Transparent reporting form
- https://cdn.elifesciences.org/articles/63502/elife-63502-transrepform-v2.docx
Download links
A two-part list of links to download the article, or parts of the article, in various formats.
Downloads (link to download the article as PDF)
Open citations (links to open the citations from this article in various online reference manager services)
Cite this article (links to download the citations from this article in formats compatible with various reference manager tools)
Longitudinal high-throughput TCR repertoire profiling reveals the dynamics of T-cell memory formation after mild COVID-19 infection
eLife 10:e63502.
https://doi.org/10.7554/eLife.63502


