McsB forms a gated kinase chamber to mark aberrant bacterial proteins for degradation
- Research Institute of Molecular Pathology (IMP), Vienna BioCenter, Austria
- Physical and Theoretical Chemistry Laboratory, Department of Chemistry, University of Oxford, United Kingdom
- Medical University of Vienna, Austria
Figures
Figure 1 with 2 supplements
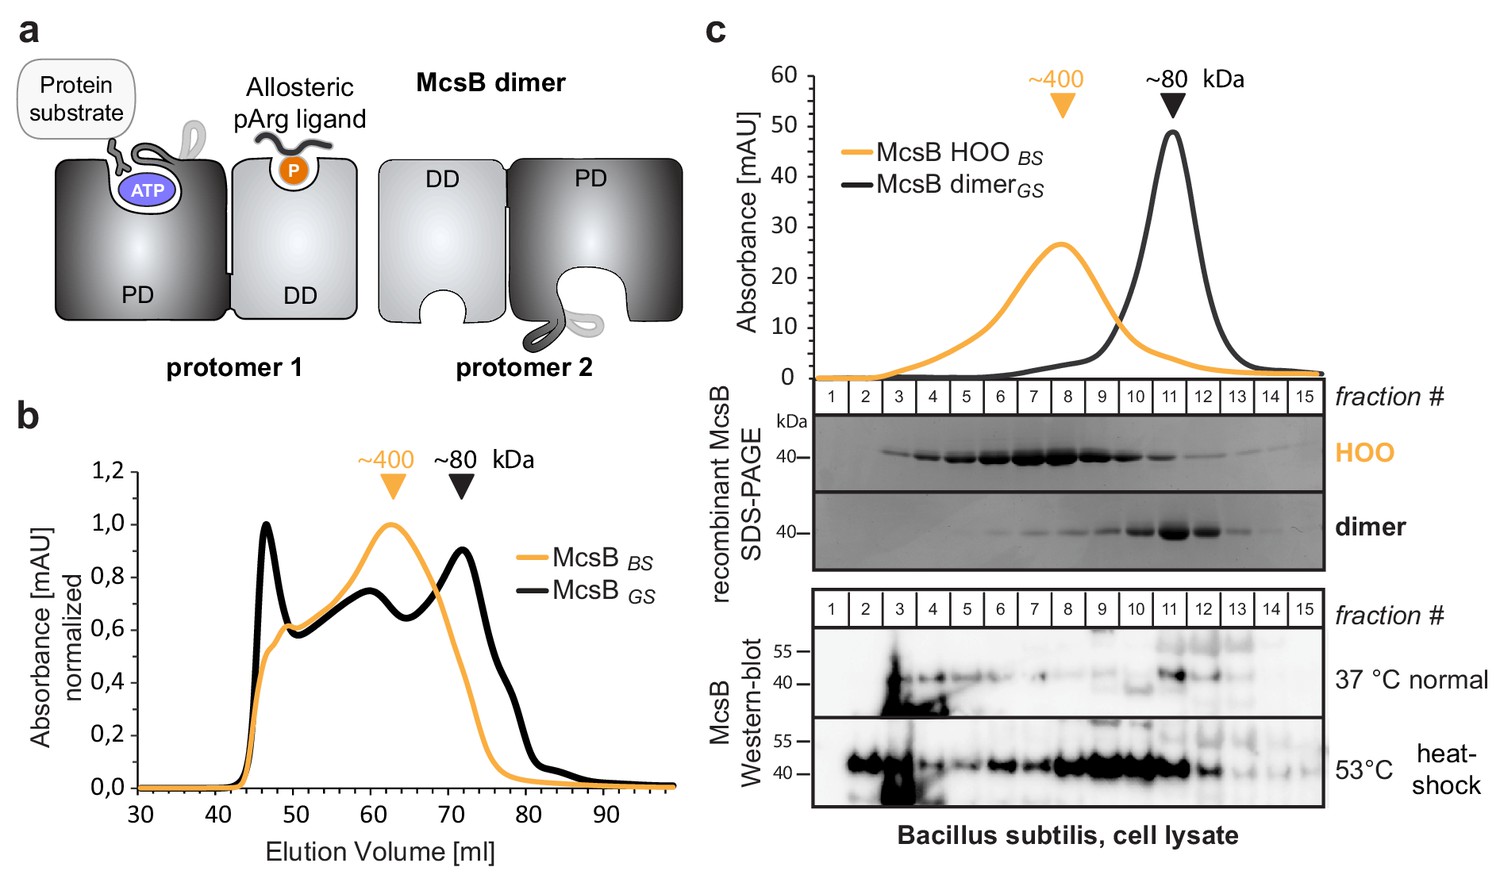
McsBBS forms higher order oligomers in vitro and in vivo.
(a) Schematic picture of the McsB dimer, emphasizing its domain architecture and the location of the catalytic and allosteric sites (PD, phosphotransferase domain; DD, dimerization domain). (b) Size exclusion chromatography (SEC) of recombinant McsBBS and McsBGS. Triangular markers indicate the protein size at the peaks. (c) SEC analysis of lysates of heat-shocked and non-heat shocked B. subtilis cell cultures. Comparing the western blots to SDS-PAGE gels of isolated McsB dimer and HOO reveals the different size distributions of McsB under the applied conditions.
-
Figure 1—source data 1
Annotated uncropped western blot gels of Figure 1c.
- https://cdn.elifesciences.org/articles/63505/elife-63505-fig1-data1-v2.docx
-
Figure 1—source data 2
High quality images of uncropped western blot gels of Figure 1c.
- https://cdn.elifesciences.org/articles/63505/elife-63505-fig1-data2-v2.zip
Figure 1—figure supplement 1
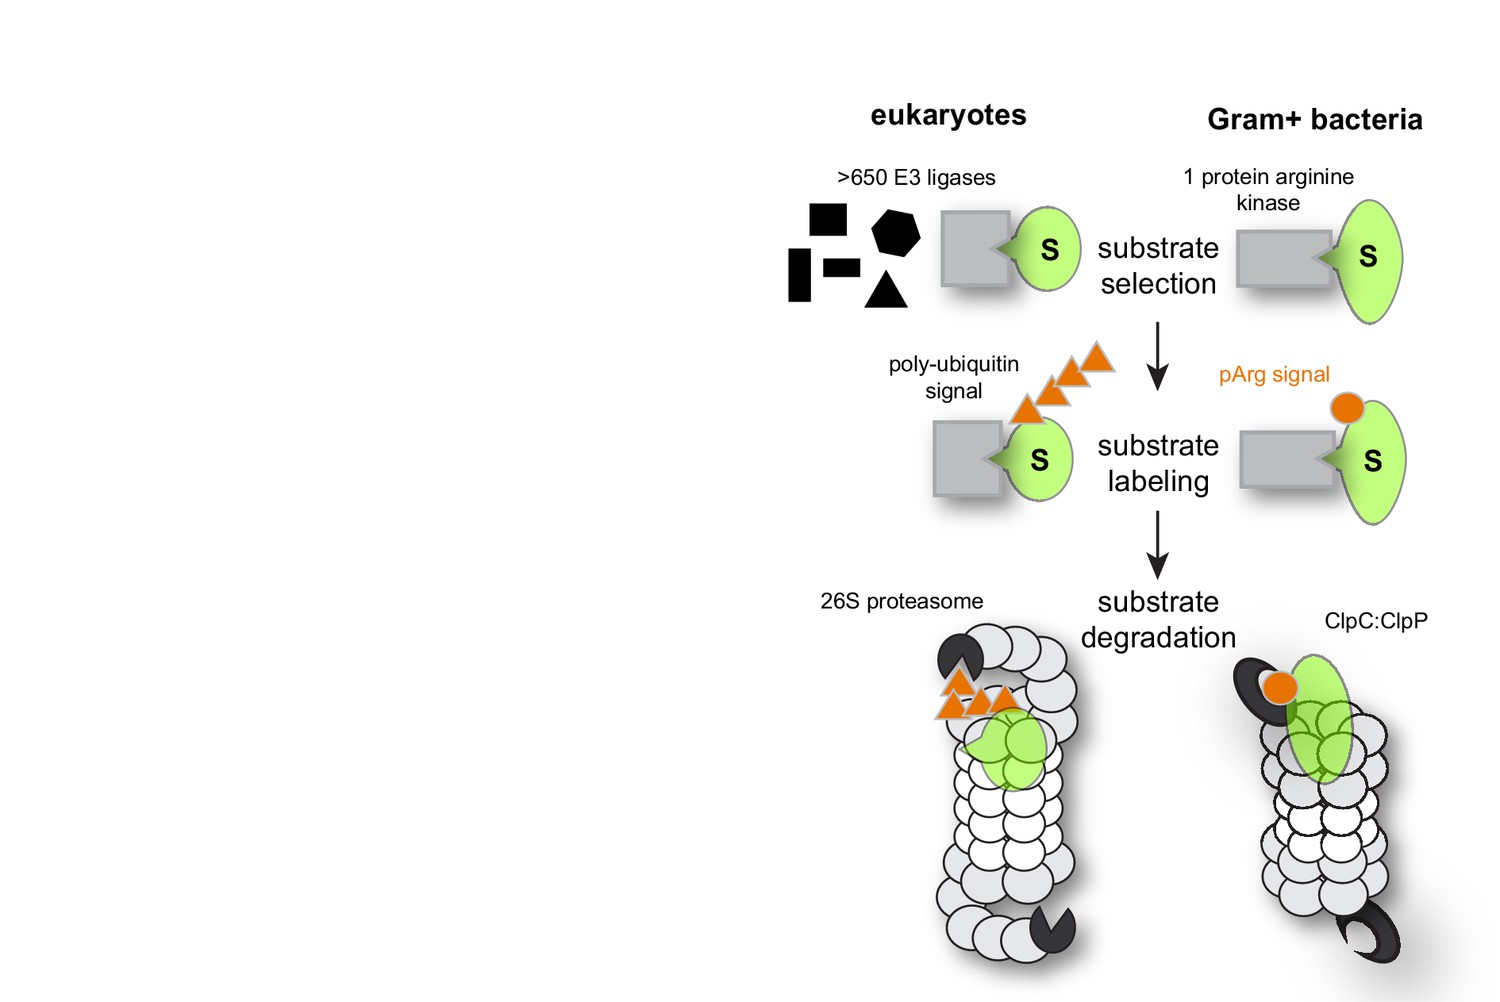
Degradation pathways in comparison.
Comparison of the ubiquitin-proteasome and pArg-ClpCP degradation pathways that are similarly organized but use distinct degradation signals (orange).
Figure 1—figure supplement 2
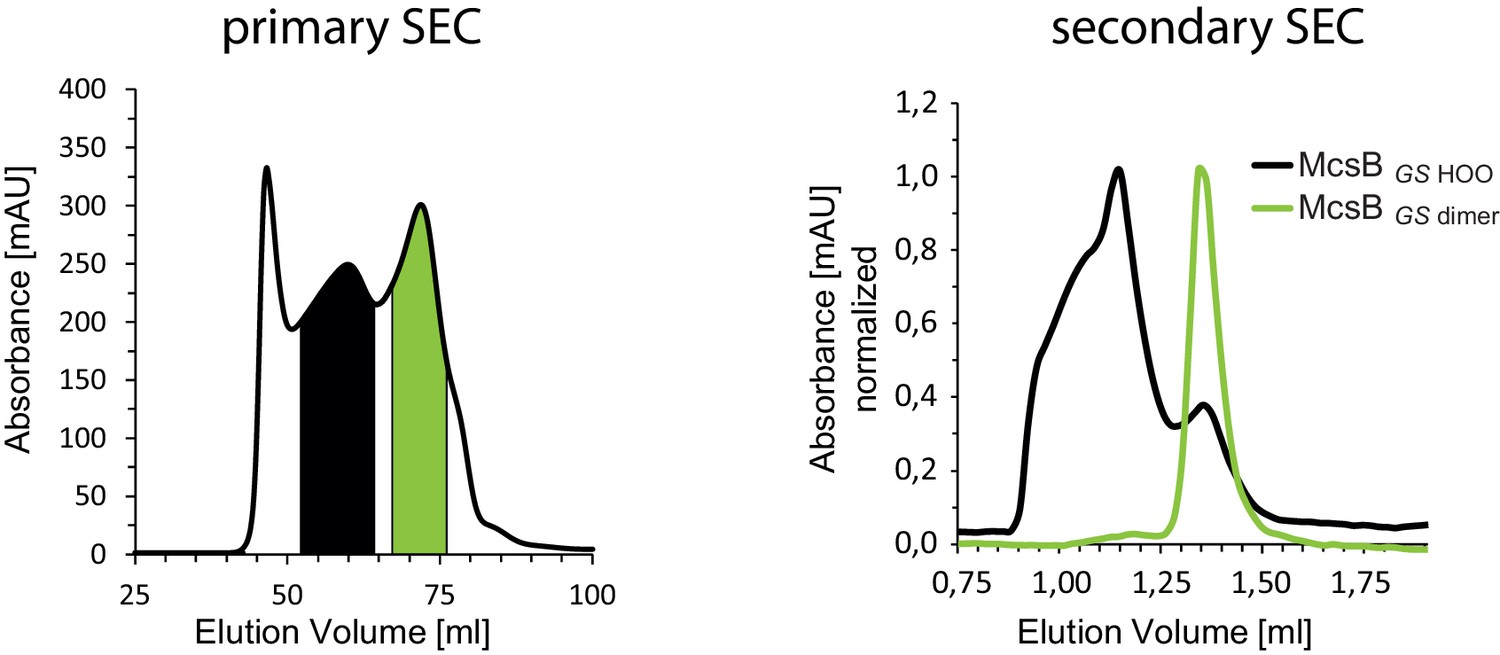
Higher order oligomers of McsBGS.
Size exclusion chromatography of recombinant McsBGS showing two dominant peaks (left panel). Secondary SEC runs of the two major peaks (right panel).
Figure 2 with 1 supplement
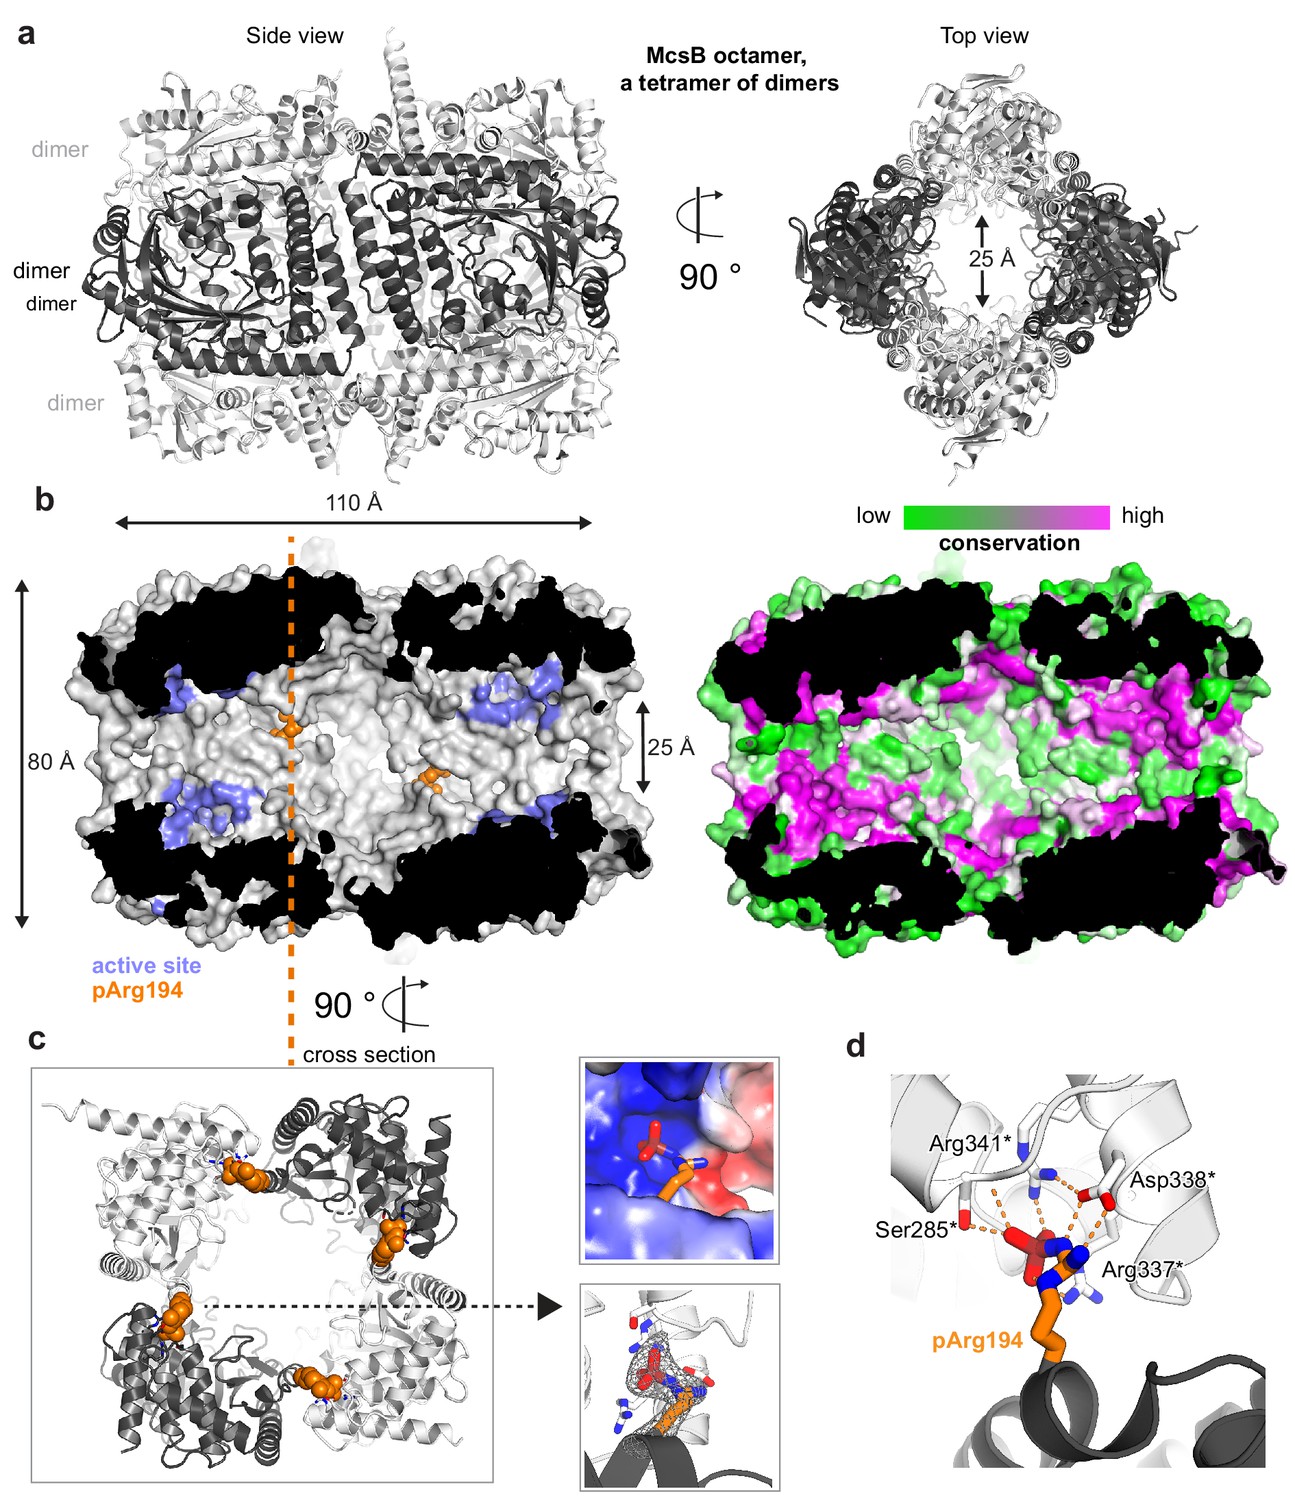
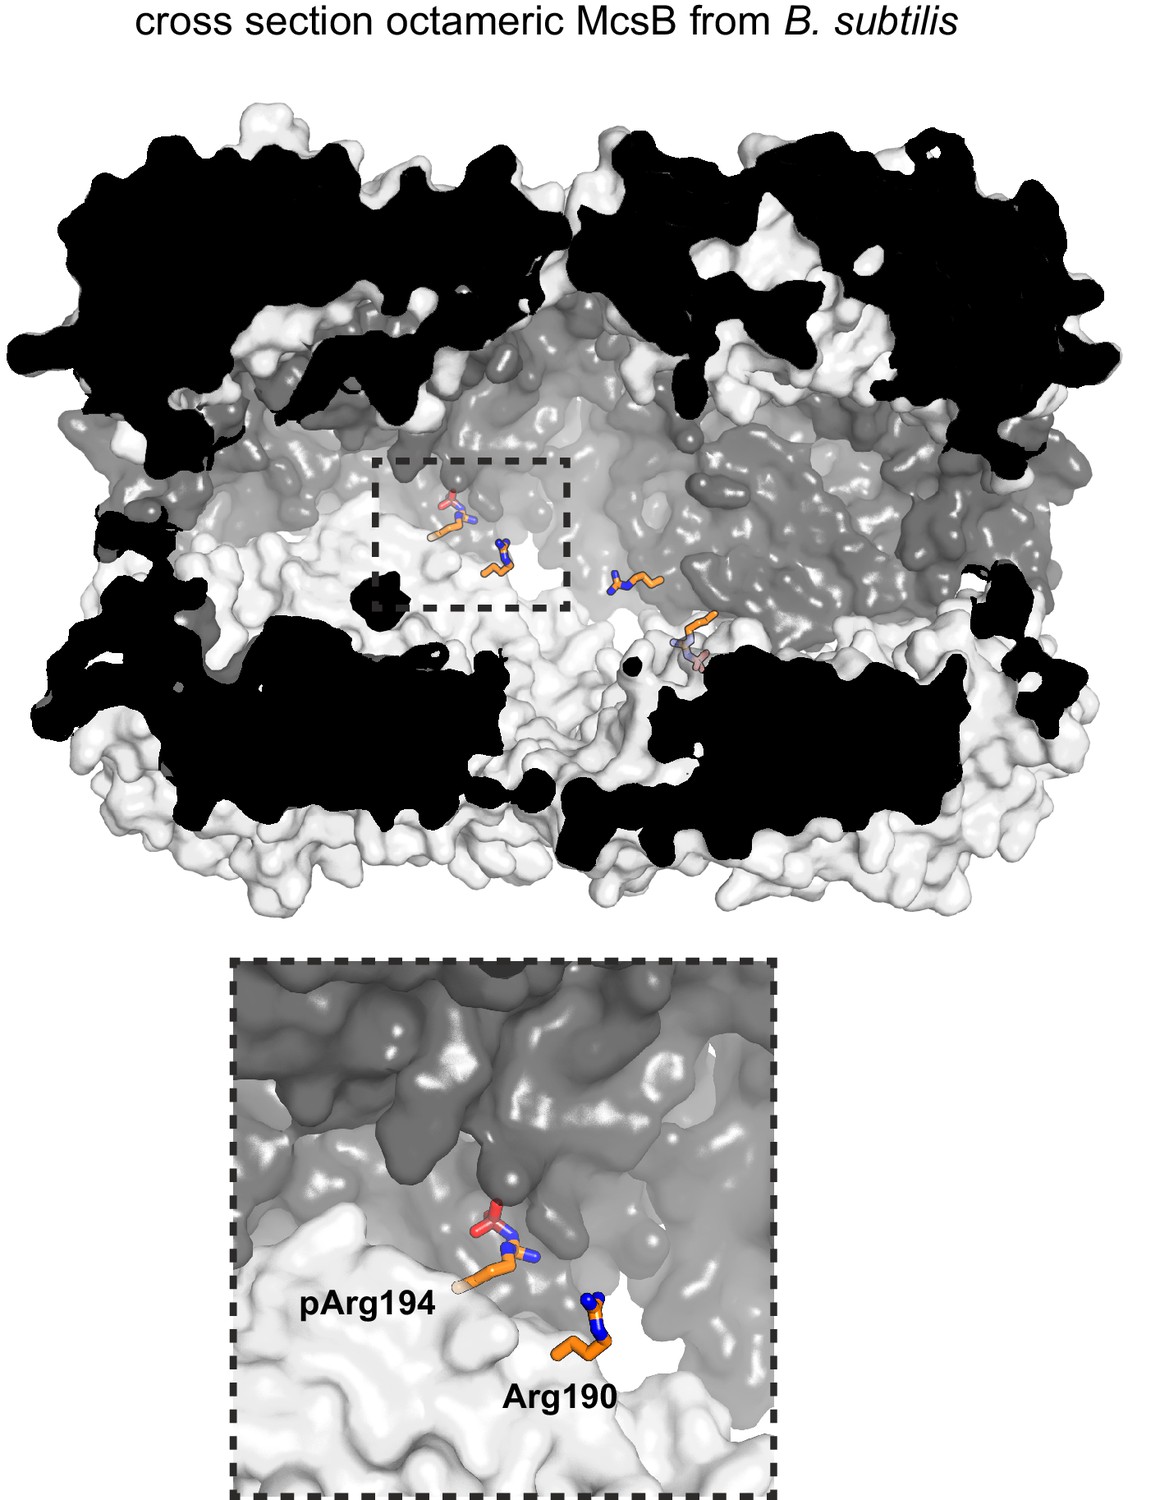
Crystal structure of the McsBBS octamer.
(a) Ribbon plot of the McsBBS octamer (side and top views) with alternating dimers colored differently. (b) McsB is a self-compartmentalized kinase, as shown in the half-cut surface representation. The location of the active sites within the phosphorylation chamber is highlighted in lilac and the pArg194 clamp in orange. The right panel illustrates the high conservation of the respective active site and interface regions. (c) Orthogonal view into the octamer (cross section indicated), with the pArg194 residue highlighted in orange. The right panel illustrates the binding of pArg194 in a complementary charged pocket of the neighboring subunit (top) and its Fo-Fc omit density calculated at 2.5 Å resolution and contoured at 3.0 σ (bottom). (d) Structural details of pArg194 locked by intermolecular contacts to the pR-RS of a neighboring protomer (asterisks indicate residues contributed by the adjacent molecule).
Figure 2—figure supplement 1

Comparison of McsBBS and McsBGS.
(a) Structural alignment of the functional dimer and (b) the pArg binding pocket. The two orthologs are colored differently.
Figure 3 with 2 supplements
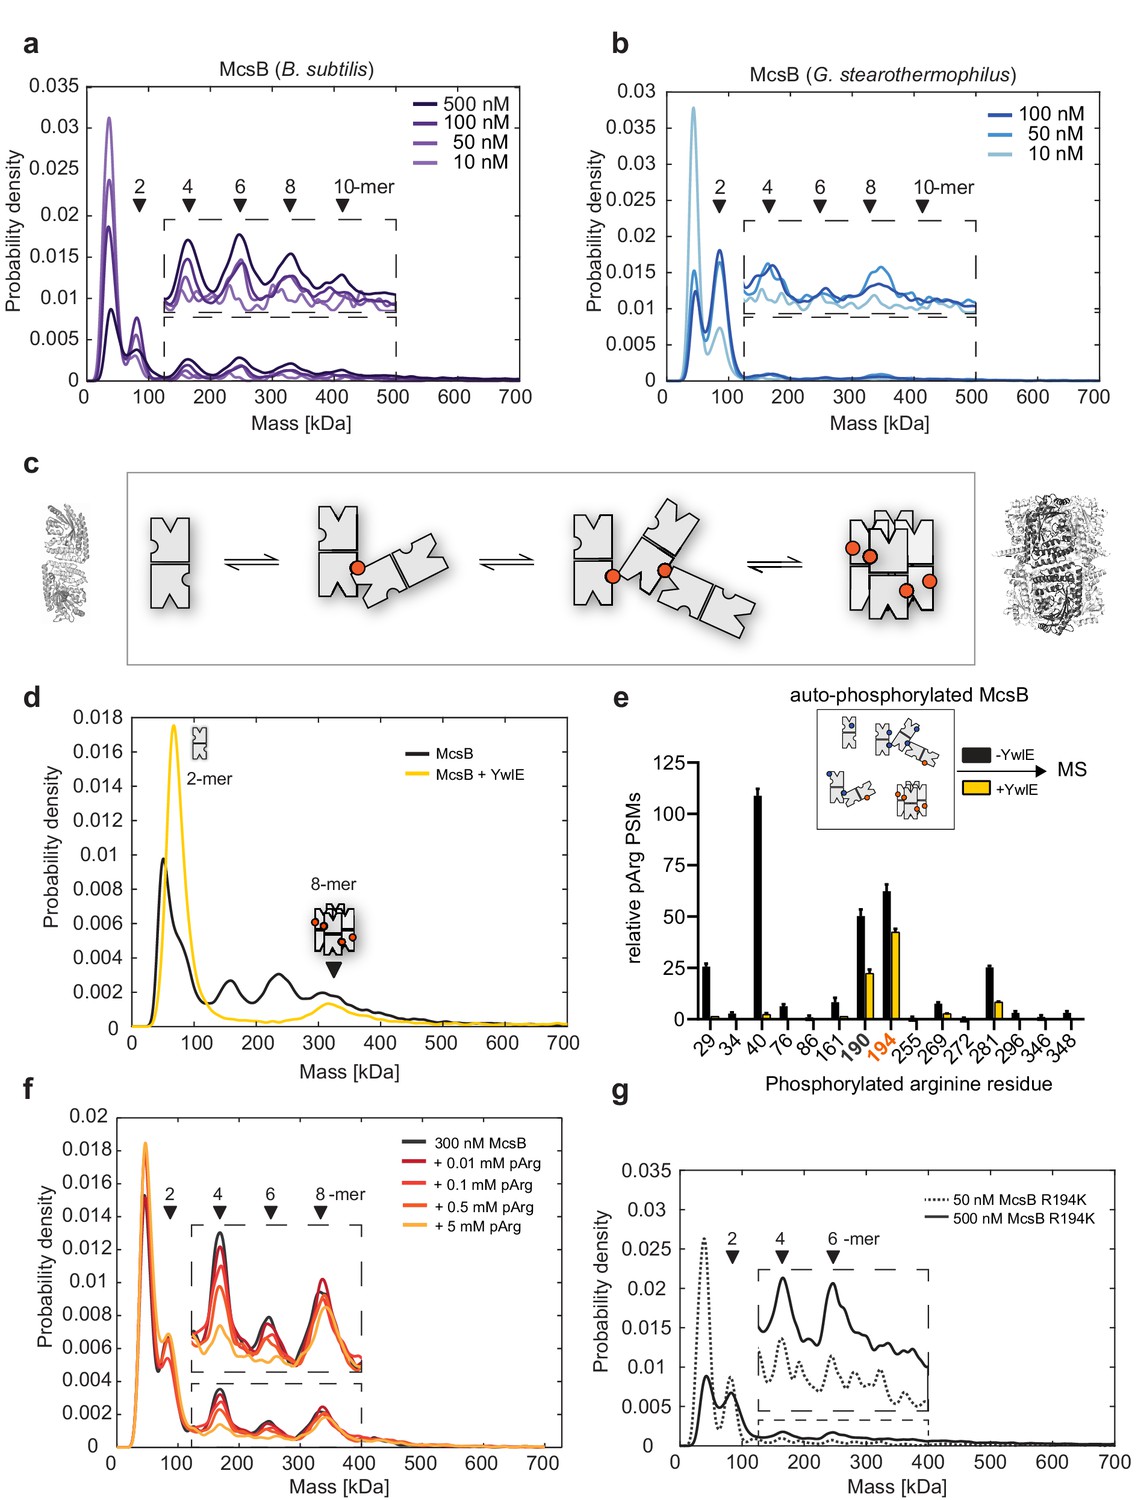
McsBBS oligomer conversion depends on a phospho-arginine switch.
(a) Distribution of McsBBS oligomers at increasing protein concentrations (10–500 nM). (b) Distribution of McsBGS at increasing protein concentration (10–100 nM). (c) Proposed model of McsB oligomer conversion, with pArg residues represented by colored circles. Structural data are present for dimer and octamer. (d) Mass photometric analysis of the effect of the YwlE phosphatase on McsBBS oligomer conversion. (e) MS data showing that all pArg residues of autophosphorylated McsB are quantitatively removed, except pArg190 and pArg194. The data show the relative number of phosphoarginine PSMs, plotted as mean ± standard deviation from three technical replicates. For absolute number of PSMs as well as all calculations refer to Source Data File. (f) Mass photometric analysis of the effect of free pArg on McsBBS oligomer conversion. (g) Mass photometric analysis of the R194K mutant, showing selective destabilization of the octamer. Size markers are indicated.
-
Figure 3—source data 1
Statistics summary of mass photometry experiments.
- https://cdn.elifesciences.org/articles/63505/elife-63505-fig3-data1-v2.docx
-
Figure 3—source data 2
Mass spectrometry data used for generating Figure 3e.
- https://cdn.elifesciences.org/articles/63505/elife-63505-fig3-data2-v2.xlsx
-
Figure 3—source data 3
Correlation of interferometric contrast and molecular mass.
- https://cdn.elifesciences.org/articles/63505/elife-63505-fig3-data3-v2.docx
Figure 3—figure supplement 1
Shielding of pArg190 and Arg194 in the dimer-dimer interface.
The surface plot shows a half-cut particle (semi-transparent surface), highlighting the burial of residues 190 and 194 in the octameric cage. Other auto-phosphorylated arginine residues shown in Figure 3e are surface exposed and thus accessible to YwlE.
Figure 3—figure supplement 2

pArg-binding-deficient mutant R337A/D338A.
Size exclusion chromatography analysis of the pArg-binding-deficient mutant R337A/D338A that mainly exists as a dimer. Size markers are indicated.
Figure 4

McsBBS dimer and octamer exhibit distinct kinase activities.
(a) Outline of preparing dimeric and octameric McsBBS (left panel). The established procedure efficiently reconstituted the two B. subtilis kinase forms, as seen in the SEC profiles of the separated McsBBS samples (right panel). (b) Radiometric 32P kinase assays visualizing the activity of dimeric and octameric McsBBS (1 µM) against β-casein (55 µM). ***p≤ 0.001; two-tailed unpaired t test. Data are plotted as mean ± SD (n=3, independent experiments) (c) Radiometric kinase assays using an McsB dilution series. To account for the different enzyme amounts (1000–50 nM), assays were incubated for different times (10–200 min).
-
Figure 4—source data 1
Annotated uncropped gels (4b, 4c) and gels used for quantification (4b).
- https://cdn.elifesciences.org/articles/63505/elife-63505-fig4-data1-v2.docx
-
Figure 4—source data 2
High quality images of uncropped gels (4b, 4c) and gels used for quantification (4b).
- https://cdn.elifesciences.org/articles/63505/elife-63505-fig4-data2-v2.zip
-
Figure 4—source data 3
Quantification of gels used for generating the graph in Figure 4b.
- https://cdn.elifesciences.org/articles/63505/elife-63505-fig4-data3-v2.xlsx
Figure 5 with 1 supplement

A switch in oligomeric state causes a switch in substrate selectivity.
(a) Radiometric assays of dimeric and octameric McsBBS (1 µM) using different model substrates. Quantification of activities of dimer (black) and octamer (orange) after 60 min of incubation highlights the distinct substrate preferences (top, representative gel; bottom, quantification of 32P signal after 60 min, raw data in source data file). Data are plotted as mean ± SD (n=4, independent reactions). Relative activity as mean ± SD. (b) (Top) Kinase assay using the model substrate UNC-45 confirms the substrate filtering role of the octameric cage (top, representative gel; bottom, quantification of 32P signal after 60 min, raw data in source data file). Data are plotted as mean ± SD (n=4, independent reactions). Relative activity as mean ± SD. (c) Secondary SEC runs of the McsBBS R190A/R194A mutant enriched in either HOOs (higher-order oligomers) or dimers at 20 µM concentration (d) Radiometric kinase assay of wildtype McsBBS and the McsBBS R190A/R194A mutant enriched in either HOOs (higher order oligomers) or dimers (1 µM) against the folded model protein UNC-45core (top, representative gel; bottom, quantification of 32P signal after 60 min). Data are plotted as mean ± SD (n=3, independent reactions). Relative activity as mean ± SD.
-
Figure 5—source data 1
Annotated uncropped gels (5a, b, d) and gels used for quantification (5a, b, d).
- https://cdn.elifesciences.org/articles/63505/elife-63505-fig5-data1-v2.docx
-
Figure 5—source data 2
High quality images of uncropped gels (5a, b, d) and gels used for quantification (5a, b, d).
- https://cdn.elifesciences.org/articles/63505/elife-63505-fig5-data2-v2.zip
-
Figure 5—source data 3
Quantification of gels used for generating the graph in Figure 5a,b,d.
- https://cdn.elifesciences.org/articles/63505/elife-63505-fig5-data3-v2.xlsx
Figure 5—figure supplement 1
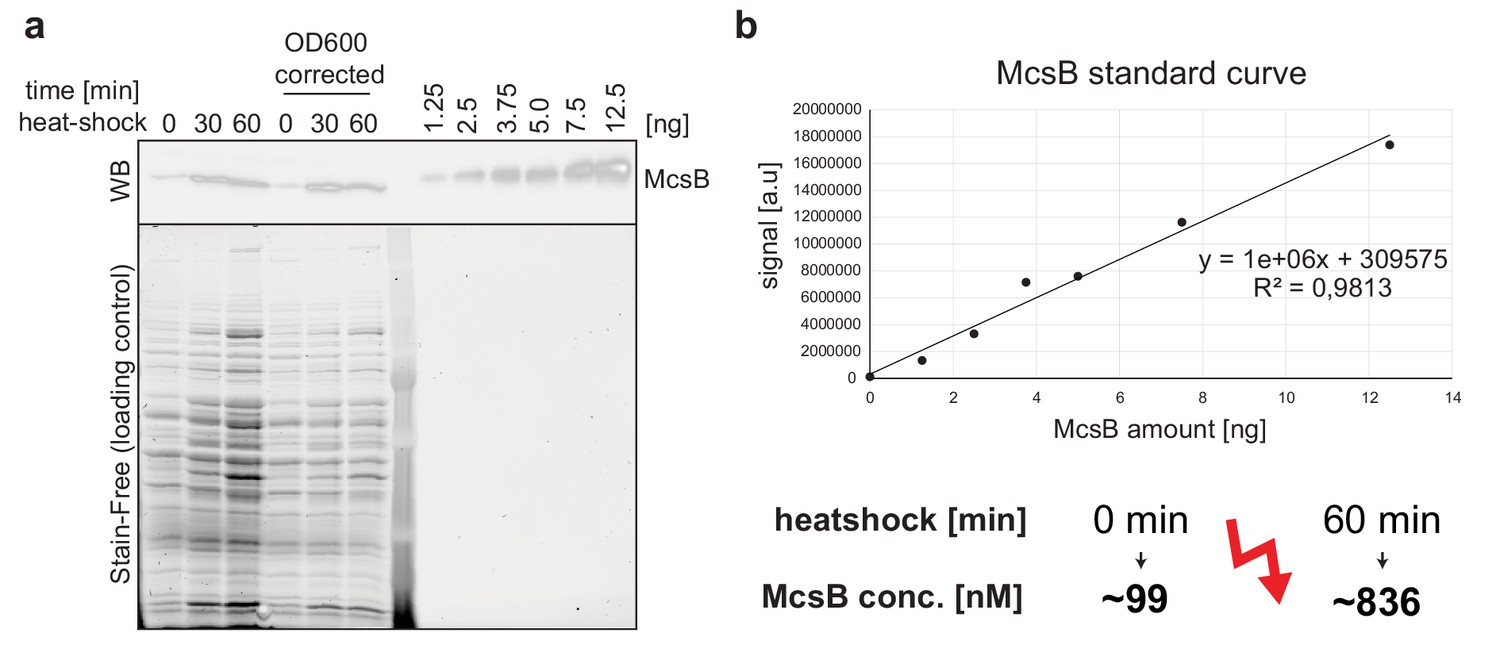
Quantitative western blot assay of McsB in B.subtilis.
(a) Anti-McsB western blot of heat shocked B. subtilis (left) and of defined amounts of recombinant McsB from B. subtilis (right) used for creating a standard curve. Corresponding loading controls are shown below. (b) Standard curve used for estimating McsB levels in vivo (OD600 corrected samples).
-
Figure 5—figure supplement 1—source data 1
Annotated uncropped western blot (Figure 5—figure supplement 1a).
- https://cdn.elifesciences.org/articles/63505/elife-63505-fig5-figsupp1-data1-v2.docx
-
Figure 5—figure supplement 1—source data 2
High quality images of uncropped western blot (Figure 5—figure supplement 1a).
- https://cdn.elifesciences.org/articles/63505/elife-63505-fig5-figsupp1-data2-v2.zip
-
Figure 5—figure supplement 1—source data 3
Calculations used for determining the in vivo McsB levels in B. subtilis (Figure 5—figure supplement 1b).
- https://cdn.elifesciences.org/articles/63505/elife-63505-fig5-figsupp1-data3-v2.xlsx
Figure 6 with 2 supplements
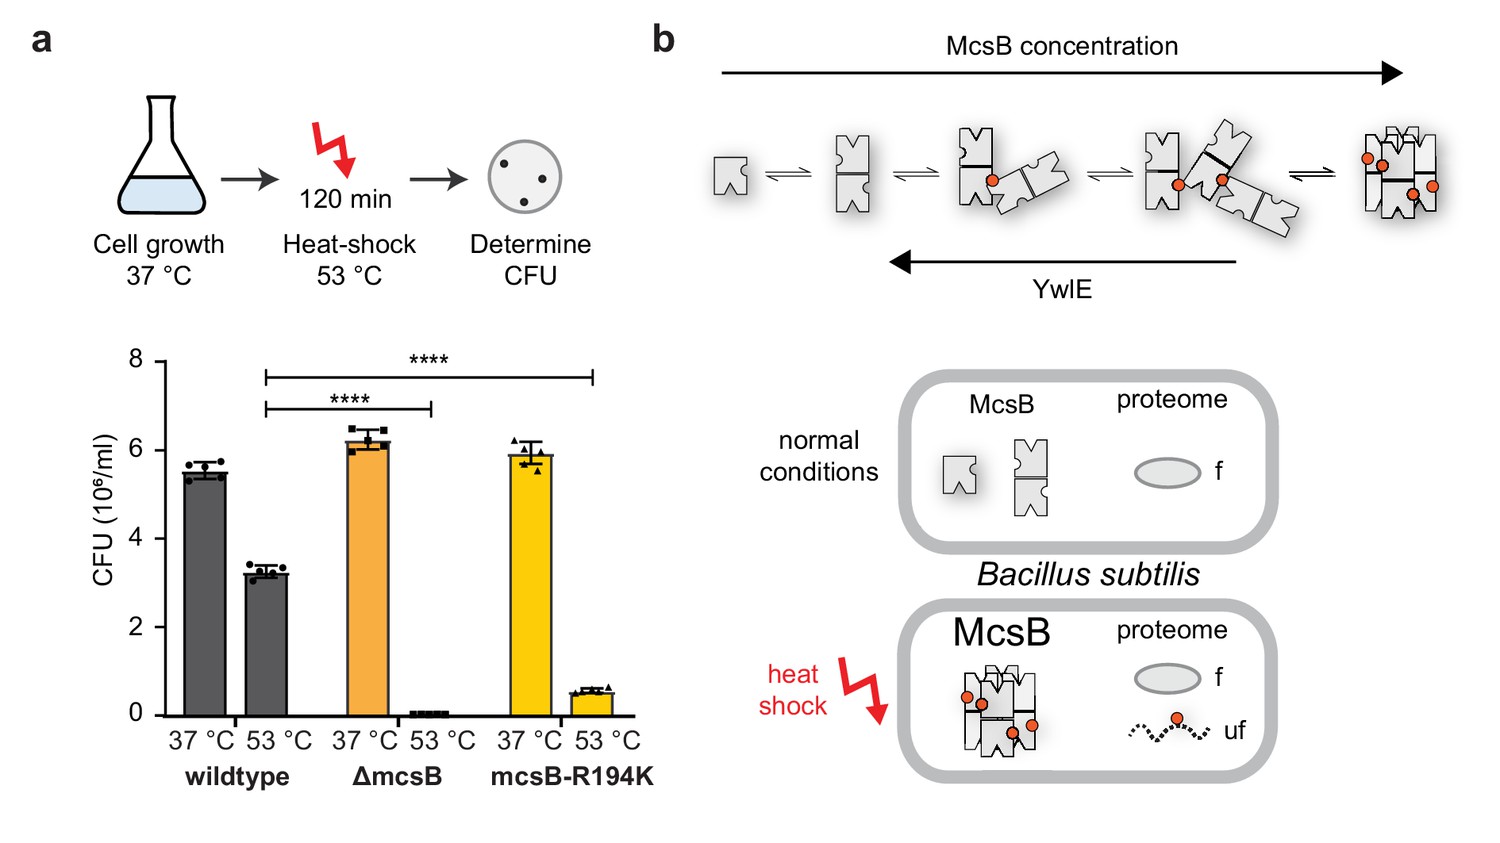
Octamer formation of McsB is critical for the heat-shock response.
(a) In vivo analysis of the R194K McsB oligomerization mutant. Compared to wildtype B. subtilis cells, ∆mcsB and R194K mutant cells exhibit a strong thermo-sensitive phenotype. ****p ≤ 0.0001; one-way ANOVA and Tukey’s multiple comparison test of heat-shocked samples. Data are plotted as mean ± SD (n=5, biological independent samples). Error bars indicate SD. (b) Proposed model illustrating how McsB protein concentration and YwlE activity shape the distribution of McsB oligomers. pArg phospho marks are indicated by red spheres. As shown below, monomer and dimer are prevalent under non-stress conditions. Presumably, their activity on folded proteins (f) can be reversed by the arginine phosphatase YwlE. Under heat-shock, McsB and other components of the stress response machinery are strongly enriched, favoring formation of octameric particles that selectively target misfolded (uf) proteins.
-
Figure 6—source data 1
Quantification of colonies used for generating the graph in Figure 6a.
- https://cdn.elifesciences.org/articles/63505/elife-63505-fig6-data1-v2.xlsx
Figure 6—figure supplement 1
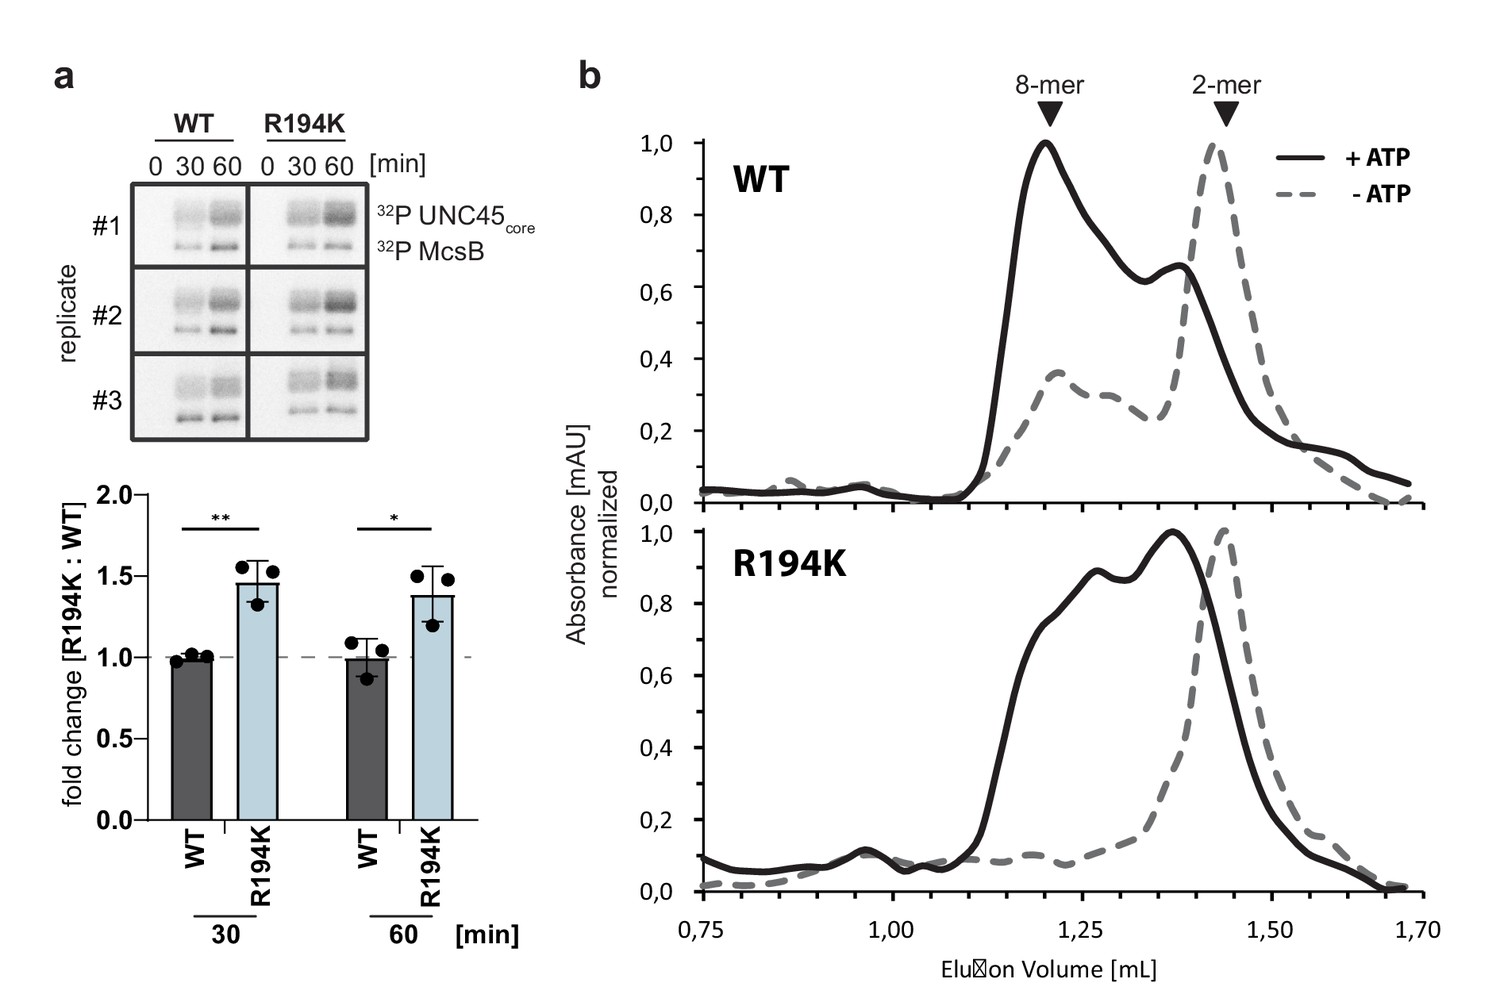
Comparing wildtype and R194K mutant McsB.
(a) Radiometric kinase assay comparing wildtype and R194K mutant McsB (1 µM) against the folded model substrate UNC45core (top). Fold change in activity of R194K mutant at 30- and 60 min relative to mean of wildtype McsB activity (bottom). **p≤ 0.01; *p≤ 0.05; multiple t test. Data are plotted as mean ± SD (n=3, independent reactions). (b) SEC analysis of autophosphorylated dimeric wildtype and R194K McsB (2.5 µM).
-
Figure 6—figure supplement 1—source data 1
Annotated uncropped gels (Figure 6—figure supplement 1a) and gels used for quantification (Figure 6—figure supplement 1a).
- https://cdn.elifesciences.org/articles/63505/elife-63505-fig6-figsupp1-data1-v2.docx
-
Figure 6—figure supplement 1—source data 2
High quality images of uncropped gels (Figure 6—figure supplement 1a) and gels used for quantification (Figure 6—figure supplement 1a).
- https://cdn.elifesciences.org/articles/63505/elife-63505-fig6-figsupp1-data2-v2.zip
-
Figure 6—figure supplement 1—source data 3
Quantification of gels used for generating the graph in Figure 6—figure supplement 1a.
- https://cdn.elifesciences.org/articles/63505/elife-63505-fig6-figsupp1-data3-v2.xlsx
Figure 6—figure supplement 2
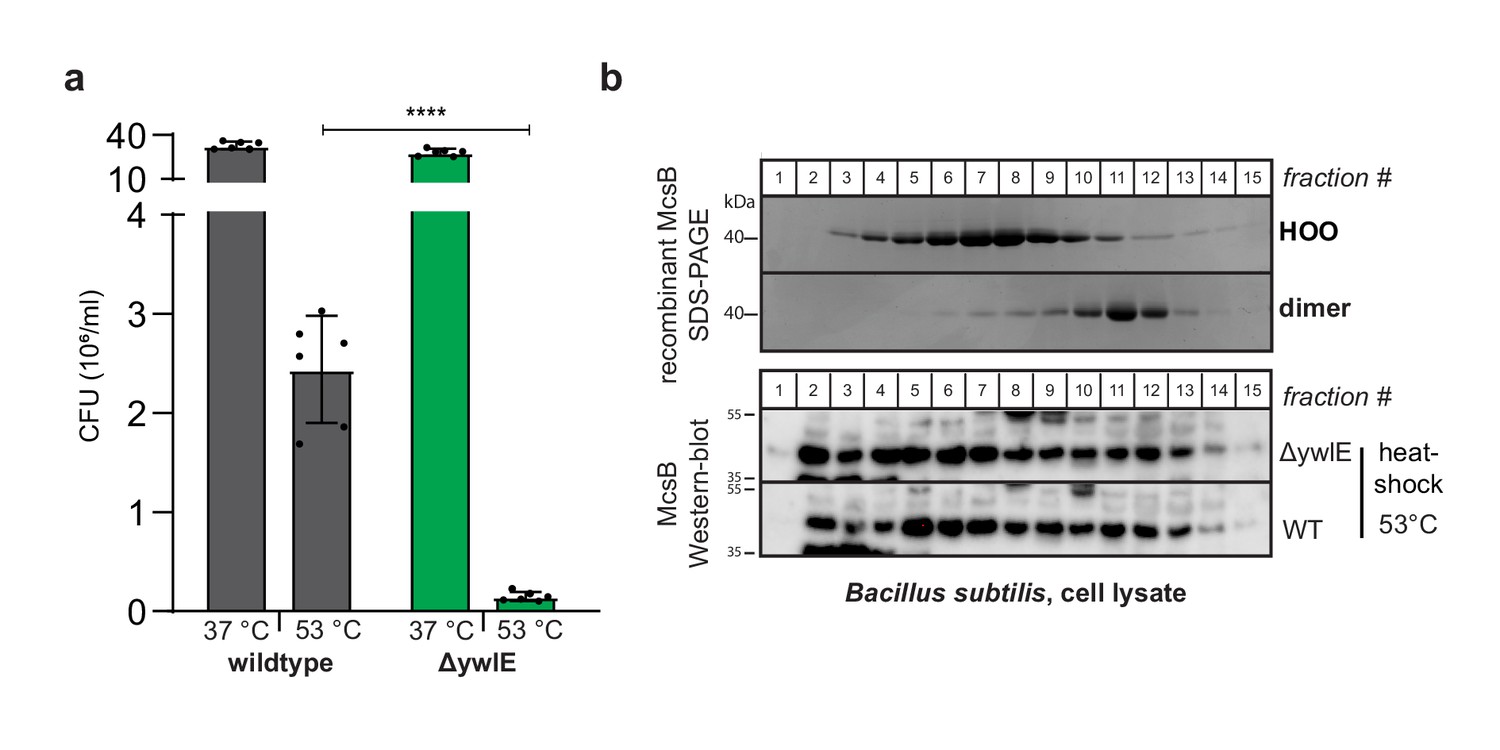
Thermosensitive phenotype of ΔywlE B.subtilis.
(a) In vivo heat shock assay comparing wildtype B. subtilis and the ΔywlE mutant. ****p ≤ 0.0001; one-way ANOVA and Tukey’s multiple comparison test of heat-shocked samples. Data are plotted as mean ± SD (n=3, biological independent samples). Each sample was plated two times (technical replicates) resulting in six data points per column. Error bars indicate SD. (b) Anti-McsB western blot analysis of lysate of heat-shocked wildtype and ΔywlE B. subtilis cultures separated with size exclusion chromatography (bottom) compared to SDS-PAGE of isolated dimeric and higher order McsB (top) serving as size markers.
-
Figure 6—figure supplement 2—source data 1
Quantification of colonies used for generating the graph in Figure 6—figure supplement 2a.
- https://cdn.elifesciences.org/articles/63505/elife-63505-fig6-figsupp2-data1-v2.xlsx
-
Figure 6—figure supplement 2—source data 2
Annotated uncropped western blot (Figure 6—figure supplement 2b).
- https://cdn.elifesciences.org/articles/63505/elife-63505-fig6-figsupp2-data2-v2.docx
-
Figure 6—figure supplement 2—source data 3
High quality images ofu ncropped western blot (Figure 6—figure supplement 2b).
- https://cdn.elifesciences.org/articles/63505/elife-63505-fig6-figsupp2-data3-v2.zip
Author response image 1
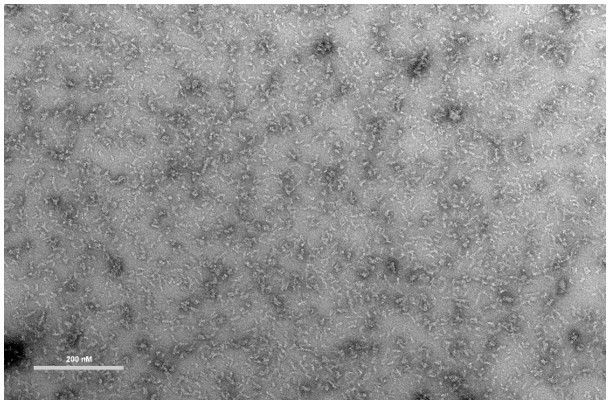
Negative-stain EM of recombinant McsB enriched in HOOs (higher-order oligomers).
Bar; 200 nM. Staining was performed with 2% uranyl acetate. Measured on a FEI Morgagni 268D microscope operated at 80 kV.
Author response image 2
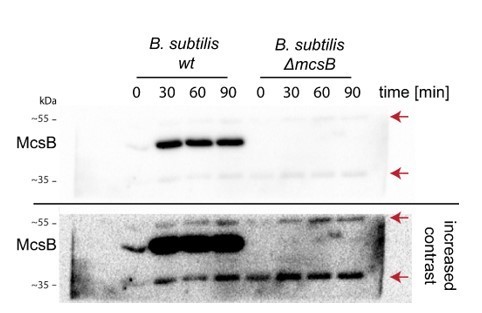
Anti-mcsB Western blot of wildtype and δ-mcsB B. subtilis at different heat-shock durations.
Red arrows indicate the unspecific 55 and 35 kDa bands.
Videos
Video 1
Illustration of the structural organization of the McsBBS octamer, which forms a self-compartmentalized protein kinase.
The video introduces the basic building block, the McsB dimer, showing the location of the active site and the pArg clamp. After assembling the McsB octamer, the surface presentation emphasizes the self-compartmentalization of the protein kinase, locking the active sites within a phosphorylation chamber. Narrow entry gates restrict access of substrate allowing the selective degradation labeling of unfolded proteins or protein segments.
Tables
Table 1
Data collection and refinement statistics.
| Octameric McsBBS (6TV6) | ||
|---|---|---|
| Space group | P21212 | |
| Cell dimensions | ||
| a, b, c (Å) | 137.79, 147.64, 81.47 | |
| α, β, γ (°) | 90, 90, 90 | |
| Resolution (Å)a | 49–2.5 (2.56–2.5) | |
| Rmeas(I) | 0.146 (1.53) | |
| I/σ (I) | 13.2 (1.2) | |
| CC1/2 | 0.998 (0.561) | |
| Completeness (%) | 99.8 (99.8) | |
| Redundancy | 6.7 (6.9) | |
| Resolution (Å) | 49–2.5 | |
| No. reflections | 58,139 | |
| Rwork / Rfree | 0.193 / 0.237 | |
| No. atoms | ||
| Protein | 11,289 | |
| ion | 4 | |
| Water | 117 | |
| B factors | ||
| Protein | 55.6 | |
| Ion | 57.7 | |
| Water | 51.4 | |
| R.m.s. deviations | ||
| Bond lengths (Å) | 0.009 | |
| Bond angles (°) | 1.083 | |
-
aValues in parentheses are for highest-resolution shell.
Key resources table
| Reagent type (species) or resource | Designation | Source or reference | Identifiers | Additional information |
|---|---|---|---|---|
| Gene (Bacillus subtilis) | McsB from B. subtilis | UniProt | P37570 | - |
| Gene (Geobacillus stearothermophilus) | McsB from G. stearothermophilus | UniProt | P0DMM5 | - |
| Gene (Geobacillus stearothermophilus) | YwlE from G. stearothermophilus | UniProt | S0F332 | - |
| Strain, strain background | Bacillus subtilis, strain 168, WT | Lab stock | - | - |
| Strain, strain background | Bacillus subtilis, strain 168, ΔmcsB | Suskiewicz et al., 2019 | - | Markerless genomic mutation |
| Strain, strain background | Bacillus subtilis, strain 168, R194K | This study | - | Markerless genomic mutation |
| Strain, strain background | Bacillus subtilis, strain 168, ΔywlE | Kindly provided by Emmanuelle Charpentier | - | Markerless genomic mutation |
| Recombinant DNA reagent | McsB from B. subtilis | Trentini et al., 2016 | RRID:Addgene_173905 | pET-21a plasmid containing mcsB-His6 from B. subtilis |
| Recombinant DNA reagent | McsB from G. stearothermophilus | Suskiewicz et al., 2019 | RRID:Addgene_173906 | pET-21a plasmid containing mcsB-His6 fromG. stearothermophilus |
| Recombinant DNA reagent | YwlE from G. stearothermophilus | Fuhrmann et al., 2013 | RRID:Addgene_173911 | pET-21a plasmid containing ywlE-His6 from G. stearothermophilus |
| Recombinant DNA reagent | McsB from B. subtilis R194K | This study | RRID:Addgene_173907 | pET-21a plasmid containing mcsB R194K-His6 from B. subtilis |
| Recombinant DNA reagent | McsB from B. subtilis R190A/ R194A | This study | RRID:Addgene_173908 | pET-21a plasmid containing mcsB R190A/R194A-His6 from B. subtilis |
| Recombinant DNA reagent | McsB from B. subtilis R337A/ D338A | This study | RRID:Addgene_173909 | pET-21a plasmid containing mcsB R337A/ D338A-His6 from B. subtilis |
| Recombinant DNA reagent | Kre | This study | RRID:Addgene_173912 | pET-21a plasmid containing kre-His6 from B. subtilis |
| Peptide, recombinant protein | McsB from B. subtilis | This study | NP_387966.1 | C-terminal 6xHis |
| Peptide, recombinant protein | McsB from G. stearothermophilus | This study | WP_033017267.1 | C-terminal 6xHis |
| Peptide, recombinant protein | YwlE from G. stearothermophilus | This study | WP_033017317.1 | C-terminal 6xHis |
| Peptide, recombinant protein | McsB from B. subtilis R194K | This study | NP_387966.1:p.Arg194Lys | C-terminal 6xHis |
| Peptide, recombinant protein | McsB from B. subtilis R190A/ R194A | This study | NP_387966.1:p.Arg190Ala_ Arg194Ala | C-terminal 6xHis |
| Peptide, recombinant protein | McsB from B. subtilis R337A/ D338A | This study | NP_387966.1:p.Arg337Ala_ Asp338Ala | C-terminal 6xHis |
| Peptide, recombinant protein | Kre | This study | NP_389285.1 | ComK repressor |
| Peptide, recombinant protein | v-Myc | Kindly provided by Konrat lab | NP_045935.1:p.Met1_Gln312del | bHLHZip domain |
| Peptide, recombinant protein | UNC45 from C. elegans | Kindly provided by VBCF (Anita Lehner) | NP_497205.1 | C-terminal StrepII |
| Peptide, recombinant protein | UNC45core | Kindly provided by VBCF (Anita Lehner) | NP_497205.1:p.Glu522_Glu961del | C-terminal StrepII |
| Peptide, recombinant protein | beta-casein | SigmaAldrich | C6905 | β-Casein from bovine milk |
| Antibody | Anti-McsB (Rabbit polyclonal) | Suskiewicz et al., 2019 | - | WB (1:5000) |
| Antibody | Anti-YwlE (Rabbit polyclonal) | Fuhrmann et al., 2016 | - | Immuno- depletion (0.1 mg/ml) |
| Sequence-based reagent | pET21-mcsB R337A/D338A-His6_F | This study | - | GCCATTCGAAGAGCGGCTCTCATCAG |
| Sequence-based reagent | pET21-mcsB R337A/D338A-His6_R | This study | - | CGCTTCGTTCGGTCGCAAAGCGCC |
| Sequence-based reagent | pET21-mcsB R190A/R194A-His6_F | This study | - | TAAATGCAATTATACCGGCAATTAATCAATTAGGCTTAGTTGTTAG |
| Sequence-based reagent | pET21-mcsB R190A/R194A-His6_R | This study | - | TTTGCGCAGTTAAAACCAGCGCCGGCAGATGCATCATGACCG |
| Sequence-based reagent | pET21-mcsB R194K-His6_F | This study | - | GATTAATTGCCGGTATAATTTTATTTATTTGCCTAGTTAAAACCAGCGCCG |
| Sequence-based reagent | pET21-mcsB R194K-His6_R | This study | - | CGGCGCTGGTTTTAACTAGGCAAATAAATAAAATTATACCGGCAATTAATC |
| Sequence-based reagent | pMAD- mcsB R194K_F | This study | - | ATTATACCGGCAATTAATCA |
| Sequence-based reagent | pMAD- mcsB R194K _R | This study | - | TTTATTTATTTGCCTAGTTAAAACC |
| Other | [gamma-P32] ATP | Hartmann Analytics | #SRP-501 | Volume: 250 uCi |
| Software, algorithm | XDS package | doi:10.1107/S0907444909047337 | RRID:SCR_015652 | https://xds.mr.mpg.de/ |
| Software, algorithm | PHASER | doi:10.1107/S0021889807021206 | RRID:SCR_014219 | - |
| Software, algorithm | Phenix | doi:10.1107/S2059798319011471 | RRID:SCR_014224 | https://www.phenix-online.org/ |
| Software, algorithm | Coot | doi:10.1107/S0907444904019158 | RRID:SCR_014222 | https://www2.mrc-lmb.cam.ac.uk/personal/pemsley/coot/ |
| Software, algorithm | Molprobity | doi:10.1002/pro.3330 | RRID:SCR_014226 | http://molprobity.biochem.duke.edu |
| Software, algorithm | Pymol | other | RRID:SCR_000305 | https://pymol.org/2/ |
Additional files
Download links
A two-part list of links to download the article, or parts of the article, in various formats.
Downloads (link to download the article as PDF)
Open citations (links to open the citations from this article in various online reference manager services)
Cite this article (links to download the citations from this article in formats compatible with various reference manager tools)
McsB forms a gated kinase chamber to mark aberrant bacterial proteins for degradation
eLife 10:e63505.
https://doi.org/10.7554/eLife.63505


