The allosteric modulation of complement C5 by knob domain peptides
- UCB, United Kingdom
- Department of Biology and Biochemistry, University of Bath, United Kingdom
- European Molecular Biology Laboratory, Hamburg Unit, Germany
- Department of Statistics, University of Oxford, United Kingdom
- Department of Chemistry and Biomedicine, Linnaeus University, Sweden
- Department of Immunology, Oslo University Hospital, University of Oslo, Norway
- Research Laboratory, Bodø Hospital, K.G. Jebsen TREC, University of Tromsø, Norway
- Centre of Molecular Inflammation Research, Norwegian University of Science and Technology, Norway
- Centre for Therapeutic Innovation, University of Bath, United Kingdom
Figures
Figure 1
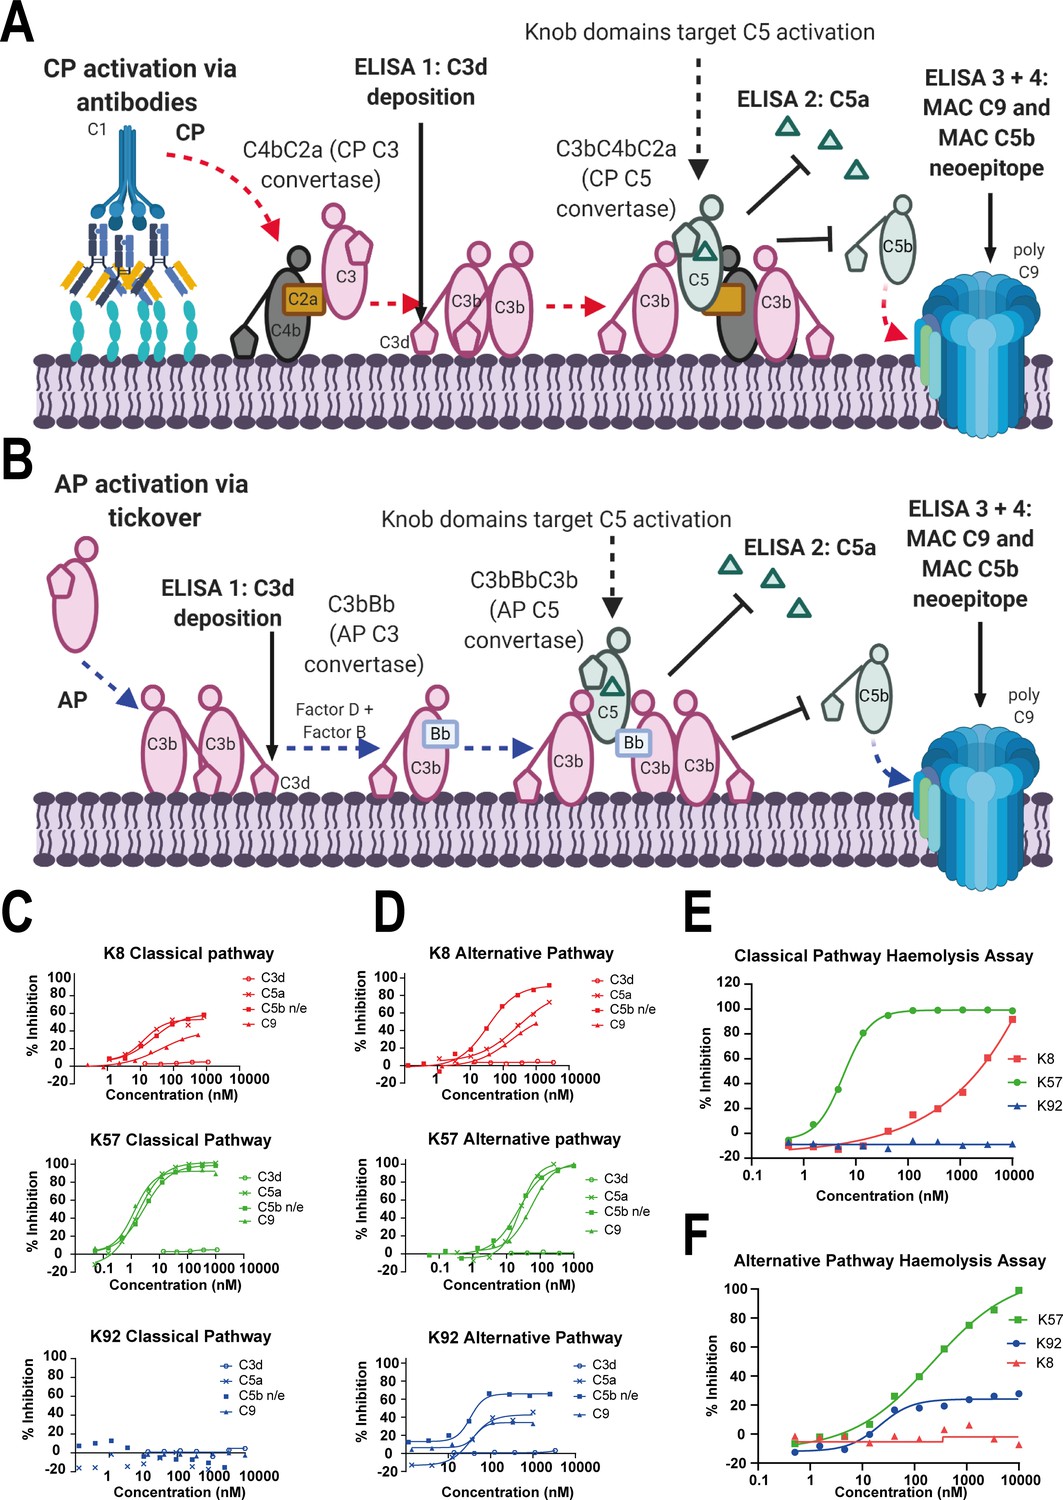
Functional modulation of C5 via knob domain peptides.
(A) shows an abridged schematic for classical pathway (CP) activation. Following activation of C1q via antibody Fc, C4 and C2 are cleaved and form C4bC2a (the CP C3 convertase) which cleaves C3 into C3a (not shown) and C3b. At high C3b concentrations, C4bC2aC3b (the CP C3 convertase) forms and cleaves C5 into C5a and C5b. C5b associates with C6 and forms the membrane attack complex (MAC) with C7, C8, and multiple copies of C9. (B) shows an abridged schematic for surface phase alternative pathway (AP) activation in assays (where generation of C3b from the CP/LP is virtually excluded); tick-over of C3 generates C3a (not shown) and C3b. In the presence of factor B and factor D, C3bBb (the AP C3 convertase) generates additional C3b, prompting formation of C3bBbC3b (the AP C5 convertase), which cleaves C5 into C5a and C5b, driving MAC formation. CP-driven ELISAs (C) and AP-driven ELISAs (D) are shown. For both pathways, the inhibition of C3d (the surface-associated domain of C3b, which is upstream of C5 inhibition), C5a release, and C5b neo-epitope formation and C9 deposition were tracked within the MAC. Haemolysis assays with sheep erythrocytes, for the CP (E), and rabbit erythrocytes, for the AP (F), show that K57 is a potent and efficacious inhibitor of both pathways. K92 is selective, partial antagonist of the AP, while K8 is a weak antagonist of the CP but did not show efficacy in the AP haemolysis assay, below 10 µM. For the AP assays, 5% serum (v/v) gives a putative C5 concentration of 20 nM. For the CP assays, 1% serum (v/v) gives a putative C5 concentration of 4 nM, based on a reported C5 serum concentration of 397 nM/75 µg/mL (Sjöholm, 1975).
Figure 2
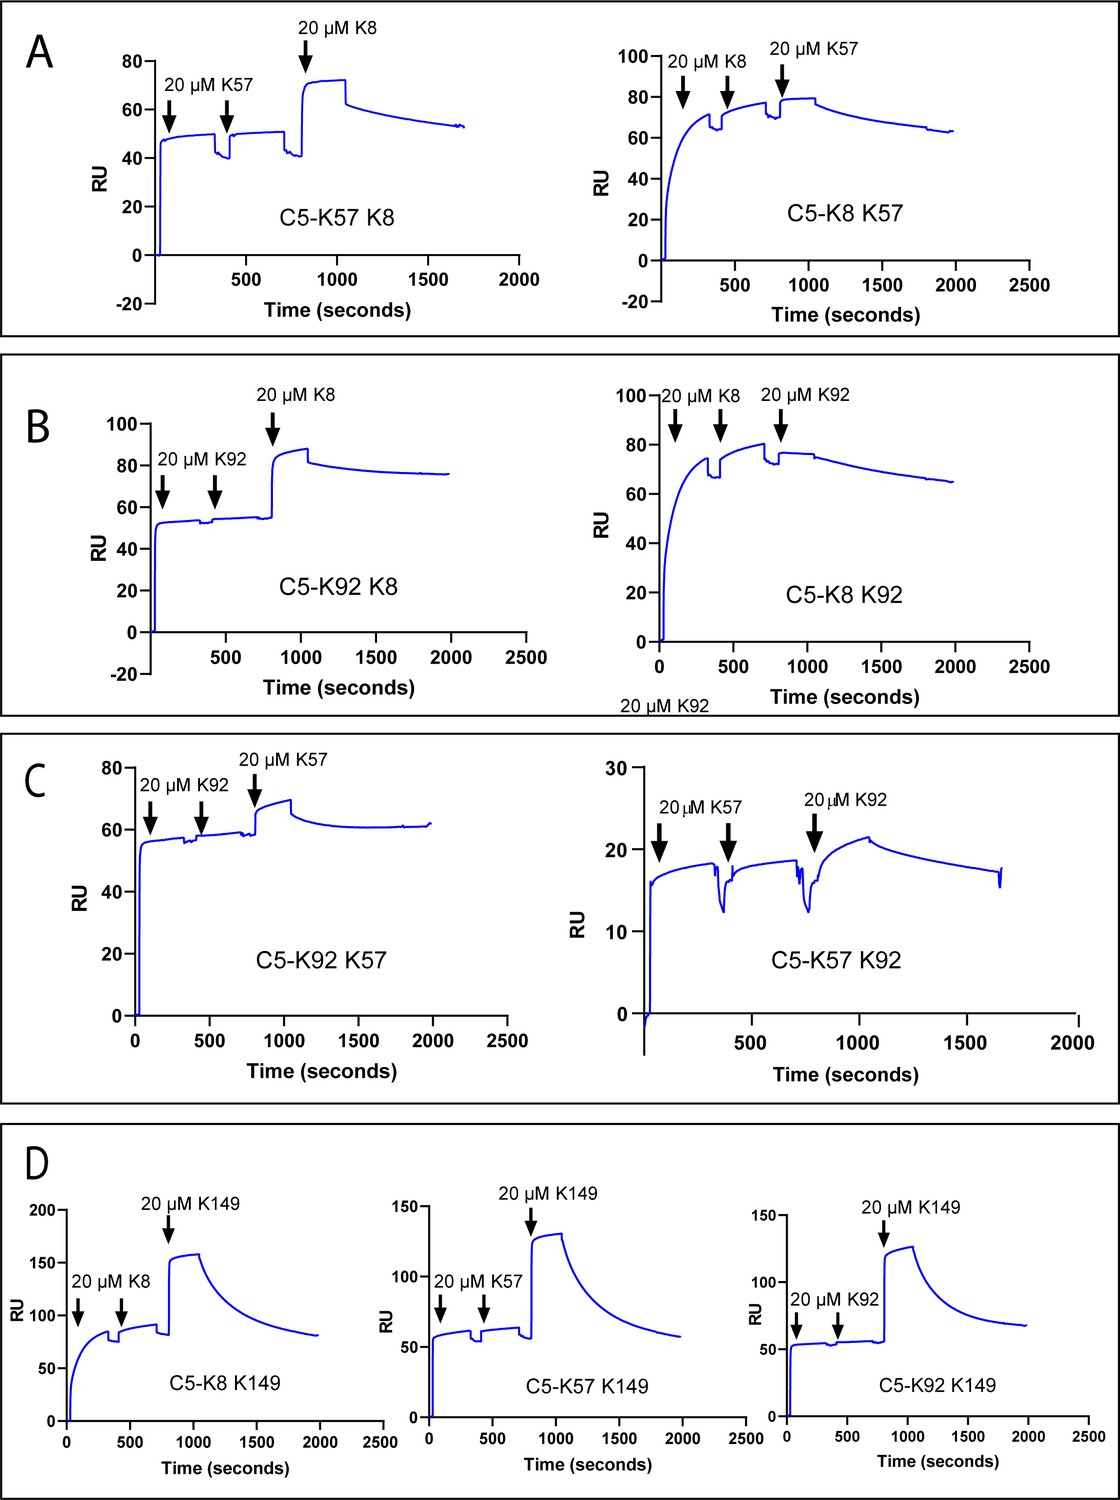
Surface plasmon resonance peptide cross blocking.
(A), (B), and (C) highlight negative cooperativity between the K8, K92, and K57 peptides, respectively. Neither K57 or K92 can bind to the C5-K8 complex but K8 can bind, albeit at a lower level, to C5-K57 and C5-K92. We could not detect any negative cooperativity between K8, K57, or K92 with the silent binder K149, shown in (D). RU: response unit.
Figure 3 with 4 supplements
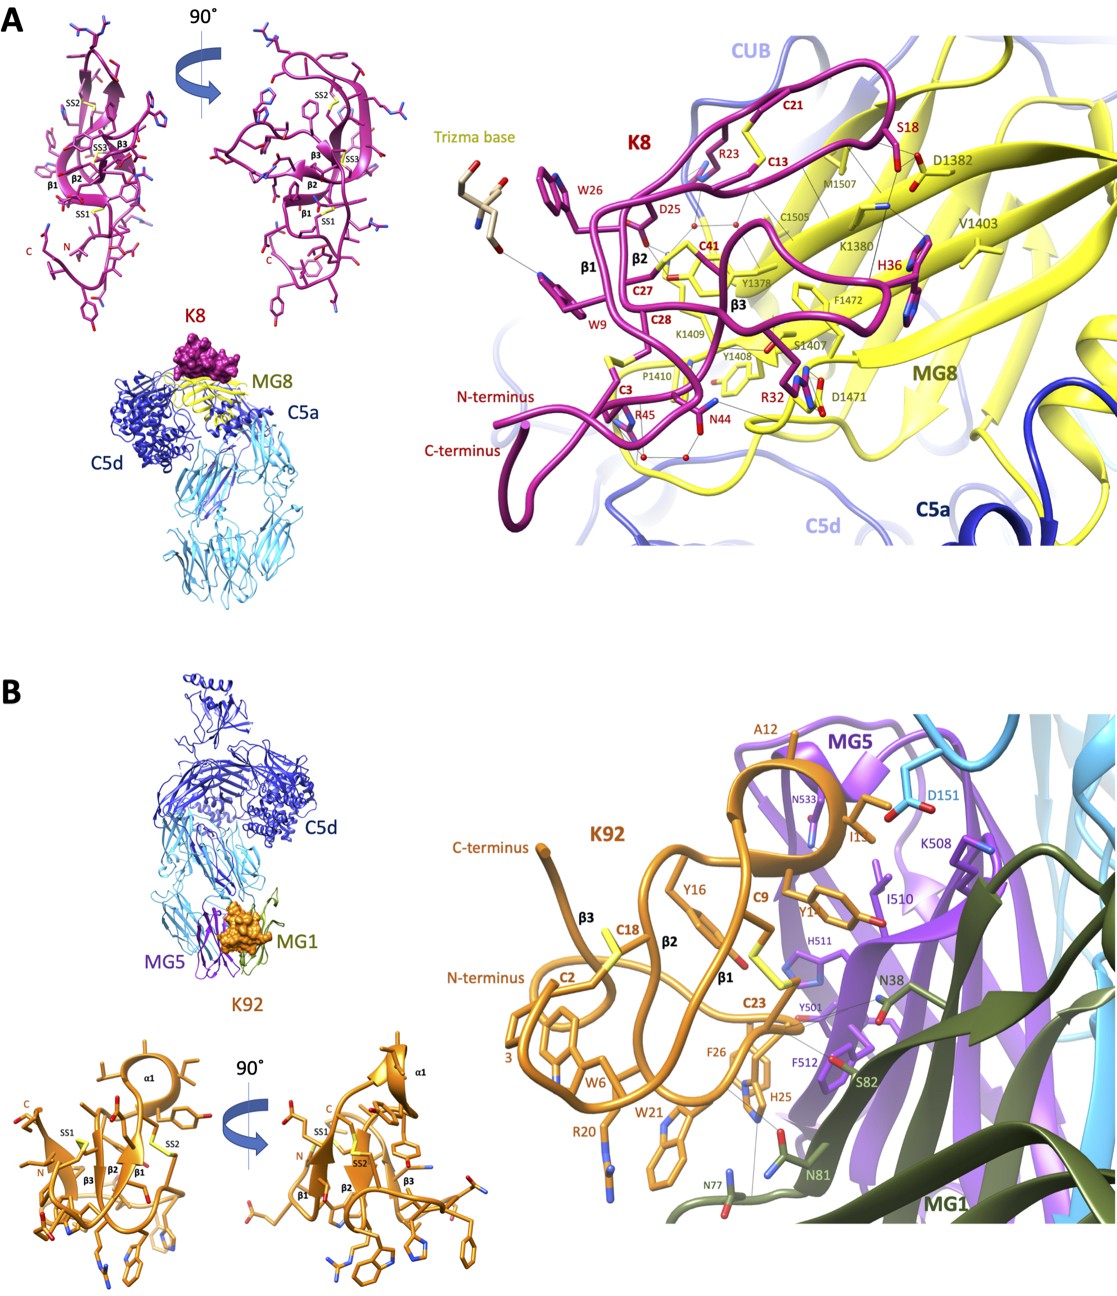
Crystal structures of C5-knob domain complexes.
(A) and (B) show the crystal structures of C5 in complex with the K8 and K92 knob domain peptides, respectively. The binding site for the K8 peptide (A, shown in red) is located on a previously unreported ligand binding site on the macroglobulin (MG) 8 domain (shown in yellow) of C5. The binding site for K92 (B, shown in orange) is located between the MG1 and MG5 domains (shown in green and magenta, respectively).
Figure 3—figure supplement 1
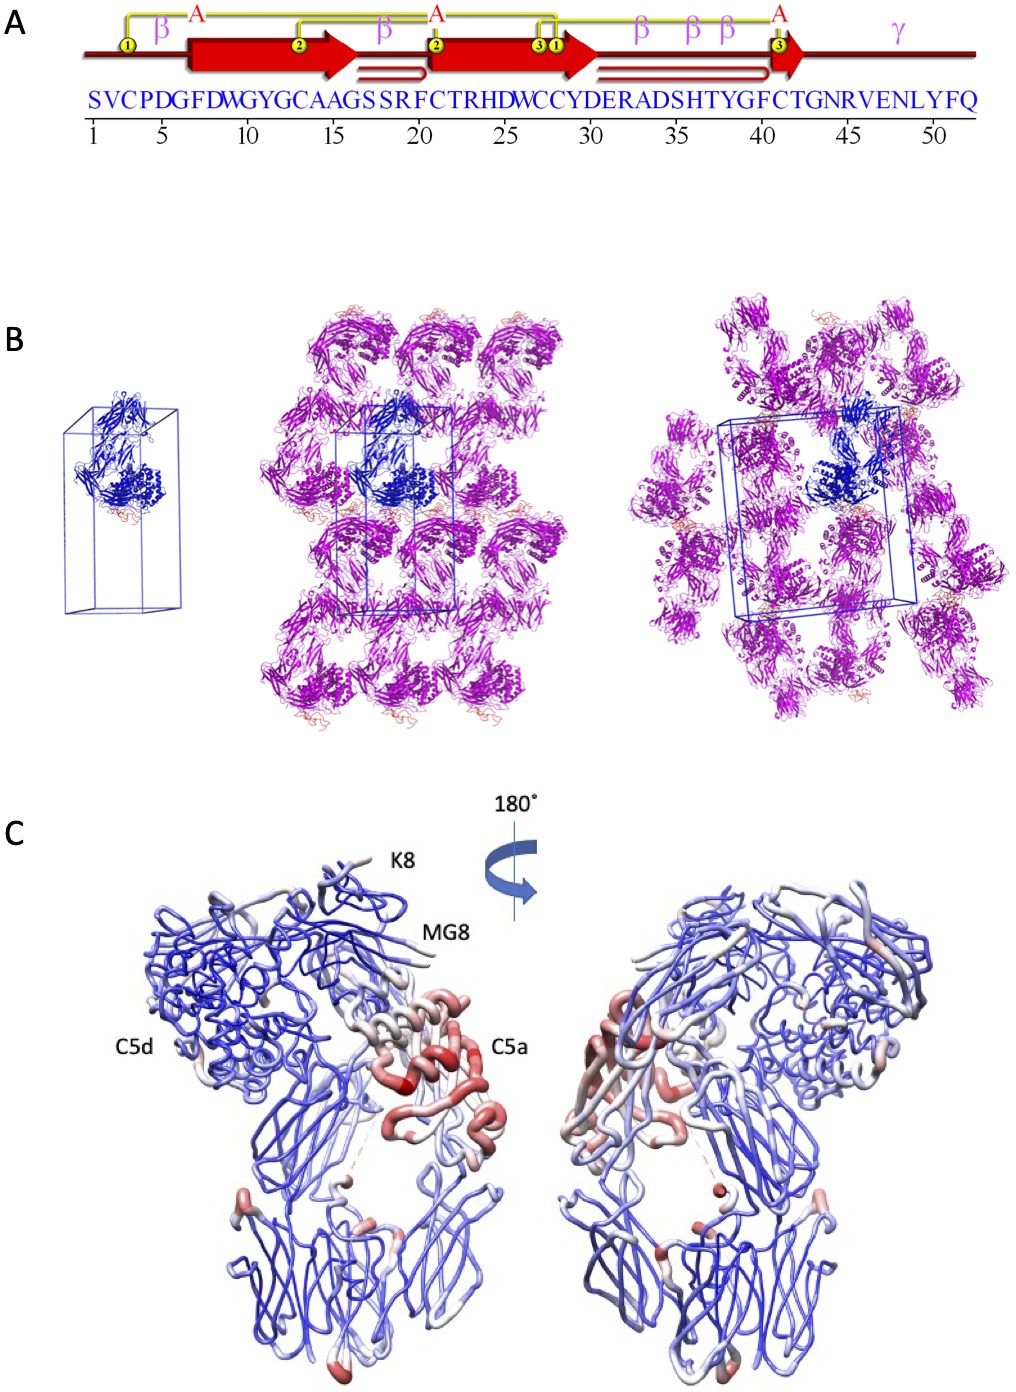
Structural analysis of the C5-K8 complex.
(A) Structural topology of the K8 peptide. Topology diagram highlighting the secondary structural elements present in the K8 peptide. This image was generated using PDBsum (EMBL-EBI). (B) K8-C5 complex unit cell and crystal packing. A unit cell with a single molecule of the K8-C5 complex is shown, followed by orthogonal views showing packing interactions as seen in the crystal lattice. The K8-C5 complex is shown in cartoon representation with C5 coloured blue and K8 in orange. Symmetry-related molecules of C5 are coloured magenta with K8 in orange. (C) Relative B-factor values in the K8-C5 complex. Ribbon diagram in which the thickness and colour (low B-factor: blue; high B-factor: red) of the ribbons correspond to the average residue B-factor value. Low relative B-factors can be observed for the peptide binding site, while C5a shows the highest B-factor values. MG: macroglobulin.
Figure 3—figure supplement 2
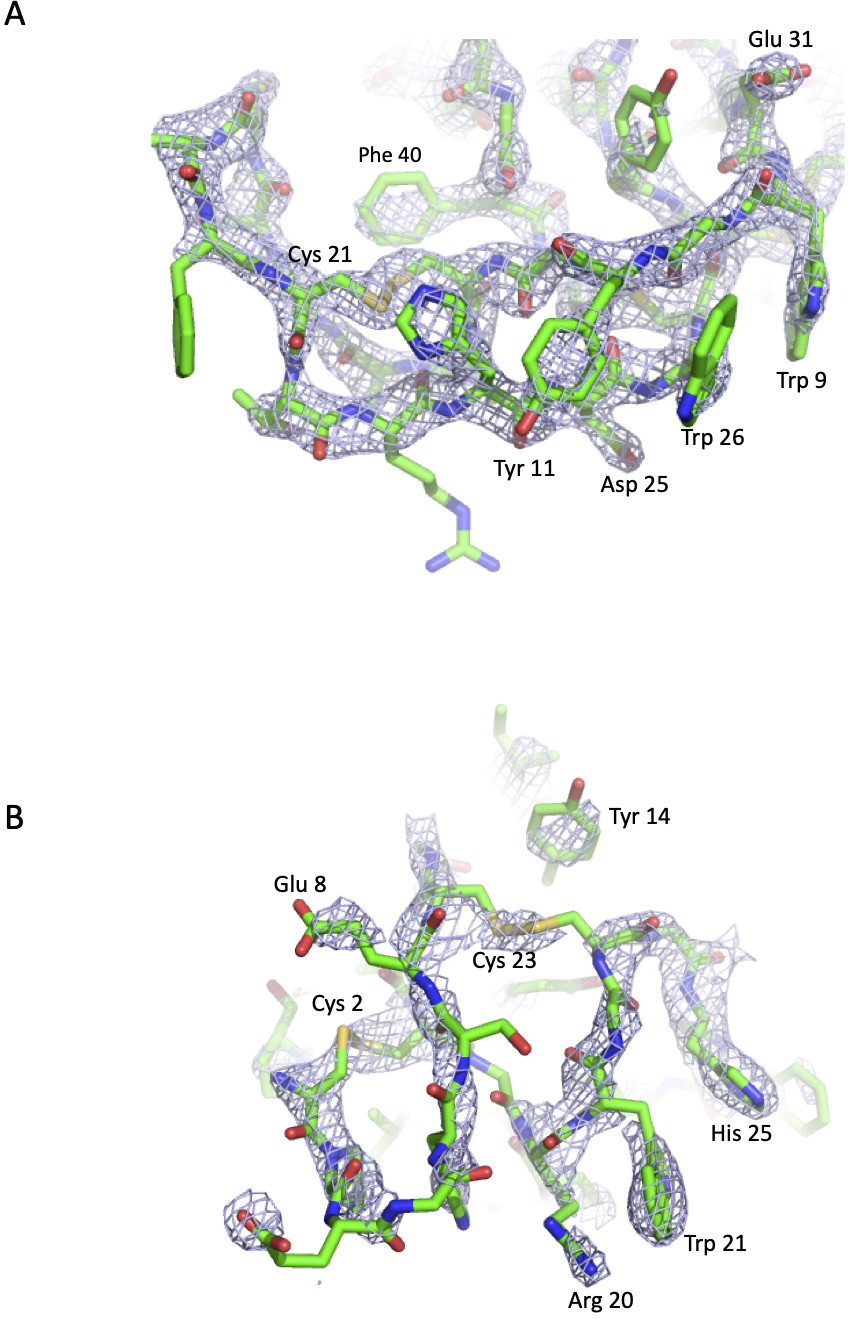
Simulated annealing OMIT maps of the C5-knob domain peptide complexes.
The blue mesh shows mFo-DFc simulated annealing OMIT maps calculated in PHENIX and contoured at (A) 3.0 σ around the K8 peptide and (B) at 1.3 σ around the K92 peptide. In the OMIT calculation, the peptides were deleted from the model. The peptides are displayed in green in cartoon representations with side chains shown as sticks and coloured according to the atom type (nitrogen in blue, oxygen in red, carbon in green, and sulphur in yellow). Selected side chains are highlighted.
Figure 3—figure supplement 3
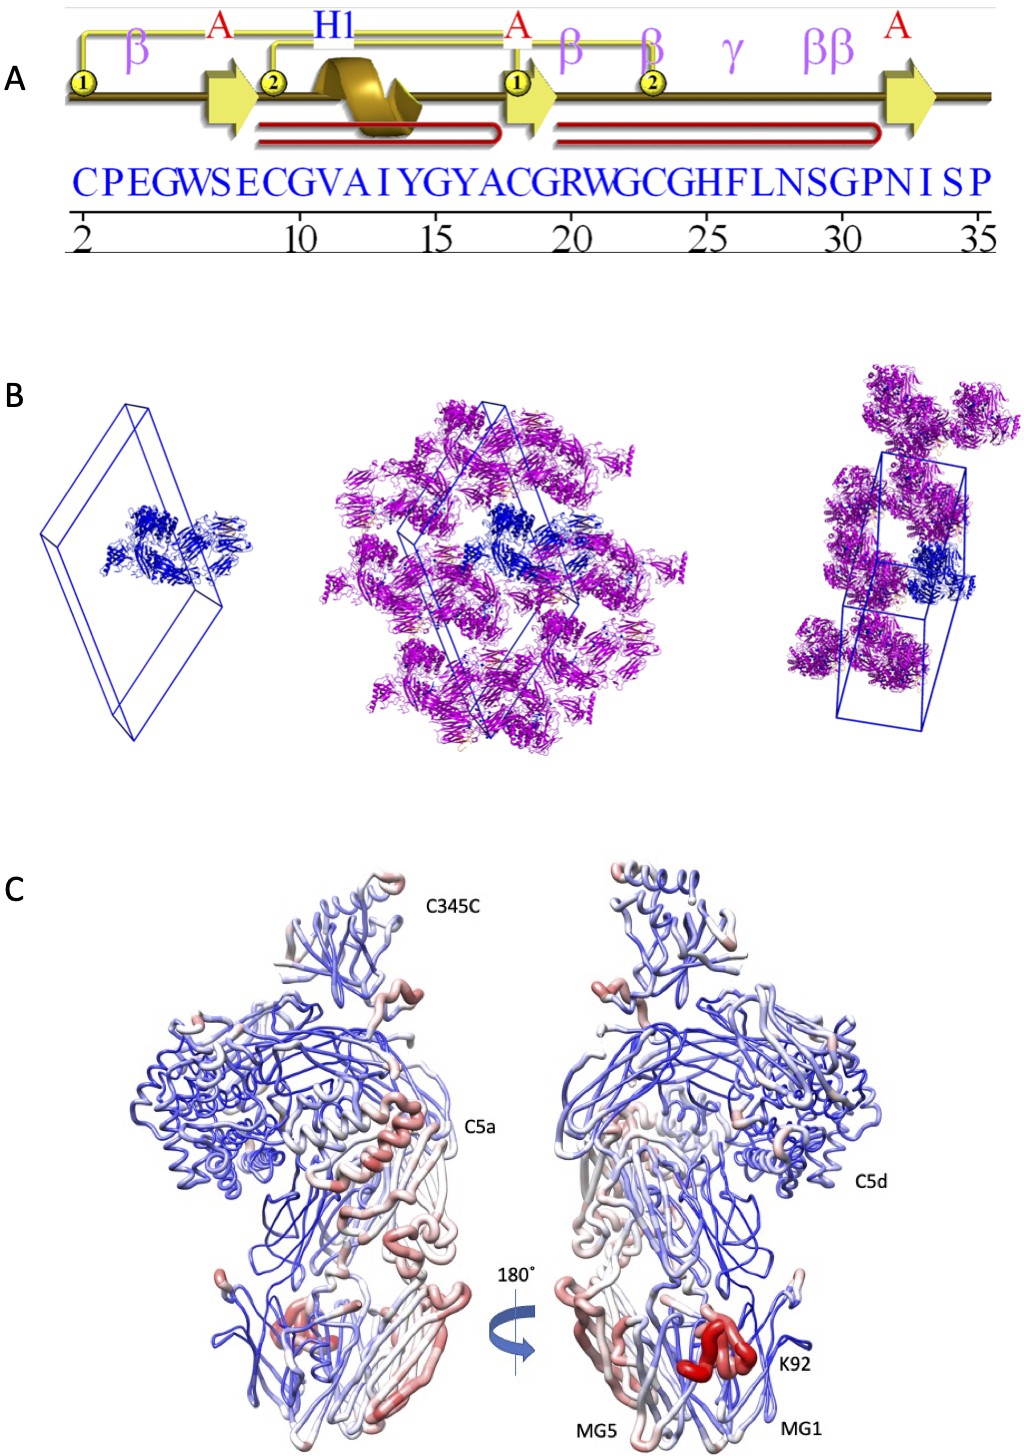
Structural analysis of the C5-K92 complex.
(A) Structural topology of the K92 peptide. Topology diagram of the K92 peptide highlighting the secondary structural elements present in the K92 peptide. This image was generated using PDBsum (EMBL-EBI). (B) K92-C5 complex unit cell and crystal packing. A unit cell with a single molecule of the K92-C5 complex is shown, followed by orthogonal views showing packing interactions as seen in the crystal lattice. The K92-C5 complex is shown in cartoon representation with C5 coloured blue and K92 in orange. Symmetry-related molecules of C5 are coloured magenta with K92 in orange. (C) Relative B-factor values in the K92-C5 complex. Ribbon diagrams in which the thickness and colour (low B-factor: blue; high B-factor: red) of the ribbons correspond to the average residue B-factor value. The highest B-factor values for the K92-C5 complex are observed for the K92 peptide, while the MG1–MG5 binding site displays relatively low B-factor values. MG: macroglobulin.
Figure 3—figure supplement 4
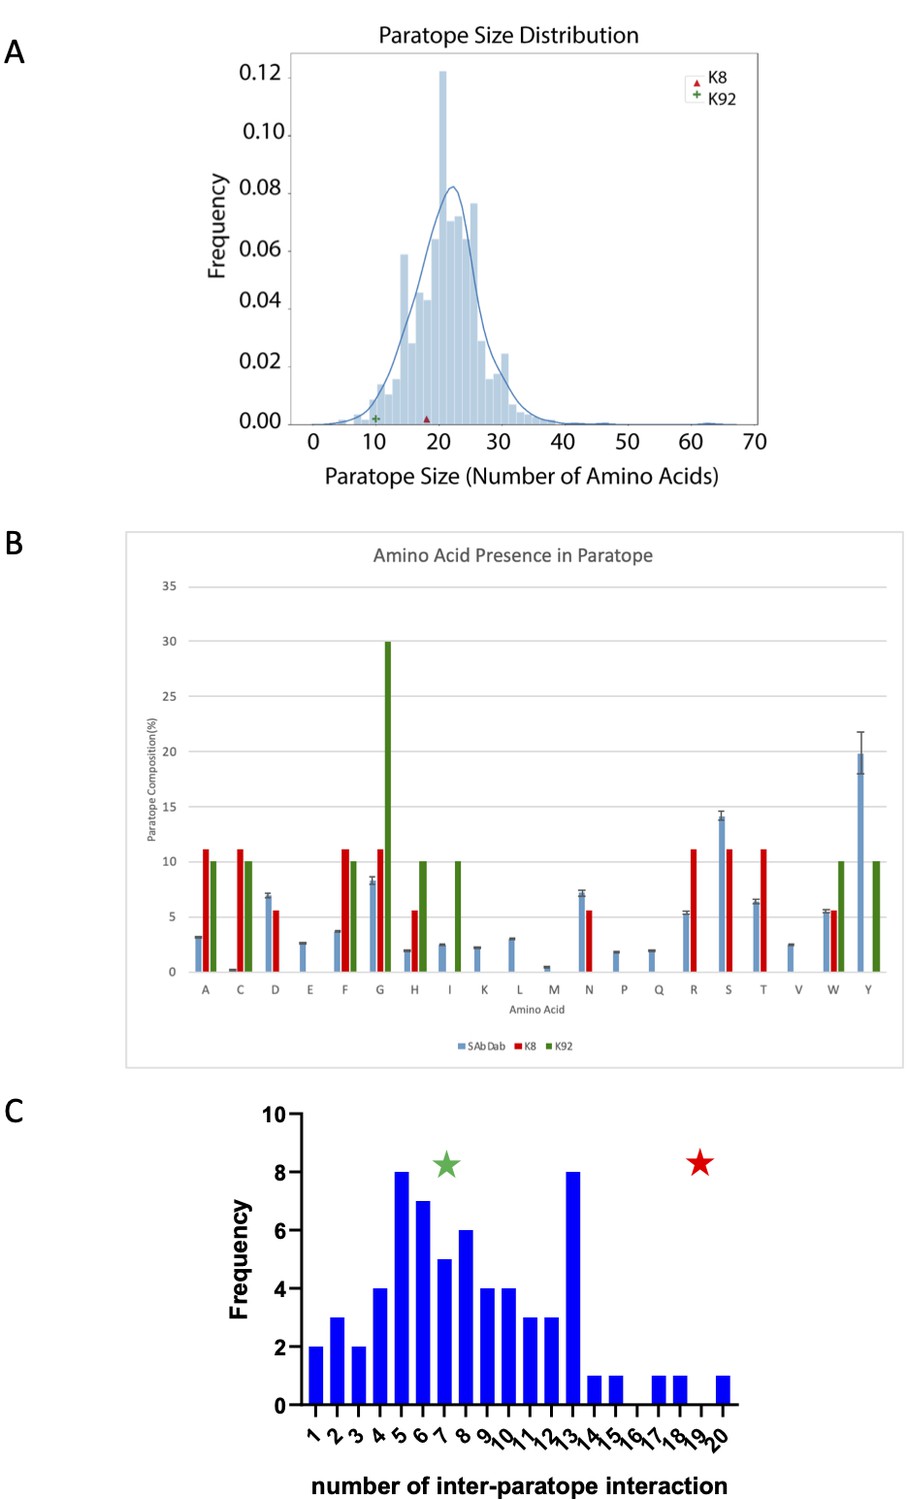
Paratope analysis of K8 and K92 peptides.
(A) Comparison of K8 and K92 paratope size with known antibody–antigen complexes. K8 and K92 paratope size are compared to non-redundant antibodies in the structural antibody database SAbDab (N = 924). Paratopes were defined as antibody residues within 4.5 Å of the antigen in the co-crystal structure. (B) Comparison of K8 and K92 paratope amino acid composition with known antibody–antigen complexes. Amino acid composition of K8 and K92 paratopes in comparison with non-redundant antibodies in SAbDab (n = 924). Paratopes were defined as antibody residues within 4.5 Å of the antigen in the co-crystal structure. Error bars of 1× SD are included for SAbDab dataset. (C) Comparison of K8 and K92 inter-paratope interactions with known cyclic peptide–protein co-crystal structures. When compared to other cyclic peptide–protein complexes, knob domain peptides K8 (in red, with 19 inter-paratope interactions) and K92 (in green, with seven inter-paratope interactions) both fall within the observed range for cyclic peptides, with K8 clearly at the high end of the spectrum. (This figure was prepared using data analysis from Malde et al., 2019.)
Figure 4 with 1 supplement
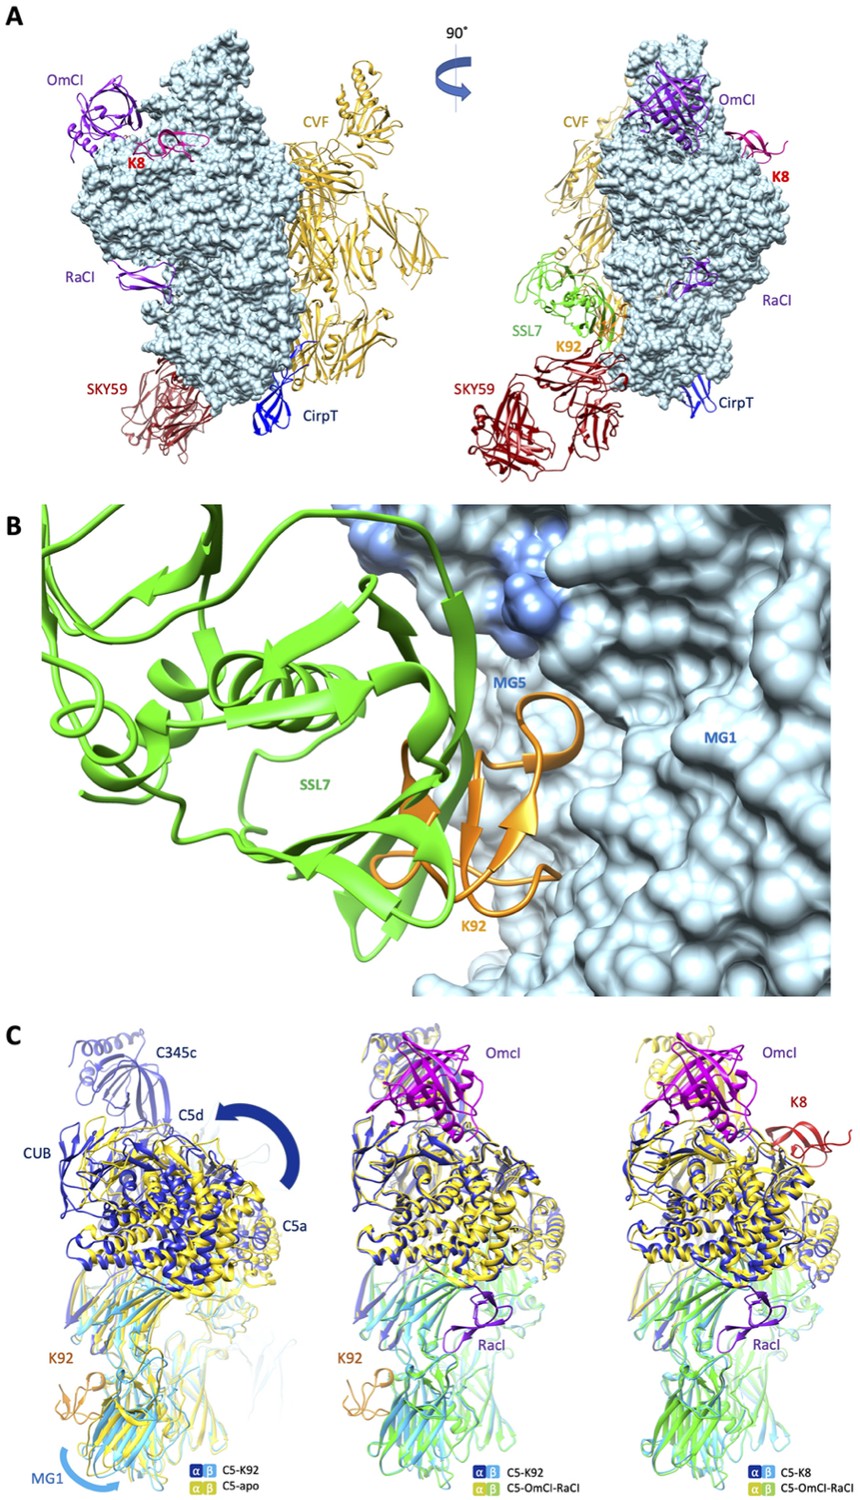
Comparison of the K8 and K92 binding sites with known C5 inhibitor complexes.
Structural alignment of the complexes of C5 with the K8 and K92 knob domain peptides with the known structures for OmCI and RaCI (Protein Data Bank [PDB] accession code 5HCC; Jore et al., 2016), SSL7 and cobra venom factor (CVF) (PDB accession code 3PRX; Laursen et al., 2011), Cirp-T (PDB accession code 6RPT; Reichhardt et al., 2020), and SKY59 (PDB accession code 5B71; Fukuzawa et al., 2017) using UCSF Chimera (Pettersen et al., 2004). Alignments have been performed globally except for instances where the inhibitor has been crystallised bound to a single domain of C5. (A) shows two views of the superimposed C5-inhibitor complexes, differing by a 90o rotation. C5 is shown in molecular surface rendering, with ribbon representations of OmCI and RaCI in purple, SSL7 in green, CVF in gold, SKY59 in dark red, K8 in bright red, and K92 in orange. (B) shows a close-up view of the K92 binding site with that of SSL7 superimposed, for comparison. In contrast with the superficial binding mode of SSL7, K92 is wedged between the macroglobulin (MG)1 and MG5 domains of C5. (C) (left) shows that the interaction between K92 and C5 induces a slight separation of the MG1 and MG5 domains, resulting in a significant rotational movement of the C5a, C5d, and CUB domains, when compared to the C5-apo structure (PDB accession code 3CU7; Fredslund et al., 2008). (C) also shows that the complex with OmCI and RaCI (PDB accession code 5HCC; Jore et al., 2016) stabilises a similar conformation in C5 (C, middle) to that of K92, as well as K8 (C, right). For this structural comparison, the C5 MG5 domains of the complexes were superimposed.
Figure 4—figure supplement 1
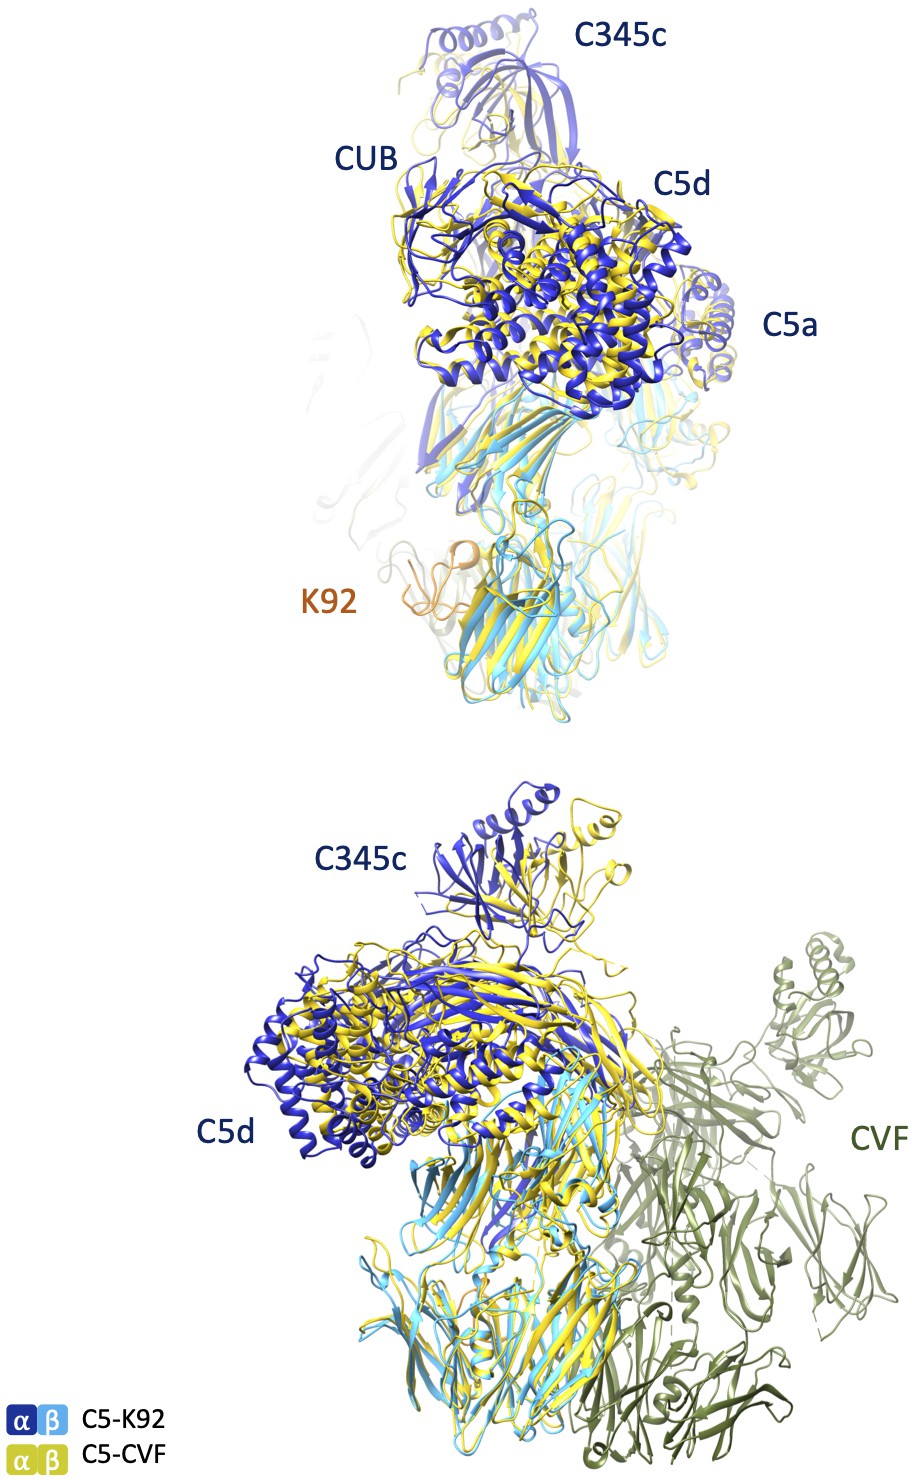
Structural comparison of C5-K92 and C5-CVF complexes.
Structures of the C5-K92 and C5-CVF (Protein Data Bank accession code 3PRX; Laursen et al., 2011) complexes were superimposed via their MG5 domains, similar to those shown in Figure 4C. Top and bottom images show the views of the superimposed complexes differing by a 90o rotation. CVF: cobra venom factor; MG: macroglobulin.
Figure 5 with 1 supplement
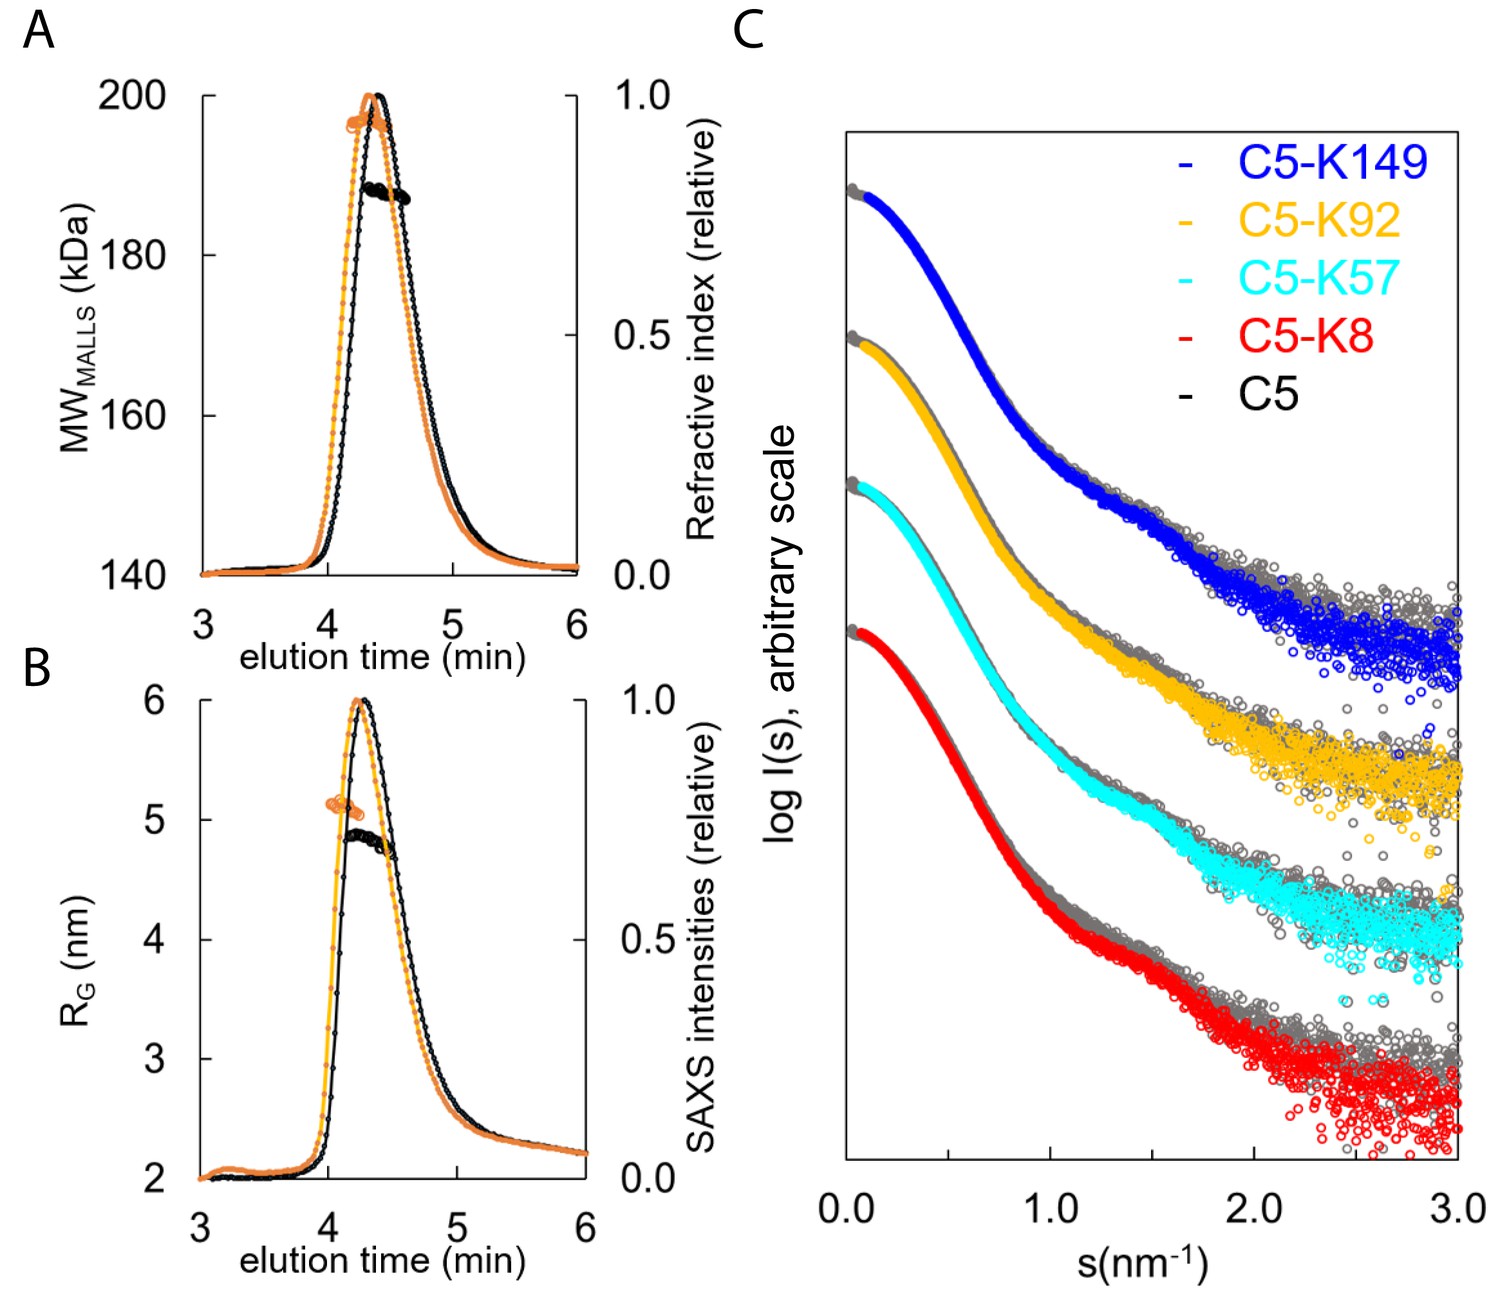
Hydrodynamic properties and solution conformation of C5 and C5-knob domain complexes by small-angle X-ray scattering (SAXS).
Size exclusion chromatography multi-angle laser light scattering (SEC-MALLS) chromatograms (A) for apo C5 (black) and C5-K92 (orange) show a homogenous molecular weight increase across the C5-K92 elution peak. The SEC-SAXS elution profile collected under identical experimental conditions (B) shows an increase in radius of gyration (RG) for the C5-K92 complex. Scattering curves of all C5-knob domains are shown (C); the C5-knob domain complexes are shown against apo C5 (in grey), and for ease of viewing, the curves are arbitrarily shifted in the Y axis.
Figure 5—figure supplement 1
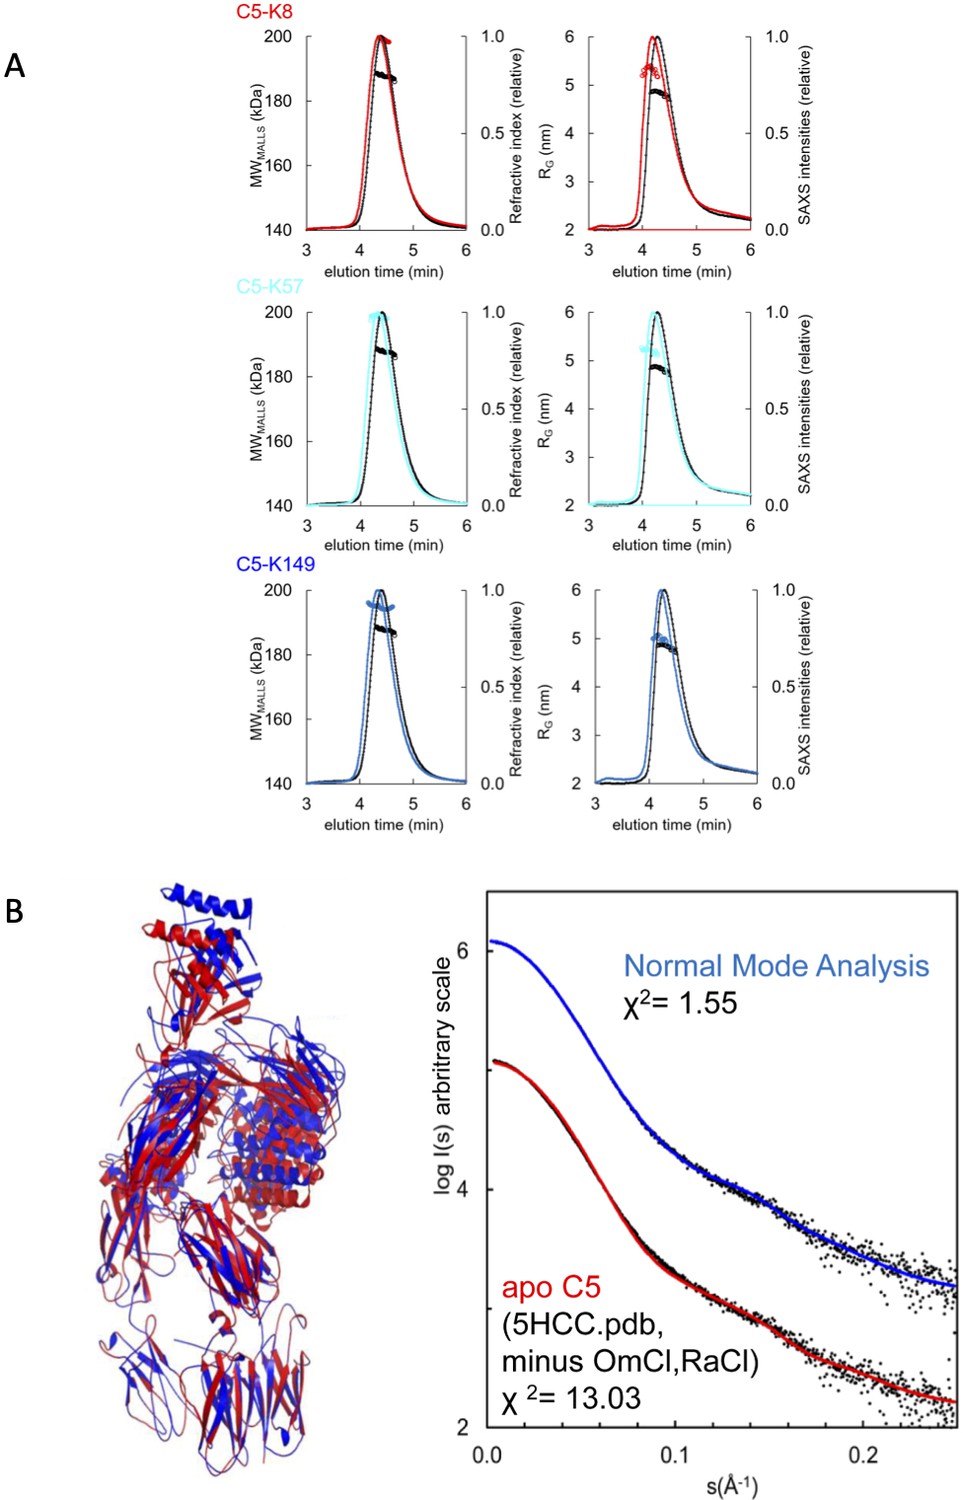
SAXS analyses of the C5-knob domain peptide complexes.
(A) Size exclusion chromatography multi-angle laser light scattering (SEC-MALLS) and SEC small-angle X-ray scattering (SEC-SAXS) chromatograms for C5-knob domain complexes. SEC-MALLS chromatograms for C5-knob domain complexes show a molecular weight increase for the C5-knob domain complexes. The SEC-SAXS elution profile collected under identical experimental conditions shows an increase in radius of gyration (RG) for the complexes; for reference, the apo C5 peak is shown in black. (B) Solution structure of complement C5 in apo state. (Left) Overlay of cartoon representations of C5 (red) and the C5 model obtained with SREFLEX (normal mode analysis, blue). (Right) The respective fits of the theoretical scattering curves to the SAXS data. χ² values are indicated.
Figure 6 with 1 supplement
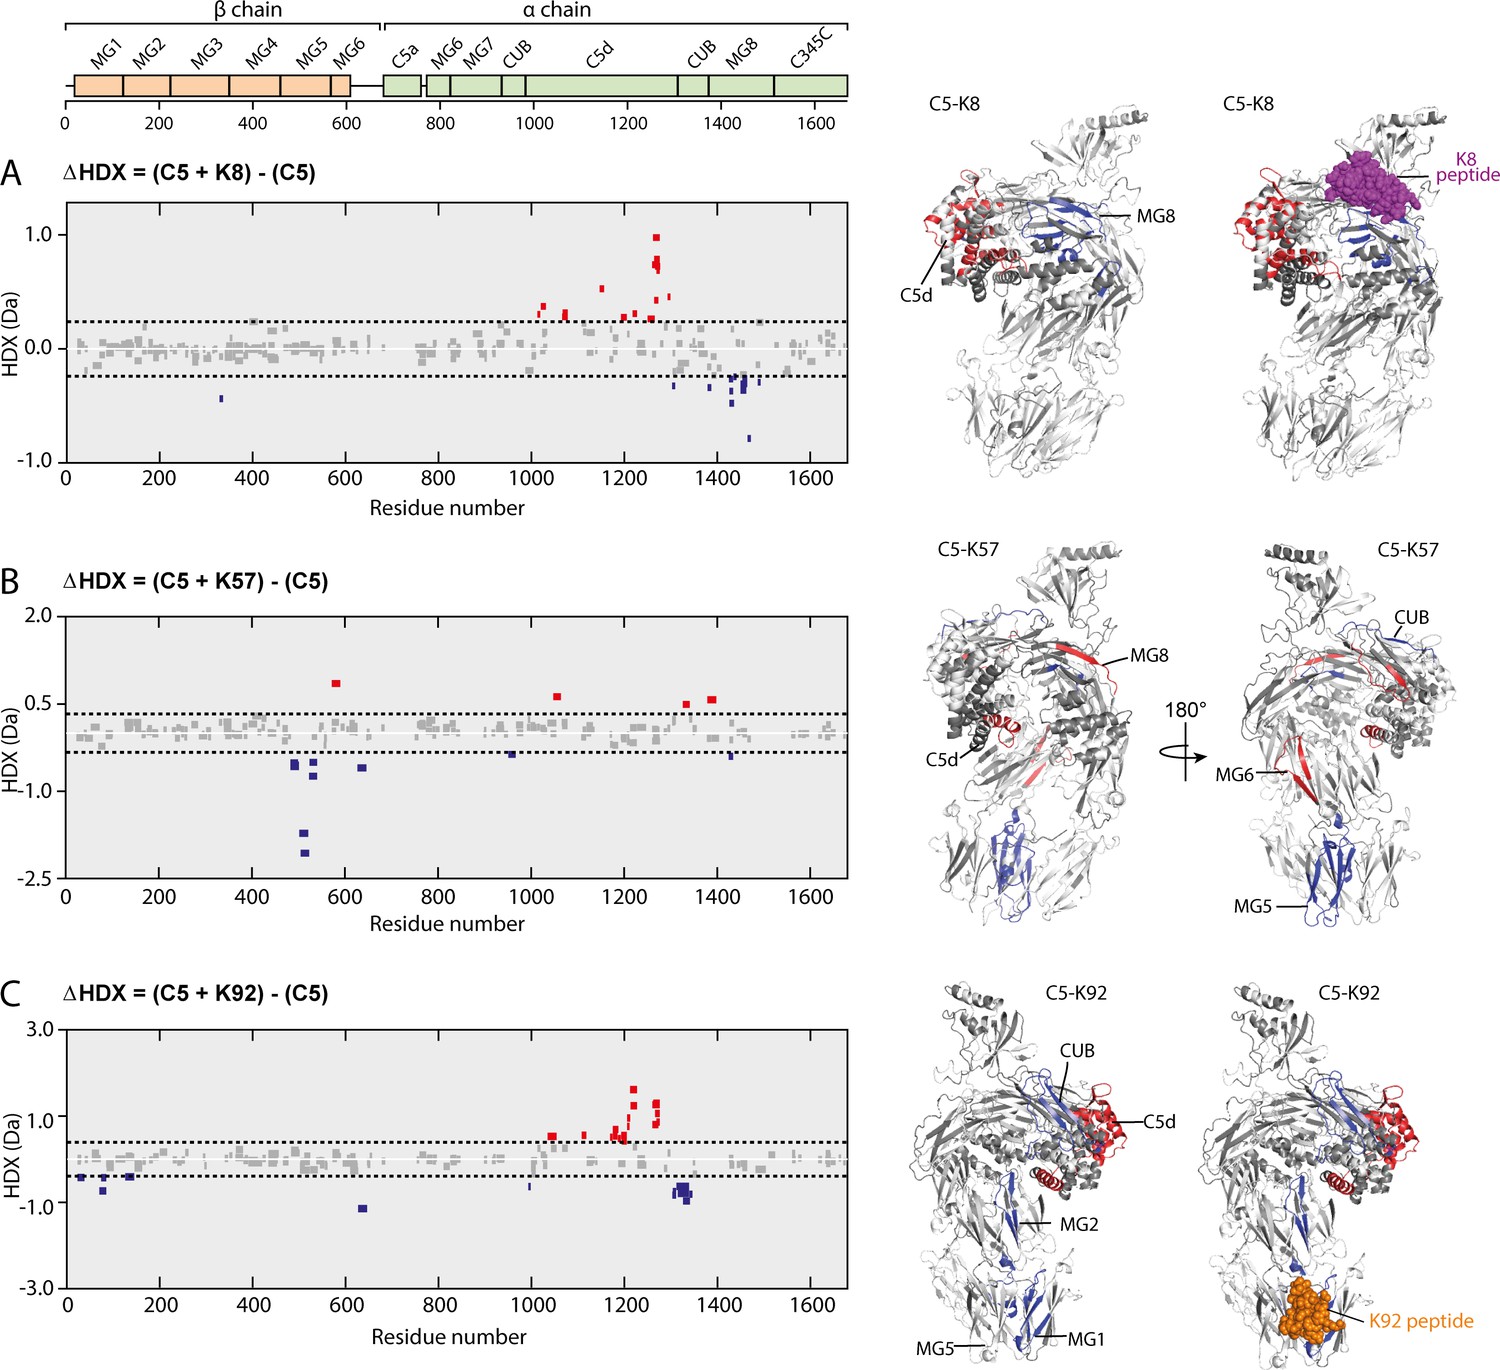
Impact of knob domain binding on the structural dynamics and conformation of C5.
Differential hydrogen-deuterium exchange (ΔHDX) plots for C5 in complex with knob domains (A) K8, (B) K57, and (C) K92 at 1 hr of deuterium exposure. Blue denotes peptides with decreased HDX (backbone H-bond stabilisation), and red denotes peptides with increased HDX (backbone H-bond destabilisation). 98% confidence intervals are shown as dotted lines. Peptides in grey have insignificant ΔHDX. Measurements were performed in triplicate, and all HDX-MS peptide data are detailed in Supplementary file 1 Table 3.2. ΔHDX for C5 + K8, C5 + K57, and C5 + K92 are coloured onto C5 (Protein Data Bank accession code 5HCC, minus OmCI and RaCI).
Figure 6—figure supplement 1

HDX analyses of the C5-knob domain peptide complexes.
(A) Woods plot displaying the differential hydrogen-deuterium exchange (ΔHDX) for C5 in complex with knob domains. (A) K8, (B) K57, and (C) K92 at four deuterium exposure time points: 0.5 min, 2 min, 15 min, and 1 hr. Blue denotes peptides with decreased HDX, and red denotes peptides with increased HDX. 98% confidence intervals are shown as dotted lines. (B) Linear coverage map for C5 data in complex with knob domains K8, K57, and K92.
Additional files
-
Supplementary file 1
Section 1. Functional analysis. Table 1.1. Classical pathway C5b deposition ELISA; Table 1.2. Alternative pathway C5b deposition ELISA; Table 1.3. Inhibition of classical pathway-mediated C5a release; Table 1.4. Inhibition of alternative pathway-mediated C5a release; Table 1.5. Inhibition of classical pathway-mediated C9 deposition; Table 1.6. Inhibition of alternative pathway-mediated C9 deposition; Table 1.7. Inhibition of classical pathway haemolysis; Table 1.8. Inhibition of alternative pathway haemolysis. Section 2. Structural analysis. Table 2.1. Data collection and refinement statistics (molecular replacement); Table 2.2. Hydrogen bond interactions between K8 and C5; Table 2.3. Ionic interactions between K8 and C5; Table 2.4. Disulphide mapping of the K92 peptide; Table 2.5. Hydrogen bond interactions between K92 and C5; Table 2.6. Validation of molecular interactions by peptide mutagenesis analysis; Table 2.7. Individual, total, and average hydrogen bond persistence in a binding pose metadynamics simulation of the K8-C5 complex; Table 2.8. Individual, total, and average hydrogen bond persistence in a binding pose metadynamics simulation of the K92-C5 complex. Section 3. Solution structure analysis. Table 3.1. SAXS Summary data; Table 3.2. ΔHDX summary data. Section 4. Additional functional analyses. Table 4.1. SPR single-cycle kinetics of knob domains binding to human C5b; Table 4.2. SPR single-cycle kinetics of knob domains binding to human C5b-6.
- https://cdn.elifesciences.org/articles/63586/elife-63586-supp1-v2.docx
-
Transparent reporting form
- https://cdn.elifesciences.org/articles/63586/elife-63586-transrepform-v2.docx
Download links
A two-part list of links to download the article, or parts of the article, in various formats.
Downloads (link to download the article as PDF)
Open citations (links to open the citations from this article in various online reference manager services)
Cite this article (links to download the citations from this article in formats compatible with various reference manager tools)
The allosteric modulation of complement C5 by knob domain peptides
eLife 10:e63586.
https://doi.org/10.7554/eLife.63586


