Microbial genetic and transcriptional contributions to oxalate degradation by the gut microbiota in health and disease
- NYU Langone Health, United States
- Vilcek Institute of Graduate Biomedical Sciences, United States
- Litholink Corporation, Laboratory Corporation of America Holdings, United States
- Department of Cancer Immunology, Genentech Inc, United States
- Center for Advanced Biotechnology and Medicine, Rutgers University, United States
Figures
Figure 1 with 1 supplement
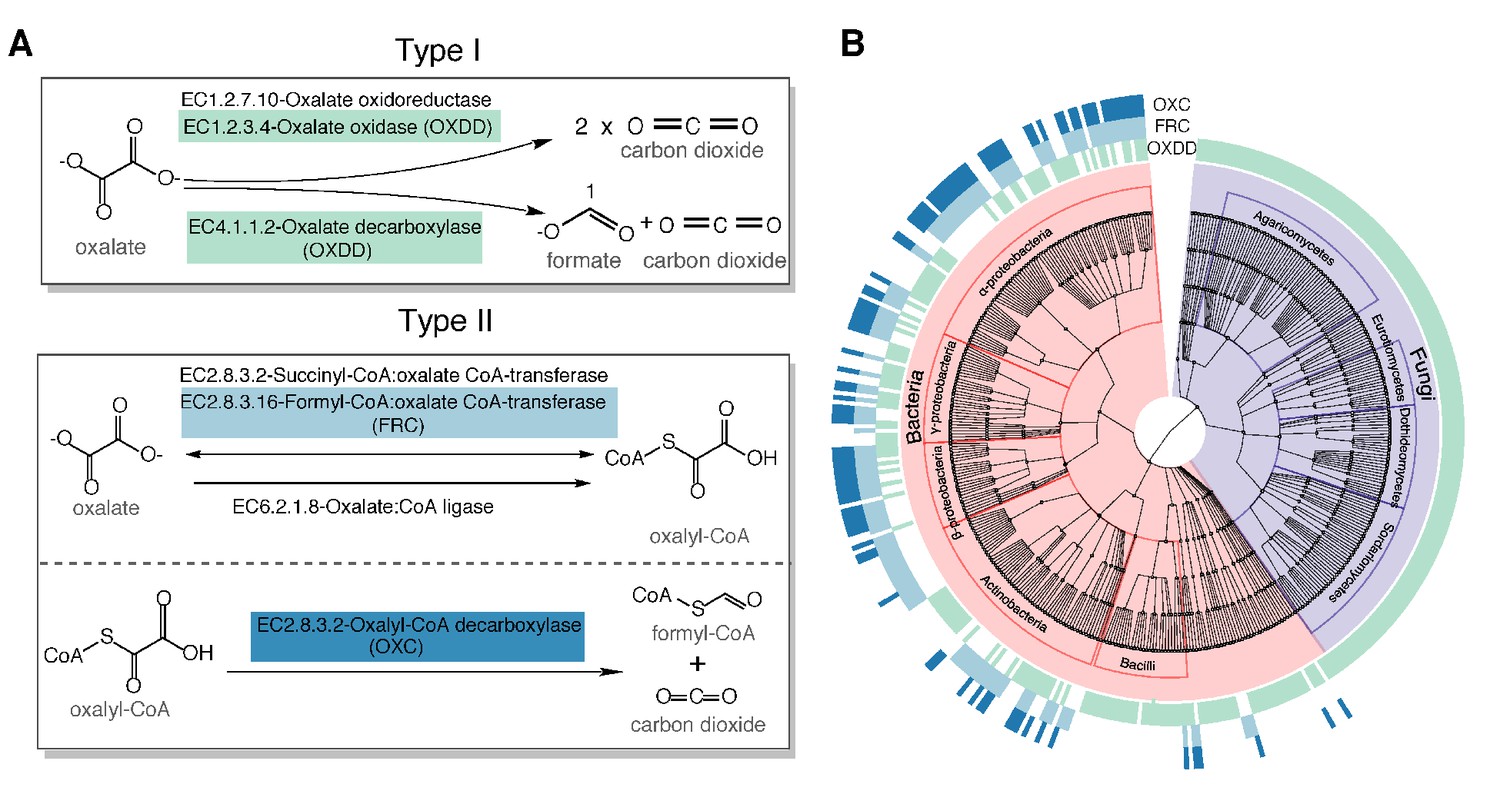
Type I and type II microbial oxalate-degrading pathway (ODP).
(A) Schema of type I and type II ODP. Enzymes are annotated with corresponding KEGG IDs. OXDD, FRC, and OXC are the focus of the present study. (B). Cladogram of microbial genera that encode oxalate-degrading enzymes OXDD, FRC, and OXC. The three rings surrounding the cladogram indicate OXDD-, FRC-, or OXC-encoding genera, respectively.
Figure 1—figure supplement 1
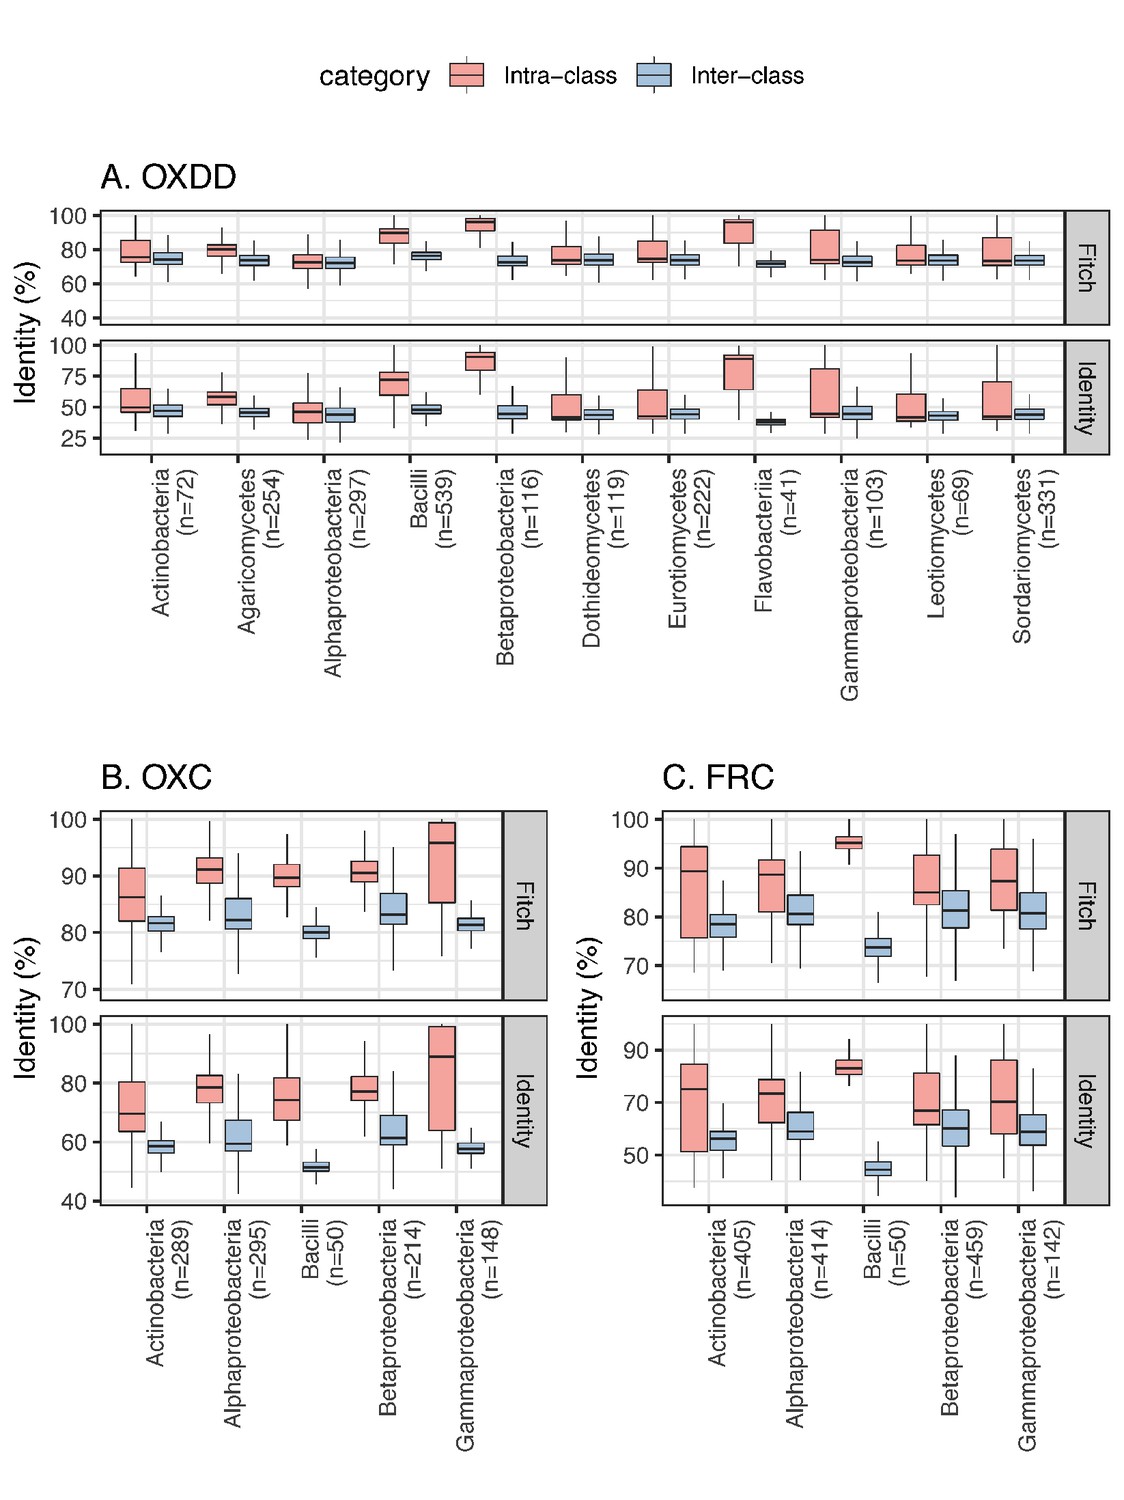
Inter-class and intra-class ODE protein identity associated with each microbial class.
Panels focus on OXDD (A), OXC (B), or FRC (C). The pairwise identity between any two protein homologs was calculated based on the multiple alignments using amino acid sequences, by Fitch, 1966 or identity distance matrix (see Materials and methods for details). The number of ODE homologs available for each class is indicated in parenthesis. Classes with >20 ODE are shown.
Figure 2 with 3 supplements
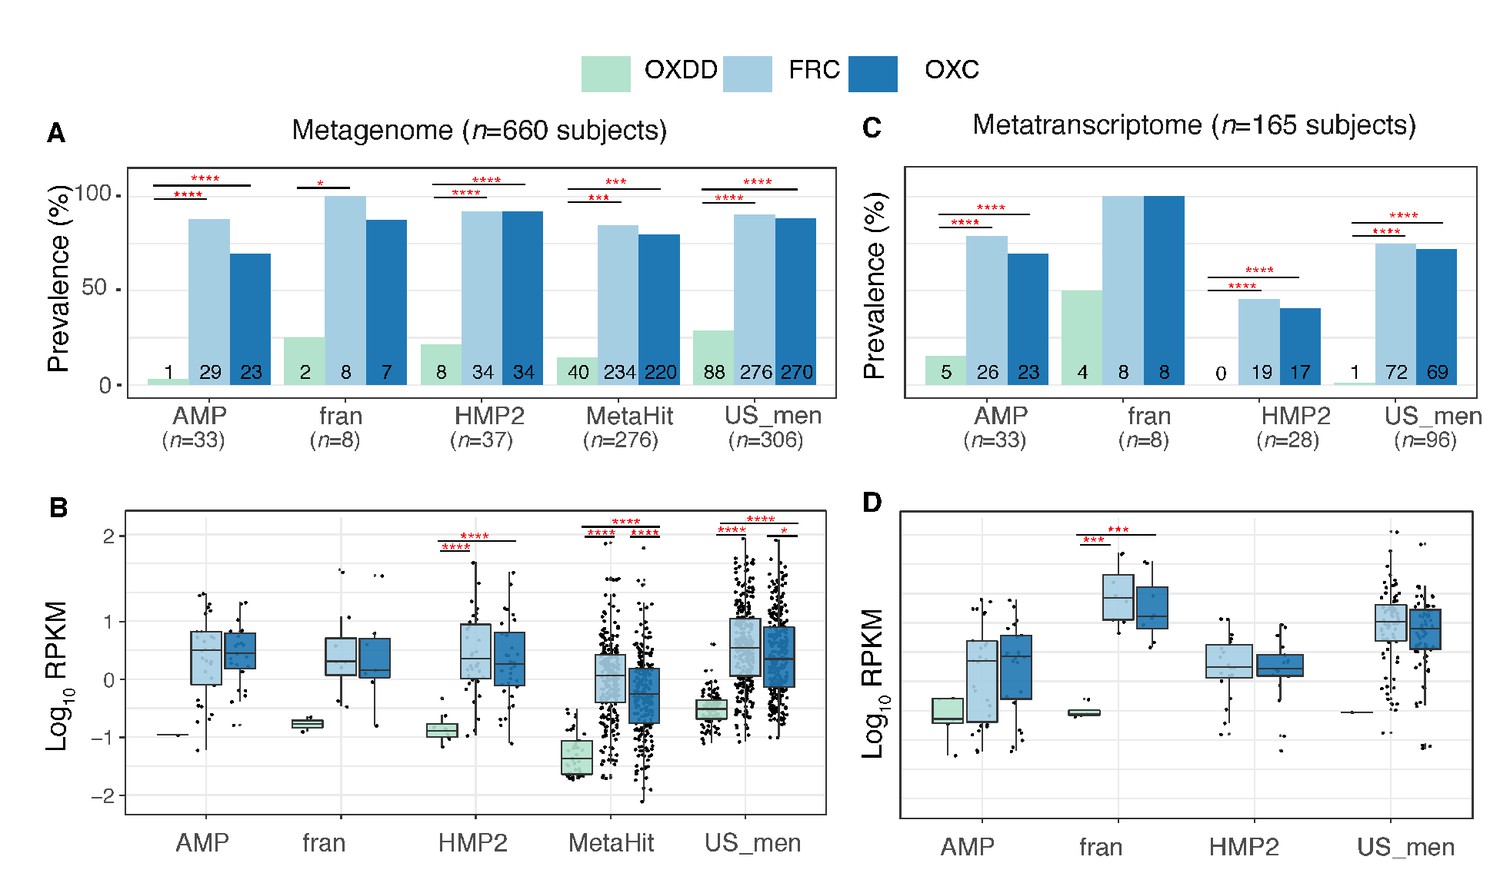
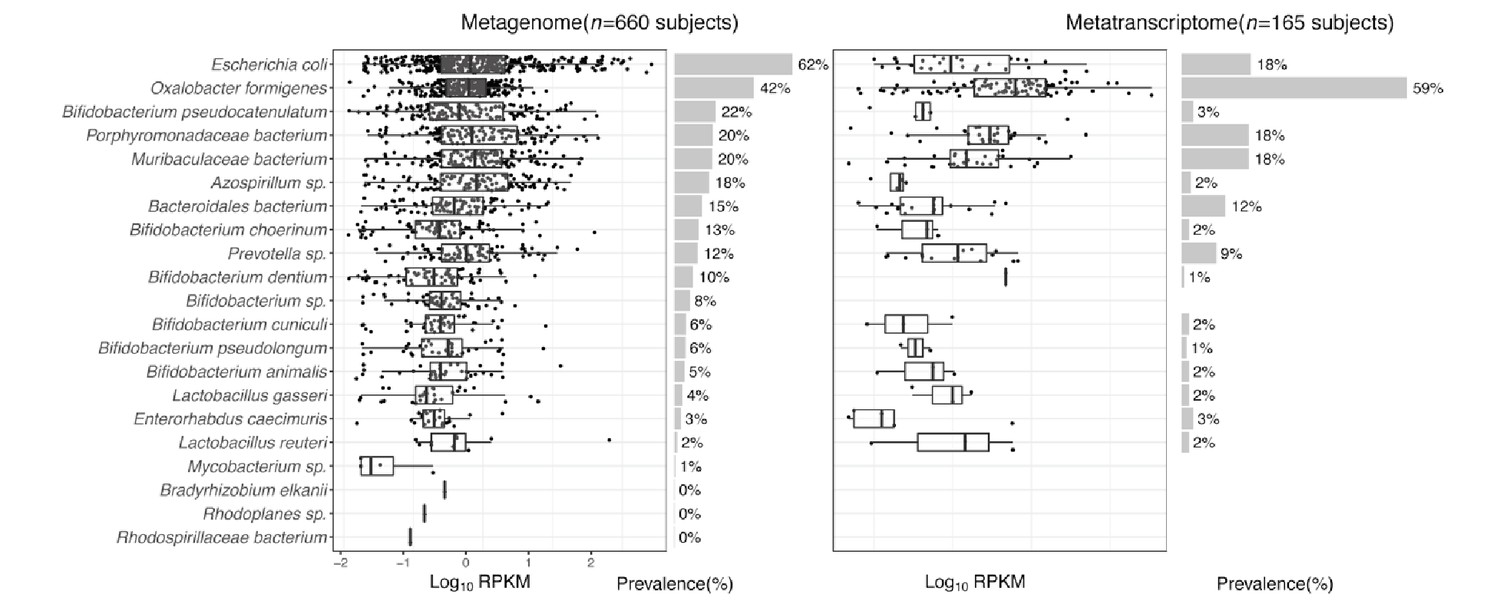
Detection of type I and II ODE within the fecal metagenome and metatranscriptome of 660 and 165 healthy human subjects.
Prevalence (A) and abundance (B) of ODE in the fecal metagenome of five studies surveyed. Numbers written on the bottom bars indicate the numbers of subjects in whom the corresponding ODE is detected, and only those subjects were considered in (B). Prevalence (C) and abundance (D) of OXDD, FRC, and OXC in the fecal metatranscriptome of four studies surveyed. *p<0.05, **p<0.01, ***p<0.001, ****p<0.0001, by proportion tests for (A) and (C), by multiple-adjusted Mann–Whitney tests for (B) and (C).
-
Figure 2—source data 1
Detection of OXDD, FRC, and OXC in the metagenome and metatranscriptome of healthy individuals.
- https://cdn.elifesciences.org/articles/63642/elife-63642-fig2-data1-v2.xlsx
Figure 2—figure supplement 1
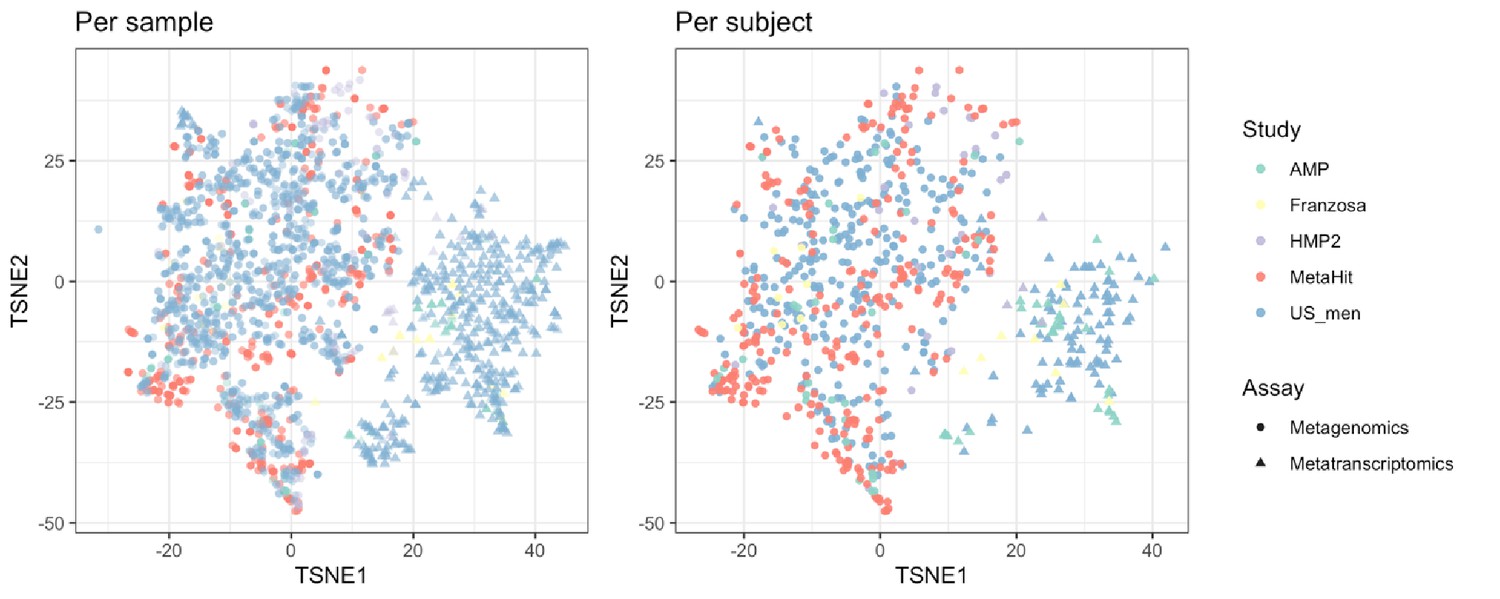
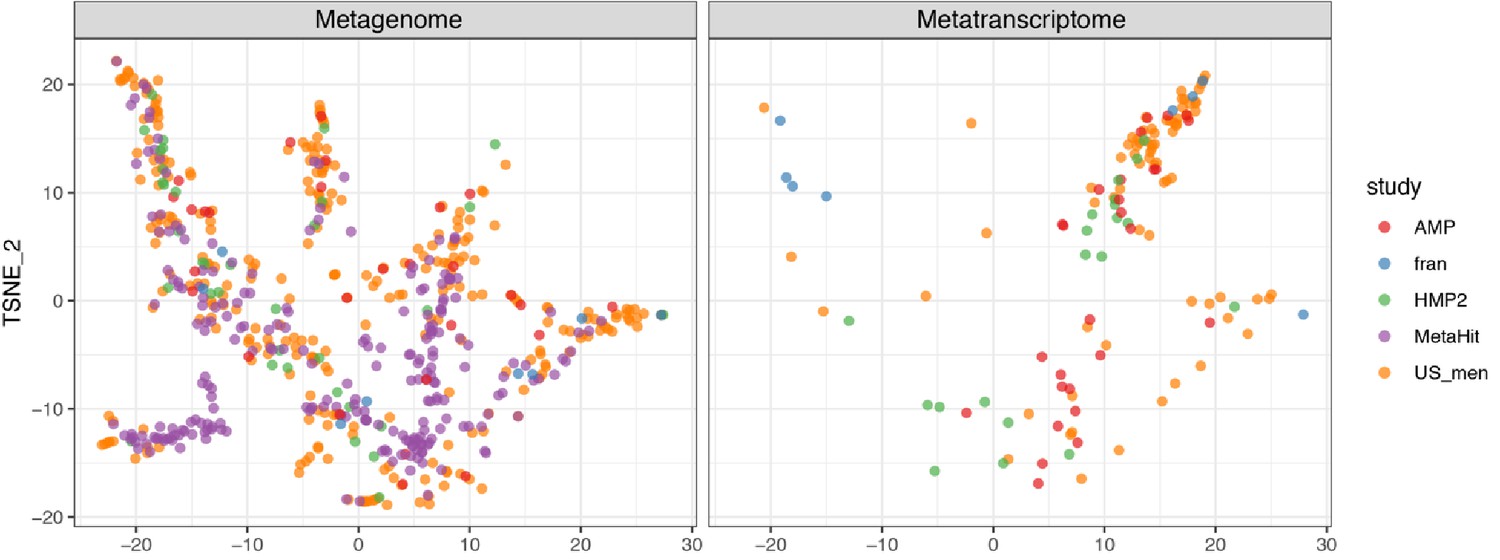
Beta-diversity of metabolic profiles associated with the metagenomic and metatranscriptomic samples from healthy human subjects, ordinated on a Tsne (t-distributed stochastic neighbor embedding) plot.
The metabolic profile is assessed by the HUMAnN2 (Franzosa et al., 2018) pipeline using (see Materials and methods). The metabolic profiles for each subject are calculated by taking the mean measurements provided. The table shows the number of subjects who provided metagenomic (MTG ●) and metatranscriptomic (MTS ▲) data. See Supplementary file 1a for study information.
Figure 2—figure supplement 2
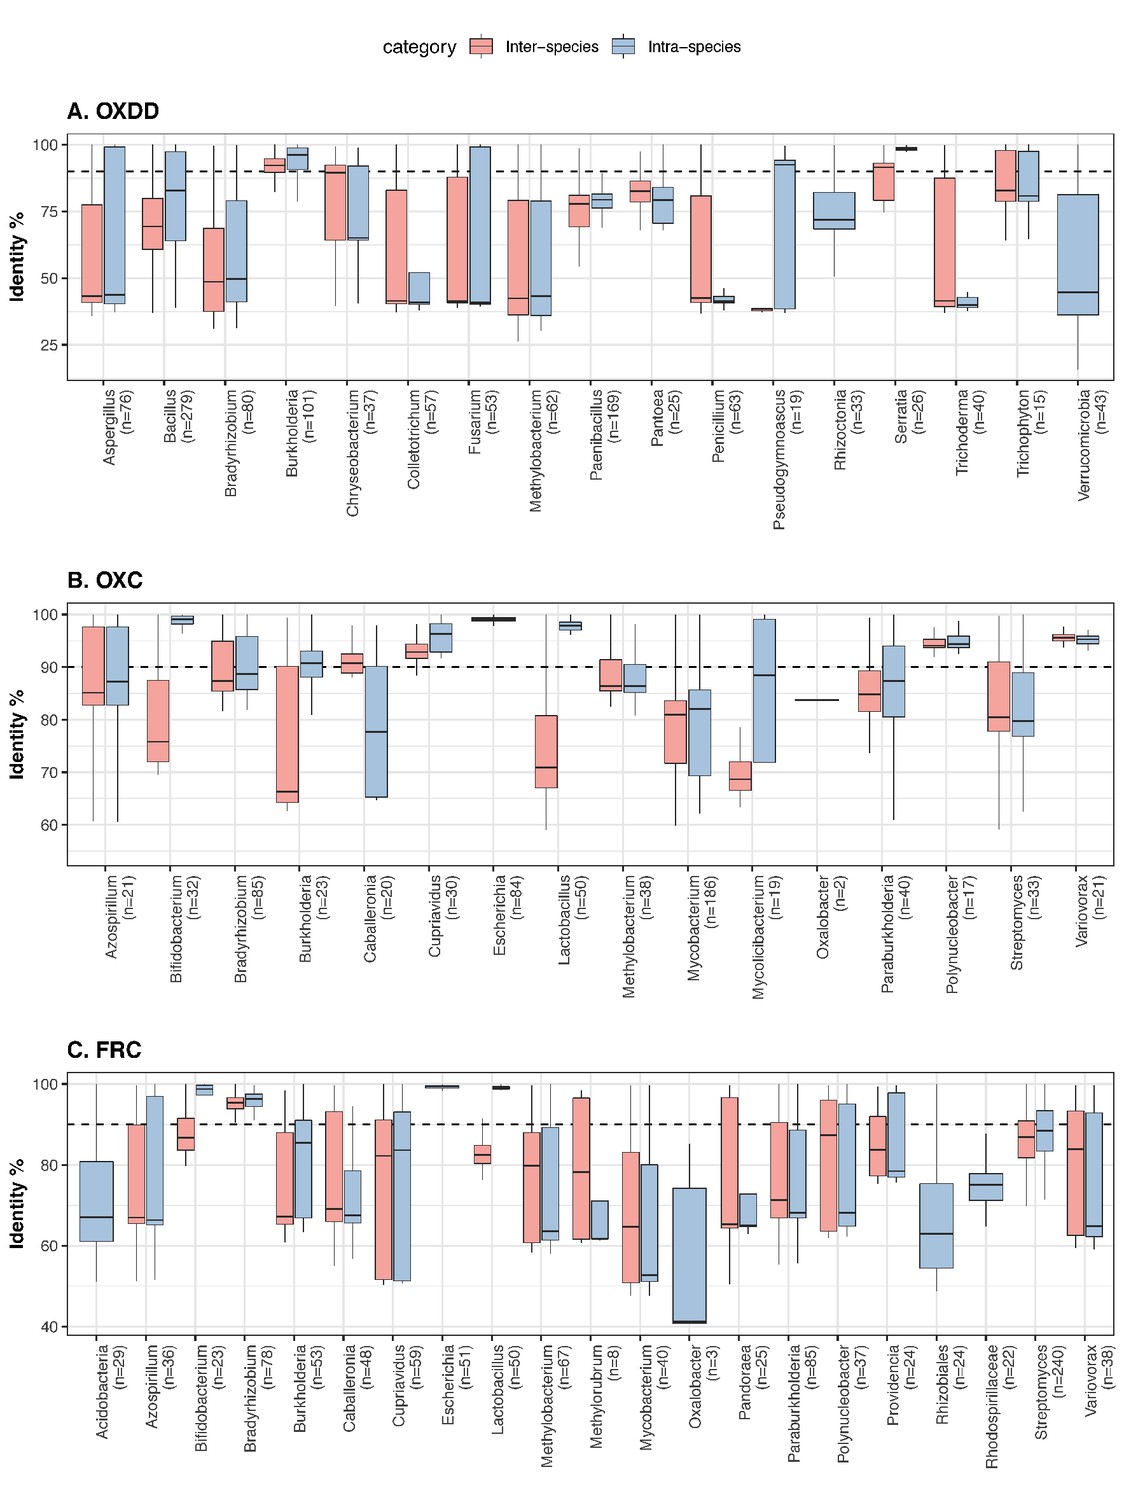
The protein identity between inter-species and intra-species ODEs, for each microbial genus.
Panels focus on OXDD (A), OXC (B), or FRC (C). The pairwise protein identities were calculated based on amino acid sequence alignment (see Materials and methods for details). The number of ODE homologs available for each genus is indicated in parenthesis. The blastx identity cutoff 90% used in this study is indicated by the dashed line. Genera with >20 ODE homologs and genus Oxalobacter are shown.
Figure 2—figure supplement 3
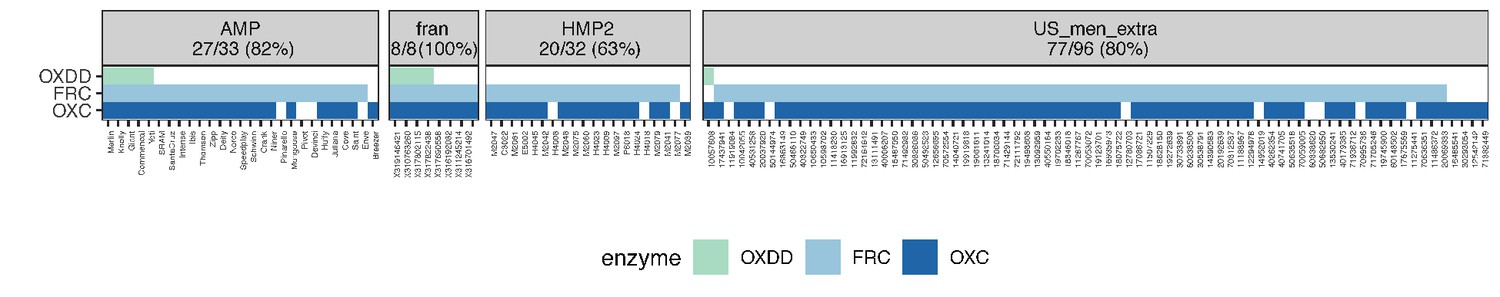
Co-detection of OXDD, FRC, and OXC in the metatranscriptomes of subjects across different studies.
Subjects with at least one ODE detected in the metatranscriptome are shown, with percent of total subjects displayed in panels, for each study, indicated in parentheses.
Figure 3 with 6 supplements
Expression of type II ODP of microbial species within the intestinal microbiota of healthy humans.
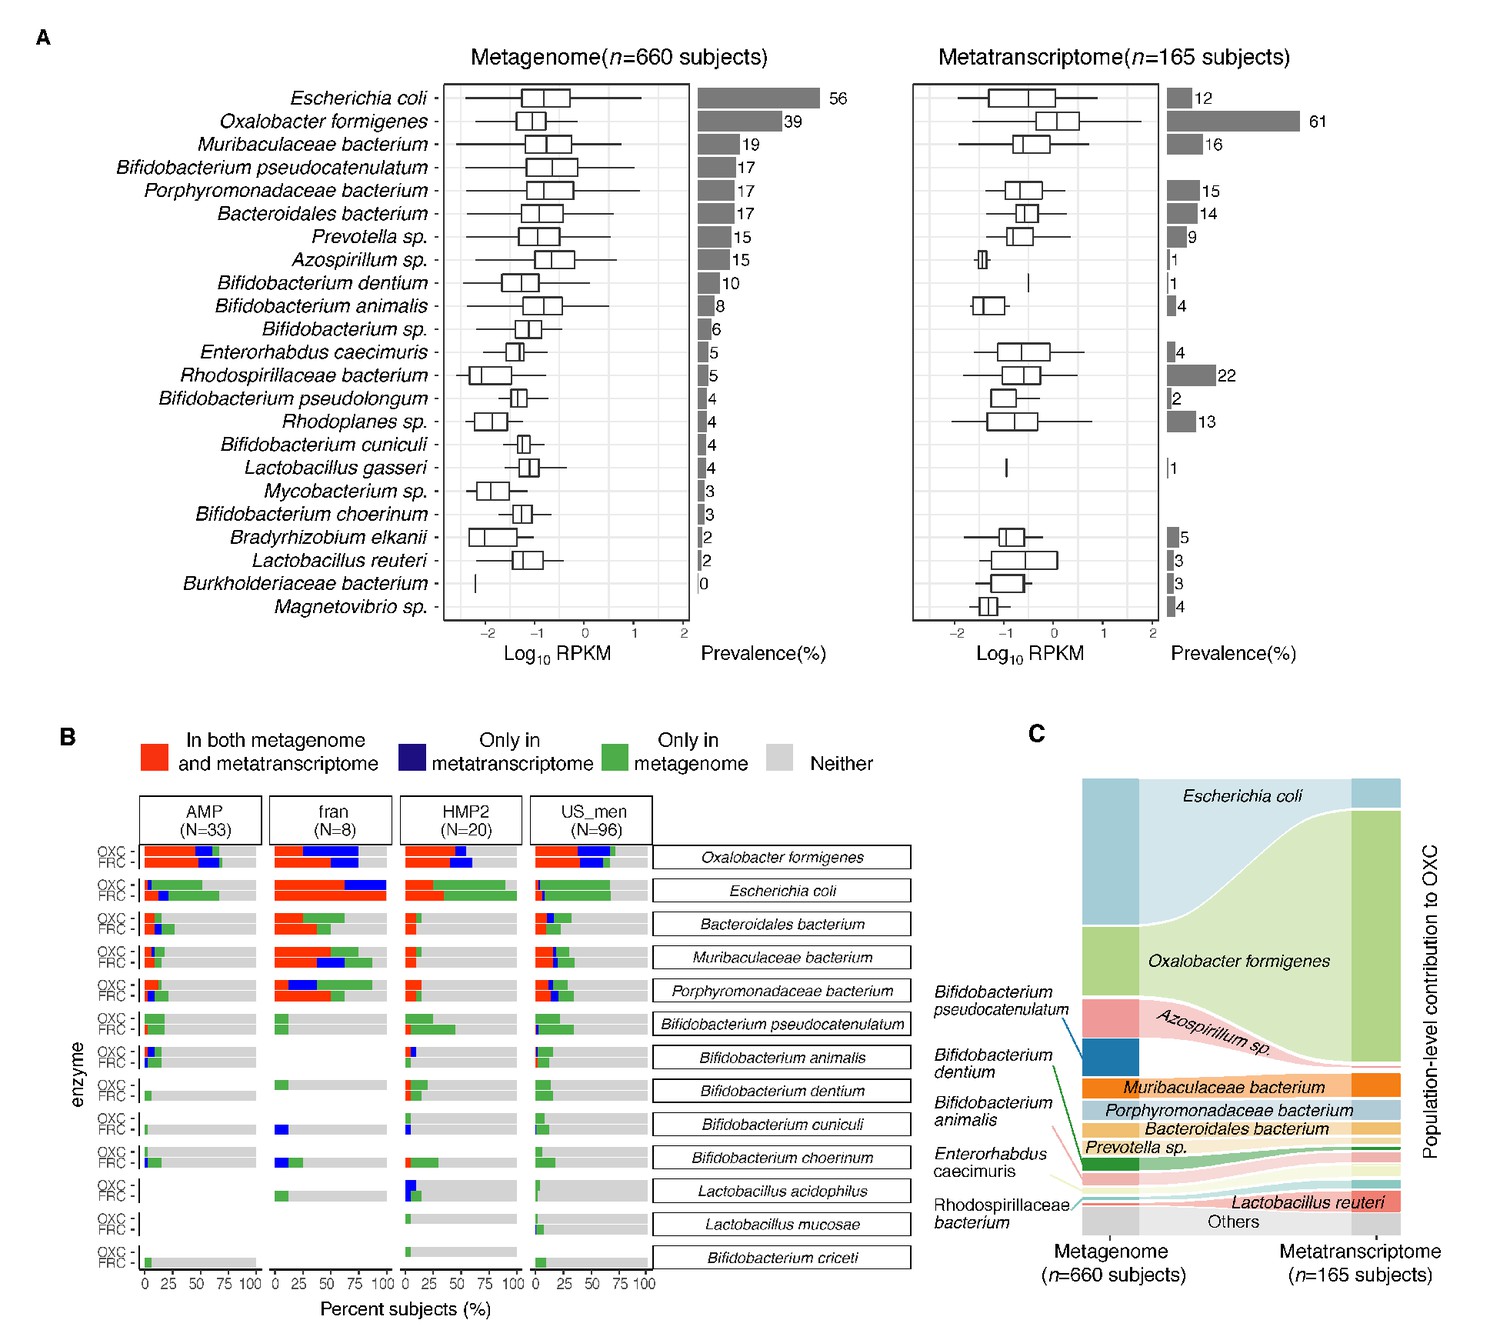
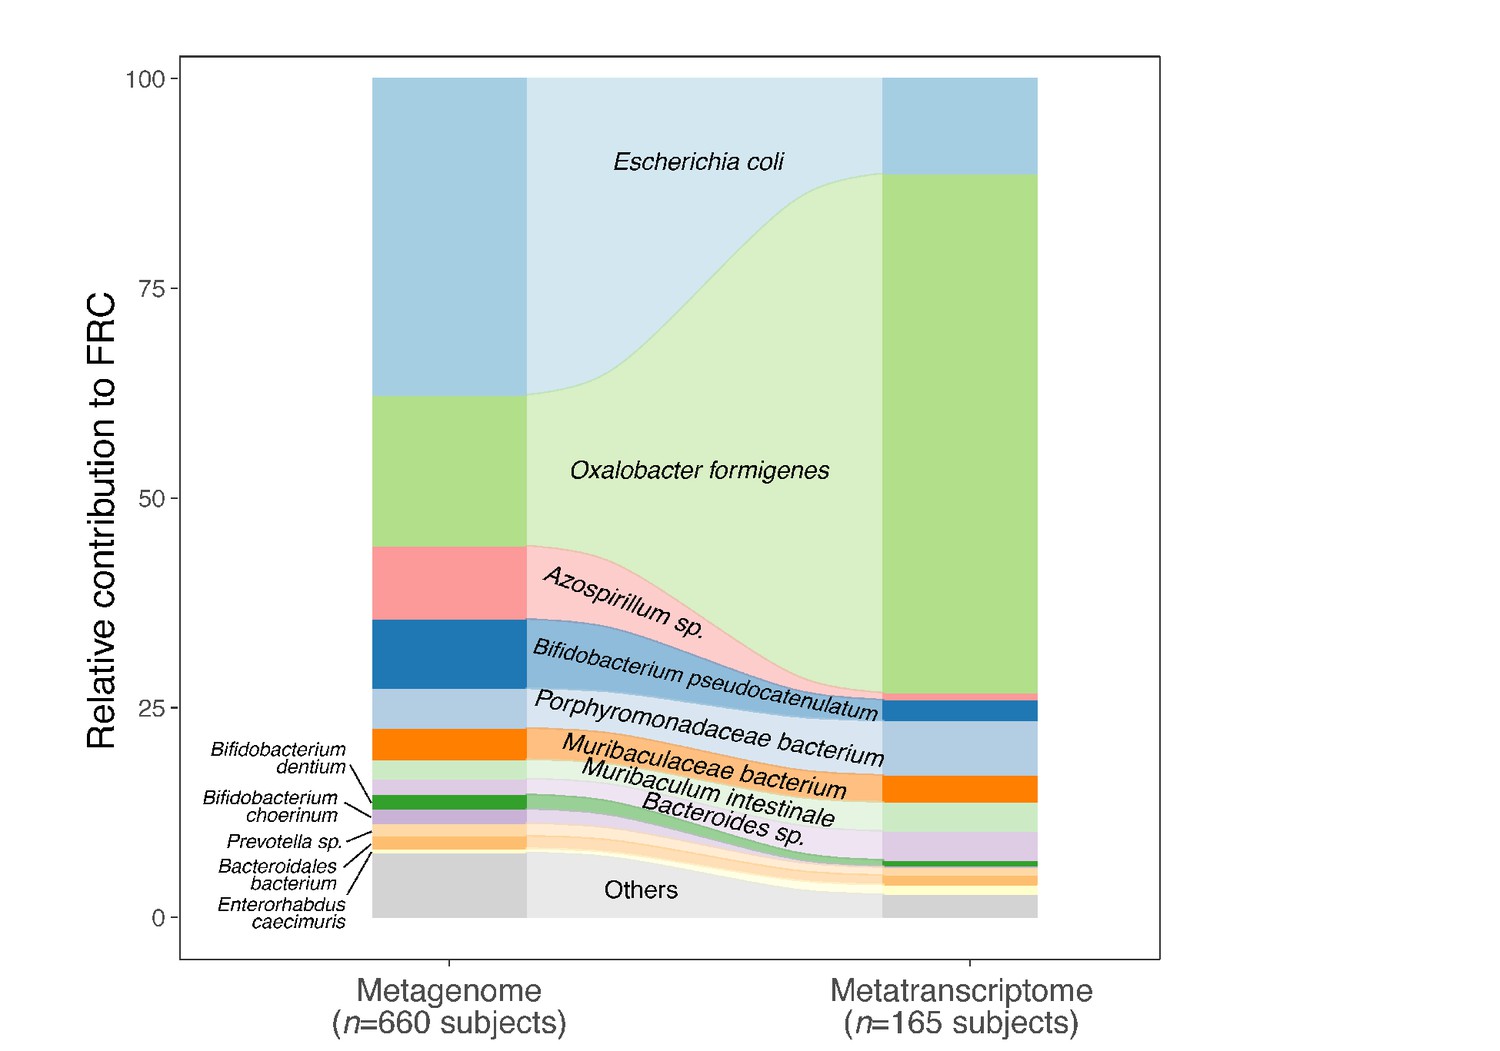
(A) Abundance and prevalence of OXC of microbial species in the metagenome (left) or metatranscriptome (right) of 660 and 165 subjects. Box plots indicate the abundance of microbial OXC (log10 RPKM) among subjects in whom OXC is detected, and are generated with ggplot2 with outliers excluded. Bar plots indicate the prevalence of microbial oxc, with percentage annotated. Microbial species are ordered by the corresponding metagenomic OXC prevalence. A parallel analysis for FRC is shown in Figure 3—figure supplement 5. (B) Detection of OXC and FRC of microbial species in the subject-matched metagenome and metatranscriptome, by study. For each microbial ODE, the subjects are divided into four groups (shown in different colors) based on the co-detection of ODE in the matched metagenome and metatranscriptome, with percent (%) of which reflected. The fran Study, from which E. coli ODP was detected in all subjects, used a sample extraction method known to induce E. coli, as noted in their publication (Franzosa et al., 2014). (C) Population-level contribution of individual species to metagenomic (left) or metatranscriptomic (right) OXC. The population-level contribution of each species was calculated at a relative scale (see Materials and methods) and plotted. Raw values can be found in Supplementary file 1a. The 10 species that have the highest metagenomic or metatranscriptomic contribution are shown. A parallel analysis for FRC is shown in Figure 3—figure supplement 3.
-
Figure 3—source data 1
Species contribution to FRC, and OXC in the metagenome and metatranscriptome of healthy individuals.
- https://cdn.elifesciences.org/articles/63642/elife-63642-fig3-data1-v2.xlsx
Figure 3—figure supplement 1
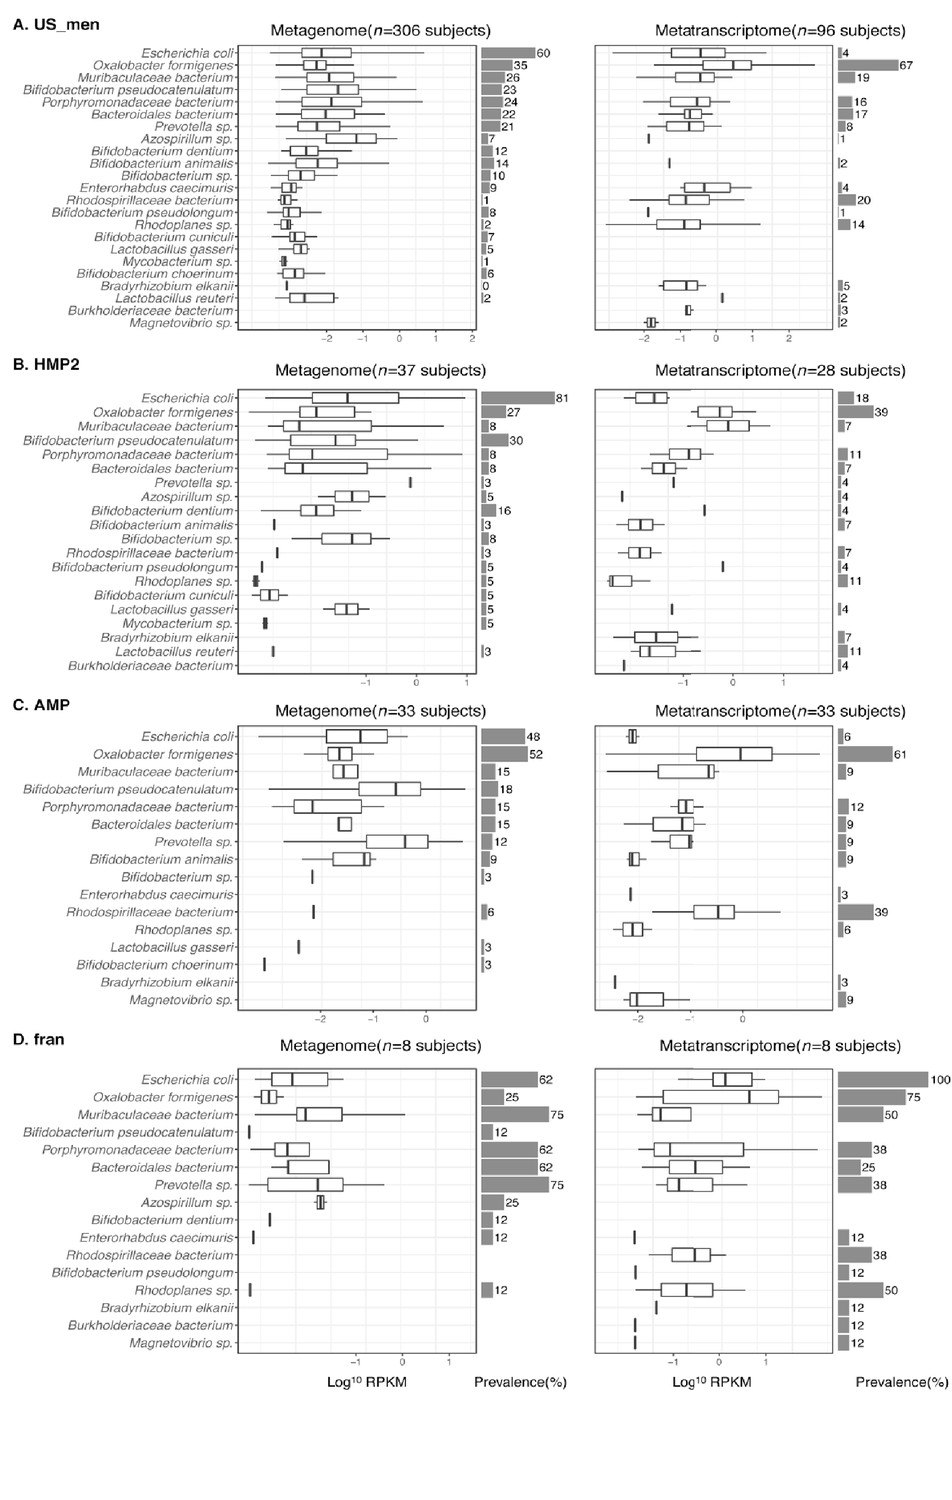
Detection of OXC of microbial species in the microbiome of healthy human subjects from US_men (A), HMP2 (B), AMP (C), or fran (D) study.
Left and right panels focus on detection in metagenomic and metatranscriptomic data, respectively. (Follows legend of Figure 3A.)
Figure 3—figure supplement 2
Tsne plot of 594 metagenomic and 131 metatranscriptomic samples, based on the abundances OXC and FRC.
OXC and FRC of microbes in Figures 3A and 5 were used. Tsne is calculated with Rtsne v0.15 package in R. The OXC- and FRC-specific study effects are not significant, examined using PERMANOVA using 1000 permutations (p>0.1).
Figure 3—figure supplement 3
Detection of FRC of microbial species in the metagenome (left) or metatranscriptome (right) of healthy human subjects.
(Follows the legend for Figure 3A).
Figure 3—figure supplement 4
Population-level contribution of individual species to metagenomic (left) or metatranscriptomic (right) FRC.
Follows the legend for Figure 3D.
Figure 3—figure supplement 5
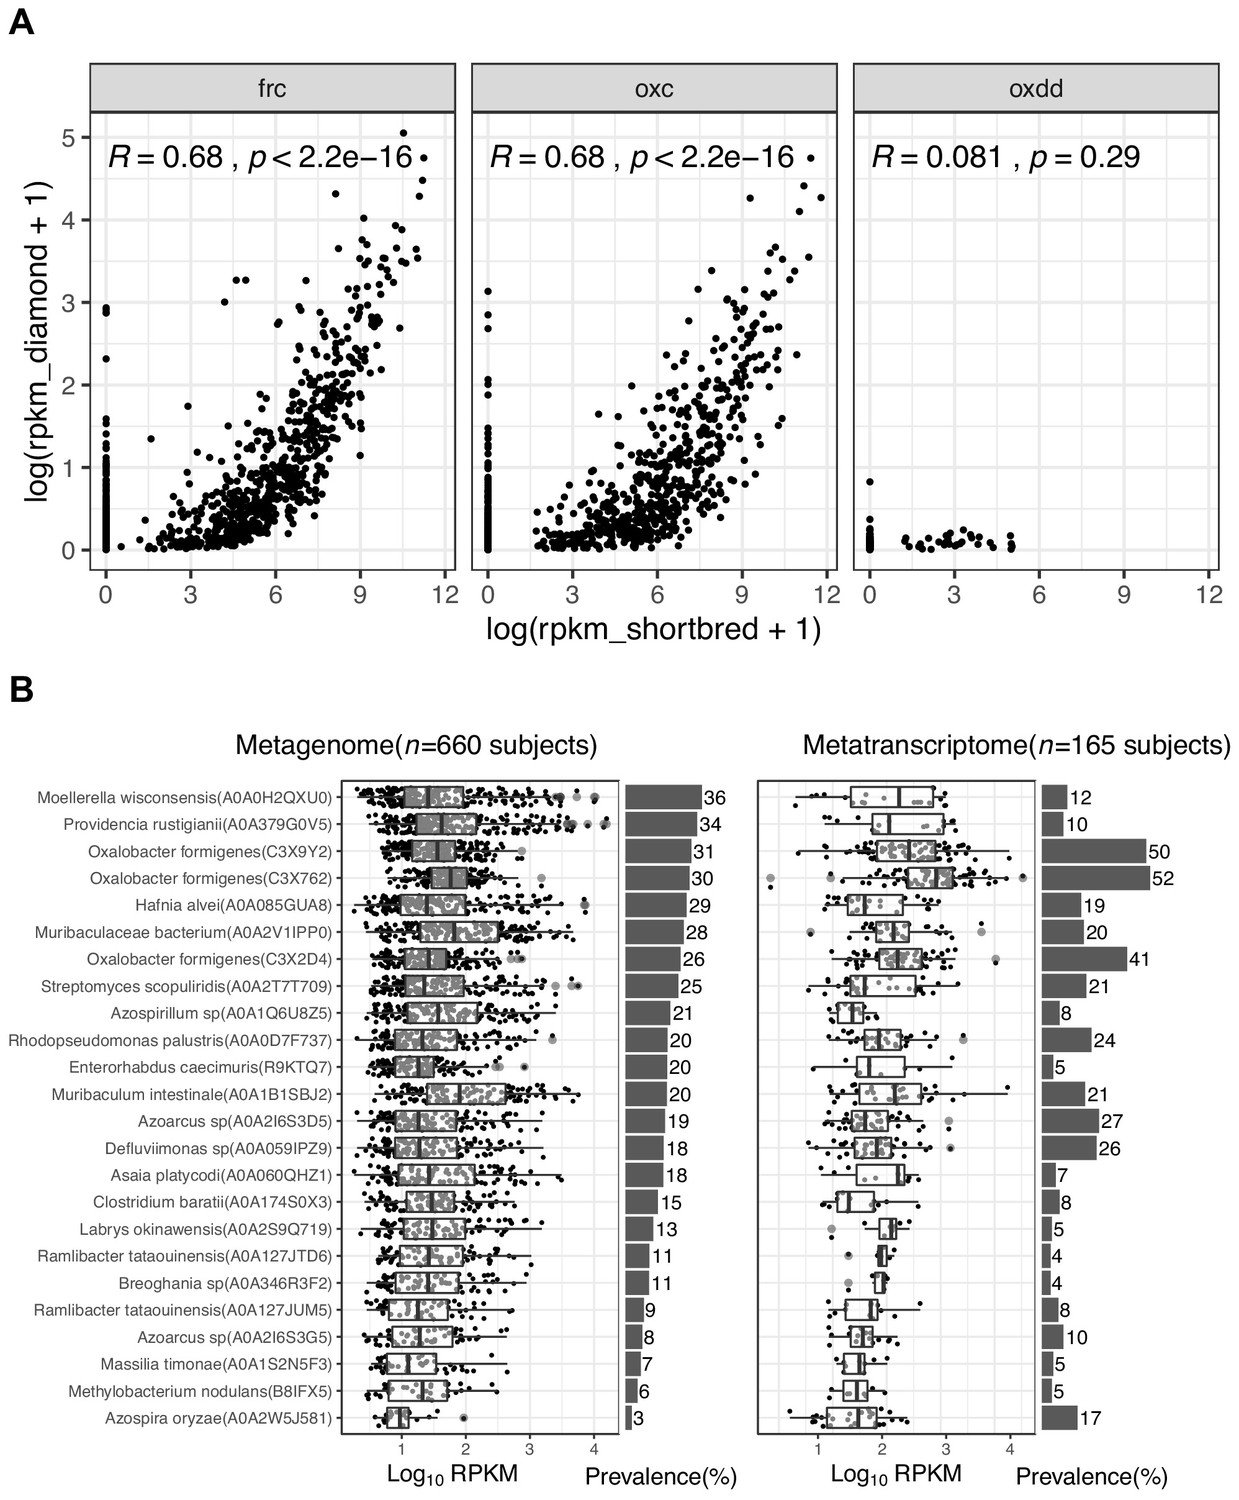
Detection of ODE using ShortBRED.
(A) Comparison of ODE detection using ShortBred and using Diamond in all samples (n = 5557) included in this present study. Each point represents the total abundance of FRC, OXC, or OXDD homologs in one individual. Mean measurements were used for study subjects who provided multiple samples. Statistics were generated using Spearman correlations. (B). Abundance and prevalence of FRC of microbial species in the metagenome (left) or metatranscriptome (right) of 660 and 165 subjects. Detection of FRC and OXC protein families by ShortBRED using default parameters. The text on the left indicates the centroid protein for each protein homolog. (B) FRC: All three O. formigenes FRCs (C3 × 9Y2, C3 × 762, and C3 × 2D4) are in a protein family that contains only that one enzyme (See New Supplement File 1 for the clustering centroid-member map). (C) OXC. Unlike results for FRC, no O. formigenes OXC homologs were detected.
Figure 3—figure supplement 6
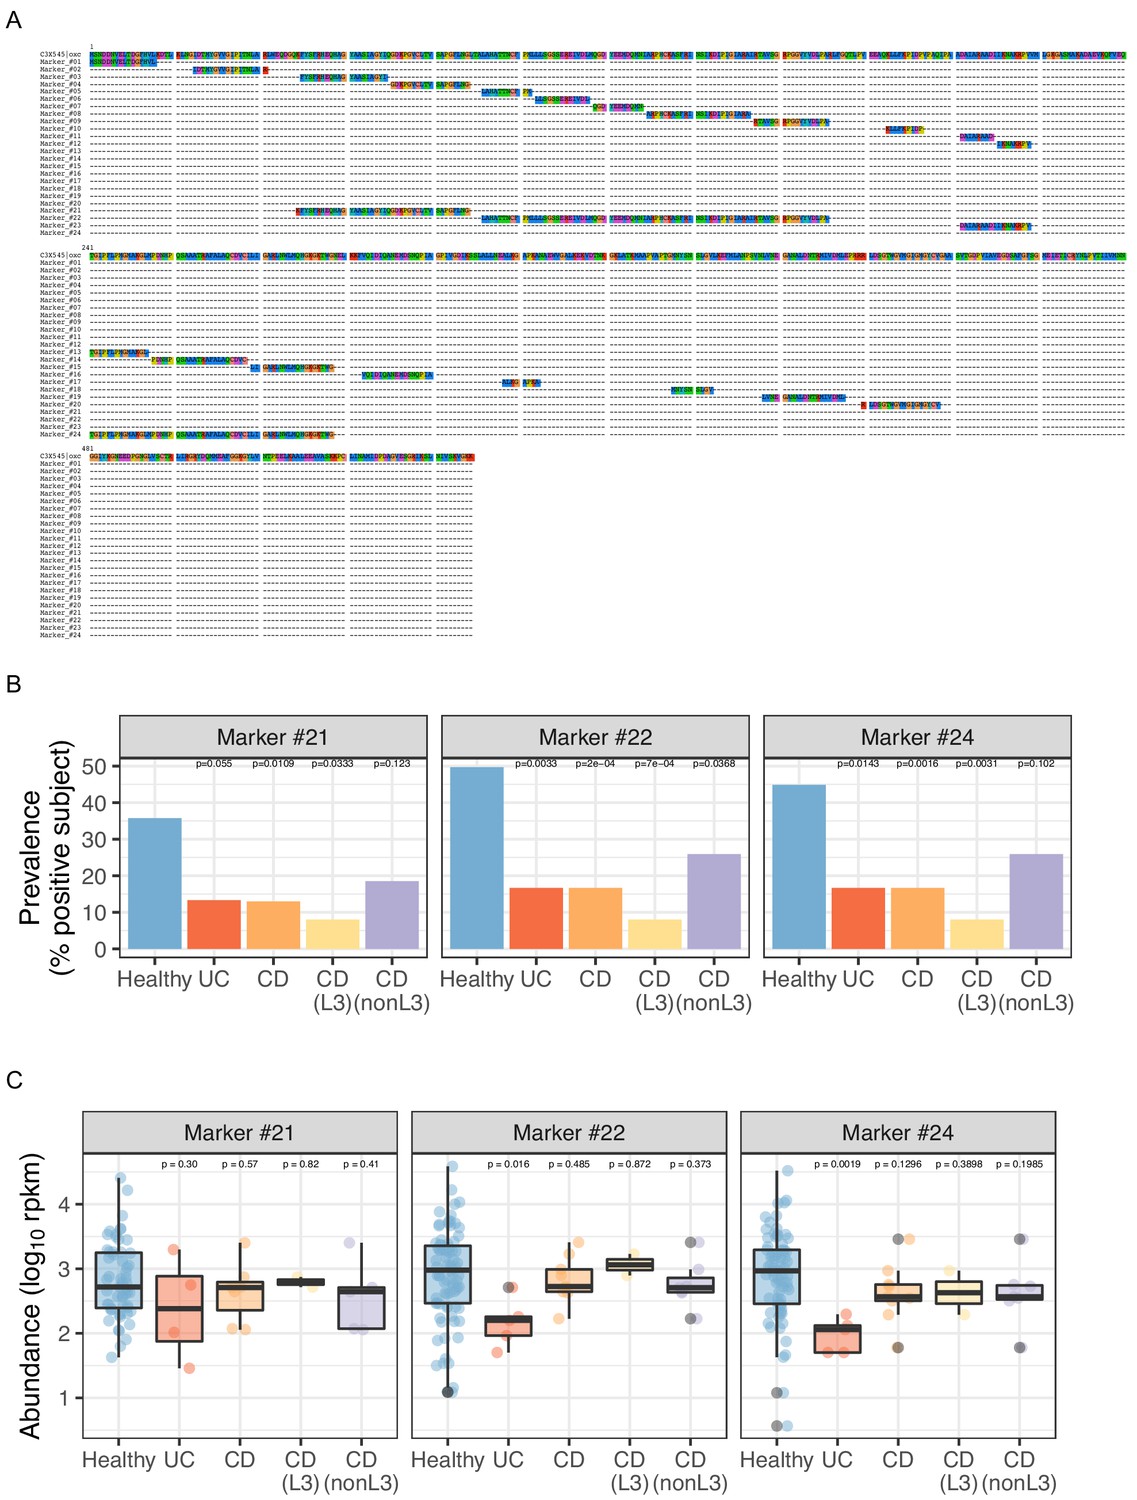
Detection of O. formigenes OXC using merged long marker peptides identified by ShortBRED.
(A) Multiple alignment of 5 and the marker peptides. A total of 20 marker peptides (Marker_#1 - Marker_#20) with 16.5 amino acid (AA) median length were identified by ShortBRED-identify using default parameters. Peptides one AA apart were further merged (including the gap AA) into four long marker peptides #21–#24 with median length of 48.5 AA. (B,C) Prevalence (% subject positive) (B) and abundance (C) of merged marker peptides in metatranscriptomes, detected by ShortBRED. The shortest Marker #23 (17 AA) is not detected in any sample. Statistics were done compared to Healthy subjects as the reference for proportion tests (B) and Wilcoxon rank tests (C) with adjustment for multiple comparisons.
Figure 4 with 5 supplements
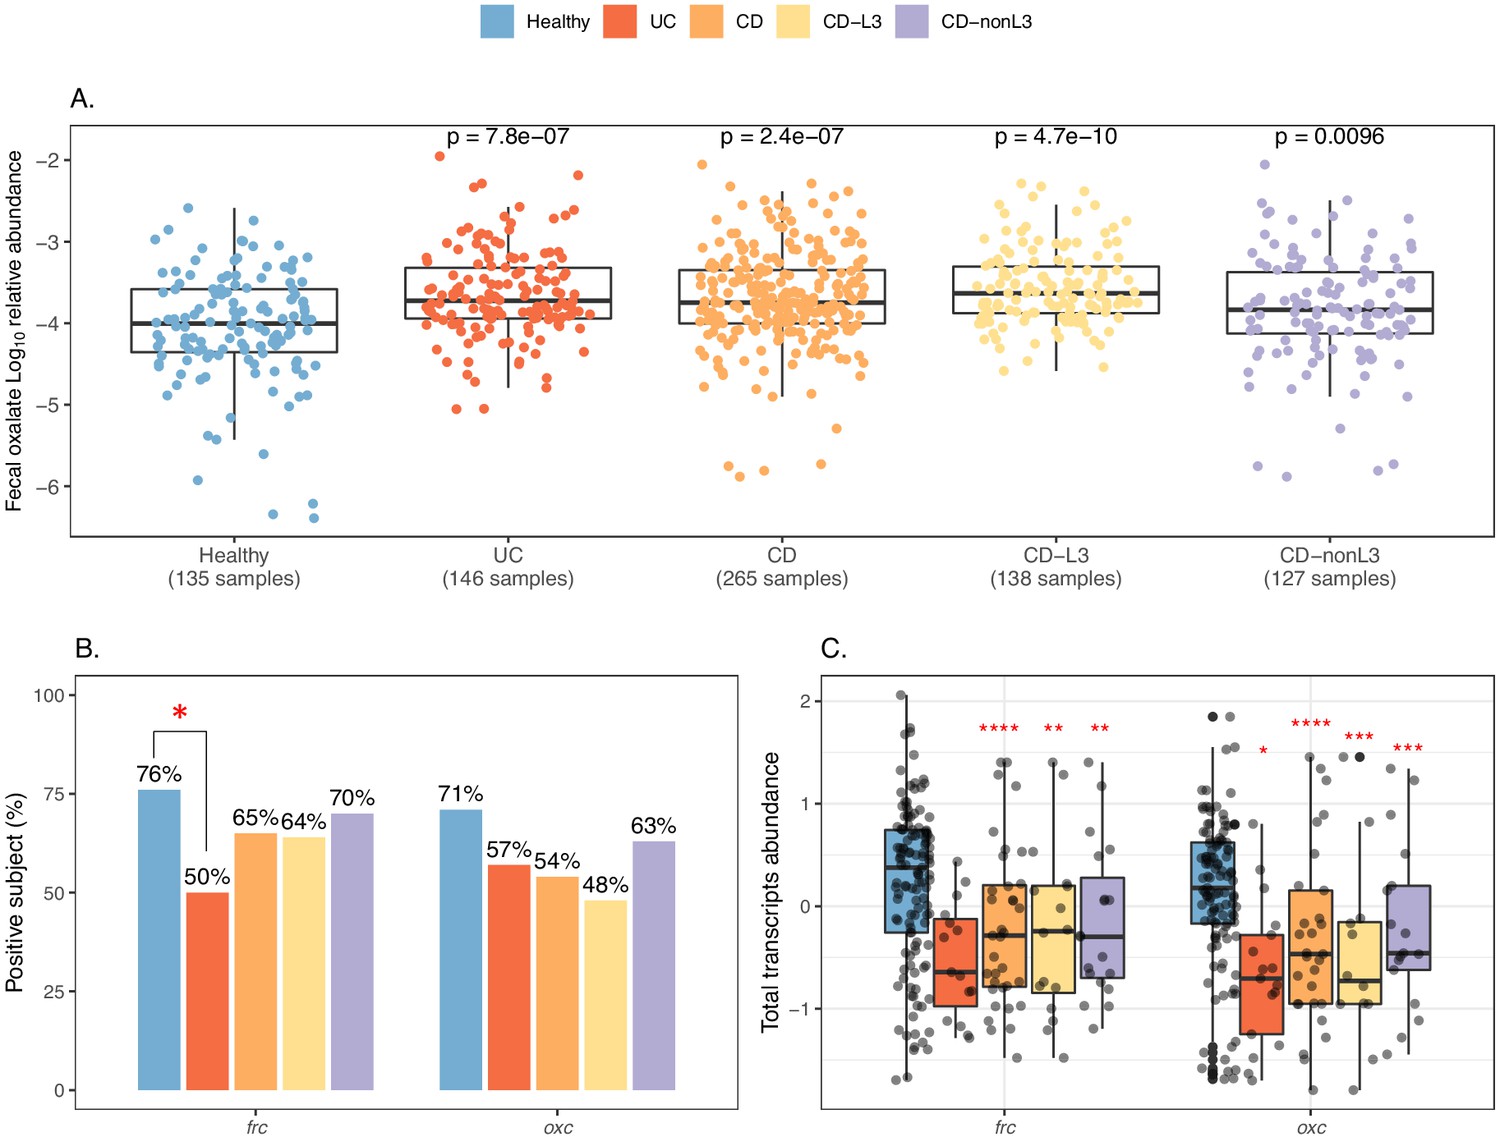
Elevated fecal oxalate and reduced expression of microbiome ODP in IBD patients.
(A). Stool oxalate relative abundance (log10) in healthy, UC, CD, CD-L3, or CD-nonL3 subjects from HMP-IBD study. Fecal oxalate relative abundance was determined from untargeted metabolomics data from the iHMP-IBD; measurements related to oxalate were selected and normalized against total metabolites (percent abundance of all observed metabolites) for analysis. L3 refers to the ileocolonic phenotype, according to the Montreal Classification at baseline. Data derived from iHMP-IBD untargeted metabolomics measurements. Prevalence (B) and abundance (C) of OXDD, FRC, and OXC in metatranscriptomes of healthy, UC, CD, or CD-L3 subjects. The 165 healthy controls are combined from four studies (AMP, US_men, fran, HMP2). *: p<0.05, **: p<0.01, ***: p<0.001, ****: p<0.0001 by multiple-adjusted Mann-Whitney tests in (A) and (C), by proportion test in (B).
-
Figure 4—source data 1
Fecal oxalate and ODE expression in healthy and IBD individuals.
- https://cdn.elifesciences.org/articles/63642/elife-63642-fig4-data1-v2.xlsx
Figure 4—figure supplement 1
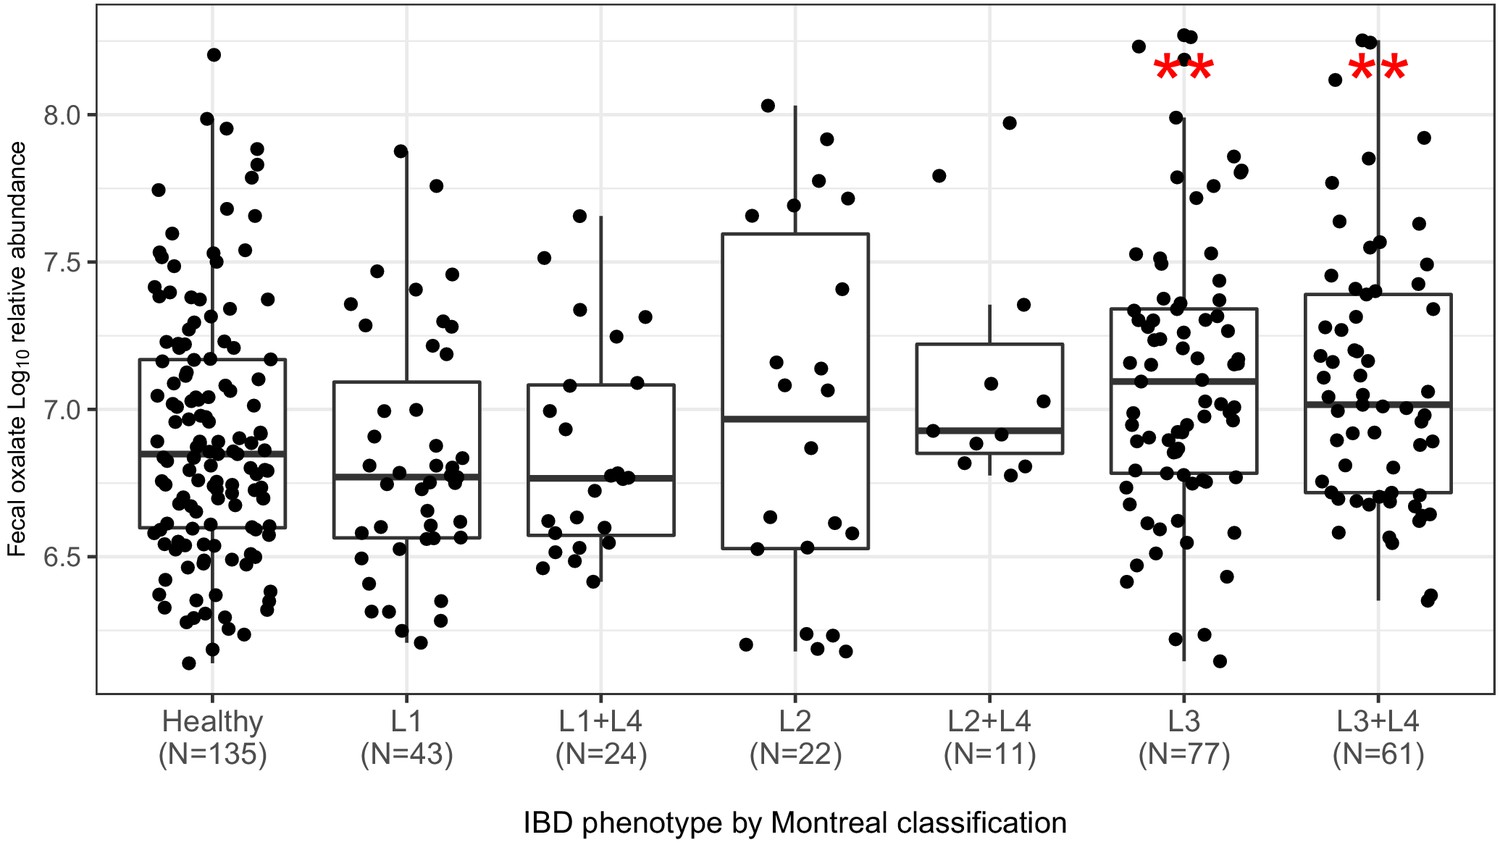
Fecal oxalate log10 relative abundance in CD patients, according to the Montreal clinical classification (Satsangi et al., 2006).
***p<0.001 by Mann–Whitney test.
Figure 4—figure supplement 2
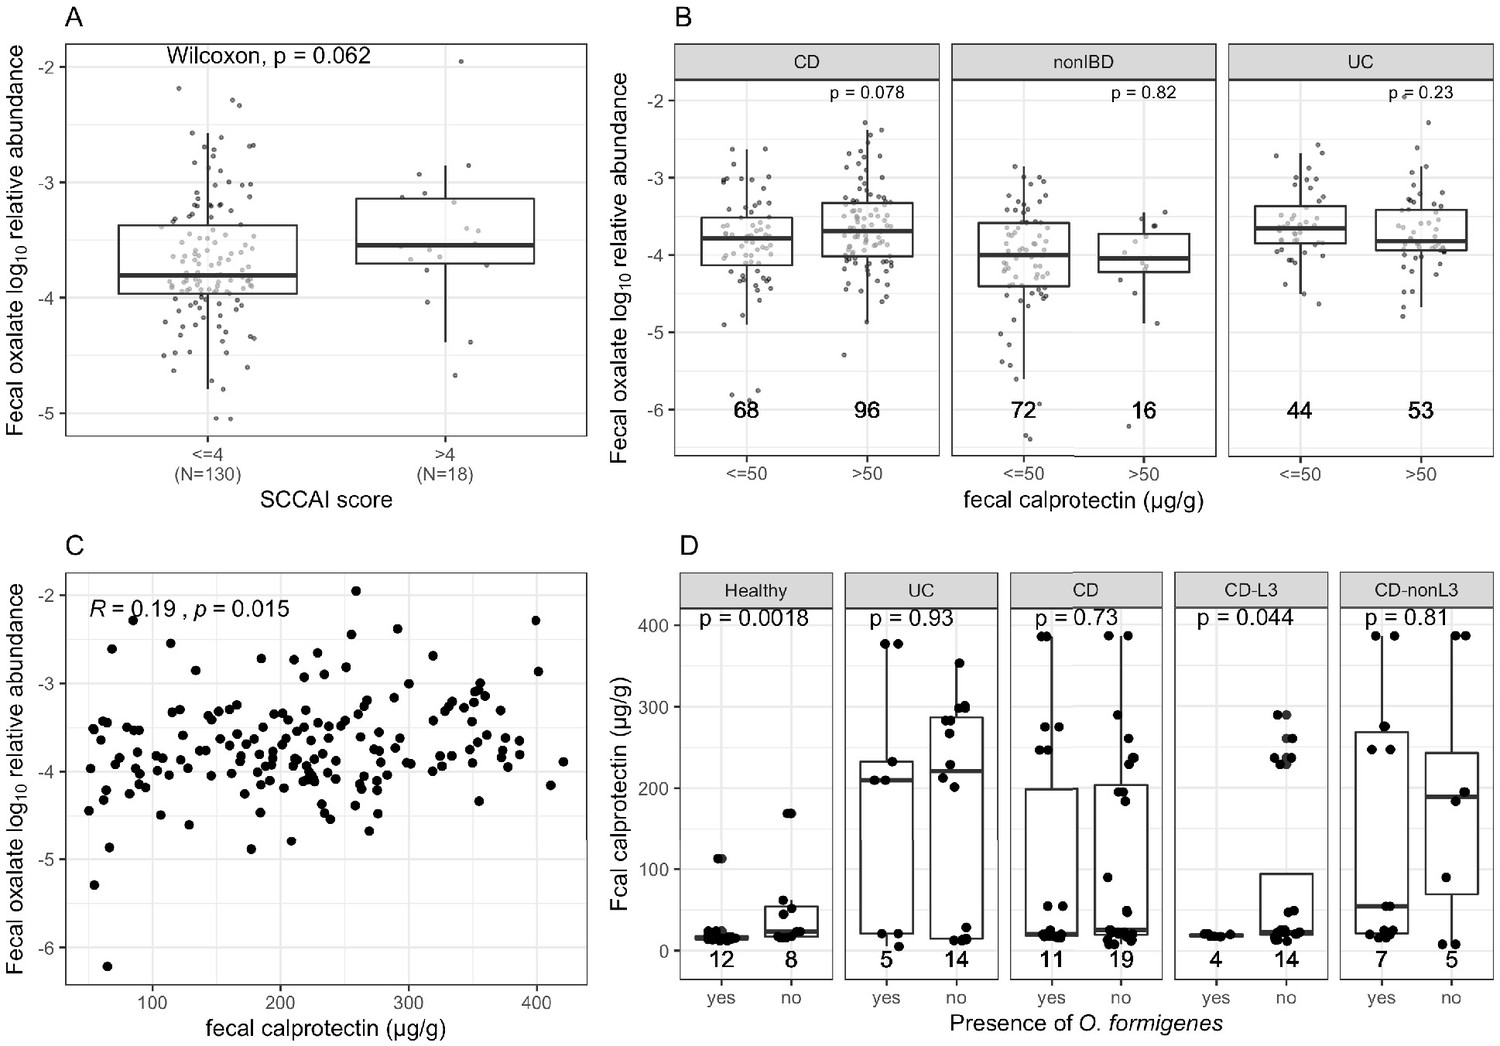
Comparison of fecal oxalate log10 relative abundance based on disease activity by fecal calprotectin levels or SCCAI scores.
(A) 148 UC patients were divided into two groups based on SCCAI score above and below 4. (B) Subjects were divided based on whether or not fecal calprotection was >50 µg/g (Damms and Bischoff, 2008; Manz et al., 2012; Pathirana et al., 2018). The number of samples in each group is indicated under each box. (C) Spearman correlation between fecal calprotectin (µg/g) and fecal oxalate log10 relative abundance, in samples with calprotectin > 50. (D) Fecal calprotectin levels in association with O. formigenes status in 152 samples from 38 subjects enrolled in iHMP2, according to clinical diagnosis. The presence of O. formigenes was determined by whether O. formigenes frc or oxc was detected in the metagenome or metatranscriptome samples collected from the same subject during the same visit (matched accession ID). The number of samples in each group is indicated under each box. Statistics were done using Wilcoxon Rank Sum tests for (A), (B), and (D).
Figure 4—figure supplement 3
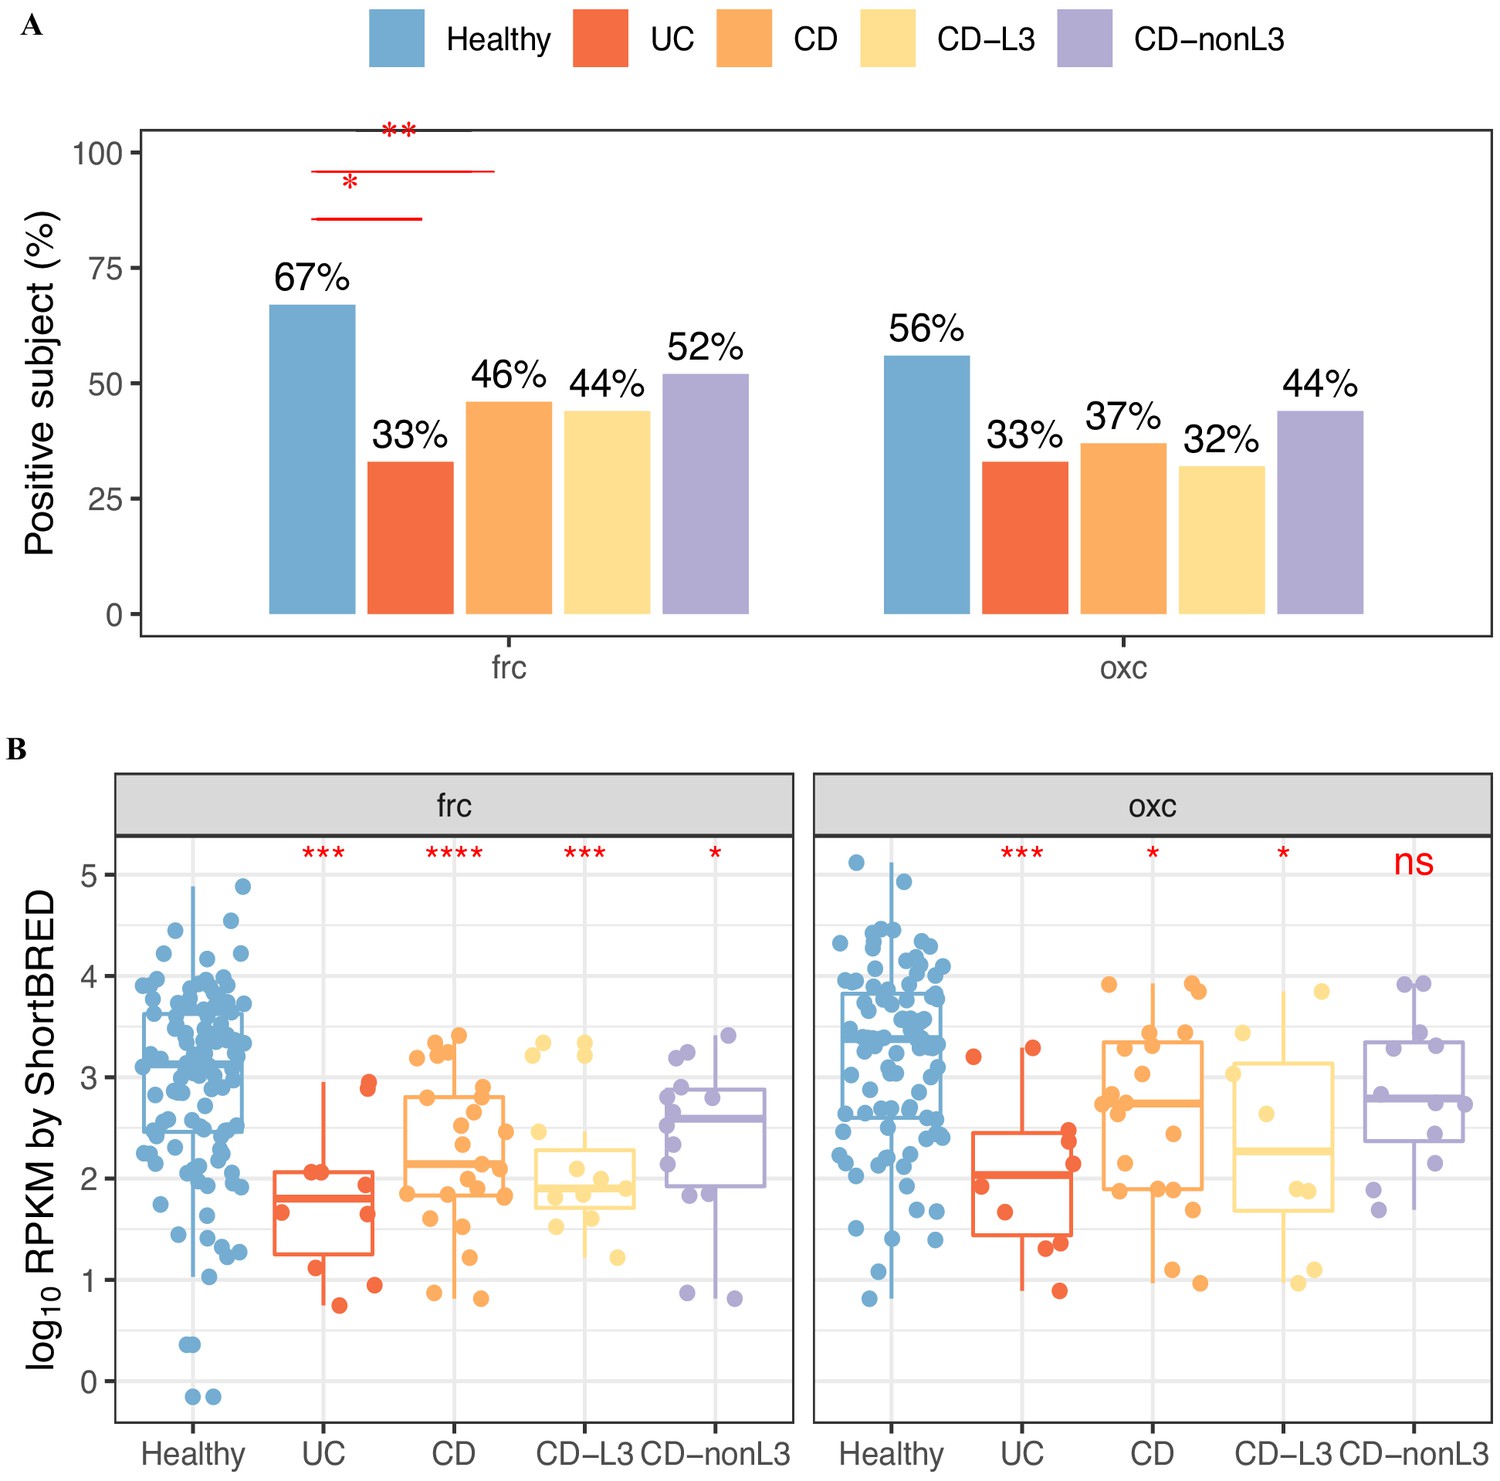
Prevalence (A) and abundance (B) of FRC, and OXC in metatranscriptomes of healthy, UC, CD, or CD-L3 subjects detected by ShortBRED.
The 165 healthy controls are combined from four studies (AMP, US_men, fran, HMP2). *p<0.05, **p<0.01, ***p<0.001, ****p<0.0001 by multiple comparison adjusted proportion tests in (A) and Mann–Whitney tests in (B).
Figure 4—figure supplement 4
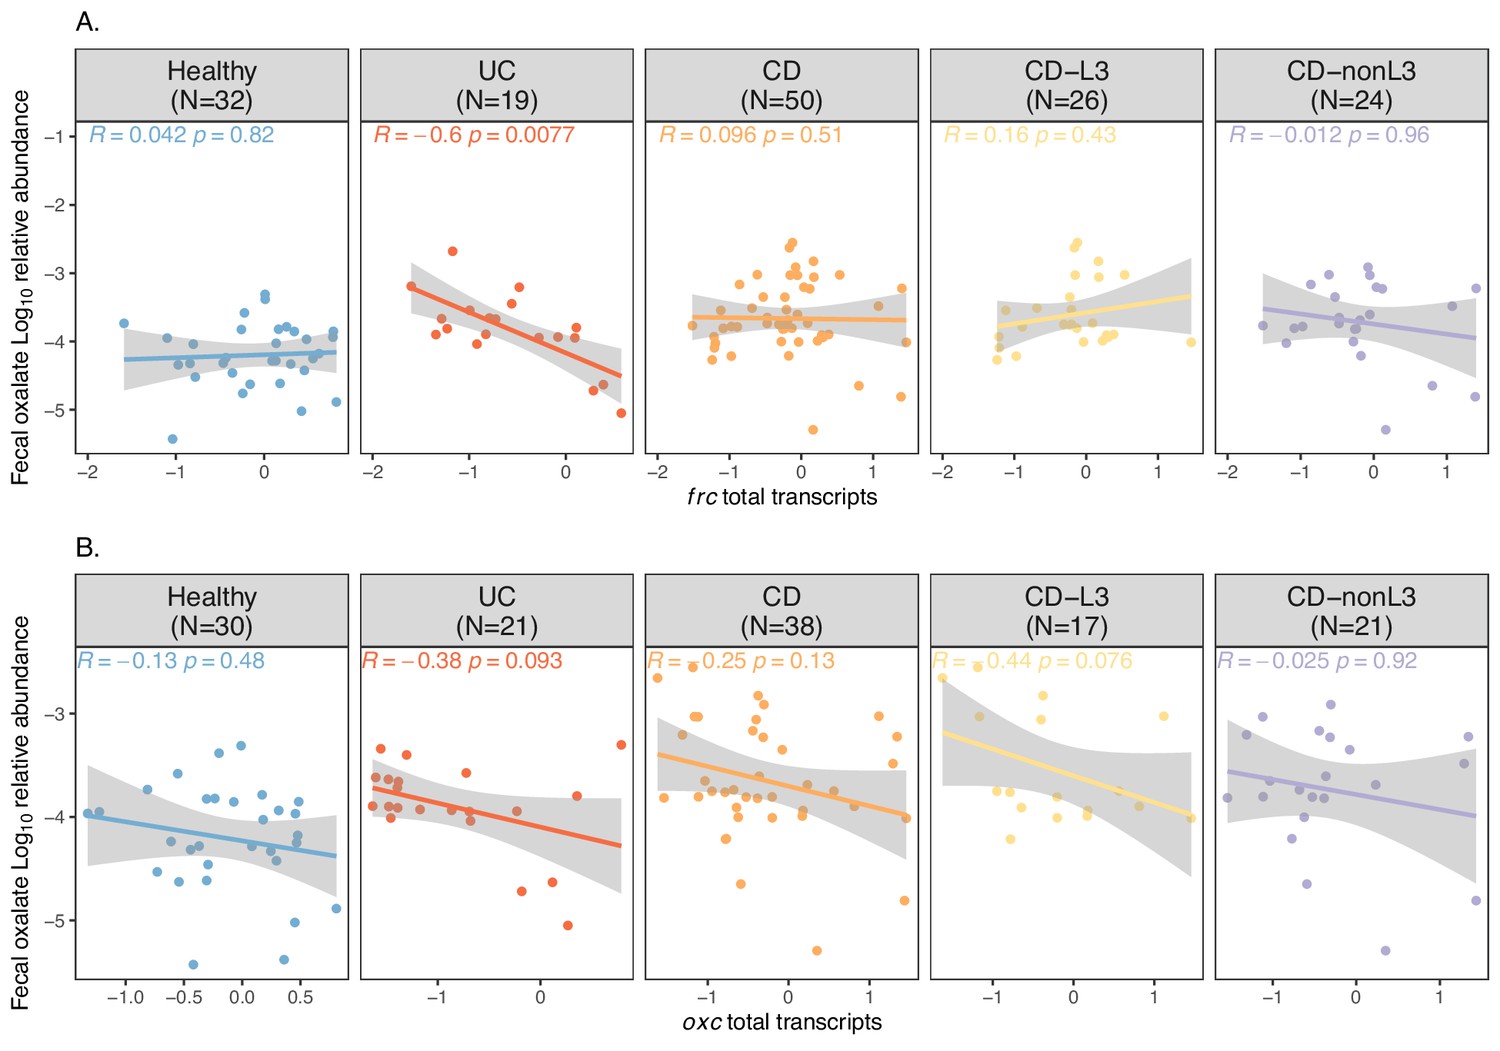
Spearman correlations of fecal oxalate and total transcripts of frc (A) or oxc (B).
The x axis is the log10 abundance of total transcript, which determined by RPKM sum of all homologs in a metatranscriptome samples. The y axis shows the fecal oxalate log10 relative abundance. Spearman Rho and p values are shown.
Figure 4—figure supplement 5
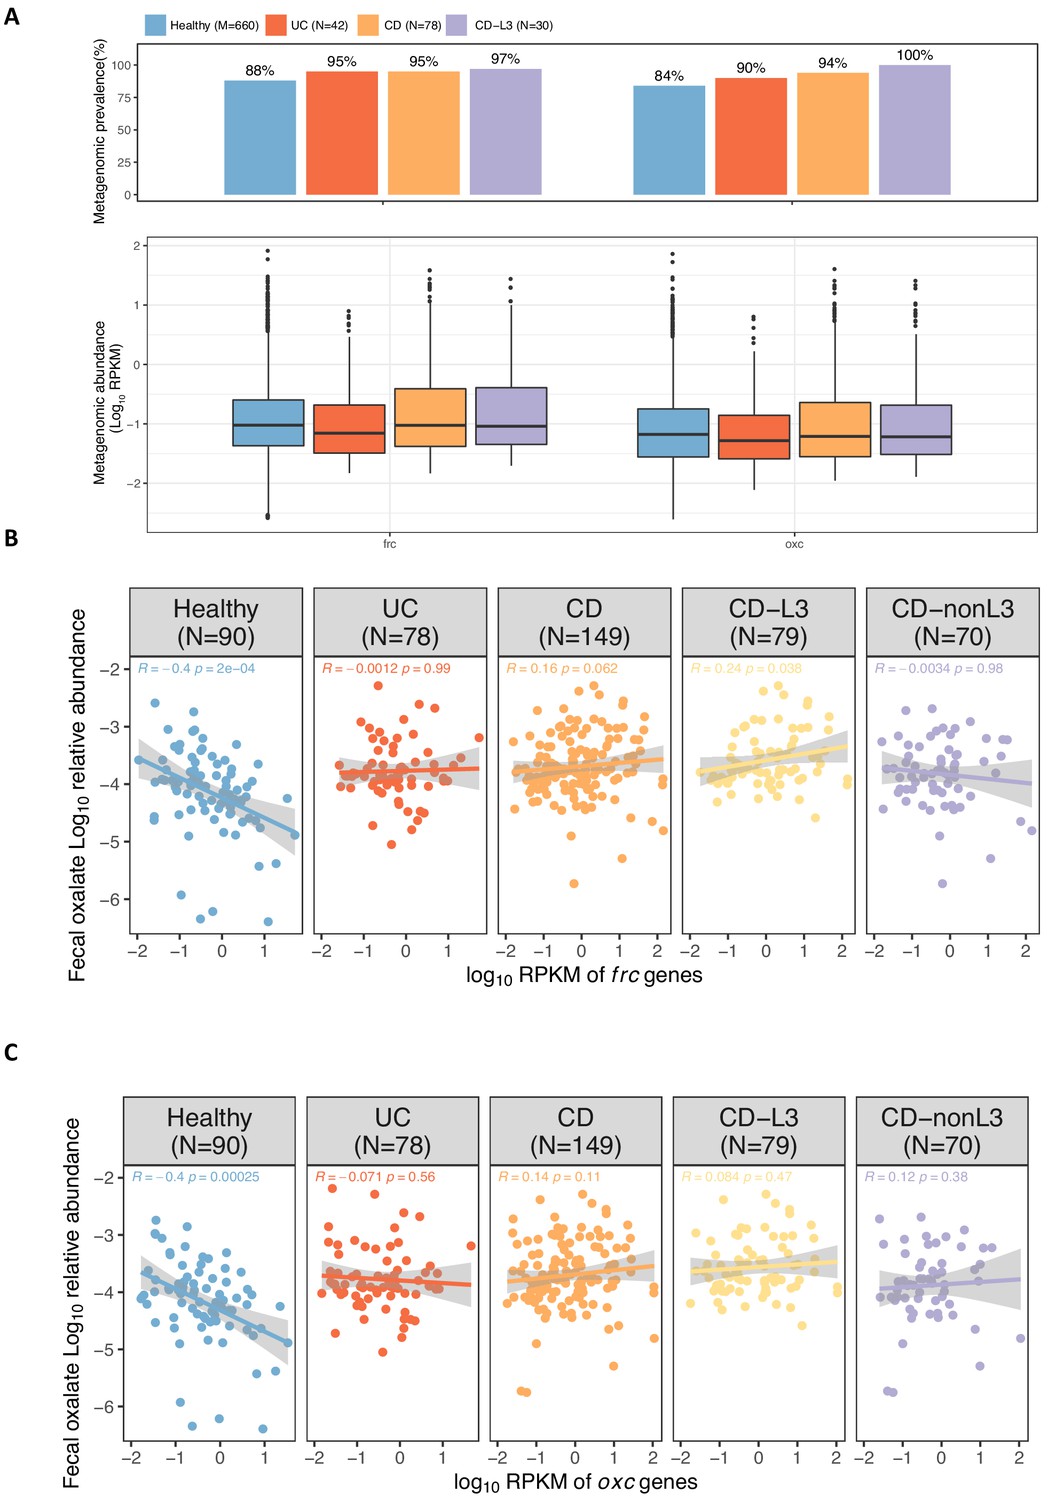
Abundance of frc and oxc genes in the metagenome of IBD patients and healthy individuals.
(A) Metagenomic prevalence (top) and abundance (bottom) of frc and oxc in healthy, UC, CD, and CD-L3 subjects. (B, C) Spearman correlation of fecal oxalate log10 relative abundance and total metagenomic frc (B) and oxc (C) abundance.
Figure 5
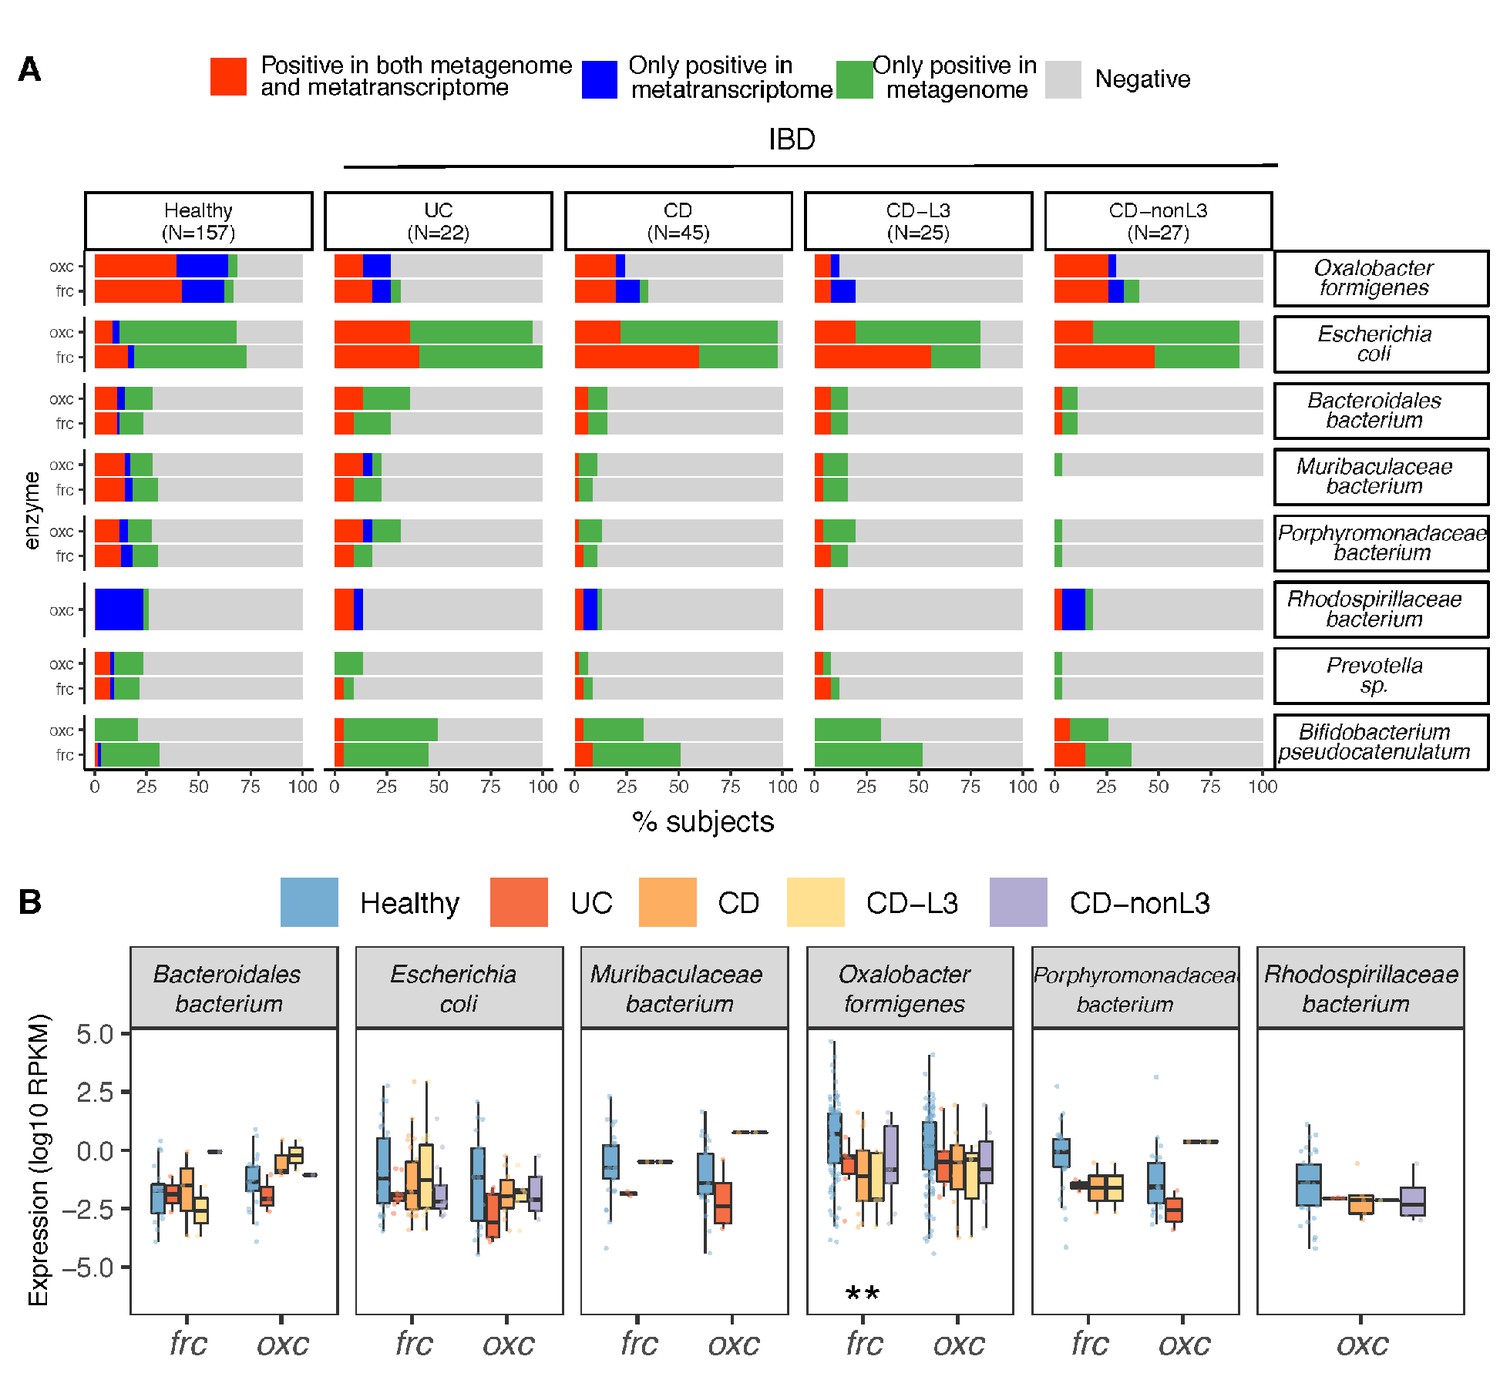
Differential ODP expression by human gut microbes in healthy and disease states.
(A) Detection of microbial OXC and FRC in the subject-matched metagenome and metatranscriptome from healthy subjects, UC, CD, or CD-L3 patients. For each species shown, the subjects are divided into one of four categories based on the co-detection of ODE in the matched metagenome and metatranscriptome. (B) Expression of microbial FRC and OXC in the metatranscriptomes of healthy subjects, UC, CD, or CD-L3 patients. Boxplot reflects the subjects, in whose metatranscriptome the corresponding enzyme is detected. *p<0.01, **<0.0001 by multiple-adjusted Mann–Whitney tests.
-
Figure 5—source data 1
Species contribution to FRC, and OXC in IBD individuals.xlsx.
- https://cdn.elifesciences.org/articles/63642/elife-63642-fig5-data1-v2.xlsx
Figure 6 with 2 supplements
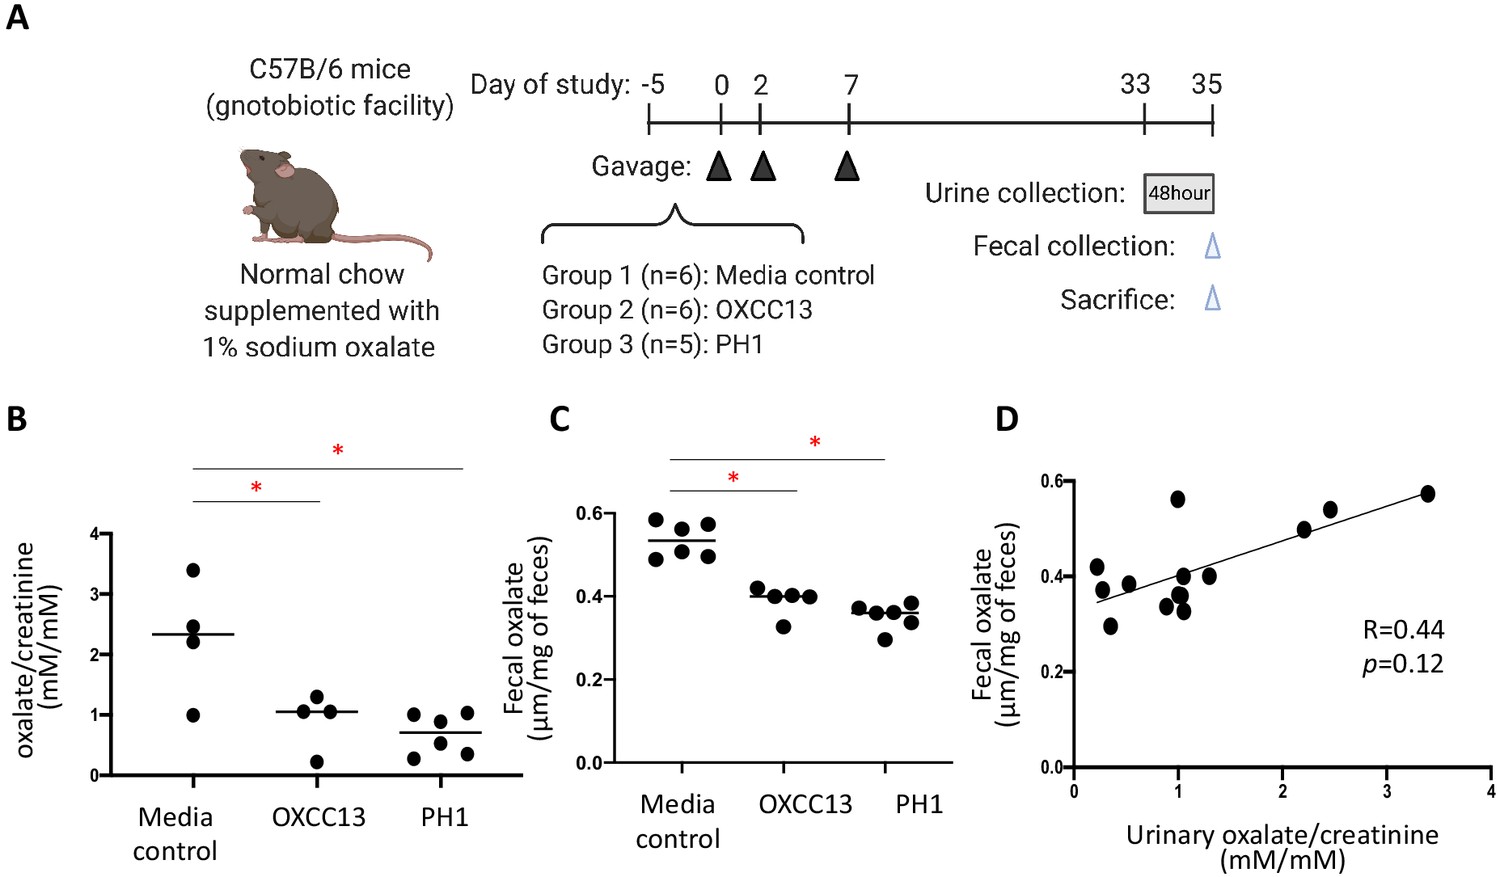
Effect of O. formigenes colonization on fecal and urinary oxalate.
(A) Study design of the mouse experiment. C57Bl/6 mice from our gnotobiotic facility were assigned to three groups. At days 0, 2, and 7, mice were gavaged (blue arrowheads) with O. formigenes strain OXCC13 (n = 5), O. formigenes freshly isolated from a primary hyperoxaluria type 1 (PH1) subject (n = 6), or O. formigenes culture medium alone (Media). Mice were fed with normal chow supplemented with 1% sodium oxalate and 0.5% calcium from day −5 until sacrifice. Urine was obtained from a 48 hr collection (one to two mice per pool) prior to sacrifice, and feces were collected at sacrifice (blue arrowhead). (B, C) Urinary and fecal oxalate in three mouse groups. Urinary oxalate normalized by creatinine in the 48 hr urine samples and fecal oxalate levels per gram of stool samples in the three experimental groups. *p<0.05, by Tukey’s multiple comparisons test. (D) Relationship between fecal and urinary oxalate. Correlation coefficient was computed using Spearman’s r.
-
Figure 6—source data 1
Fecal and urinary oxalate in relation to O. formigenes colonization in mice.
- https://cdn.elifesciences.org/articles/63642/elife-63642-fig6-data1-v2.xlsx
Figure 6—figure supplement 1
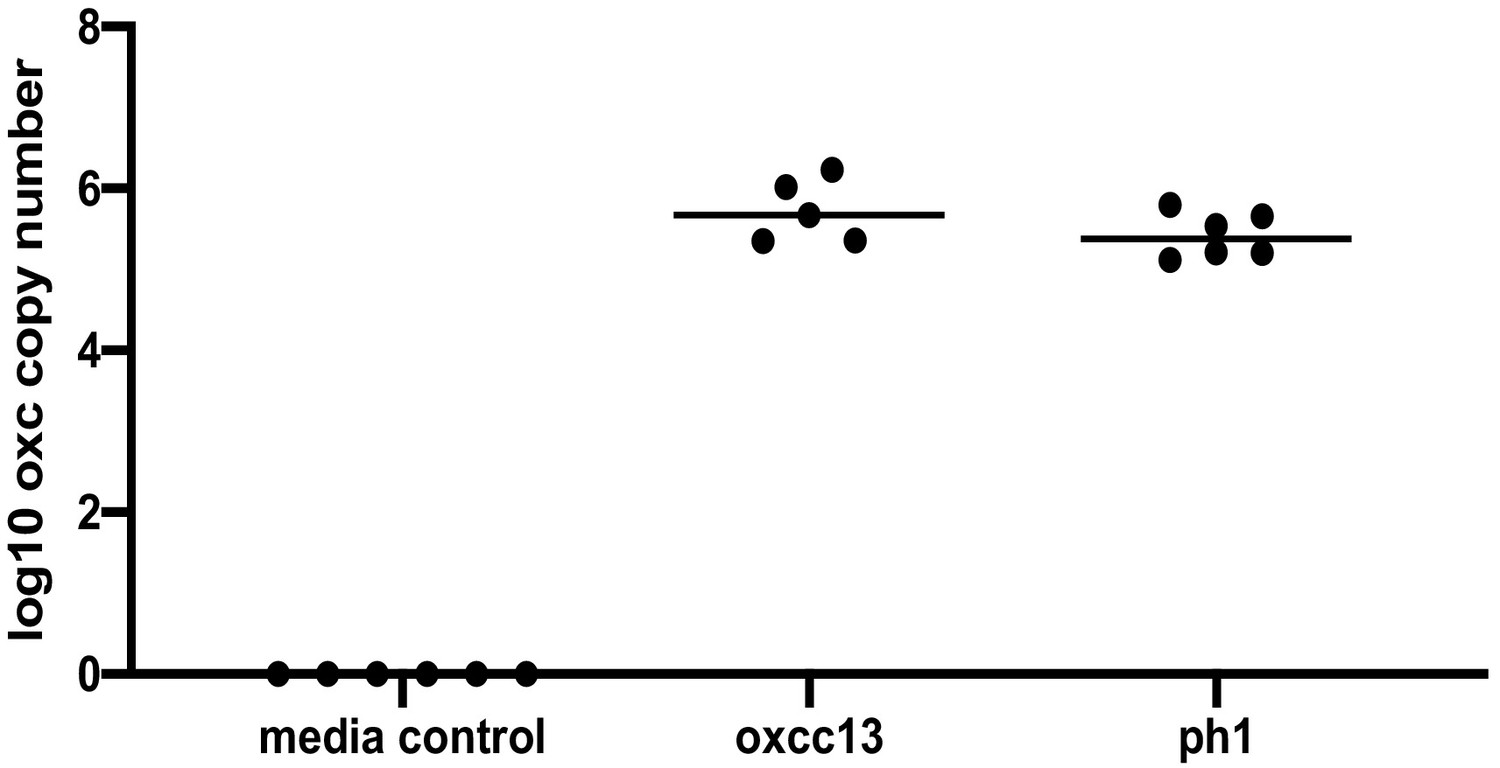
Detection of Oxalobacter formigenes by qPCR in the mouse fecal samples before sacrifice.
Figure 6—figure supplement 2
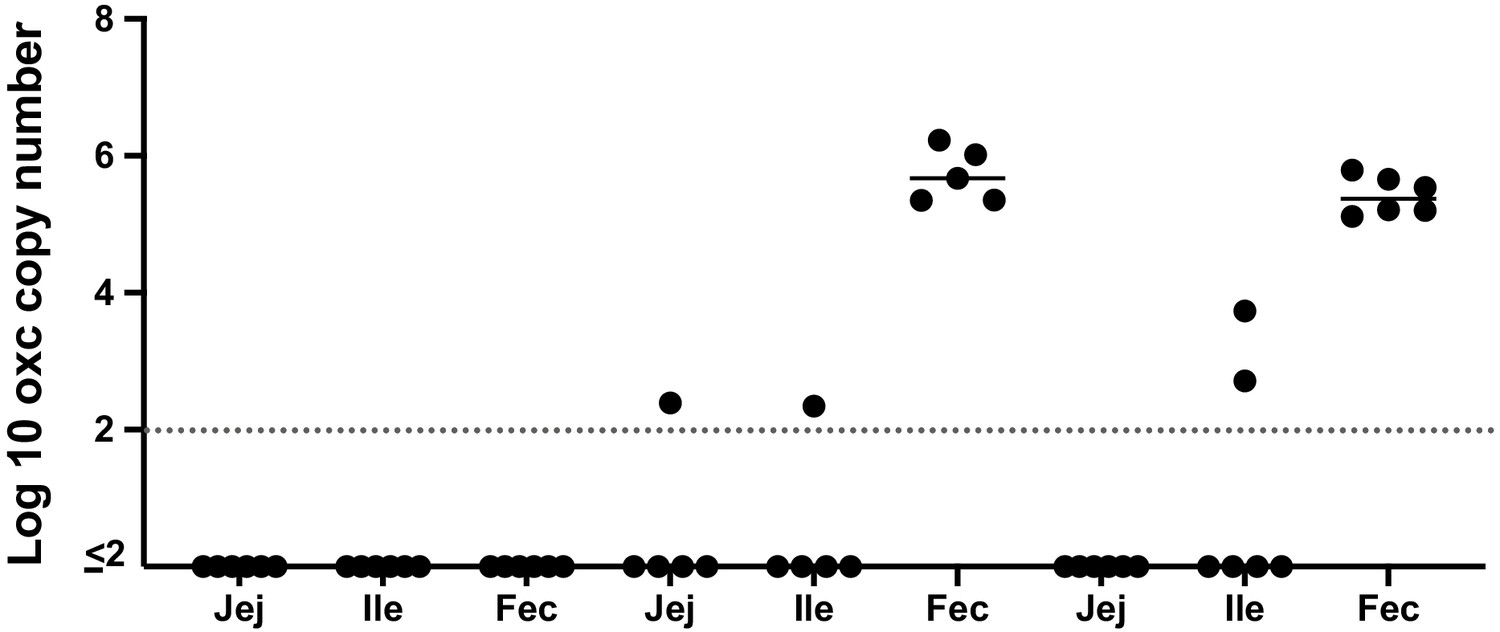
Detection of O. formigenes by qPCR in the intestinal contents (Jej: jejenum, Ile: ileum) and mouse fecal (Fec) samples at sacrifice.
The dashed line represents the lower limit of detection.
Author response image 1
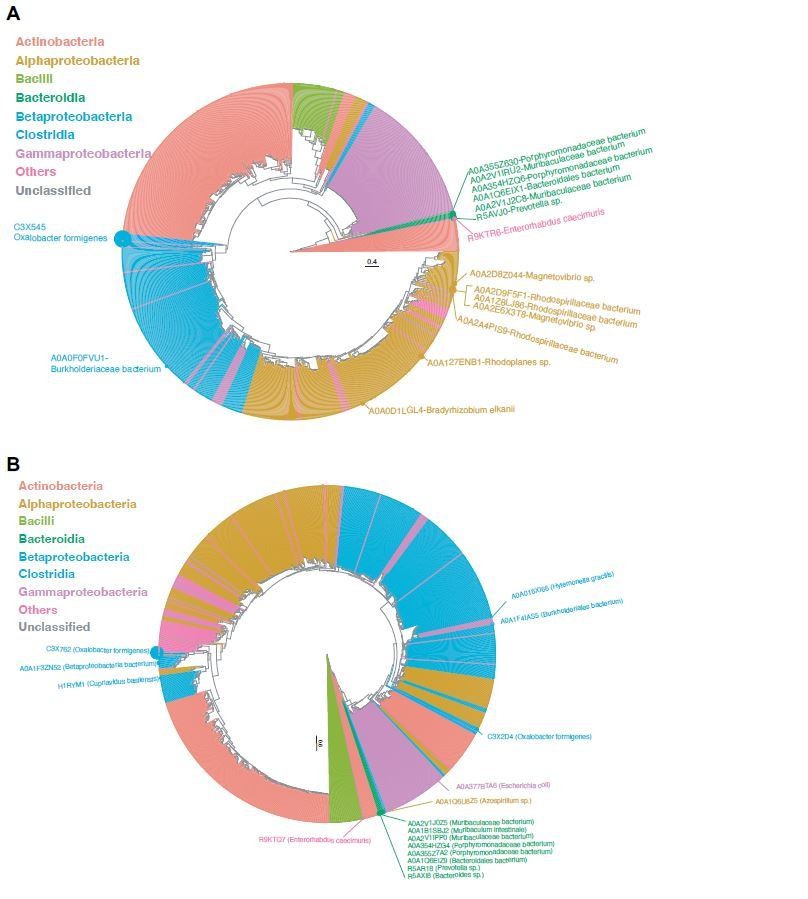
Phylogenetic analysis of OXC (A), FRC (B) uniref100 proteins.
Each tip represents a protein homolog, which is color-coded by the microbial Class associated with the encoding. The tip size is proportional to the prevalence of the corresponding protein in the metatranscriptomes of 165 healthy individuals. Homologs with prevalence >1% are annotatedwith text.
Author response image 2
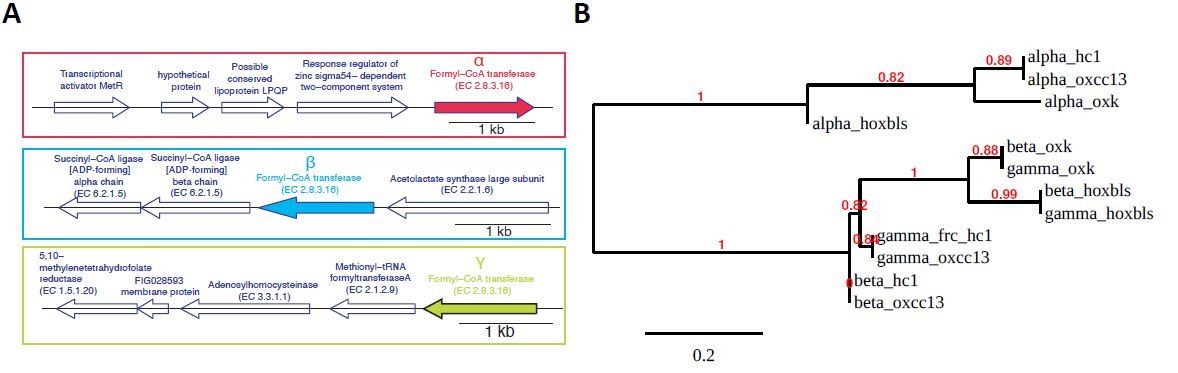
Operon structure and phylogenetic relationship of FRCs of four O.formigenes strains OXCC13, HC1, HOxBLS, and OXK, for which whole genome sequence is available.
(A). Schematic representation of the operon structures for the three FRC genes. The structures are conserved across all four strains. We named the three FRCs as α-, β-, and γ-FRC (from top to bottom). (B). Maximum likelihood phylogenetic tree for the α-, β-, and γ-FRCs from four O. formigenes strains, based on their amino acid sequence. The sequence alignment and tree were generated using phylogeny.fr using “simple click” mode.
Additional files
-
Supplementary file 1
Tables.
(a) Description of populations used in the present study. (b) Population-level contribution of species to metagenomic or metatranscriptomic OXC, in healthy, ulcerative colitis (UC), or Crohn’s disease (CD) patients. (c) Population-level contribution of species to metagenomic or metatranscriptomic FRC, in healthy, UC, or CD patients. (d) Taxonomic contributions to frc or oxc genes* inferred by BURRITO in 2359 metagenomic samples (see Materials and methods for detailed description). (e) The dominant taxa detected by 16S rRNA sequencing in the baseline fecal samples (n = 17) from the mouse study in Figure 6.
- https://cdn.elifesciences.org/articles/63642/elife-63642-supp1-v2.docx
-
Supplementary file 2
Proteins associated with each protein cluster based on ShortBRED.
- https://cdn.elifesciences.org/articles/63642/elife-63642-supp2-v2.xlsx
-
Supplementary file 3
Marker pepetide picked for each protein cluster based on ShortBRED.
- https://cdn.elifesciences.org/articles/63642/elife-63642-supp3-v2.zip
-
Transparent reporting form
- https://cdn.elifesciences.org/articles/63642/elife-63642-transrepform-v2.docx
Download links
A two-part list of links to download the article, or parts of the article, in various formats.
Downloads (link to download the article as PDF)
Open citations (links to open the citations from this article in various online reference manager services)
Cite this article (links to download the citations from this article in formats compatible with various reference manager tools)
Microbial genetic and transcriptional contributions to oxalate degradation by the gut microbiota in health and disease
eLife 10:e63642.
https://doi.org/10.7554/eLife.63642


