SARS-CoV-2 S protein:ACE2 interaction reveals novel allosteric targets
- Department of Biological Sciences, National University of Singapore, Singapore
- Bioinformatics Institute, Agency for Science, Technology, and Research (A*STAR), Singapore
- Centre for Life Sciences, Department of Biochemistry, National University of Singapore, Singapore
- Life Sciences Institute, Centre for Life Sciences, National University of Singapore, Singapore
- School of Biological Sciences, Nanyang Technological University, Singapore
- Current address: Department of Chemistry, Department of Biochemistry and Molecular Biology, Center for Infectious Disease Dynamics -Huck Institute of the Life Sciences, The Pennsylvania State University, United States
Figures
Figure 1
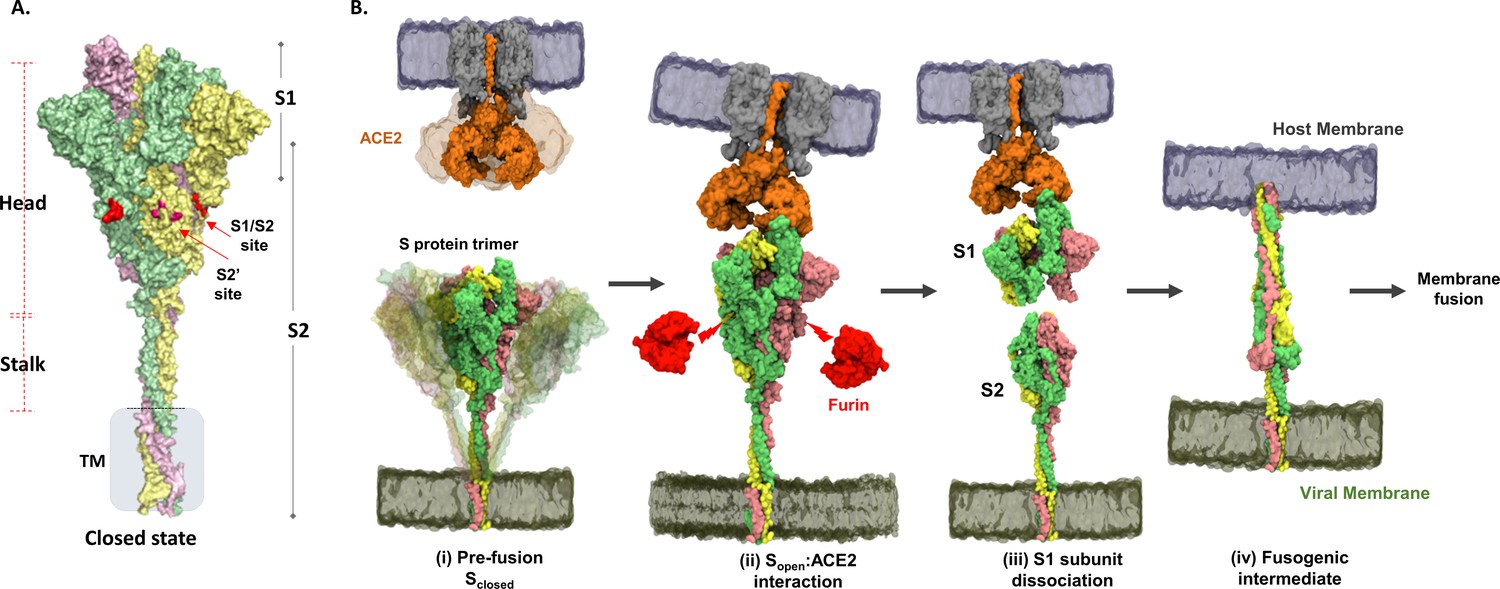
Structure and domain organization of trimeric spike (S) protein showing steps in the virus–host entry initiated by S recognition and binding to angiotensin-converting enzyme 2 (ACE2) receptor.
(A) Prefusion S protein trimer in closed conformational state, with monomers shown in yellow, green, and pink. S protein construct (1–1245) used in this study showing head, stalk, and transmembrane (TM) segments as generated by integrative modeling. The S1/S2 and S2′ cleavage sites are in red. Proteolytic processing (furin) of S protein generates S1 and S2 subunits. (B) Schematic of viral entry into host cell mediated by S:ACE2 interactions as previously outlined (Shang et al., 2020): (i) Intrinsic dynamics of prefusion S protein trimer decorating SARS-CoV-2 and host ACE2 dimeric structure showing sweeping motions of S protein and ACE2 to facilitate S:ACE2 recognition. (ii) In the open conformation (Sopen), receptor binding domain adopts an ‘up’ orientation to recognize and bind the host membrane-bound ACE2 receptor (Protein Data Bank [PDB] ID: 1R42). ACE2 binding induces conformational changes promoting Furin* (red) proteolysis at the S1/S2 cleavage site (red arrows), leading to dissociation of S1 and S2 subunits, the mechanism of which is unknown. *Furin here also denotes relevant related proteases. (iii) The residual ACE2-bound S1 subunit becomes stably bound to ACE2 and S2 subunits dissociate. (iv) Conformational changes in the separated S2 subunit promote formation of an extended helical fusogenic intermediate (PDB ID: 6M3W) (Fan et al., 2020) for fusion into the host cell membrane, membrane fusion, and viral entry into the host cell (Hoffmann et al., 2020).
Figure 2 with 5 supplements
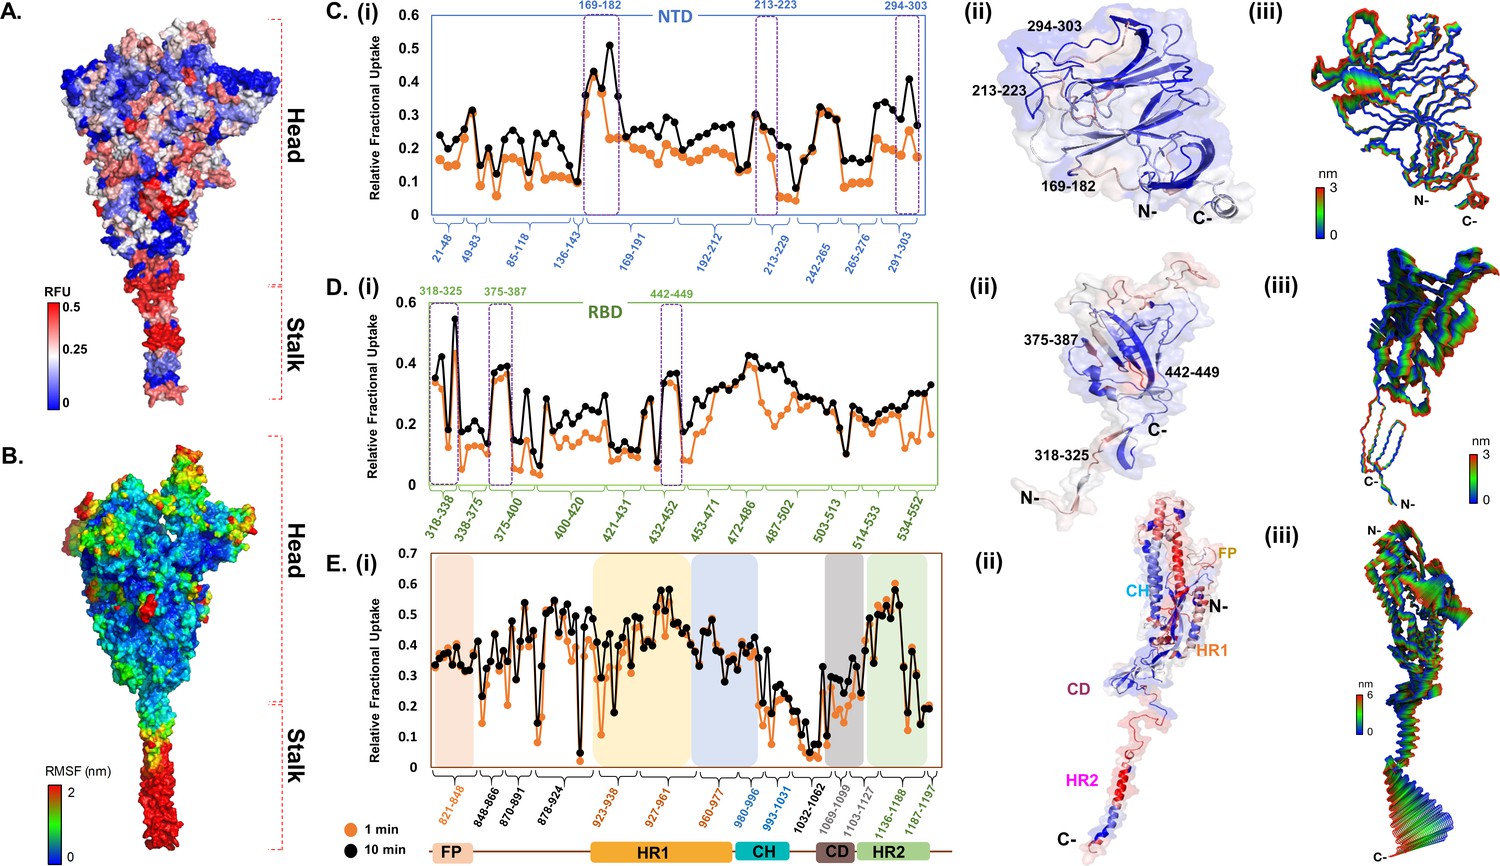
Deuterium exchange heat map and molecular dynamics simulations reveal domain-specific conformational dynamics of prefusion spike (S) protein trimer.
(A) Deuterium exchange at t = 1 min deuterium exchange mapped onto the structure of S protein (shades of blue [low exchange] and red [high exchange]). (B) Per-residue root mean square fluctuation (RMSF) of the S protein mapped onto the surface of the S trimer. Deuterium exchange-based dynamics across N-terminal domain (NTD) (C), receptor binding domain (RBD) (D), and the S2 subunit (E). (i) Relative fractional deuterium uptake (RFU) plots of NTD, RBD, and the S2 subunit at 1 min (orange) and 10 min (black) deuterium exchange times, with pepsin digest fragments displayed from N to C-terminus (X-axis). Peptides are grouped into clusters indicated by brackets (X-axis) for ease of display. Individual peptides within each cluster are identifiable from the Supplementary Excel file, which lists clusters and each peptide within each cluster (Supplementary file 1: Table S1). (Also see Figure 2—figure supplement 2). (ii) Deuterium exchange maps on close-up of the structures of NTD (21–303), RBD (318–552), and the S2 subunit (821–1197). Peptides spanning NTD–RBD interaction sites (166–182, 213–223, 294–303, 318–325, 375–387, and 442–449) showing relatively high deuterium exchange at t = 1 min are highlighted. (iii) The first principal motion and RMSF values of backbone atoms on the NTD, RBD, and the S2 subunit. Residues with high RMSF are labeled. Different domains (fusion peptide [FP], heptad repeat 1 [HR1], central helix [CH], connector domain [CD], heptad repeat 1 [HR2]) showing domain-specific RFU changes are labeled. RFU values are tabulated in Figure 2—source data 1.
-
Figure 2—source data 1
Relative fractional deuterium uptake values for spike (S) protein peptides at indicated labeling times.
- https://cdn.elifesciences.org/articles/63646/elife-63646-fig2-data1-v2.xlsx
Figure 2—figure supplement 1
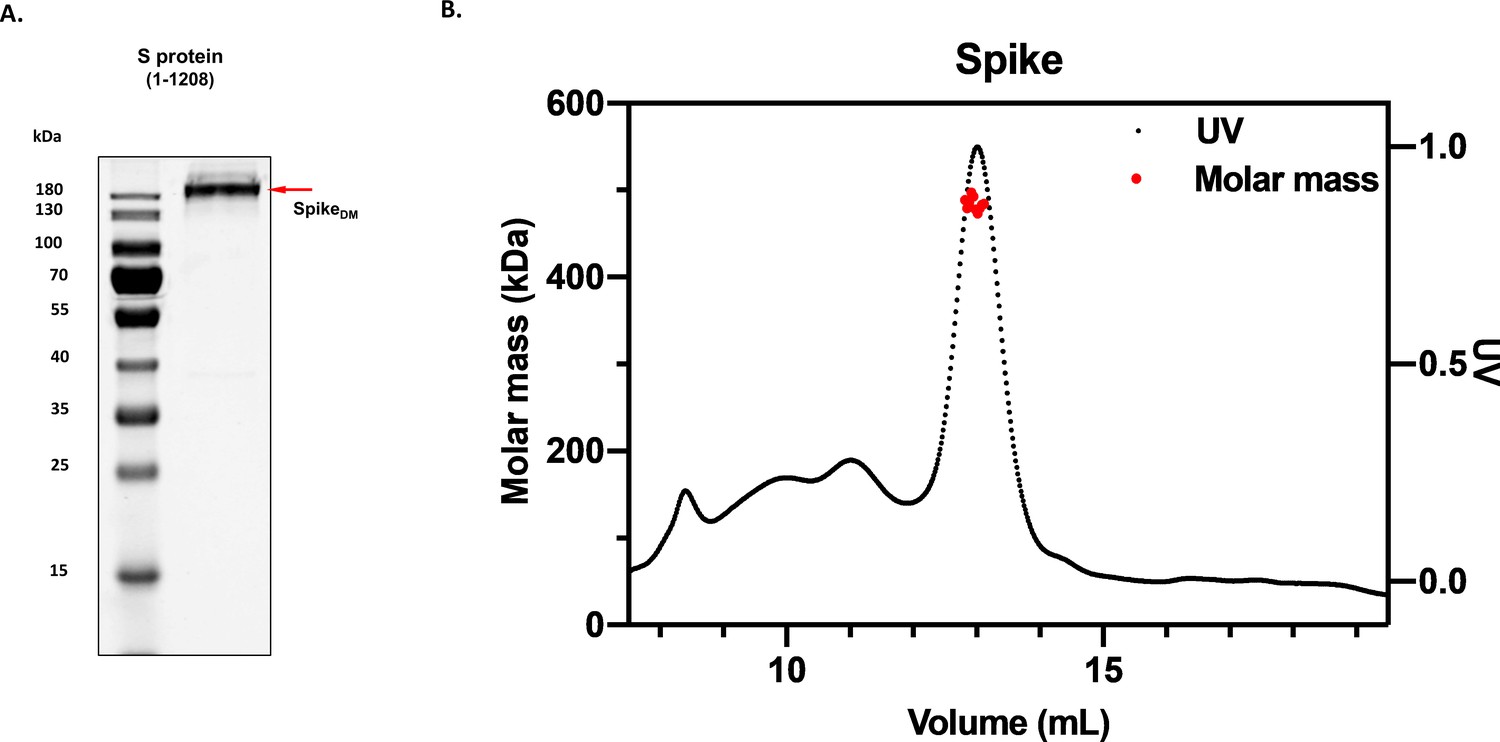
Homogeneity of spike (S) protein.
(A) Images of denaturing polyacrylamide gel electrophoresis of purified S protein (1–1208) is shown along with its molecular size highlighted with red arrow, alongside protein standards. (B) Molecular weight analysis of purified S (1–1208) by size exclusion chromatography – multiple angle light scattering with measured molecular weight of 484.2 (kDa) (±4.9%).
Figure 2—figure supplement 2
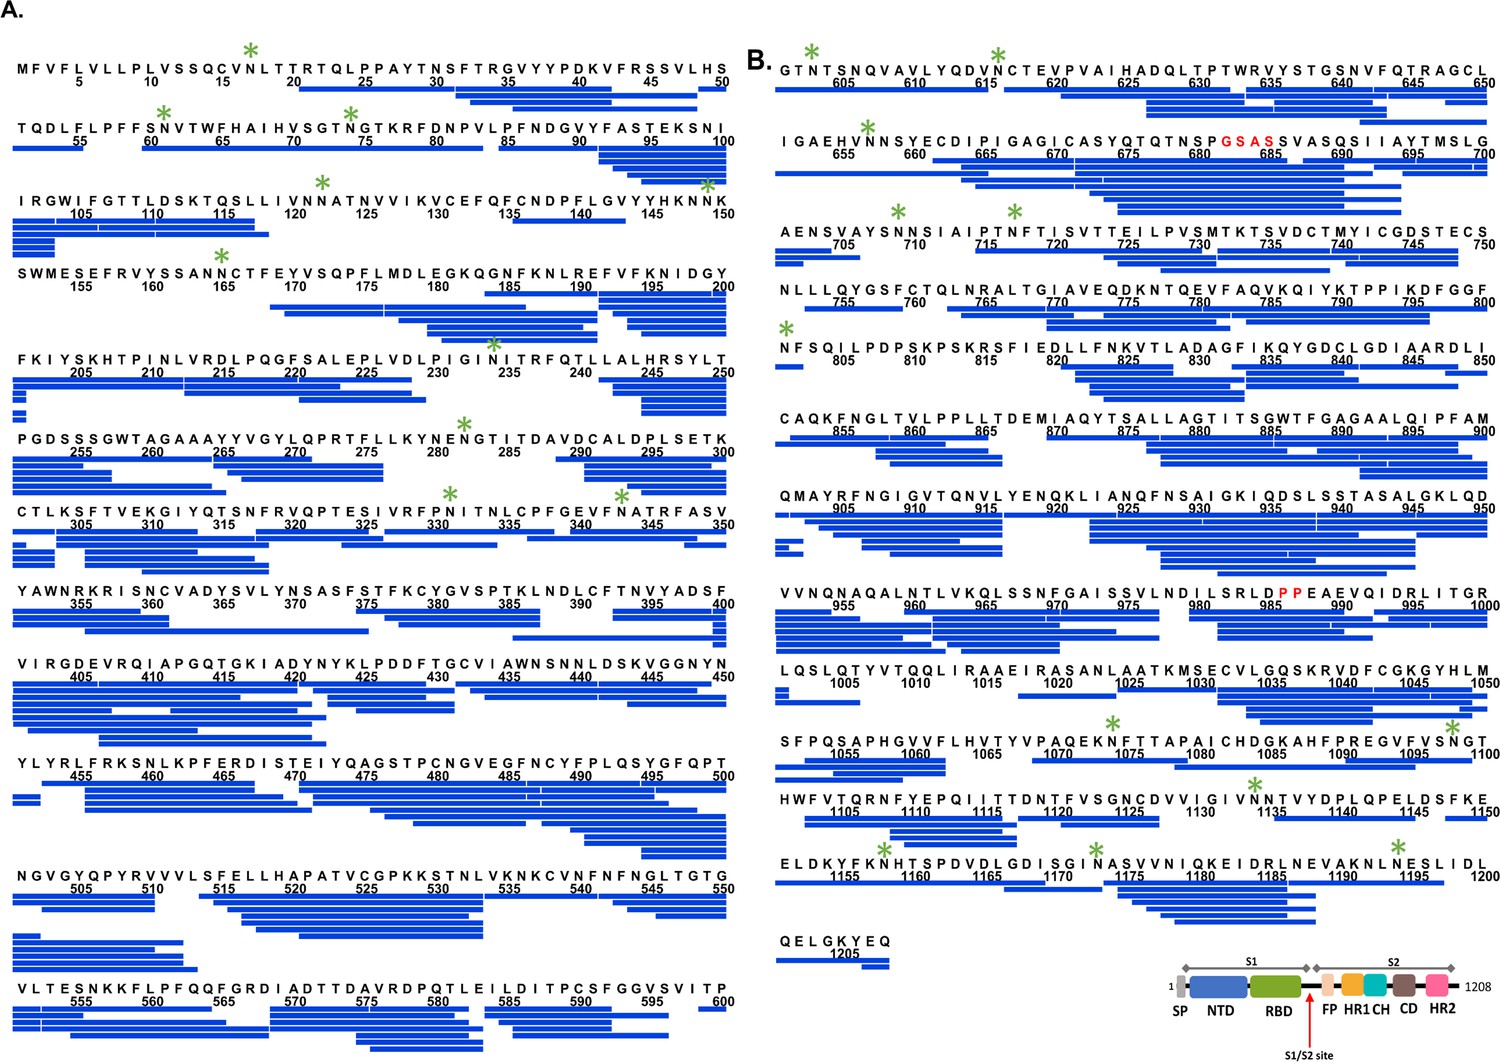
Primary sequence coverage map of pepsin proteolyzed peptides of spike S (1–1208).
Coverage map showing 317 peptides spanning 87% of the S protein: (A) 1–600 and (B) 601–1208, with the mutations highlighted in red. Glycosylation sites are indicated by asterisks, and peptide coverage for C-terminal twin strep tag is not shown. The domain organization for S protein construct 1–1208 is shown.
Figure 2—figure supplement 3

Hydrogen/deuterium exchange mass spectrometry for free spike (S) protein.
Relative fractional deuterium uptake (RFU, Y-axis) of each pepsin proteolyzed peptide listed from N- to C-terminus (X-axis) spanning S1 subunit (A) and S2 subunit (B) at labeling times 1 min (orange) and 10 min (black) are shown in a modified mirror plot of RFU versus pepsin fragment peptide. Peptides are grouped into clusters for ease of display. Peptides in each cluster are listed in Supplementary file 1: Table S1. Red line indicates the average RFU values of all peptides constituting S1 and S2 subunits. Purple box in dashed lines highlights peptides spanning the S1/S2 cleavage site. RFU values at 1 min deuterium labeling mapped onto the structures of the S1 (C) and S2 (D) subunits. High (red) and low (blue) exchanging regions are as per key. Relative fractional uptake is the ratio of number of deuterons exchanged to the total number of exchangeable amides in a peptide. RFU values are tabulated in Figure 2—source data 1. FP: fusion peptide; HR1: heptad repeat 1; CH: central helix; CD: connector domain; HR2: heptad repeat 2.
Figure 2—figure supplement 4
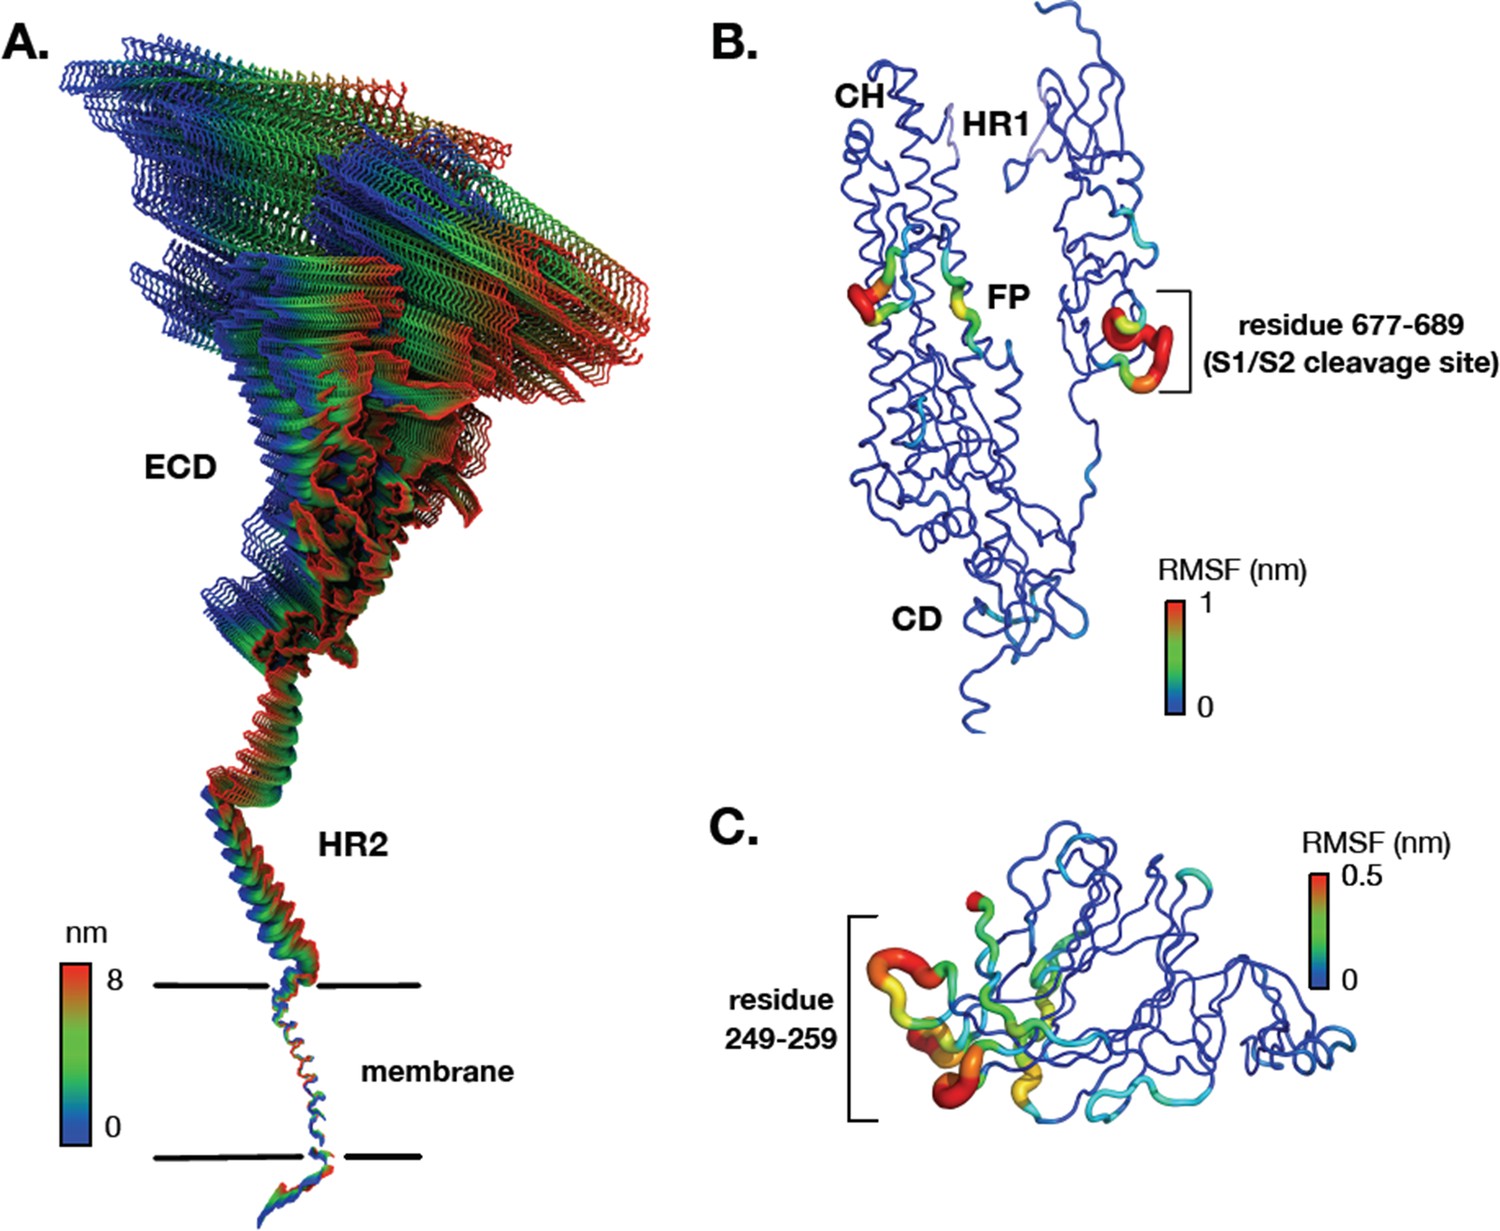
Dynamics of the spike (S) protein trimer from all-atom molecular dynamics (MD) simulation.
(A) The first principal motion of all backbone atoms for full-length S protein during all-atom MD simulations as determined by principal component analysis. (B, C) Root mean square fluctuation (RMSF) values of backbone atoms on the S2 subunit and N-terminal domain. Residues with high RMSF are labeled. ECD: ectodomain; HR1: heptad repeat 1; HR2: heptad repeat 2; FP: fusion peptide; CD: connector domain; CH: central helix.
Figure 2—figure supplement 5
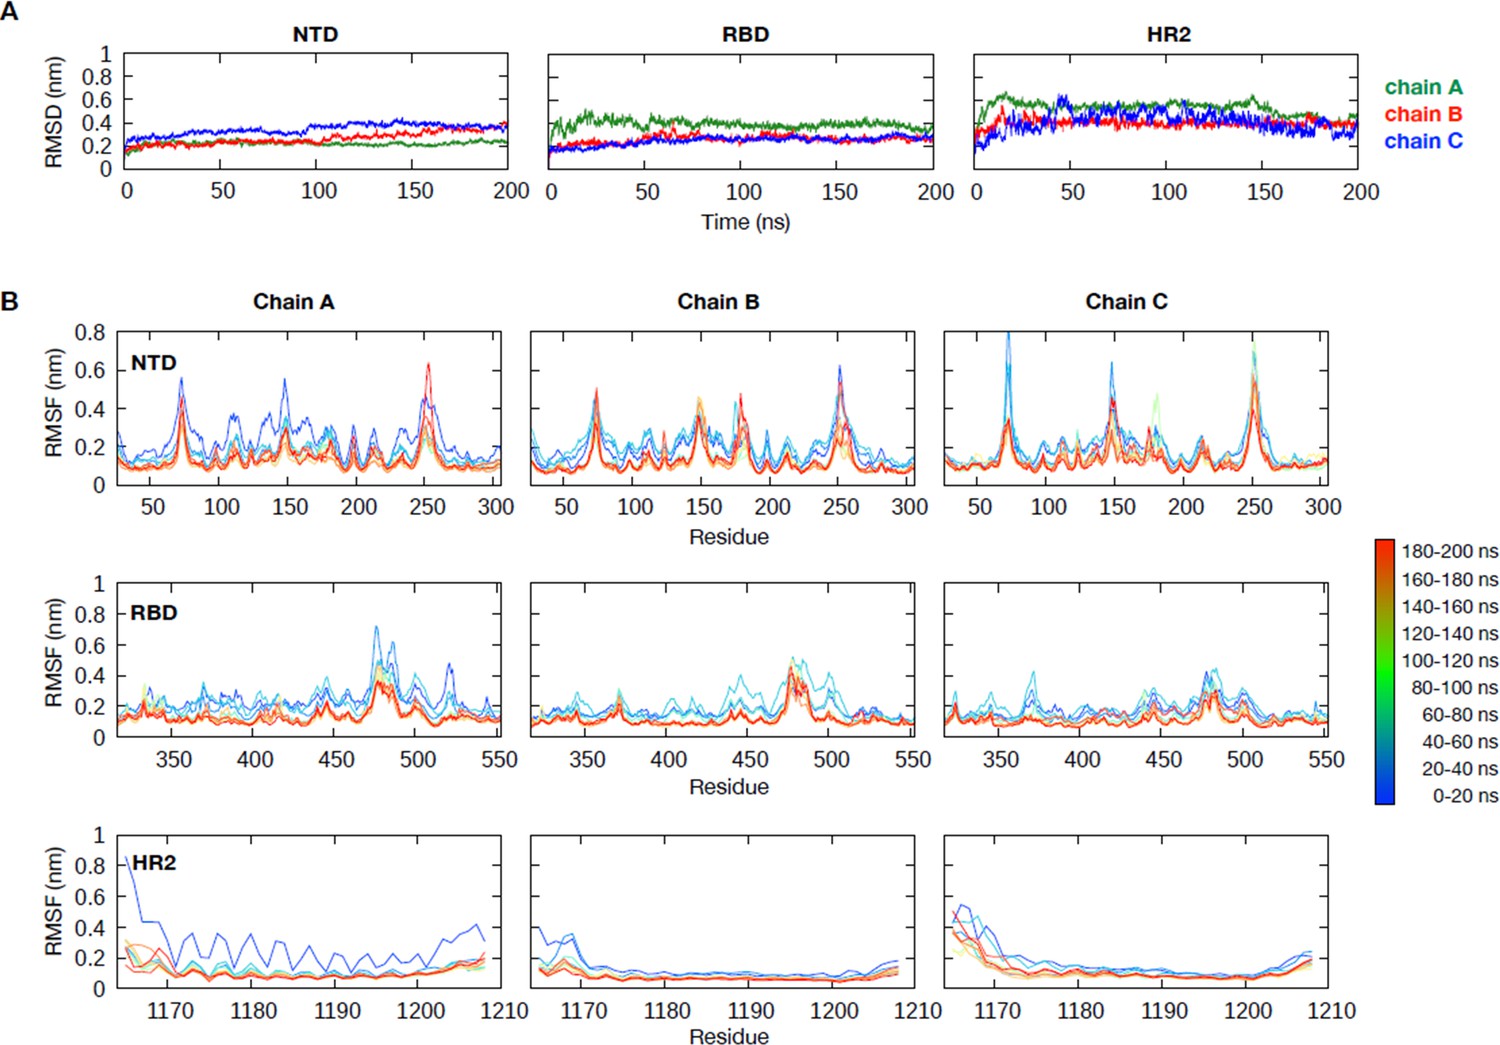
Structural stability of full-length spike (S) protein model from all-atom simulations.
(A) Root mean square deviation of the C⍺ atoms of the N-terminal domain (residues 27–305), receptor binding domain (RBD) (residues 317–553), and heptad repeat 2 domain (residues 1165–1208) for all three chains of the S protein throughout the 200 ns simulation. (B) Root mean square fluctuation (RMSF) of these three domains calculated for every 20 ns window throughout the simulations. ACE2: angiotensin-converting enzyme 2.
Figure 3 with 2 supplements
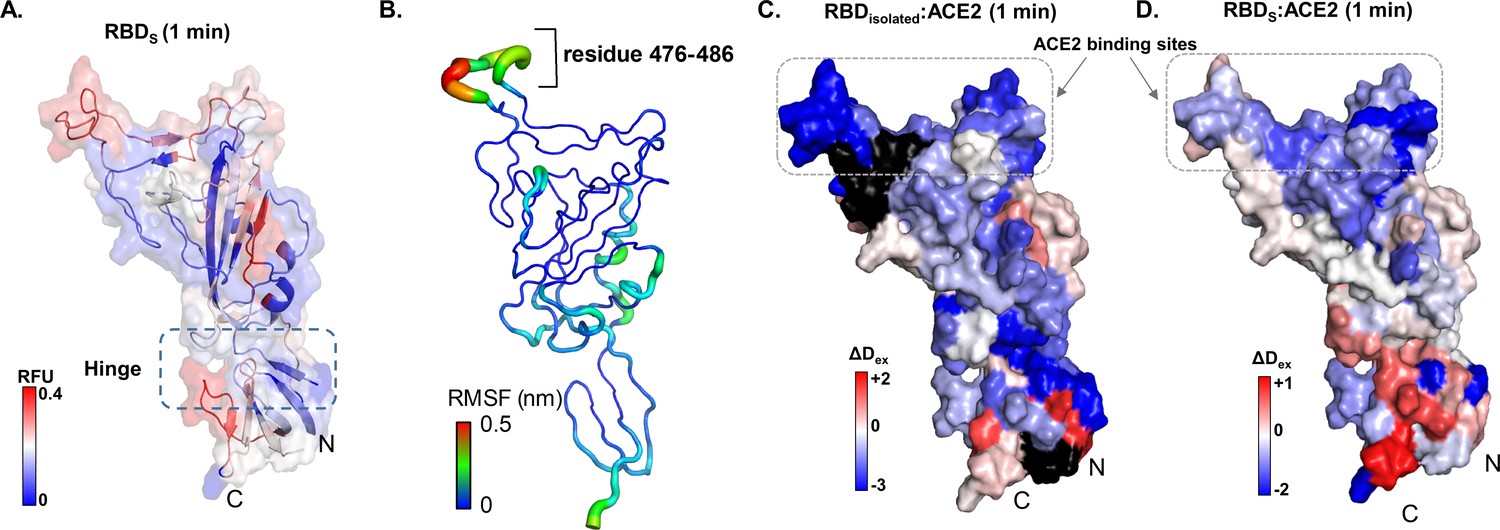
Map of receptor binding domain (RBD)isolated:angiotensin-converting enzyme 2 (ACE2) interactions.
(A) Relative fractional deuterium uptake values at t = 1 min for RBD (314–547) of spike (S) protein (RBDS) mapped onto the structure of RBD extracted from S protein model (see Supplementary file 1: Table S2). High and low exchanging regions are represented as shown in key, and regions with no coverage are shown in black. (B) The root mean square fluctuation (RMSF) values of backbone atoms on the RBD showing residues with high RMSF (476–486) as per key. Differences in deuterium exchanged between RBDisolated:ACE2 complex and free RBDisolated (C) and RBDS:ACE with free RBDS (D) at 1 min of deuterium labeling are mapped onto the structure of RBD. Protection from deuterium uptake and increases in exchange are indicated in blue and red, respectively. Regions with no peptide coverage are in black. RFU: relative fractional deuterium uptake.
Figure 3—figure supplement 1
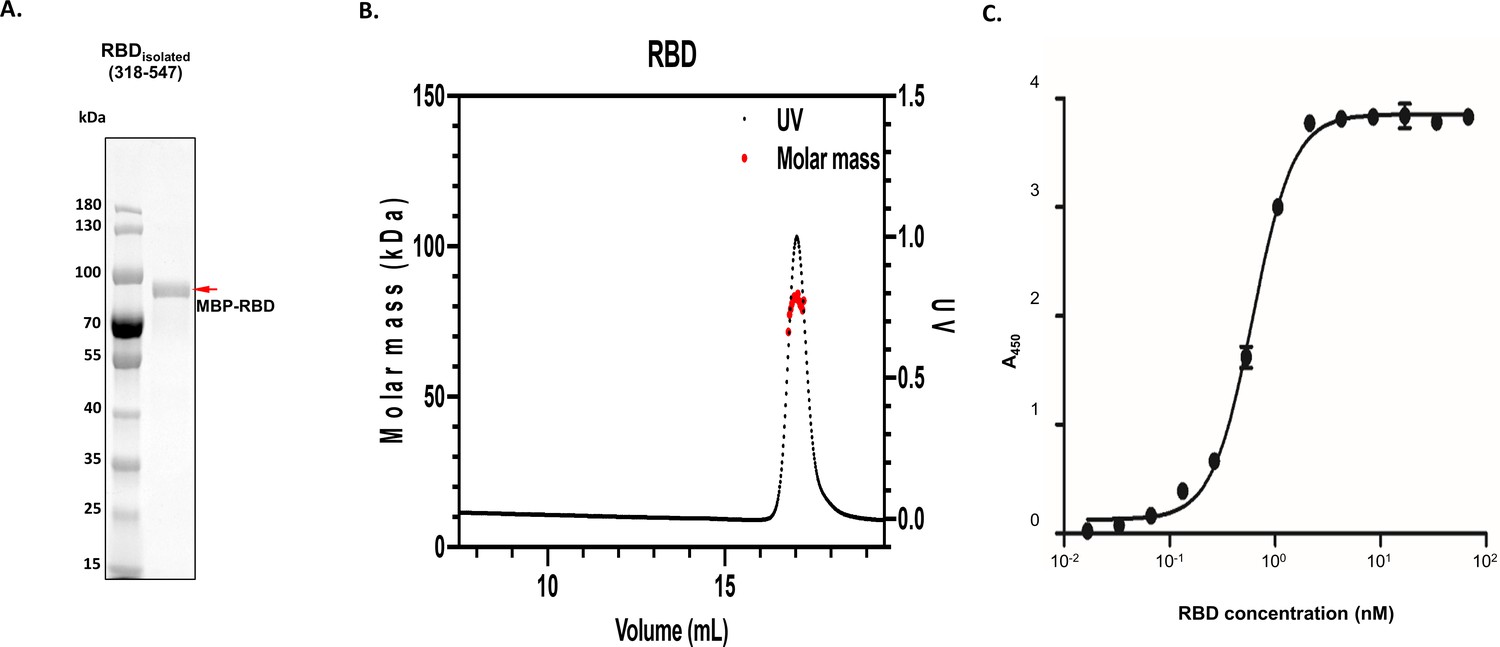
Homogeneity of receptor binding domain (RBD) isolated sample and validation of angiotensin-converting enzyme 2 (ACE2):RBD complex formation.
(A) Images of denaturing polyacrylamide gel electrophoresis of purified RBD isolated (maltose-binding protein [MBP]-tagged) are shown along with its molecular sizes highlighted with red arrow, alongside protein standards. (B) Molecular weight analysis of expressed MBP-tagged RBD by size exclusion chromatography – multiple angle light scattering. The measured molecular weight (kDa) is 81.2 (±4.8%) for RBD. (C) Interactions between ACE2 and RBD represented by the binding curves obtained from enzyme-linked immunosorbent assay experiments as described in 'Materials and methods'. Testing of RBD was performed by adding 100 µL of 10.4 nM ACE2 to a maxisorp plate coated with RBD at varying concentrations.
Figure 3—figure supplement 2
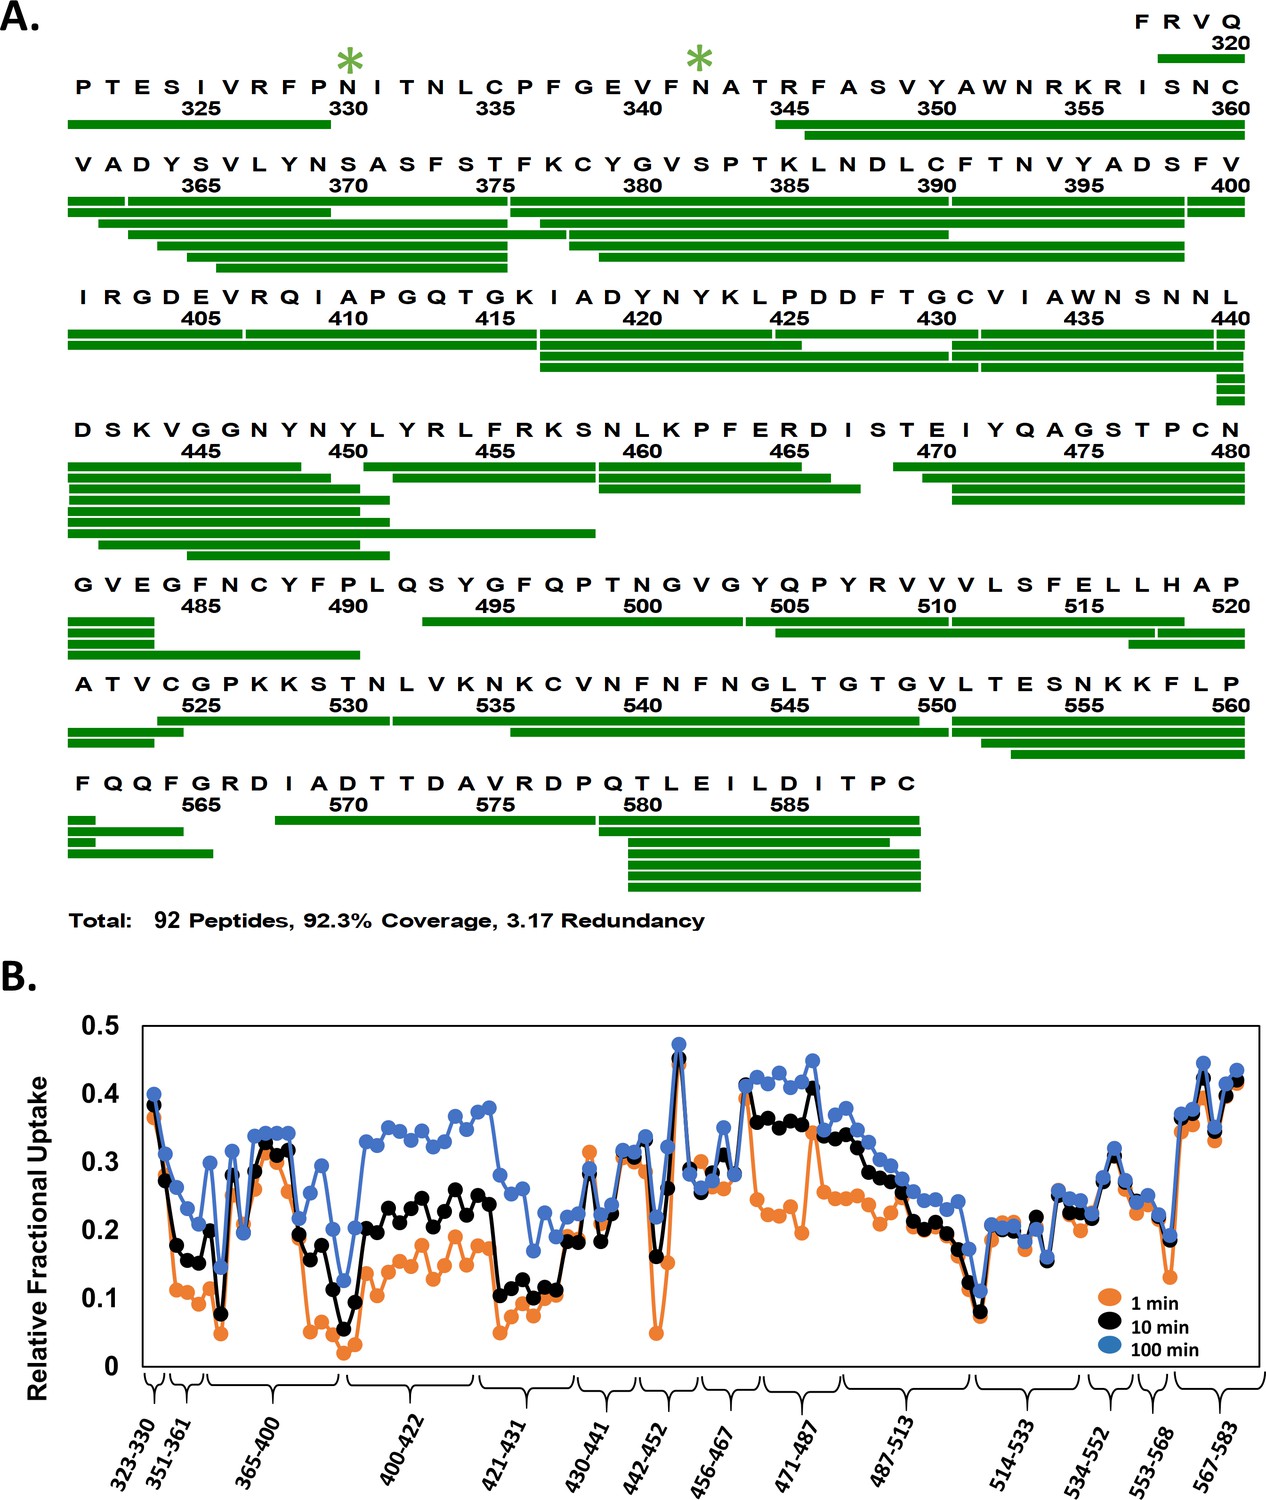
Primary sequence coverage and deuterium exchange profile of receptor binding domain (RBD)isolated.
(A) Coverage map showing 92 peptides (green bar) spanning ~92% sequence of maltose-binding protein (MBP)-RBDisolated (318–589) fusion protein. Peptides spanning the N-terminal MBP affinity tag are not shown. Glycosylation sites are indicated by green asterisks. (B) Relative fractional deuterium uptake (RFU) plot of pepsin proteolyzed peptides of RBDisolated listed N- to C-terminus for deuterium labeling times as per key. Peptides are grouped into clusters for ease of display. RFU values for peptide clusters are tabulated in Figure 3—figure supplement 2—source data 1.
-
Figure 3—figure supplement 2—source data 1
Relative fractional deuterium uptake values at different labeling times for pepsin digest fragments of receptor binding domain (RBD)isolated.
- https://cdn.elifesciences.org/articles/63646/elife-63646-fig3-figsupp2-data1-v2.xlsx
Figure 4
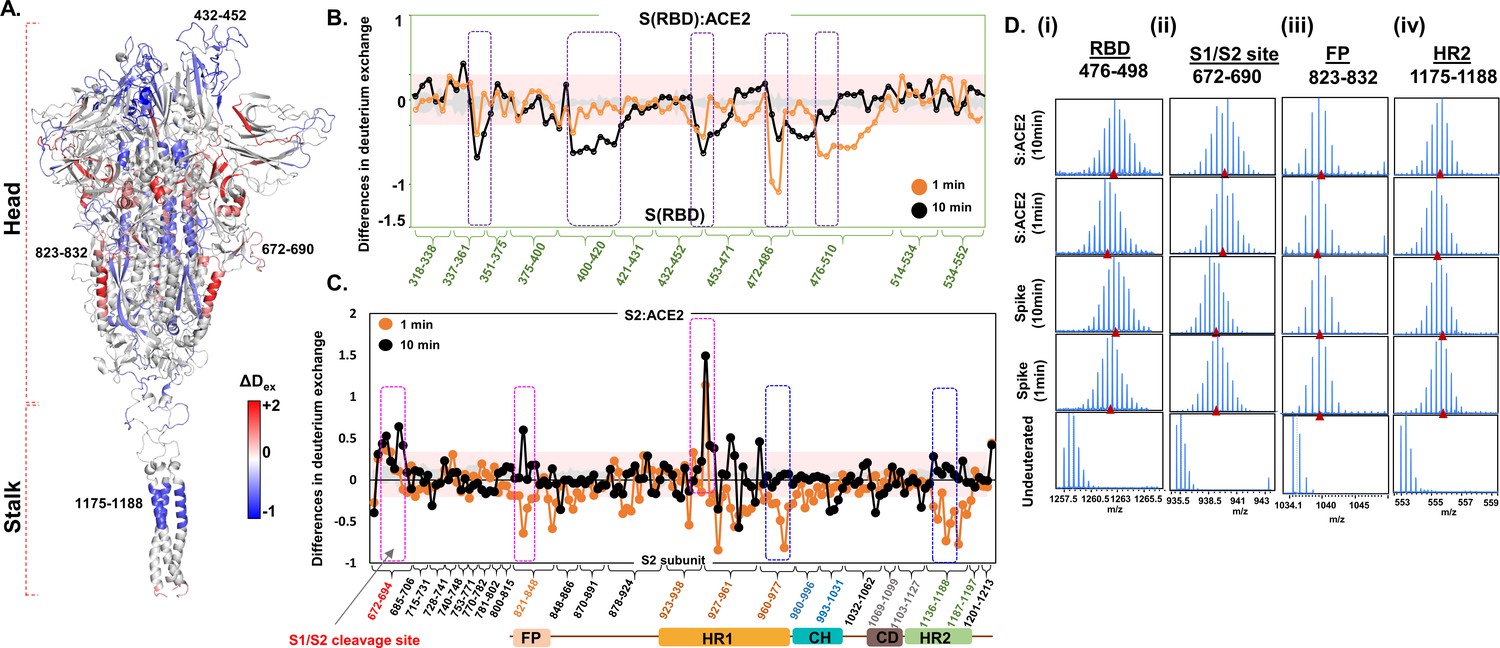
Angiotensin-converting enzyme 2 (ACE2) interaction induces large-scale allosteric changes across spike (S) protein.
(A) Differences in deuterium exchange (ΔDex) (t = 1 min) in S protein upon binding ACE2 showing decreased (blue) and increased (red) deuterium exchange, mapped onto the structure of S protein. Deuterium exchange differences (X-axis) for peptides from (B) receptor binding domain (RBD)S and S2 subunit (C). Peptides are grouped into clusters indicated by brackets (X-axis) for ease of display. Individual peptides within each cluster are identifiable from the source data (Figure 4—source data 1). Difference cutoff ±0.3 D (Houde et al., 2011) is the deuterium exchange significance threshold indicated by pink shaded box with standard error values in gray. Positive differences (>0.3 D) denote increased deuterium exchange, and negative differences (<−0.3 D) denote decreased deuterium exchange in S protein bound to ACE2. (B) Peptides spanning residues interacting with ACE2 are in purple. (C) Peptides spanning S1/S2 cleavage site, fusion peptide (FP) and heptad repeat 1 (HR1) are highlighted in pink boxes, while peptides spanning central helix and heptad repeat 2 (HR2) are in blue. (D) Stacked mass spectra with isotopic envelopes after deuterium exchange (t = 1, 10 min) for select peptides from (i) RBD (residues 476–498), (ii) S1/S2 cleavage site (residues 672–690), (iii) FP (residues 823–832), and (iv) HR2 (residues 1175–1188) are shown for the S protein and S:ACE2 complex. Mass spectra of the equivalent undeuterated peptide are shown for reference. The centroid masses are indicated by red arrowheads.
-
Figure 4—source data 1
Differences in deuterium exchange values between spike (S):angiotensin-converting enzyme 2 (ACE2) complex and free S protein at indicated labeling times.
- https://cdn.elifesciences.org/articles/63646/elife-63646-fig4-data1-v2.xlsx
Figure 5 with 3 supplements
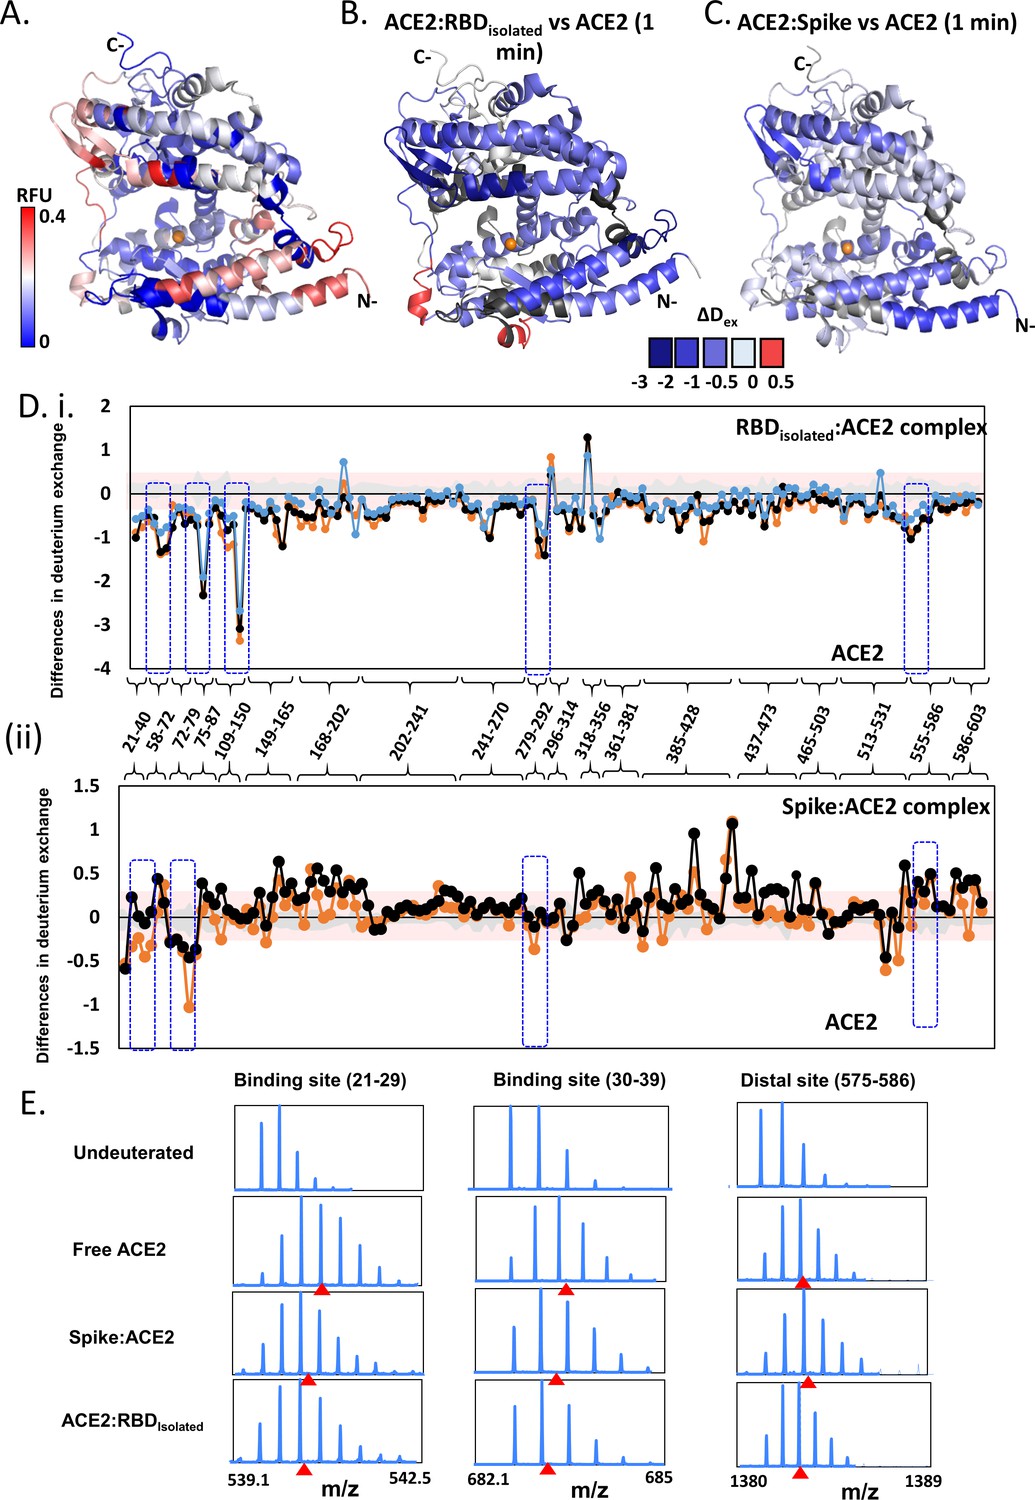
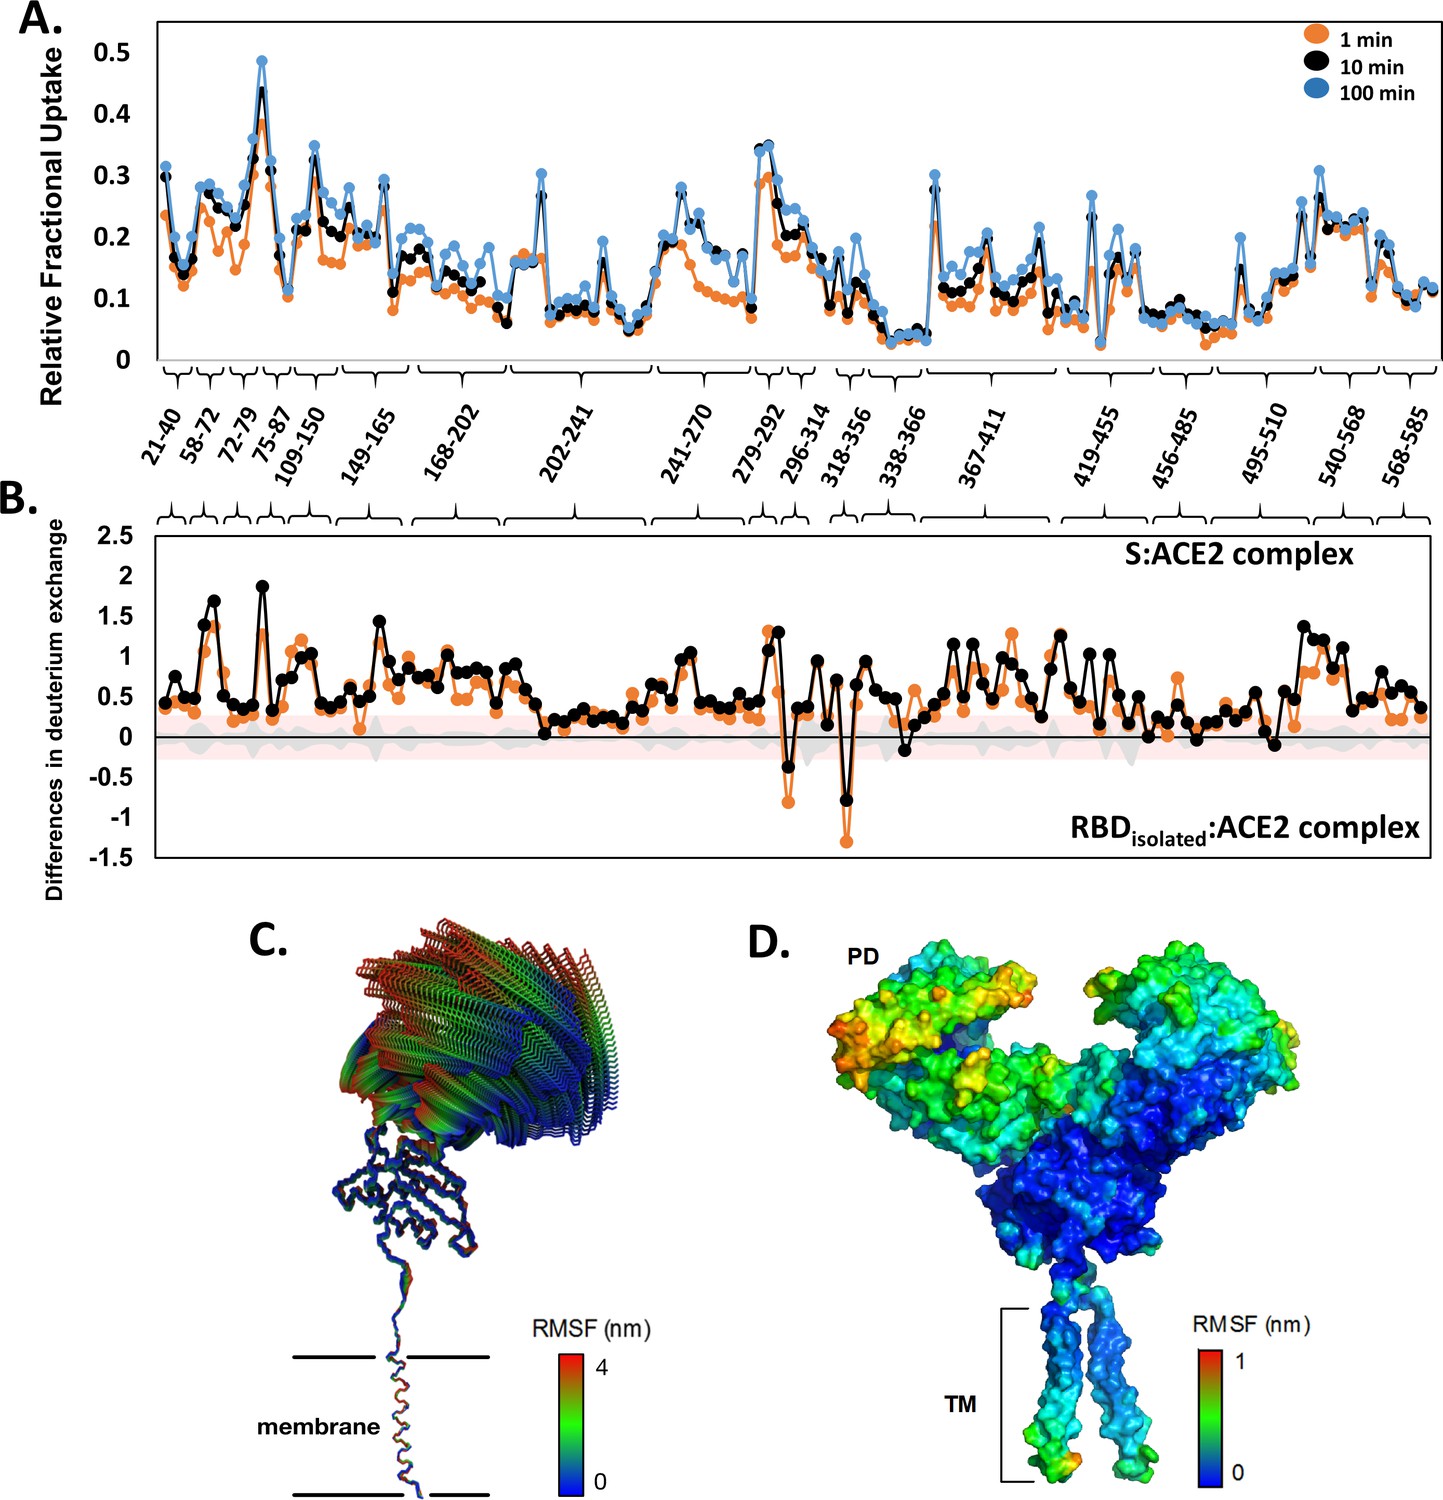
Effect of receptor binding domain (RBD)isolated and RBDS complexes on angiotensin-converting enzyme 2 (ACE2) dynamics.
(A) Structure of extracellular domain of ACE2 receptor (PDB ID: 1R42) depicting the relative fractional deuterium uptake (RFU) at t = 1 min. (B) Differences in deuterium exchange of RBDisolated:ACE2 complex and free ACE2 at t = 1 min mapped onto the structure of ACE2, predominantly showing decreased deuterium exchange in ACE2 (shades of blue). (C) Heat map of differences in deuterium exchange (t = 1 min) of S:ACE2 complex and free ACE2. (D) Plot showing differences in deuterium exchange between ACE2 and complexes with RBDisolated (i) and S (ii) at different labeling times. Peptides are grouped into clusters for ease of display and listed in source data (Figure 5—source data 1). Cutoff ± 0.3 D is the deuterium exchange significance threshold, indicated by pink shaded box, and standard errors are in gray. Positive differences denote increased deuterium exchange in (i) RBDisolated:ACE2 or (ii) S:ACE2 compared to free ACE2, while negative differences denote decreased deuterium exchange. Peptides spanning the sites of interaction with RBD and two distal sites (278–292, 574–585) are highlighted. (E) Stacked mass spectra showing isotopic distribution for select peptides spanning the binding sites (Ali and Vijayan, 2020; Chan et al., 2020; Wang et al., 2020a; Watanabe et al., 2020; Cai et al., 2020; Wang et al., 2020b; Li et al., 2005; Towler et al., 2004; Hamuro et al., 2008; Hoofnagle et al., 2003; Houde et al., 2011; Šali and Blundell, 1993; Hakansson-McReynolds et al., 2006; Dev et al., 2016; Eramian et al., 2006; Ramachandran et al., 1963; Petit et al., 2007; van Meer, 1998; Krijnse-Locker et al., 1994) and a distal allosteric site (575–586) for ACE2, S:ACE2, and RBDisolated:ACE2 are shown at 1 min deuterium labeling time. Centroids indicated by red arrowheads.
-
Figure 5—source data 1
Differences in deuterium exchange between receptor binding domain (RBD)isolated:angiotensin-converting enzyme 2 (ACE2) and spike (S):ACE2 complexes with free ACE2 at indicated labeling times.
- https://cdn.elifesciences.org/articles/63646/elife-63646-fig5-data1-v2.xlsx
Figure 5—figure supplement 1
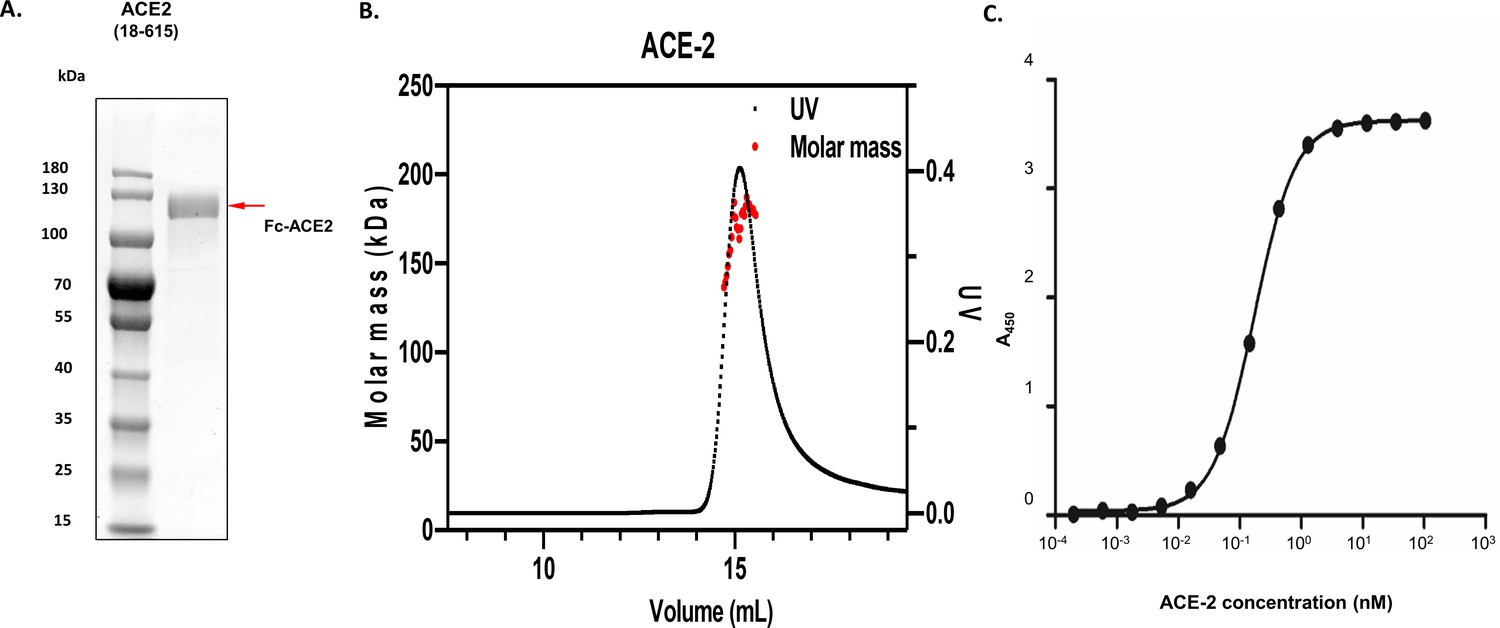
Homogeneity of angiotensin-converting enzyme 2 (ACE2) protein samples and validation of ACE2:receptor binding domain (RBD) complex formation.
(A) Images of denaturing polyacrylamide gel electrophoresis of purified ACE2 (Fc-tagged) is shown, and its molecular sizes are highlighted with red arrow, alongside protein standards. (B) Molecular weight analysis of Fc-tagged ACE2 by size exclusion chromatography – multiple angle light scattering. The measured molecular weight (kDa) is 193.6 (±7.9%) for ACE2. (C) Interactions between ACE2 and RBD represented by the binding curves obtained from enzyme-linked immunosorbent assay experiments as described in 'Materials and methods'. Testing of ACE2 was performed by adding ACE2 at varying concentrations to a maxisorp plate coated with 100 µL of 27.2 nM RBD.
Figure 5—figure supplement 2

Pepsin digest map and sequence coverage of angiotensin-converting enzyme 2 (ACE2).
(A) Coverage map showing 146 peptides (pink horizontal bars) covering ~80% sequence of ACE2 (18–615). Sequence of Fc-tag is not shown. Glycosylation sites are represented by green asterisks.
-
Figure 5—figure supplement 2—source data 1
Relative fractional deuterium uptake values for pepsin digest fragments of angiotensin-converting enzyme 2 (ACE2) at indicated labeling times.
- https://cdn.elifesciences.org/articles/63646/elife-63646-fig5-figsupp2-data1-v2.xlsx
-
Figure 5—figure supplement 2—source data 2
Differences in deuterium exchange between spike (S):angiotensin-converting enzyme 2 (ACE2) complex minus receptor binding domain (RBD)isolated:ACE2 complex for peptides of ACE2 at indicated labeling times.
- https://cdn.elifesciences.org/articles/63646/elife-63646-fig5-figsupp2-data2-v2.xlsx
Figure 5—figure supplement 3
Deuterium uptake profile for angiotensin-converting enzyme 2 (ACE2) receptor and all-atom molecular dynamics (MD) simulation of the ACE2-B0AT1 complex.
(A) Relative fractional deuterium uptake values of pepsin proteolyzed peptides listed in N- to C-terminus of ACE2 (peptides 18–615) for deuterium labeling times. Peptides are grouped into clusters for ease of display and are listed in source data (Figure 5—figure supplement 2—source data 1). (B) Differences in deuterium exchange (Y-axis) for ACE2 peptides listed from N- to C-terminus (X-axis) between S:ACE2 complex and receptor binding domain (RBD)isolated:ACE2 complex. Deuterium exchange significance threshold of ±0.3 D is indicated in red and standard errors in gray (within ±0.3 D) and are tabulated in source data (Figure 5—figure supplement 2—source data 2). (C) The first principal motion of all backbone atoms of the ACE2 monomer as determined by principal component analysis. (D) The root mean square fluctuation (RMSF) values of the ACE2 receptor mapped onto the surface of the ACE2. TM: transmembrane domain.
Tables
Key resources table
| Reagent type (species) or resource | Designation | Source or reference | Identifiers | Additional information |
|---|---|---|---|---|
| Gene (SARS-CoV-2) | pTT5 expression vector | GenBank | QHD43416.1 | For recombinant S protein |
| Gene (ACE2) | pHL-sec expression vector | GenBank | AB046569.1 | For recombinant ACE2 protein |
| Cell line (Homo sapiens) | Human embryonic kidney (HEK293-6E) | NRC, Canada | RRID:CVCL_HF20 | |
| Cell line (Homo sapiens) | Expi293F | Thermo Fisher Scientific | RRID:CVCL_D615 | |
| Antibody | Anti-human IgG Fc HRHorseradish Peroxidase (HRP)(goat polyclonal) | Thermo Scientific | RRID:AB_2536544 | WB (1:5000) |
| Recombinant DNA reagent | pHLmMBP-10 (plasmid) | Addgene, USA | RRID:Addgene_72348 | For recombinant RBD protein |
| Recombinant DNA reagent | pTT5 expression vector (plasmid) | Addgene, USA | RRID:Addgene_52367 | |
| Recombinant DNA reagent | pHL-sec expression vector (plasmid) | Addgene, USA | RRID:Addgene_99845 | recombinant DNA reagent |
| Chemical compound, drug | 3,3′,5,5′-Tetramethylbenzidine | Sigma Aldrich | RRID:AB_2336758 | |
| Chemical compound, drug | Deuterium oxide (chemical) | Cambridge Isotope Laboratories | CAS# 7789-20-0 | Deuterium exchange experiments |
| Software, algorithm | DynamX | Waters Corporation (Milford, MA) | Version 3.0 | |
| Software, algorithm | ProteinLynx Global Server (PLGS) | Waters Corporation (Milford, MA) | Version 3.0.1 | |
| Software, algorithm | GraphPad Prism software | GraphPad Prism (https://graphpad.com) | RRID:SCR_002798 | Version 5.0.0 |
| Software, algorithm | Modeller | 1989–2020 Andrej Sali | RRID:SCR_008395 | Version 9.21 |
| Software, algorithm | Visual molecular dynamics | University of Illinois at Urbana-Champaign | RRID:SCR_001820 | Version 1.9.3 |
Additional files
-
Supplementary file 1
Table S1. Deuterium exchange at indicated labeling times for S and S:ACE2 complex. Table S2. Deuterium exchange at indicated labeling times for RBDisolated and ACE2 bound RBDisolated. Table S3. Comparison of deuterium exchange of peptides common to RBD(isolated) and RBD(Spike) in free and ACE2-bound states at indicated labeling times. Table S4. Deuterium exchange at indicated labeling times for free ACE2 and its complexes with RBDisolated and S protein. Table S5. Comparison of deuterium exchange values for peptides common to biological replicates of S protein at 1 and 10 min labeling. Table S6. Comparison of deuterium exchange of peptides common between the two biological replicates of S and S:ACE2. Table S7. List of peptides of S with deuterium exchange for a fully deuterated state to determine deuterium back-exchange.
- https://cdn.elifesciences.org/articles/63646/elife-63646-supp1-v2.xlsx
-
Transparent reporting form
- https://cdn.elifesciences.org/articles/63646/elife-63646-transrepform-v2.docx
Download links
A two-part list of links to download the article, or parts of the article, in various formats.
Downloads (link to download the article as PDF)
Open citations (links to open the citations from this article in various online reference manager services)
Cite this article (links to download the citations from this article in formats compatible with various reference manager tools)
SARS-CoV-2 S protein:ACE2 interaction reveals novel allosteric targets
eLife 10:e63646.
https://doi.org/10.7554/eLife.63646


